Article

The Assimilation Effect of Multi-New Types Observation Data in the Forecasts of Meiyu-Front Rainstorm

1
Nanjing Luhe Meteorology Bureau, Nanjing 211599, China
2
State Key Laboratory of Severe Weather, Chinese Academy of Meteorological Sciences, Beijing 100081, China
3
Key Laboratory of Transportation Meteorology, China Meteorological Administration, Nanjing 210041, China
4
Nanjing Meteorology Bureau, Nanjing 210019, China
5
Jiangsu Meteorological Observation Center, Nanjing 210041, China
6
Key Laboratory of Atmosphere Sounding, China Meteorological Administration, Chengdu 610225, China
*
Author to whom correspondence should be addressed.
Atmosphere 2023, 14(4), 693; https://doi.org/10.3390/atmos14040693
Submission received: 27 February 2023 / Revised: 3 April 2023 / Accepted: 3 April 2023 / Published: 7 April 2023

Abstract

:
Meiyu-front rainstorm is one of the main disastrous weather events in summer in East China. In this study, seven assimilation experiments of multi-type observation data such as wind profile data, microwave radiometer data and radiosonde sounding data are designed to forecast the Meiyu-front rainstorm on 15 June 2020. The results show that the seven experiments can basically simulate the orientation of rain belt. The comprehensive experiment which assimilates all types of observations performs the best in simulating the location of heavy rainstorm and shows good performance in simulating the precipitation above moderate rain. For the comprehensive experiment, the forecast deviation of rainstorm and heavy rainstorm is small, and the equitable threat score has also been greatly improved compared with other experiments. It is found that the convective available potential energy is enhanced after the assimilation of surface observation data. In addition, the wind convergence and water vapor transportation are modified after assimilating wind profile data. Accordingly, the precipitation efficiency is improved in the comprehensive experiment. The profiles of pseudo-equivalent potential temperature, vorticity and divergence show that, the assimilation of new-types observation data from wind profiler radar and microwave radiometer increases the instability of atmospheric stratification and enhances the ascending motion in the heavy precipitation center. The above results show that the introduction of various some new-type data before the numerical simulation can reduce the forecast deviation. In addition, the combined assimilation of microwave radiometer and sounding data presents better performance than single data assimilation, which indicates that data mutual complementation is essential to improving forecast accuracy.

1. Introduction

With climate warming, extreme weather events occurred more frequently in recent years, and the catastrophability of rainstorm and short-term heavy precipitation has strengthened. Extreme rainstorm events have become one of the research hotspots in meteorology. Meiyu-front rainstorm is one of the main meteorological disasters in summer in East China. It is featured by long duration, wide influence range and strong suddenness. Due to the poor performance of numerical models in Meiyu-front rainstorm forecast and the inadequate understanding on the related mechanisms, forecasting the falling area and intensity of Meiyu-front rainstorm has always been a difficult problem in operational weather forecasts.
In the past few decades, many scholars have studied the Meiyu-front rainstorm from different aspects, such as the dynamical-thermal structures [1,2,3], the maintenance mechanisms [4,5] and the vortices on the Meiyu front [6]. With the rapid development of numerical simulation, scholars have studied the effects of model topography, microphysical processes and boundary layer schemes on the evolution of Meiyu front [7,8,9], and used the simulation results to conduct the fine-resolution diagnostic analysis of Meiyu-front rainstorm.
However, for the mesoscale convective systems embedded in the Meiyu front, numerical models sometimes cannot accurately simulate their evolution process. One reason is the inaccurate initial fields, which can be improved through data assimilation. Data assimilation can combine observational data with model prediction and establish a mutually compatible and optimized relationship between model and data, thus minimizing the analysis error and obtaining the optimal initial fields [10,11]. Zhang et al. [12,13] used the variational assimilation method to assimilate the hourly surface precipitation observation data into the numerical model, and studied the heavy rainstorm during the Meiyu period. They found that the variational assimilation of precipitation data has an important influence on the initial fields of mesoscale model and can improve the accuracy of precipitation forecast. Chen et al. [14] confirmed that assimilating surface observation data is of great significance to the improvement of model simulation results. Sun et al. [15] pointed out that directly assimilating radar radial wind and reflectivity can improve the prediction on the location and intensity of rainstorm center, and assimilating radial wind can weaken the unreal convective activity, thereby reducing excessive precipitation. Xu et al. [16] assimilated a variety of satellite radiance data, and reasonably improved the simulation of a heavy rainstorm process. Wagner et al. [17] used the WRF (weather research and forecasting) model to assimilate ground observation data and global navigation satellite system data, and found that the joint assimilation of the two data can remarkably affect the water vapor budget of the weather system.
Many of the past studies on Meiyu-front rainstorm have assimilated single type of data, but the assimilation of single data often cannot accurately describe the evolution of weather systems. To improve the forecast accuracy, the initial fields of the model should absorb the actual atmospheric information as much as possible. At present, China has deployed a lot of new detection equipment, such as wind profiler radars and microwave radiometers. Won et al. [18] summarized the application of microwave radiometer data in precipitation evaluation. He et al. [19] demonstrated that the addition of microwave radiometer data was beneficial to improving the precipitation forecast skill of numerical models. Ishihara et al. [20] found that the assimilation of wind profiler radar data had positive significance for improving the numerical prediction of precipitation above 30 mm/h. Huo et al. [21] pointed out that the retrieval of atmospheric temperature advection by using boundary layer wind profiler radar data can help analyze the change of atmospheric temperature advection before and after the precipitation process. The intensity, thickness and height variation characteristics of warm and cold advections in the upper and lower layers are highly correlated with the evolution of precipitation process. Liu et al. [22] assimilated wind profile data to forecast an extreme precipitation event and found that the wind speed error can be reduced by about 30% after assimilating all wind profiler radar observations. The above studies show that the introduction of new observation data is helpful to forecast severe weather and improve the nowcasting.
At present, many new-type observation instruments are deployed in Nanjing, but the application of these multi-type detection data in rainstorm is still weak. Meiyu-front rainstorms are one of the common disastrous weather conditions in Nanjing area, and there are few studies on the joint assimilation of multi-source detection data for Meiyu-front rainstorm in Nanjing area. From 14 to 15 June 2020, an extreme Meiyu-front rainstorm process occurred in Nanjing, Jiangsu Province, China. In this case, the rainfall intensity of many stations has broken the historical records. In addition, we find that the operational forecast effect of this case was poor. Therefore, it is of great significance to study and discuss the assimilation effect of the multi new-type data in this Meiyu-front rainstorm case.
In this study, the mesoscale model WRF is used to simulate an extreme Meiyu-front rainstorm process in Nanjing of China from 14 to 15 June 2020. Then, the effect of multi-type and some new-type data on Meiyu-front rainstorm forecast is analyzed, and the application potential of new-type data in extreme heavy rainfall forecast is discussed. The remainder of this paper is organized as follows. Section 2 presents the overview of the Meiyu-from rainstorm case and the experimental design. Section 3 shows the verification of simulation results and analyzes the assimilation effect. In Section 4, we summarize the whole text and present a brief discussion.

2. Case Overview and Experimental Design
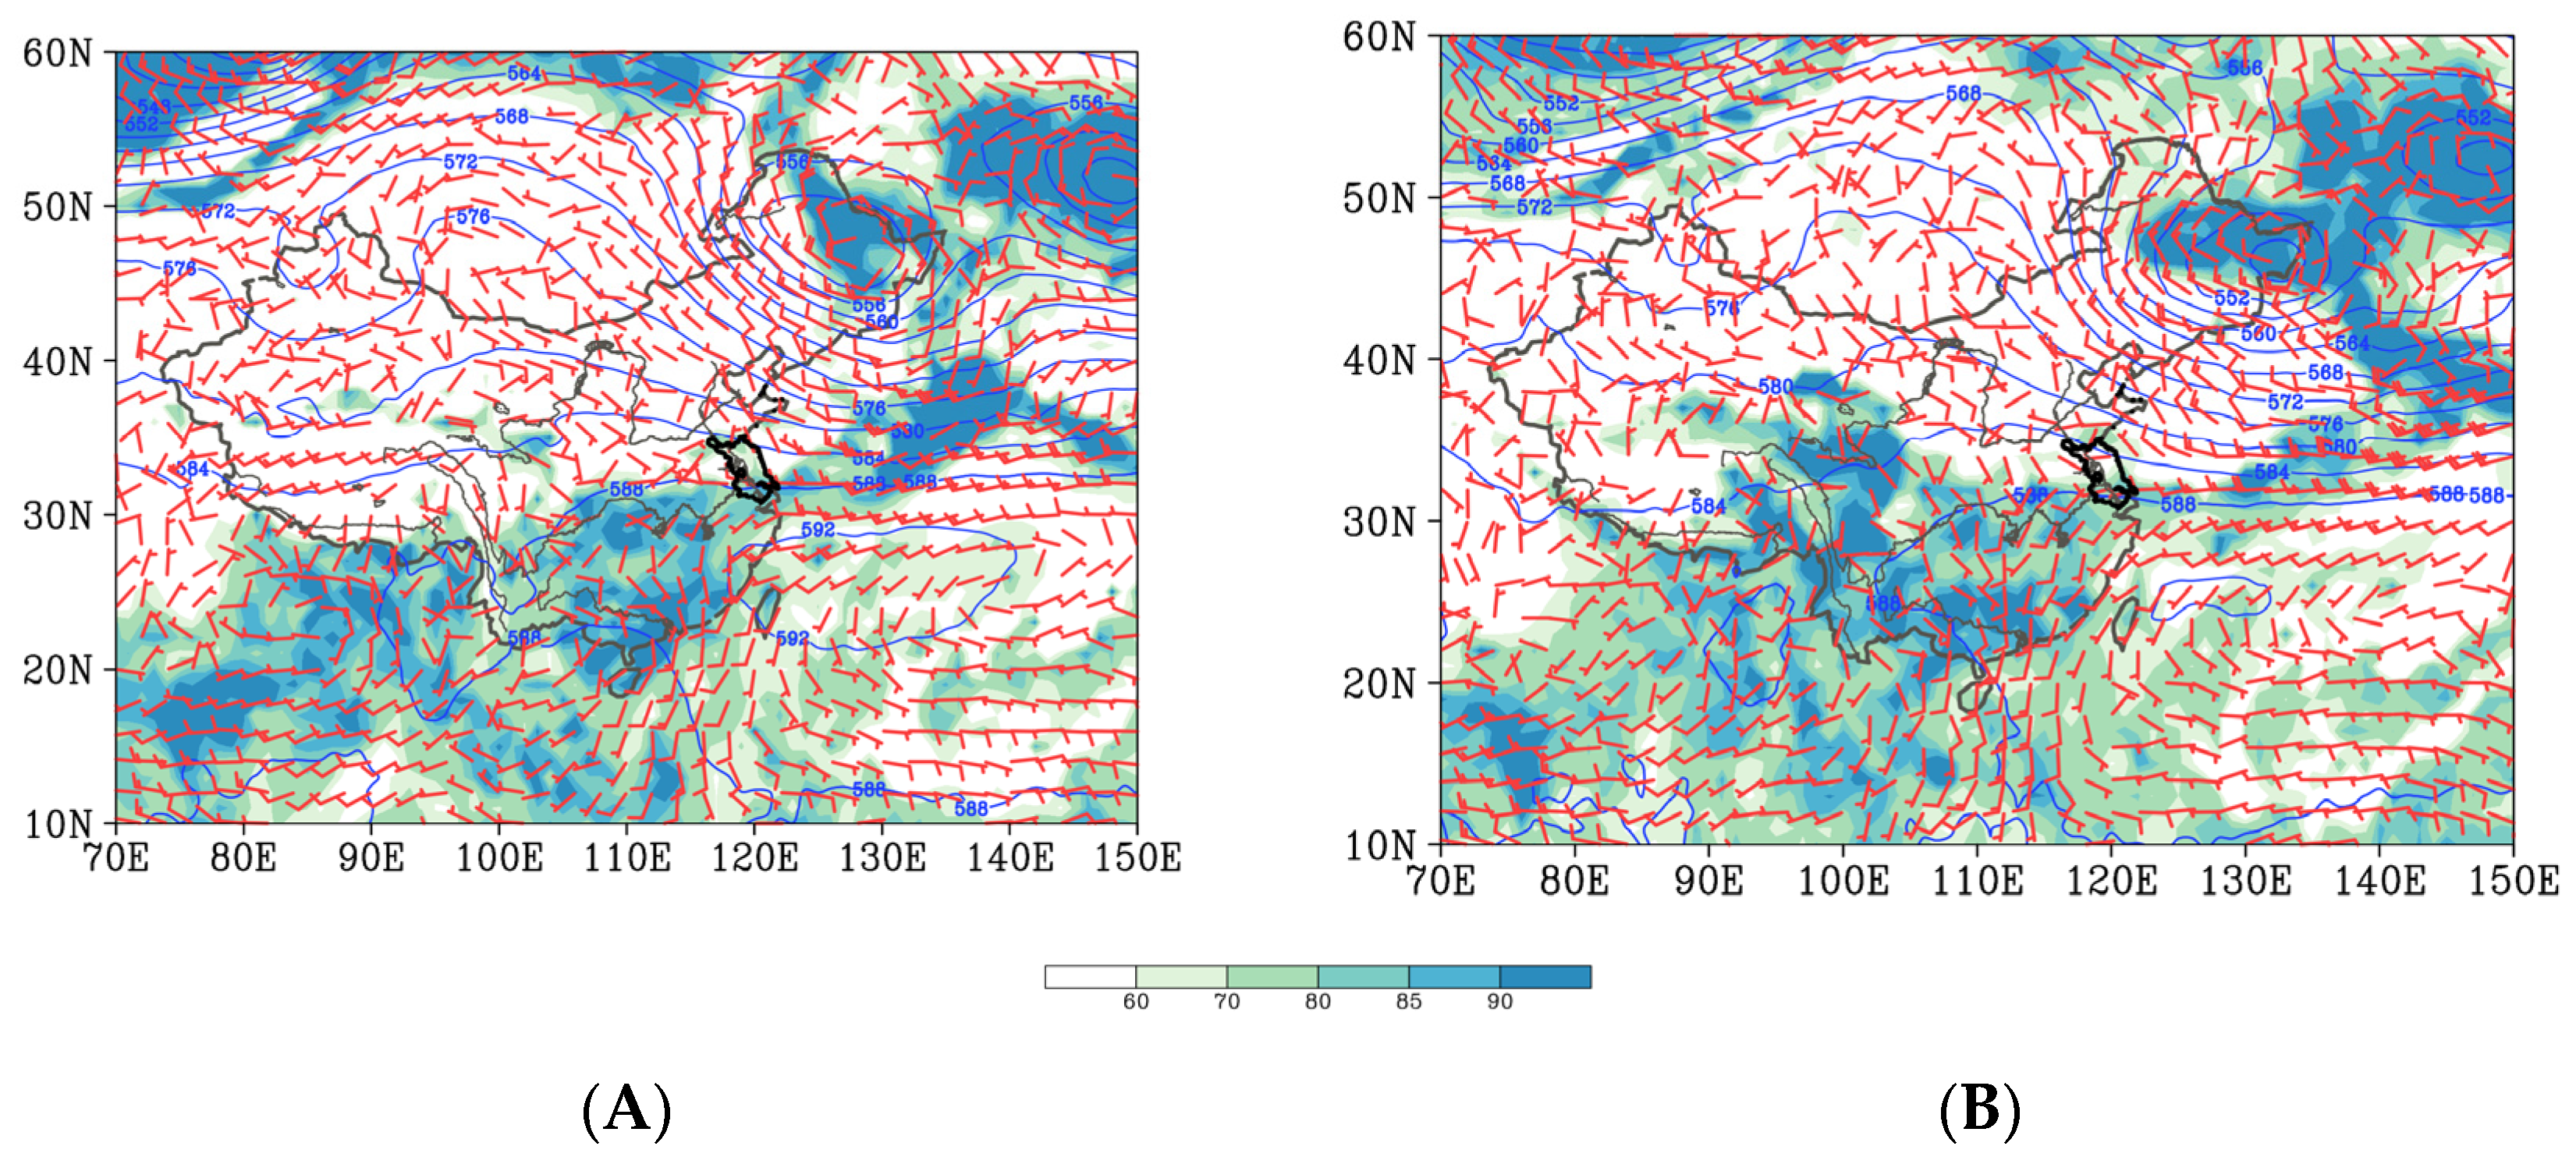
2.1. Case Overview

Affected by the Meiyu front, from 20:00 BJT (Beijing Time) on 14 June to 20:00 BJT on 15 June 2020 a heavy rainstorm process occurred in the south of Jiangsu Province in China, which is the most typical rainstorm event in China in 2020. The heavy precipitation center was located in Nanjing City, the capital of Jiangsu Province. This process was featured by centralized heavy rainfall period, strong short-term rainfall and large accumulated rainfall. The 24 h accumulated rainfall reached the level of rainstorm, heavy rainstorm and extreme rainstorm in 63 stations, 29 stations and 1 station (271.2 mm), respectively. The strongest rainfall was concentrated in 07:00 BJT to 11:00 BJT on 15 June, and the maximum hourly rainfall reached 78.3 mm (09:00–10:00 BJT). At one of the regional stations, the hourly rainfall was more than 70 mm for 3 consecutive hours from 07:00 BJT to 10:00 BJT, and the accumulated rainfall in 3 h was as high as 221.2 mm, which breaks the historical records of daily rainfall since the station was built. This heavy rainstorm process caused flash floods, flooded houses and local landslides, and hundreds of residents were urgently transferred. The maximum water depth in in residential houses is up to 1 m. The social–economic impact of this rainstorm case is huge.
Figure 1 shows the 500 hPa geopotential height and 850 hPa wind and humidity in this heavy rainstorm process. As can be seen, at 500 hPa at 14:00 BJT on 14 June, there were two troughs and one ridge at middle-high latitudes. The western trough was located in the northern part of Xinjiang, China. The high-pressure ridge extended to Lake Baikal. A cold vortex in the east of the ridge moved slowly eastward. The subtropical high was strong and controlled the southern China, with its northern edge in southern Jiangsu Province. At the same time, the northerly airflow in the rear of the cold vortex moved southward, and a shear line appeared in Anhui and Jiangsu Provinces (near 30° N) at 850 hPa. In short, the synoptic situation at 14:00 BJT on June 14 was conducive to the occurrence of heavy precipitation. At 08:00 BJT on 15 June, there were still two troughs and one ridge at middle-high latitudes, and the subtropical high retreated southward. The southern Jiangsu along the Yangtze River was located in the periphery of the subtropical high. The southwesterly airflow steered the warm-humid airflow to the east, and the low-level humidity increased significantly, which was conducive to the development of heavy rainstorm.

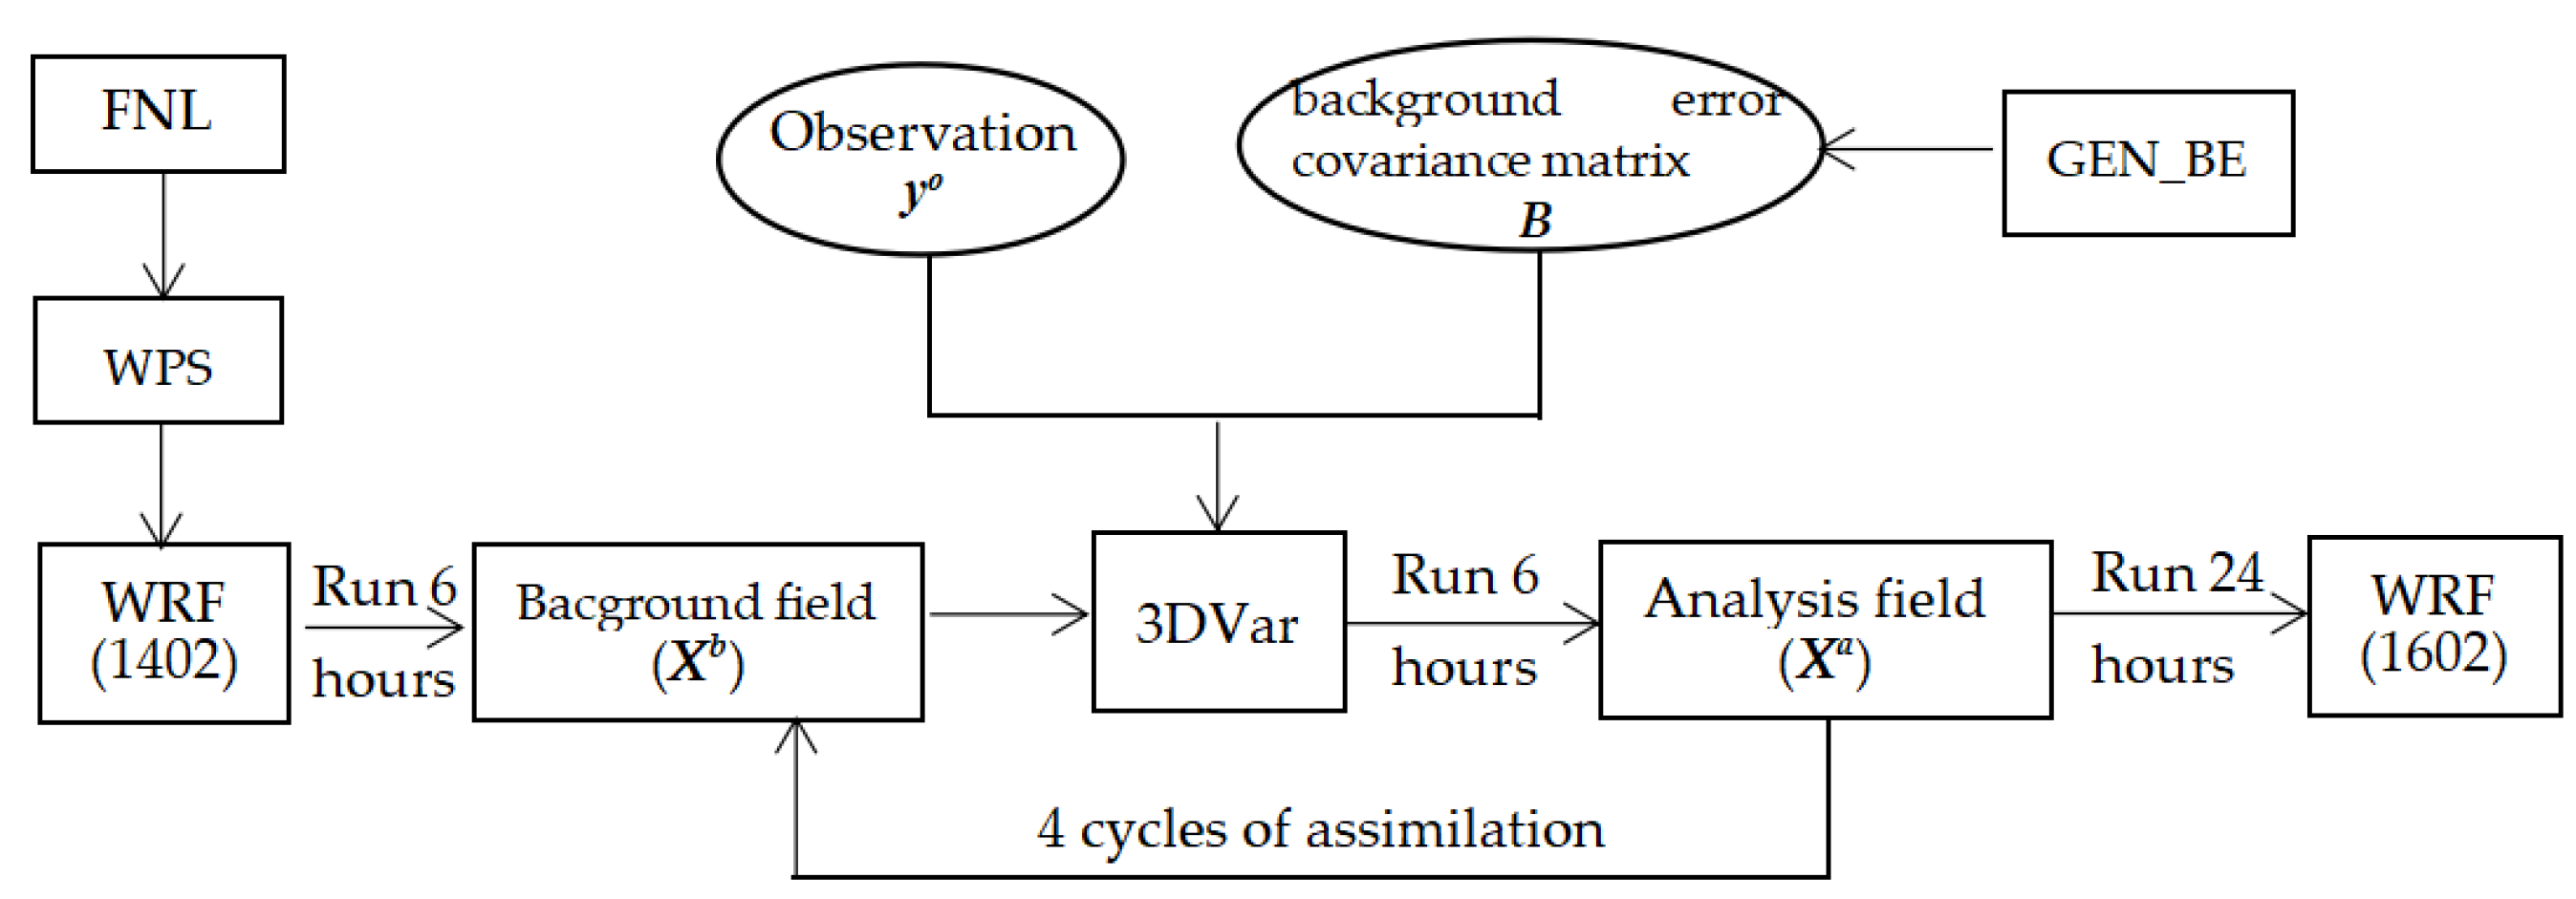
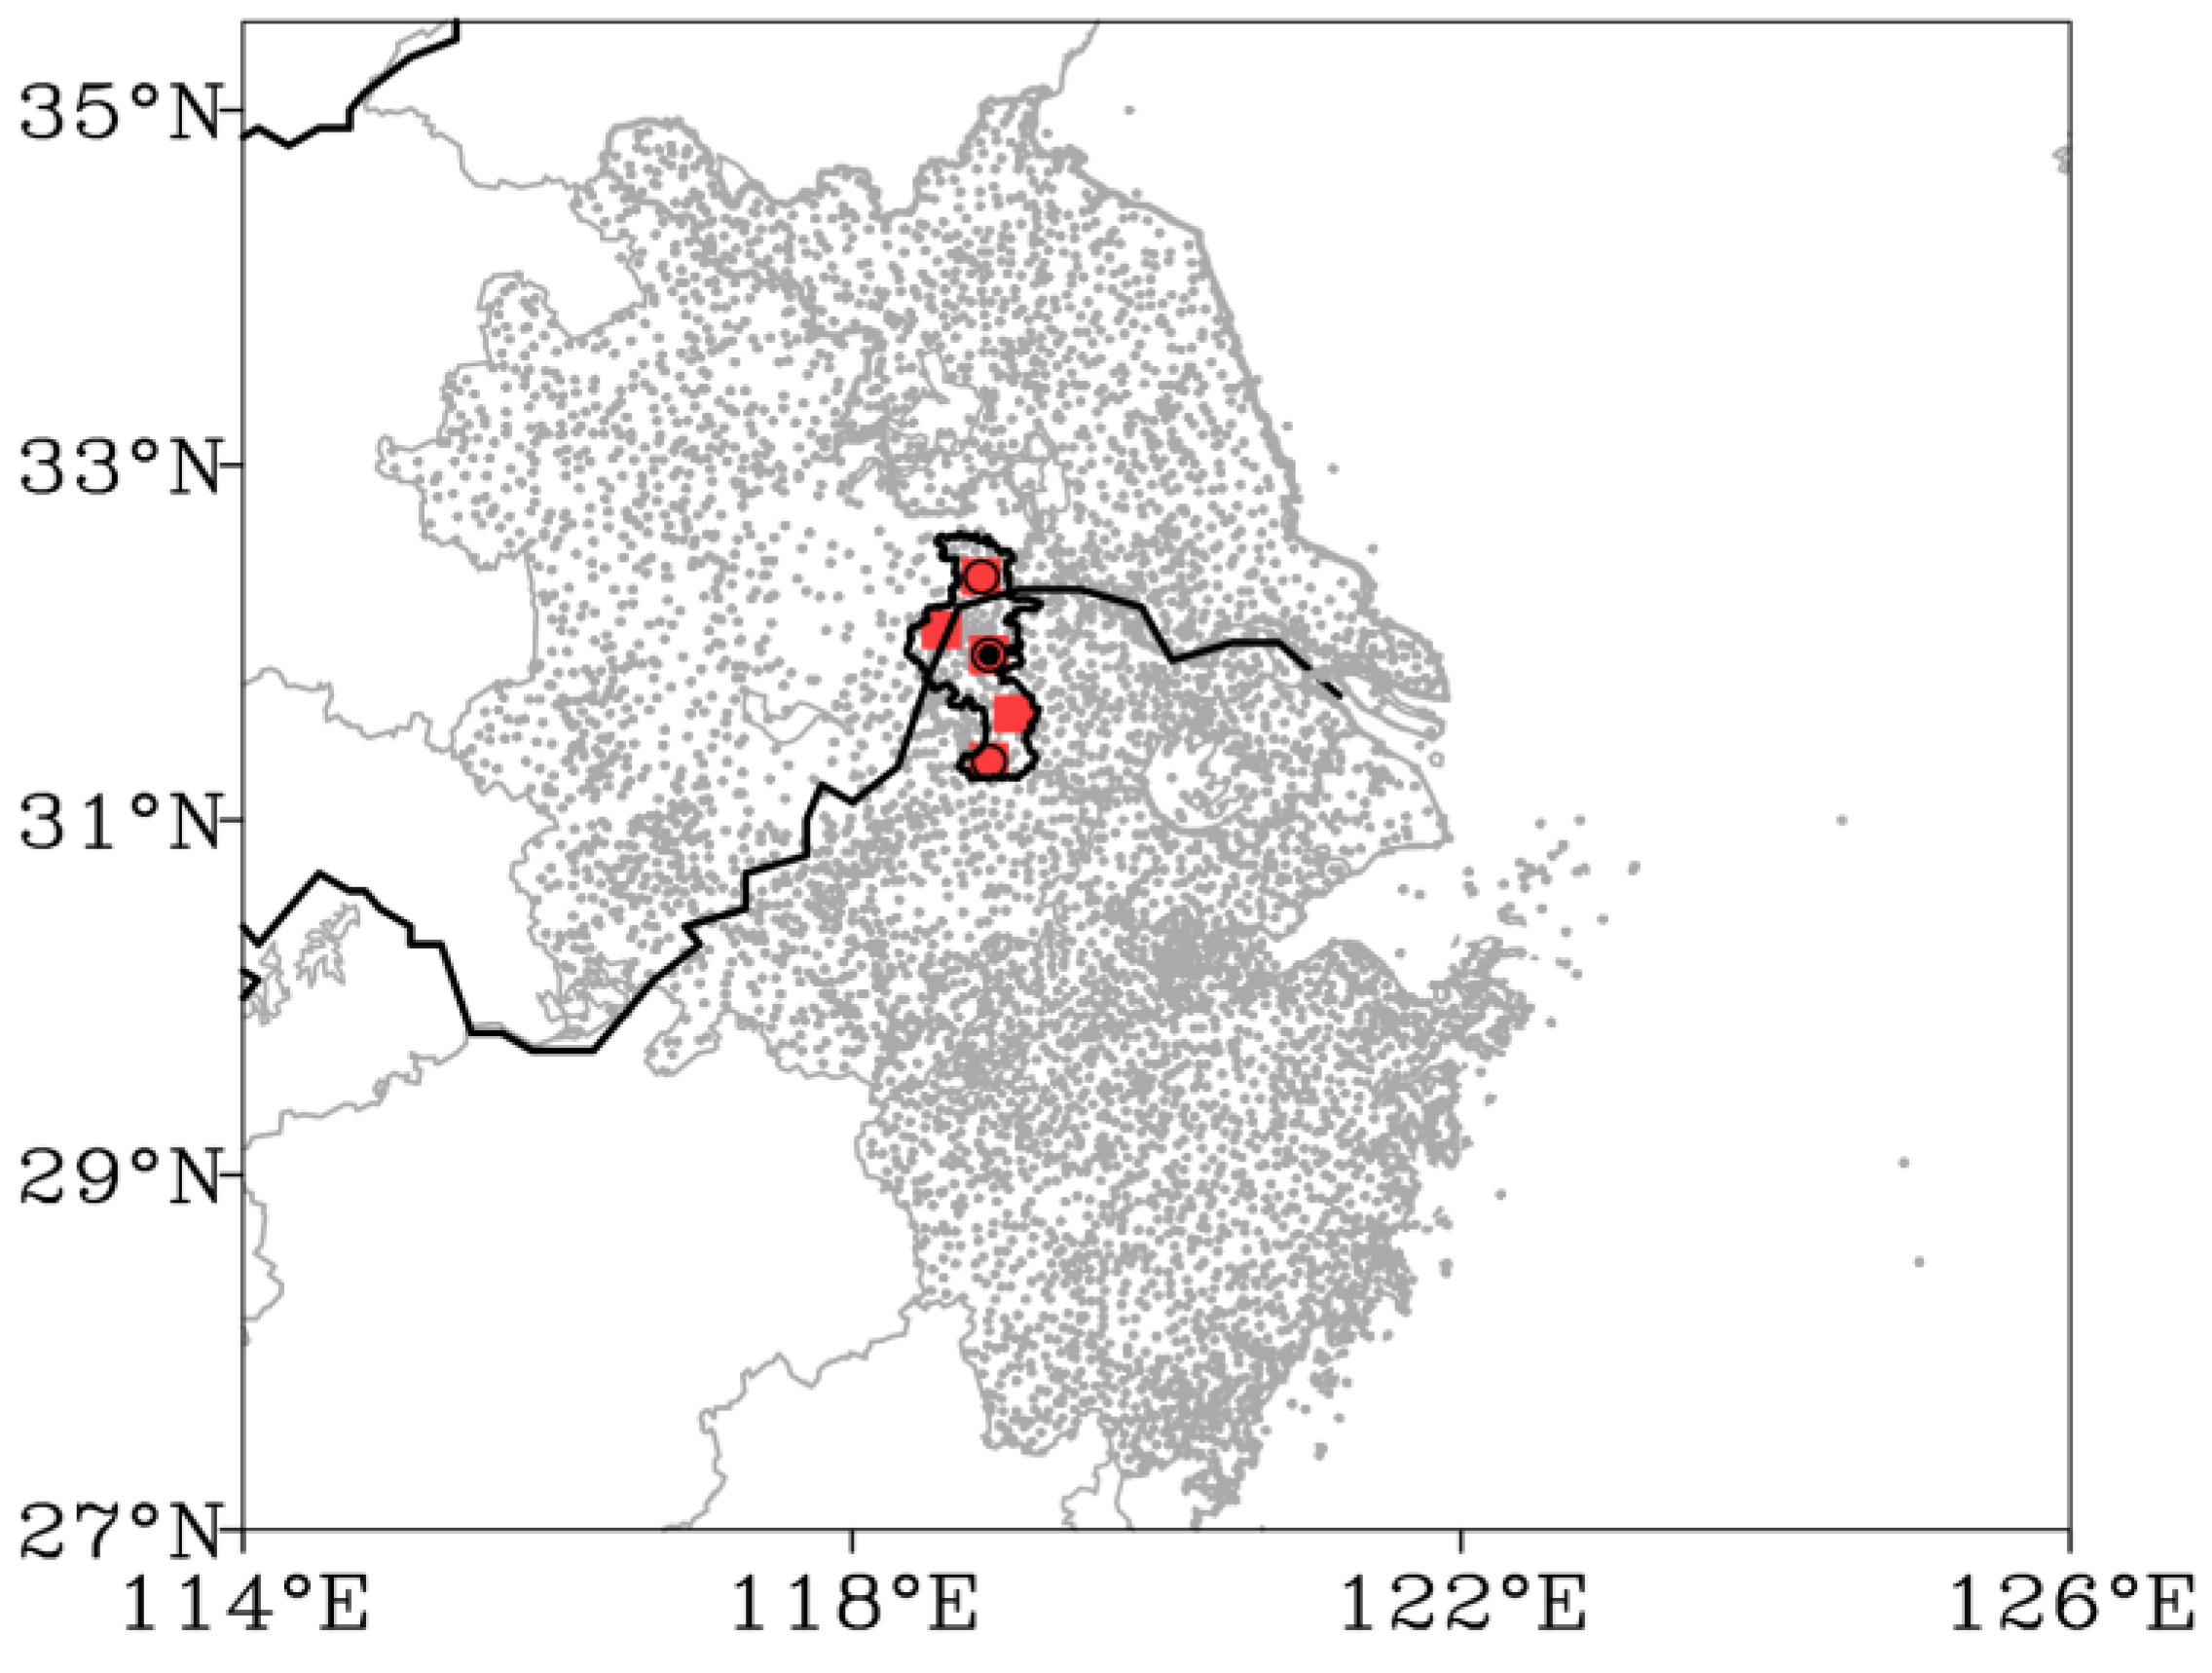
2.2. Model Setup and Experimental Design

In this study, the WRF (V3.9) model is used. The model simulation has two domains, and the corresponding grid intervals are 27 km and 9 km, respectively. Some studies have found that improving model resolution can enhance the prediction effect [23,24,25]. In this study, in order to better understand the occurrence and development of the weather system, we analyzed the simulation results of 9 km.
The simulation period is 48 h from 02:00 BJT on 14 June to 02:00 BJT on 16 June 2020, with the first 6 h being the model spin-up time. The domain center is at 32° N and 116° E. The number of grid points is 100 × 75 and 160 × 103 in the outer domain and inner domain, respectively. There are 33 layers in the vertical direction. The physical parameterization scheme is set as CONUS. The “CONUS” scheme is a set of parameterization schemes developed by the WRF team for the northern hemisphere continent, which has a good prediction effect on severe convective weather [26,27,28]. The specific information of this scheme can be seen in Table 1. The output of the inner domain is selected to conduct the analysis. The 1° × 1° Final Reanalysis Data (FNL) from National Centers for Environmental Prediction (NCEP) global analysis data with 6 h interval are used to drive the model.
In this study, the Meiyu-front rainstorm is simulated without assimilating any observation data, which is called the control experiment. Subsequently, the cyclic assimilation experiments are carried out for different types of observation data using WRF-3DVar (three-dimensional variational) assimilation system, and the experimental process is shown in Figure 2. Firstly, the model is integrated from 02:00 BJT to 08:00 BJT on 14 June, and the forecast field from WRF model is used as the background field Xb. Various types of meteorological observation data are assimilated every 6 h, and yo represents the observation. The analysis field Xa after 3DVar is used as the background field, and Xb is for the next time. The assimilation period is from 08:00 BJT on 14 June to 02:00 BJT on 15 June, and data assimilation is conducted 4 times. Finally, the model is integrated from 02:00 BJT on 15 June to 02: 00 BJT on 16 June.
At present, many new-type observation instruments are deployed in Nanjing. In this study, the conventional surface observation data is assimilated. In addition, the data from five wind profiler radars, three microwave radiometers and the radiosonde sounding at Nanjing station are also assimilated. These data are pre-processed by simple quality control before entering the model, and the obviously wrong data are eliminated. The site distribution of various data is shown in Figure 3.
In order to better understand the assimilation effects of different observation data, we designed 7 experiments (Table 2).

2.3. Data Quality Control

Quality controls for wind profiler radar data, microwave radiometer data and sounding data have been done before data assimilation. The EOF quality control method [29] is applied for wind profile. This method can decompose the data into reconstructed field and residual field. The reconstructed field contains the main spatial and temporal change information of the data, and the residual field is composed of small-scale space and time information. The observation error is random and belongs to small-scale information, so it mainly appears in the residual field. Then, the Bi-weight quality control is used for O–B (observation minus background) of residual field, which can effectively identify suspicious data. The quality control of microwave radiometer and sounding data includes climatological check, time consistency check and vertical consistency check. In the climatological check, we remove the data exceeding the climate extreme range. In the time and vertical consistency check, we remove data with time change and vertical change exceeding the given values.

3. Simulation Result Verification and Assimilation Effect Analysis

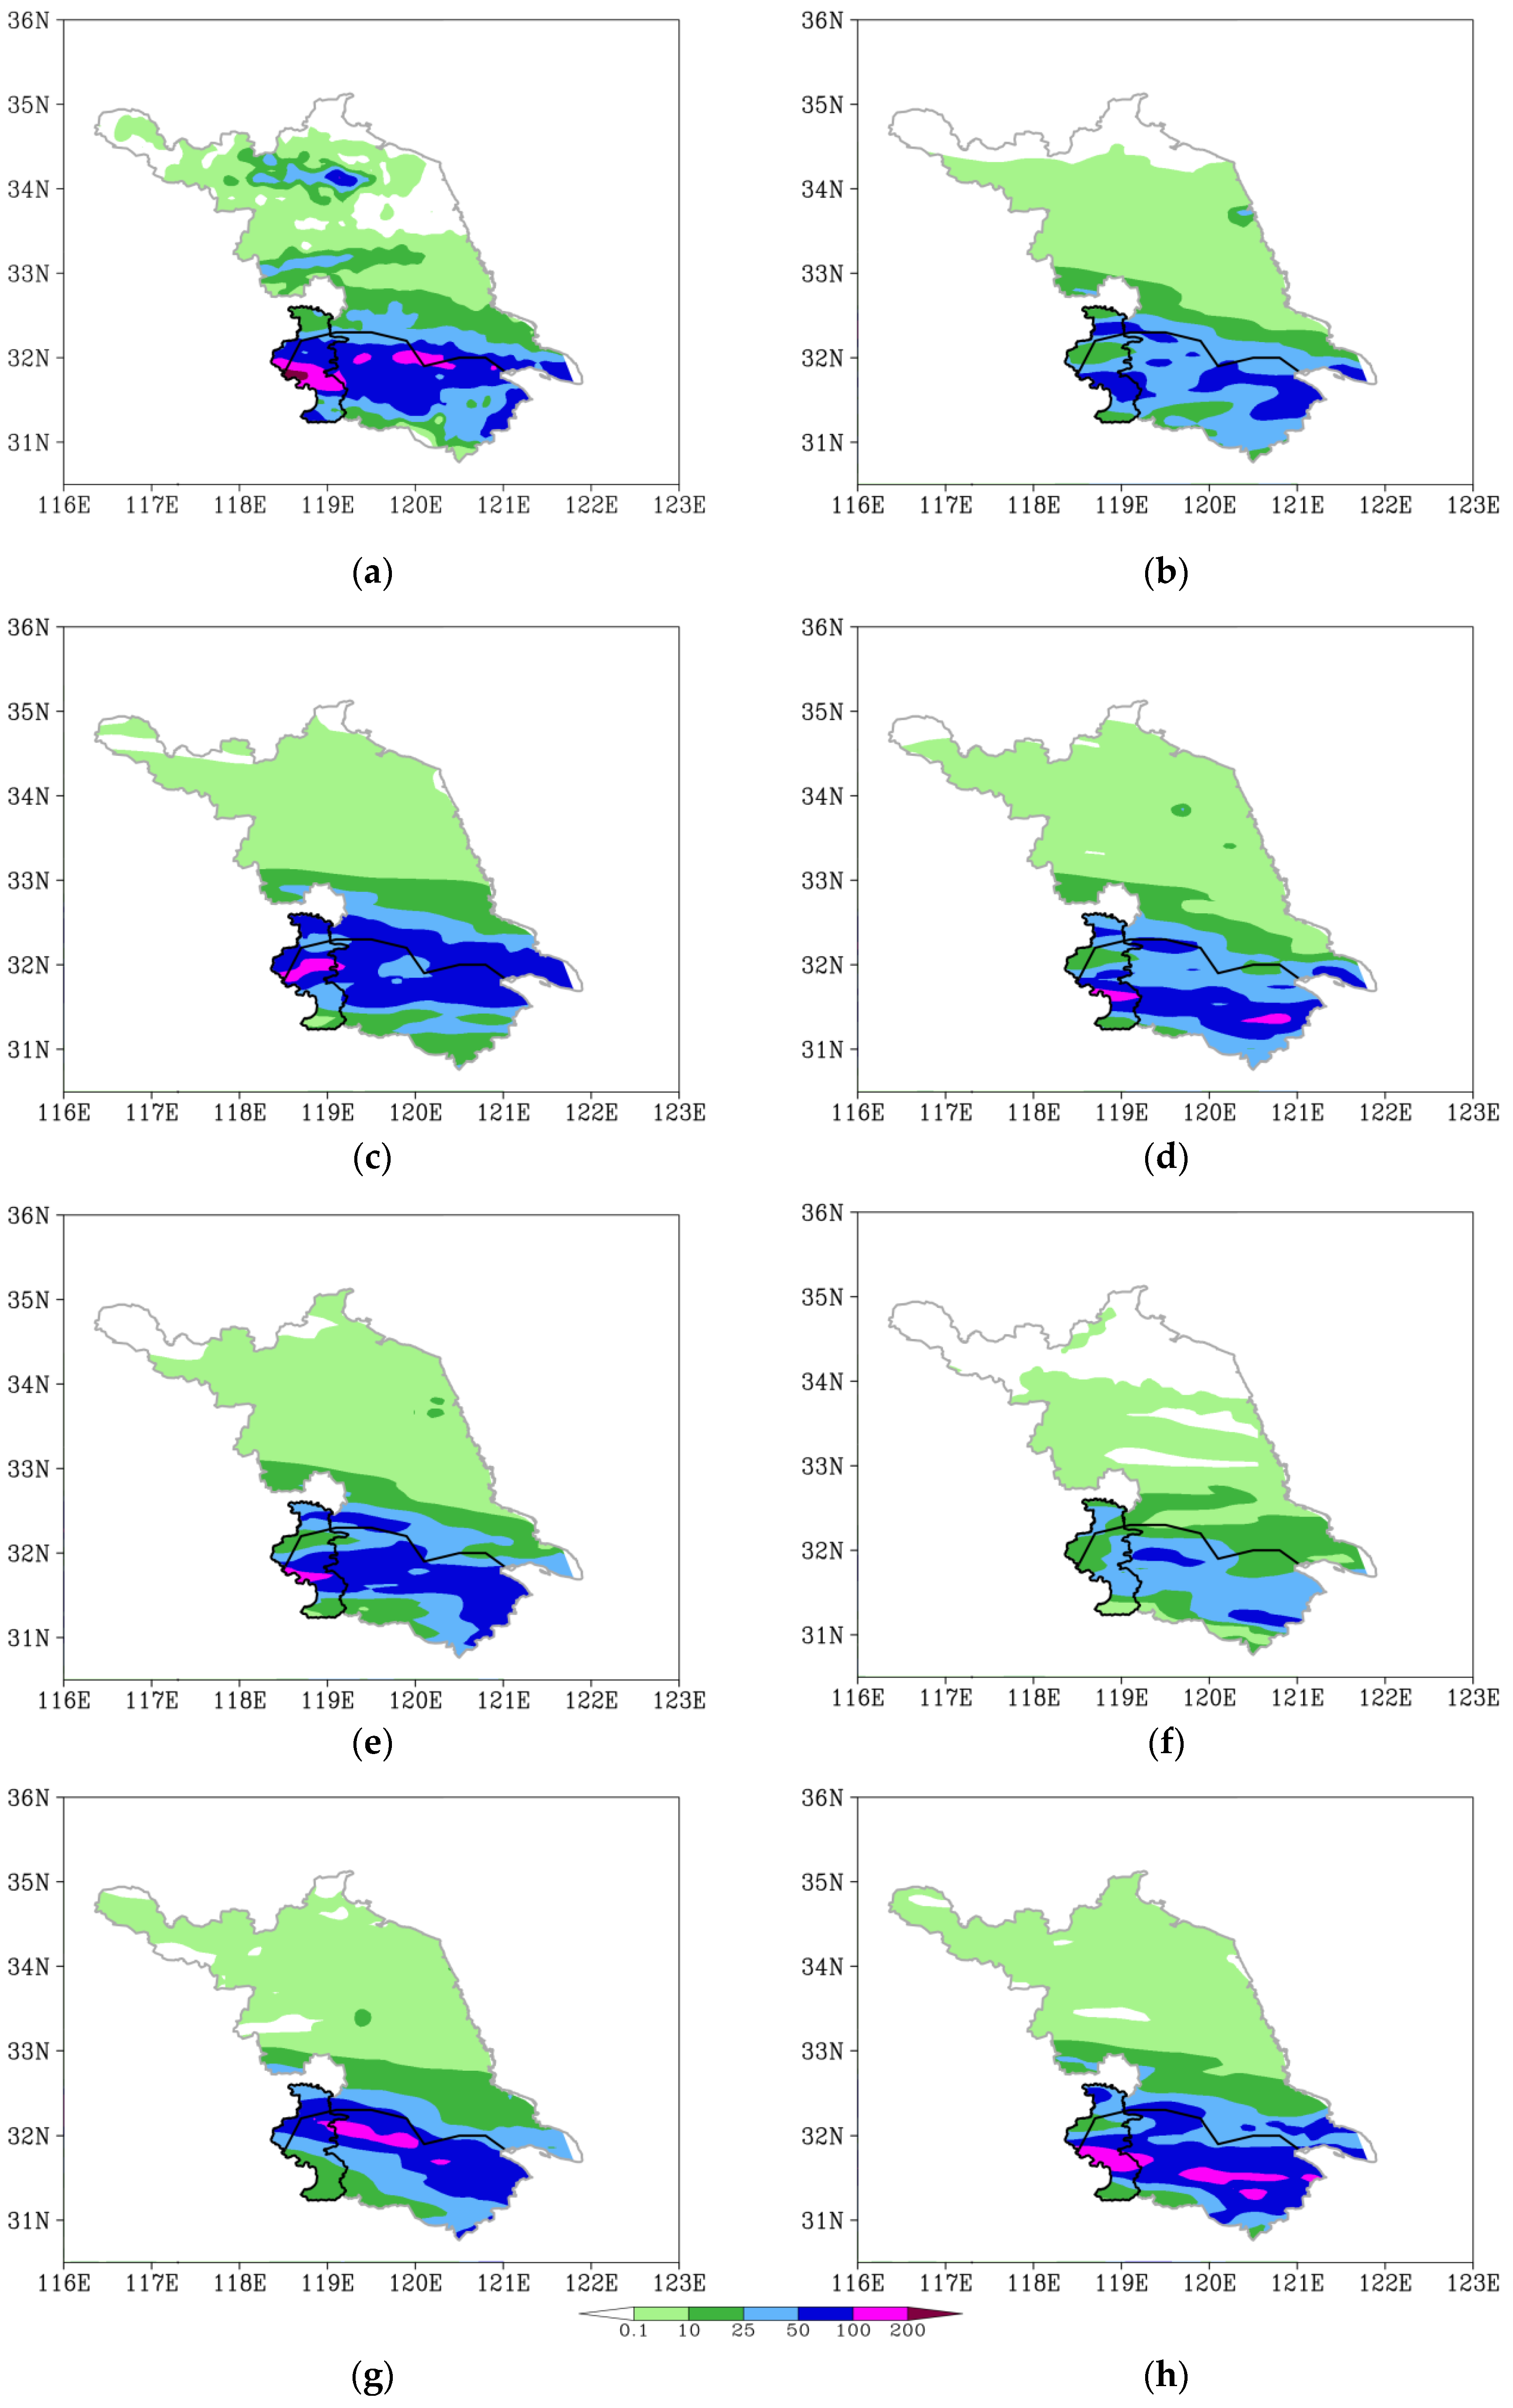
3.1. Simulation Result Verification

Figure 4 shows the distributions of observed and simulated 24 h accumulated precipitation from 02:00 BJT on 15 June to 02:00 BJT on 16 June in Jiangsu Province. The observation shows that the rainstorm area is mainly along the Yangtze River (Figure 4a). There are two heavy rainstorm centers embedded in the rainfall belt. One is located in central-southern Nanjing, and we call it the western precipitation center. The other is centered at 32° N, 120° E where the Yangtze River bends, and we call it the eastern precipitation center. The control experiment (Figure 4b) can well simulate the orientation of the rain belt, but the magnitude of rainfall is obviously underestimated.
The ground observation data provide lots of surface information such as temperature, pressure, humidity and wind, in Jiangsu and its upper reaches before the precipitation. The surface data after assimilated in the model (the SURF experiment) can enlarge the range of the rainstorm area and reproduce the heavy rainstorm area in western precipitation center, but the location is slightly northerly and the range is smaller. Moreover, the SURF experiment fails to reproduce the eastern heavy rainstorm area (Figure 4c).
In the WNDR experiment (Figure 4d), the wind profile data can provide vertical wind direction and wind speed information, which can improve the dynamic conditions of the initial field. The location of the heavy rainstorm center is more accurate than in CTRL. However, since this study only uses the wind profile information of five stations, the western heavy rainstorm area is more southerly and its range is much smaller than the observation; the eastern heavy rainstorm area is more southeasterly and narrower.
The ground-based microwave radiometer data of five stations can provide continuous temperature and humidity profiles, which can improve the thermal conditions of the initial field and help simulate the center of heavy rain more accurately. The results of MR (Figure 4e) show that although the range of heavy rainstorm is still smaller than observation, but the range of rainstorm is enlarged compared with the SOUND experiment (Figure 4f).
The SOUND experiment only assimilates the sounding data from single station, and the effect is not ideal, with the rainfall level being seriously underestimated. Assimilating other types of data can simulate a large area of rainstorm, while assimilating sounding data can only simulate a large area of heavy rain. Its performance is much poorer than the CRTL. The forecast effect of MR is much better than that of SOUND, which shows the application potential of this new-type sounding data in numerical simulation. Microwave radiometer data can make up for the deficiency of sounding data in spatial distribution. After the joint assimilation of microwave radiometer data and radiosonde sounding data (MR_SOUND; Figure 4g), it can indeed expand the scope of the rainstorm area, but the overall rainstorm area moves northward, and there is a heavy rainstorm center.
The above experimental results show that the assimilation of each type of observation data has its advantages and disadvantages, and the comprehensive data contain more real atmospheric information from the ground to the upper air, which can improve the initial field more fully. The ALL experiment (Figure 4h) shows that it can simulate the location of heavy rainstorm in the western precipitation center well, and the falling area of rainstorm is also well reproduced, but the range is slightly larger. However, in the ALL experiment, another heavy rainstorm center is located in south Jiangsu, which is a little more southerly than the eastern precipitation center.

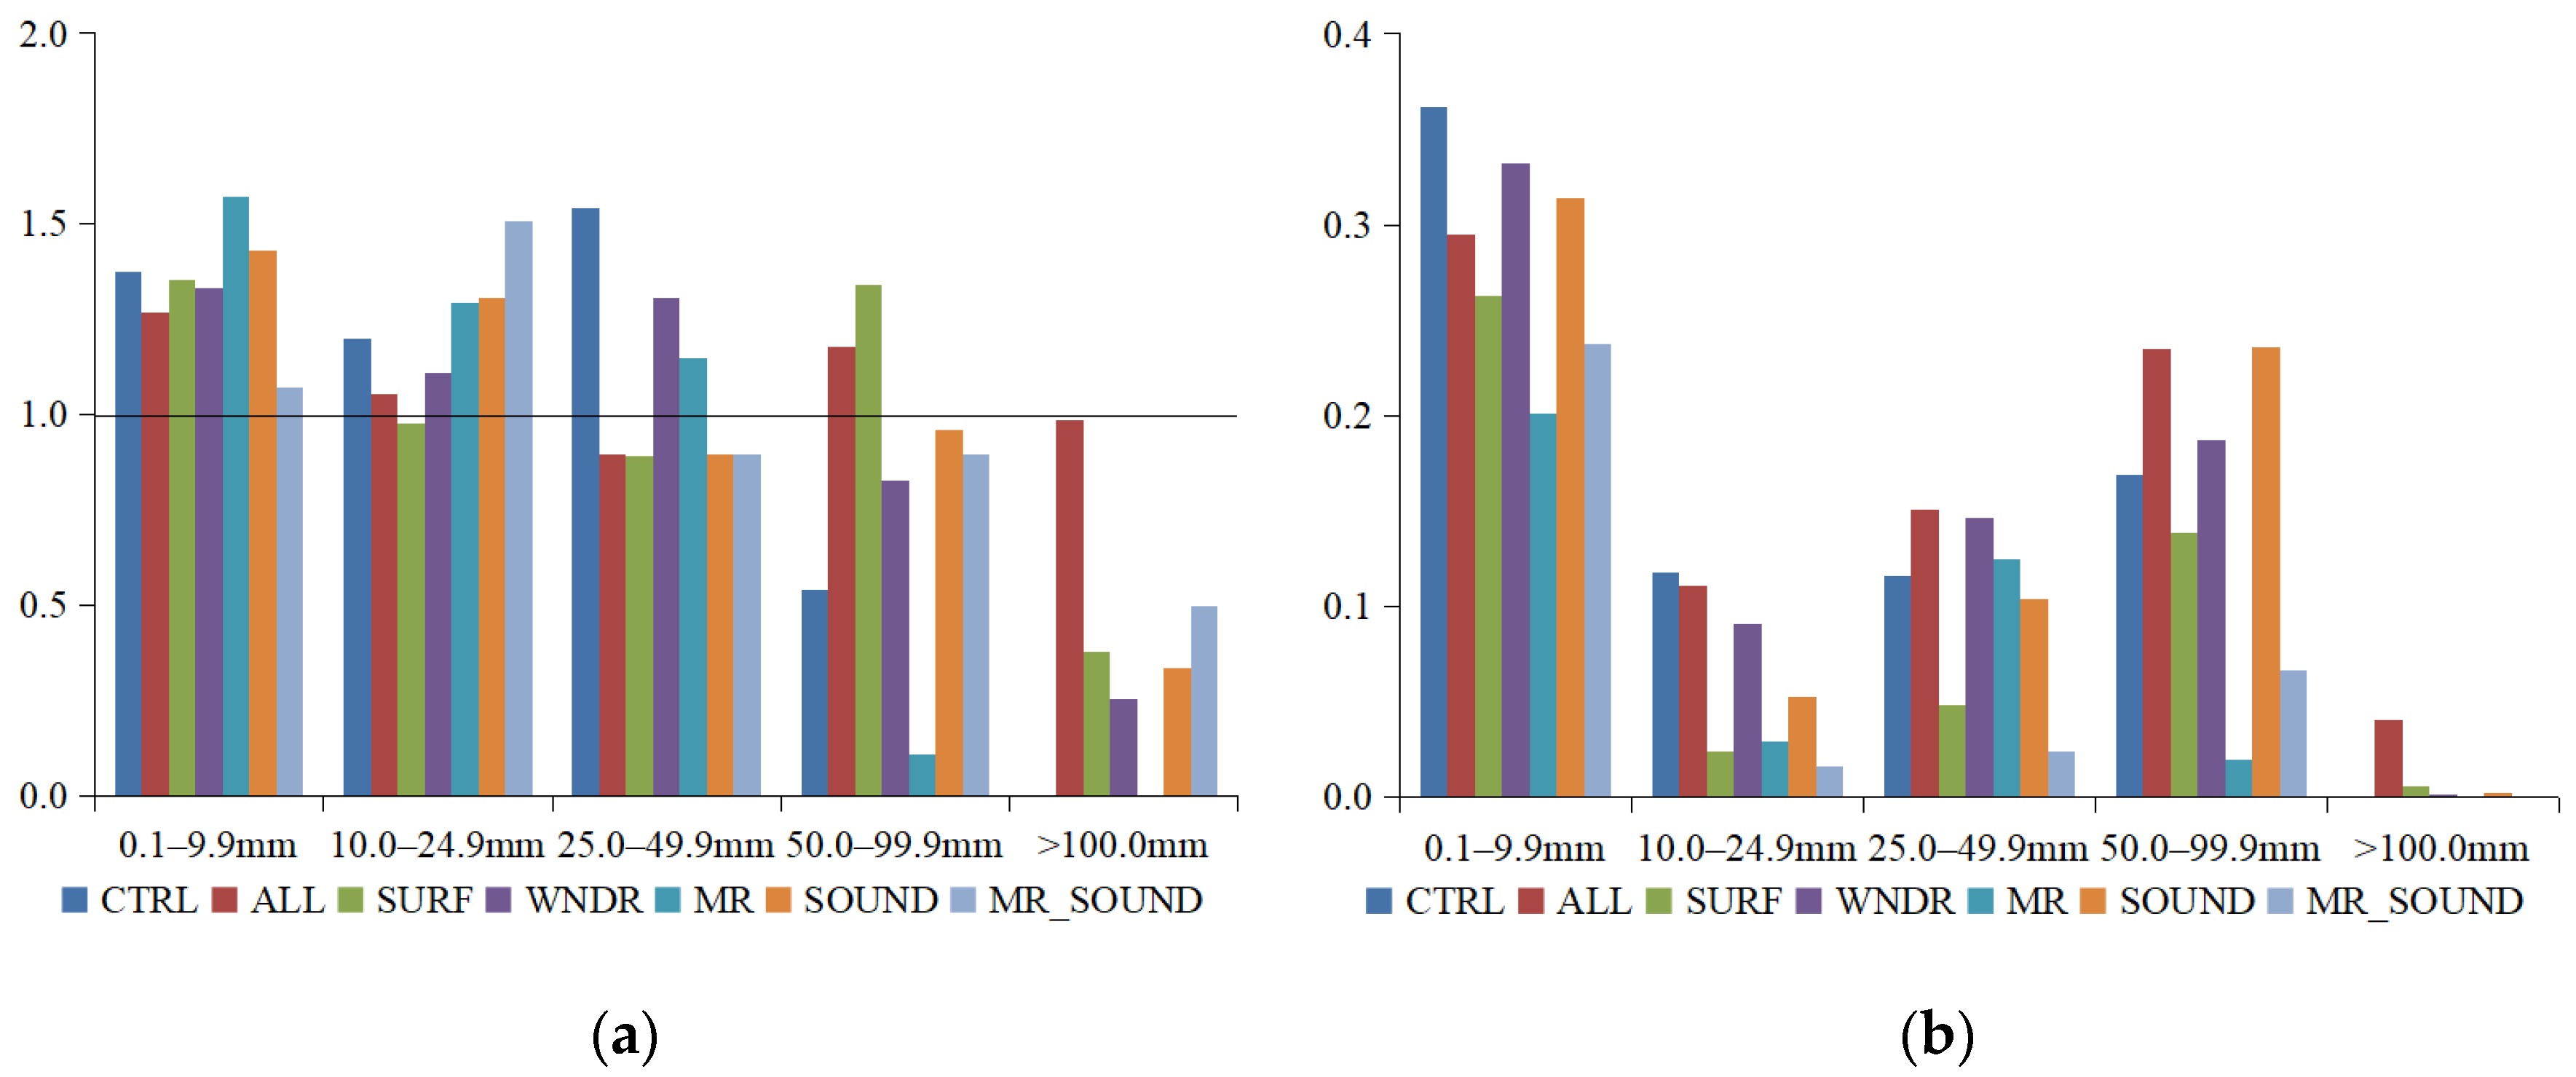
3.2. Precipitation Score

In order to intuitively evaluate the prediction effect of each experiment for different magnitudes of precipitation, the bias score (BIAS) and equitable threat score (ETS) [30] of precipitation are calculated. For a given rainfall magnitude and study area, the BIAS is simply expressed as the ratio of the number of stations with the forecasted rainfall being within the rainfall magnitude to the number of stations with the observed rainfall being within the rainfall magnitude. The calculation formula is:
BIAS = F/O
where F is the number of stations with the forecasted rainfall being within the rainfall magnitude, and O is the number of stations with the observed rainfall being within the rainfall magnitude. When the forecast has no bias, BIAS = 1; when there is a wet bias in the forecast, BIAS > 1; when there is a dry bias in the forecast, BIAS < 1.
The ETS represents the precipitation forecast skill in a certain area. ETS ≤ 0 indicates the forecast has no skill, while ETS > 0 shows the forecast has some skills when compared with random forecast. The calculation formula is:
ETS = CFA CHA F + O + CFA CHA
where CFA represents the number of stations with correct forecast.
CHA = ( F / V ) × O
where F is the number of stations with the forecasted rainfall being within the rainfall magnitude, V is the number of stations of the forecast field, and O is the number of stations with the observed rainfall being within the rainfall magnitude. CHA represents the mathematical expectation of accurate forecast when F is close to O.
Figure 5 shows the BIAS and ETS of the seven experiments for different categories of rainfall, and the rainfall in Figure 5 is the 24 h accumulated rainfall. Seen from the BIAS (Figure 5a), there is an obvious overestimated precipitation in each experiment for the light rain (0.1–9.9 mm). For the moderate precipitation (10.0–24.9 mm), there is almost no forecast bias in ALL and SURF experiments. In the three CTRL, WNDR and MR, there is obvious wet bias for heavy rain precipitation (25.0–49.9 mm), while the other experiments show dry bias. For the rainstorm category, both ALL and SURF show wet bias, Sound and MR_SOUND show no bias, while the rest show dry bias. This indicates that the other experiments all underestimate the precipitation at the rainstorm level. For heavy rainstorm, only the ALL experiment performs well, and its BIAS is close to 1. The remaining experiments all present the underestimation of heavy rainstorm. In general, the ALL experiment shows good performance for heavy rainstorm.
Seen from the ETS (Figure 5b), the ALL experiment does not show better performance for the light-rain level, but it performs well in the levels of moderate rain, heavy rain, rainstorm and heavy rainstorm. Its ETS scores are superior to other experiments. Especially for rainstorm and heavy rainstorm, the ETS of ALL experiment are much higher than other experiments.

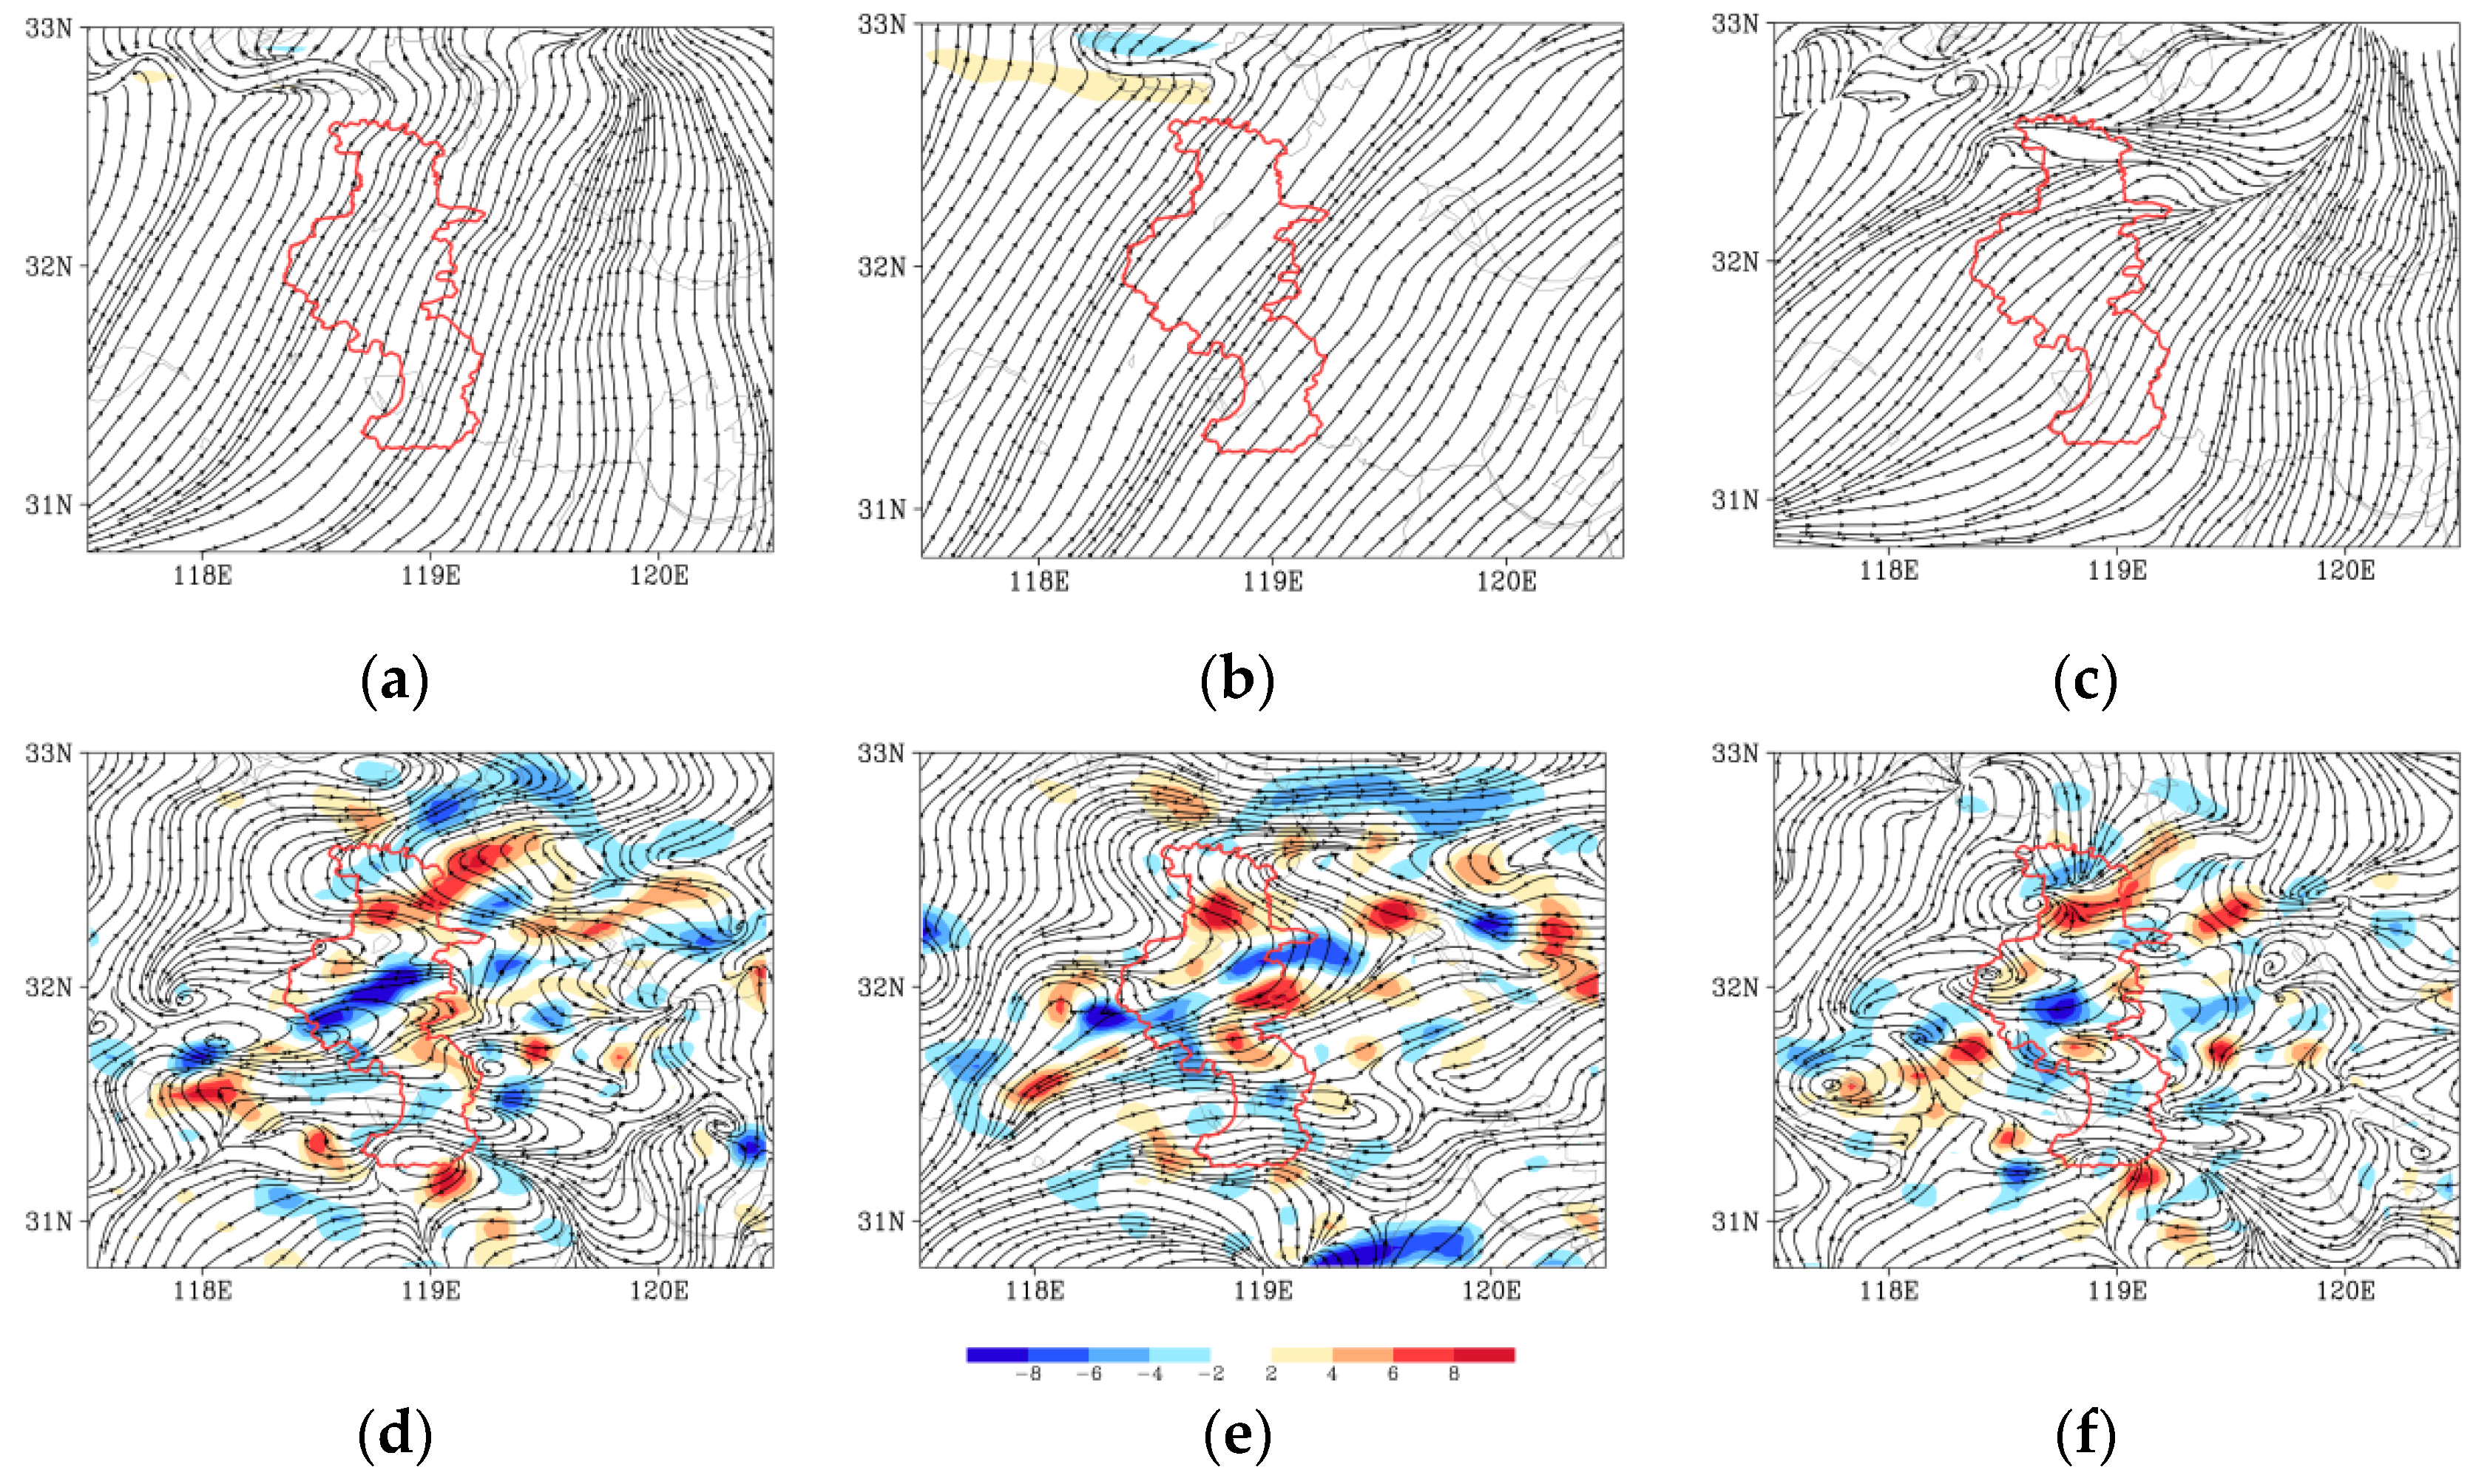
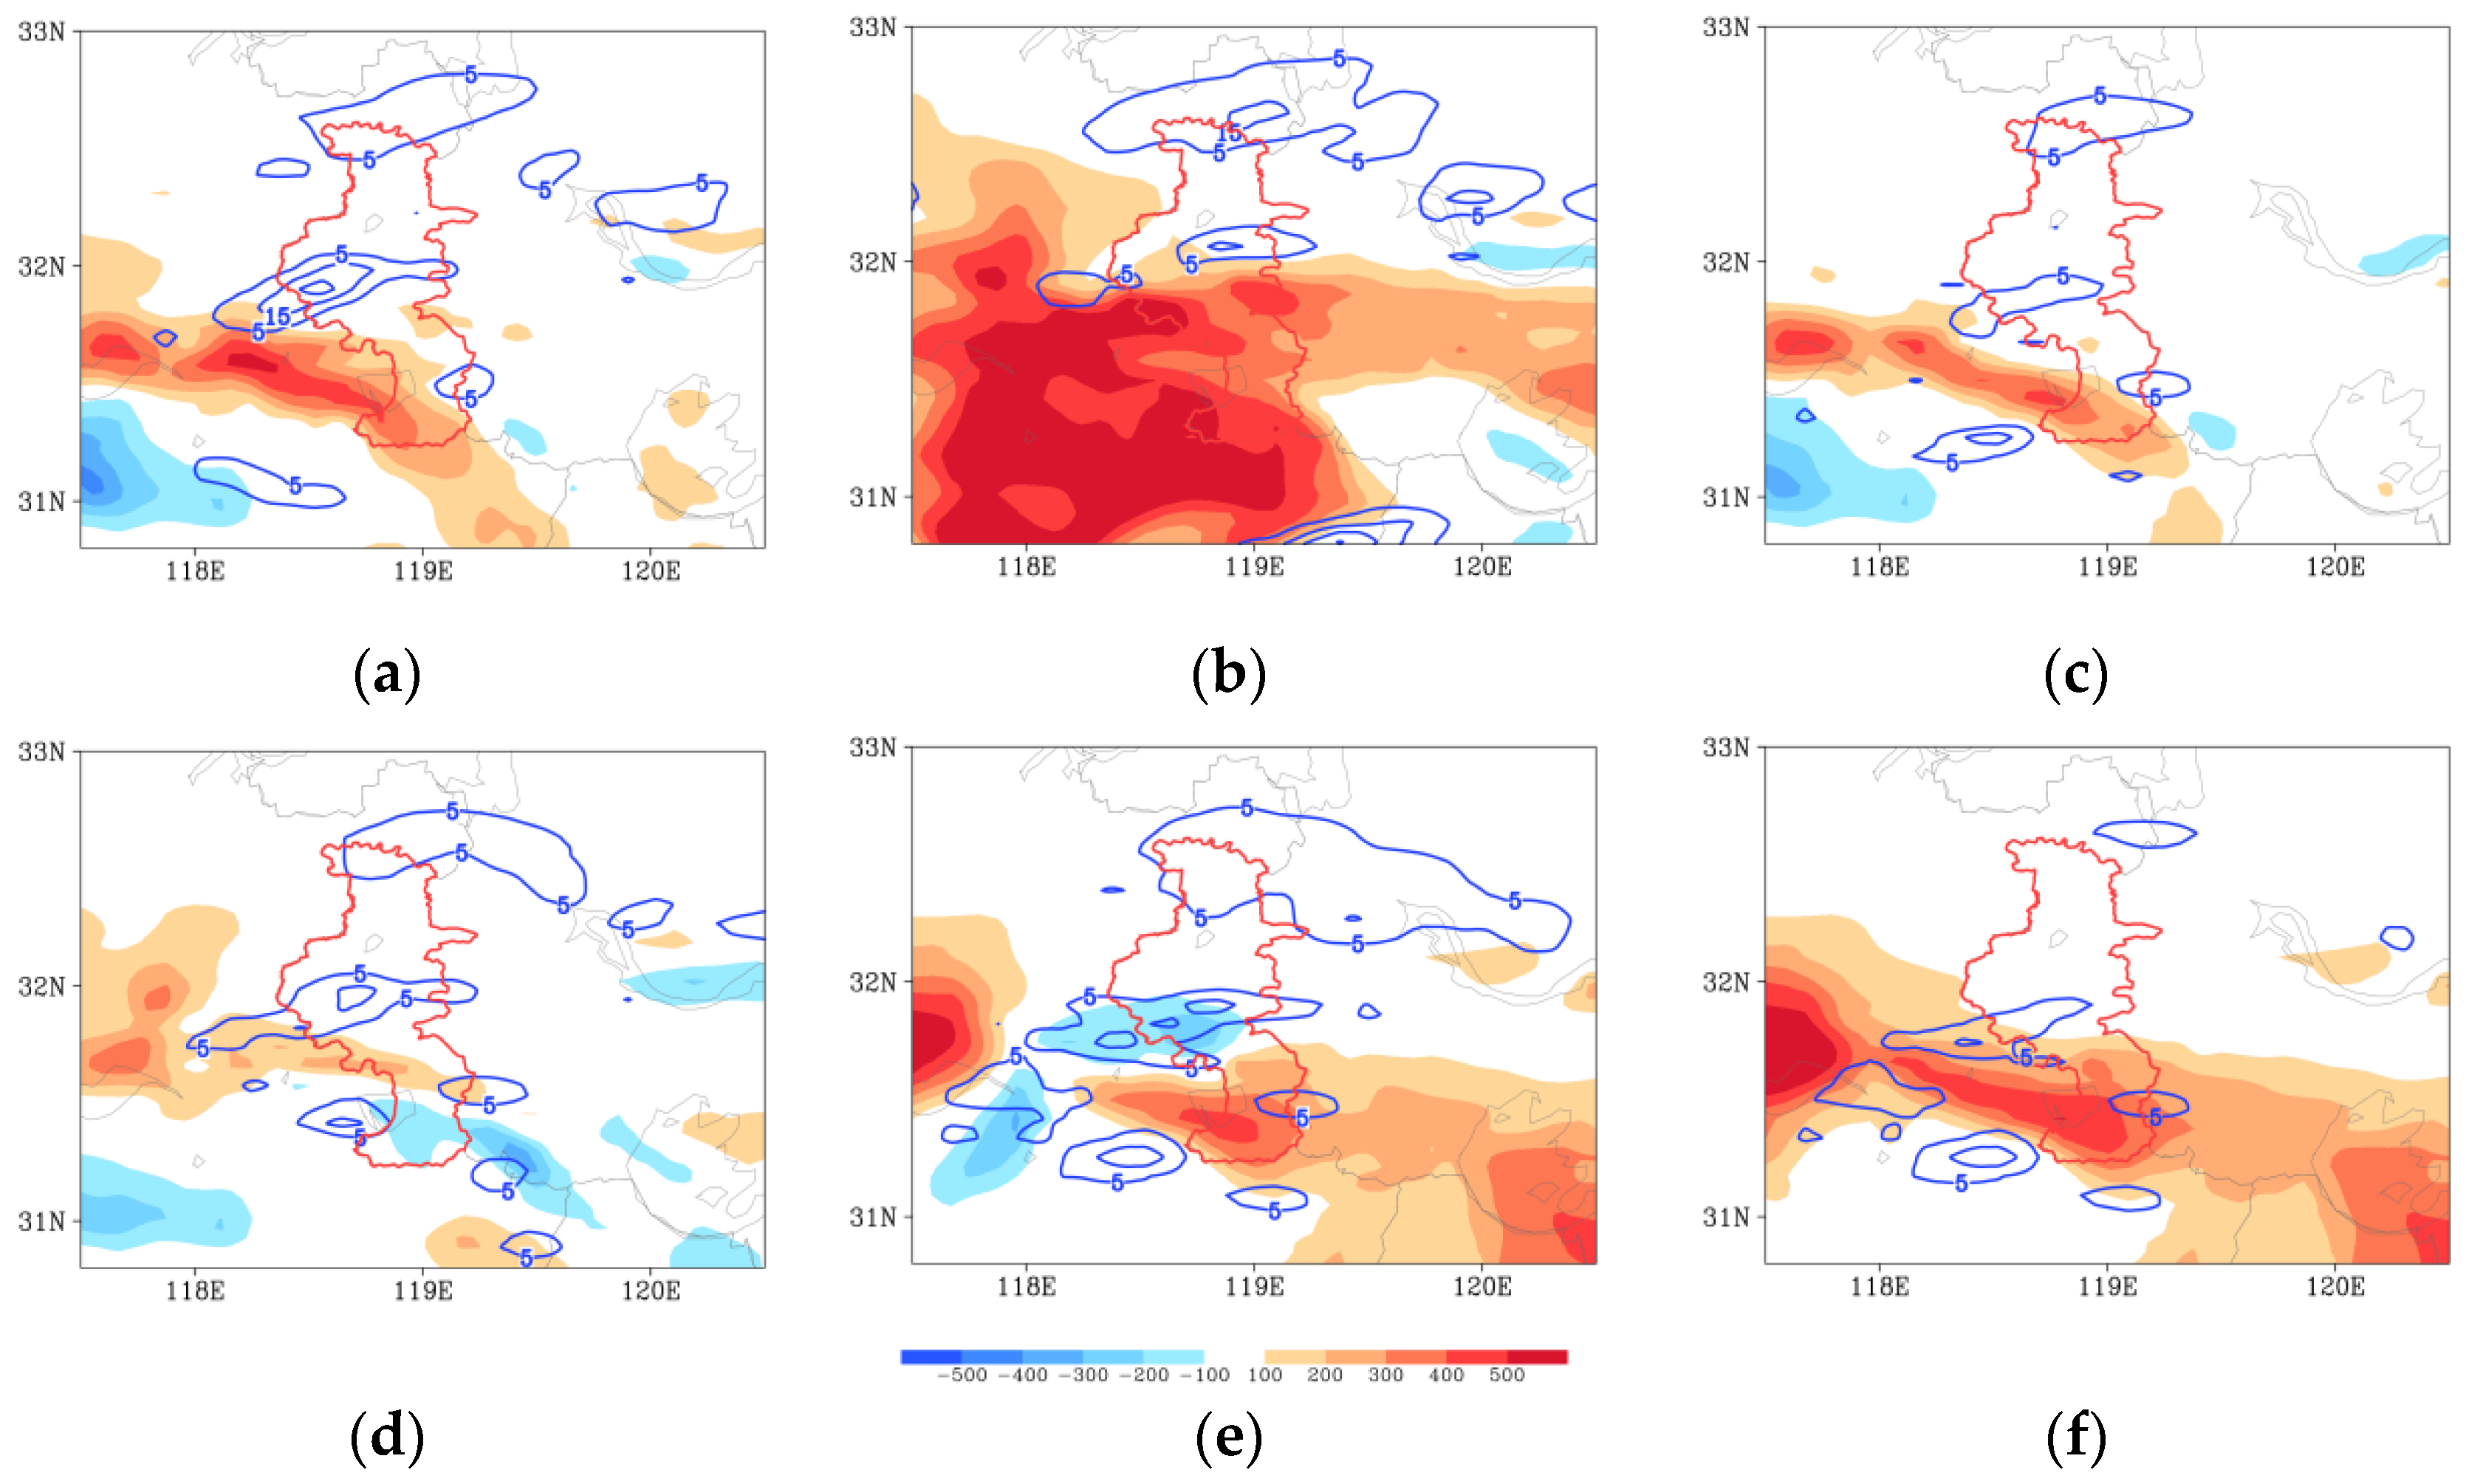
3.3. Wind Field and Water Vapor Flux Divergence

In this study, four types of observation data are used for assimilation. From the spatial distribution of precipitation and precipitation score, it can be seen that the ALL experiment that assimilates all the observation data performs the best. In order to further explore the application potential of assimilating different types of data in the forecast of extreme heavy rainfall, the differences of some physical variables between the experiments are compared. Continuous ascending motion and abundant water vapor supply are important conditions for the formation of rainstorm. The ascending motion is usually triggered by the shear of low-level wind field, and the convergence of water vapor flux represents the favorable water vapor condition in the rainfall area. Because the wind profile data can provide the information of wind field in middle and low levels, the results of WNDR are analyzed emphatically in this section.
Figure 6 shows the increments of wind field and water vapor flux divergence at 850 hPa in ALL, SURF and WNDR experiments on the basis of CRTL. Before the beginning of heavy precipitation (Figure 6a–c), the water vapor flux divergence of each experiment does not change much, but the wind field changes significantly. After assimilating all the data, it was found that there is a southwesterly wind increment in Nanjing area (Figure 6a). By only assimilating the surface observation data, it was found that there is also a southwesterly wind increment (Figure 6b), but the streamlines are sparse, and the wind speed is small. Since wind profiles can provide the changes of horizontal wind direction and wind speed in the vertical direction, the wind profile data can provide synoptic-scale information (Donaher et al. 2013, [31]). The addition of such information is crucial to the development of weather systems and is an important supplement to conventional data assimilation. The surface observation data can only provide the atmospheric information at the ground, but the wind profile can provide the high-level wind field information. Therefore, after assimilating wind profile data (Figure 6c), the change of wind field is more obvious. There is the southwesterly wind increment in the southern-central Nanjing, and the convergence of wind field appears in northern Nanjing.
At 09:00 BJT on 15 June, the precipitation was strong. The advantage of the ALL experiment gradually appears with the integration of the model (Figure 6d). The wind shear appears, and the water vapor convergence is more obvious in the middle of Nanjing, which is conducive to the enhancement of precipitation. At this time, there is a heavy rainstorm center in the southern-central Nanjing (Figure 4c). Only assimilating a single type data, such as surface observation data or wind profile data, can also improve the intensity and area of rainfall extremes, but the improvement effect is not as good as ALL experiment (Figure 6e,f). The introduction of different types of data in the ALL experiment can provide the latest real field of atmospheric elements in a timely manner and effectively improve the assimilation results.

3.4. Convective Available Potential Energy

Convective available potential energy (CAPE) is a thermodynamic variable that can quantitatively reflect whether deep convection may occur. Section 2.1 states that the maximum hourly rainfall appears at 09:00 to 10:00 BJT, so we analyze the CAPE increment at 09:00 BJT, before the maximum hourly rainfall. The large value area of CAPE increment in ALL is still in southern Nanjing and its west (Figure 7a). Since CAPE represents the energy of the air in the boundary layer, the change of CAPE is the largest after assimilating the surface observation data (Figure 7b). The CAPE values after assimilating wind profile data and microwave radiometer data (Figure 7c,d) are all increased, but the magnitude and range of the increment are much smaller than that of SURF experiment. After assimilating the sounding data (Figure 7e), the CAPE value in the central Nanjing is decreased, and the large value area of CAPE shifts to the southern Nanjing. It is worth noting that the CAPE value increment caused by the joint assimilation of microwave radiometer data and sounding data (Figure 7f) is greater than that of assimilating single data, which fully illustrates the importance of data complementation.
From the 1 h accumulated precipitation increment field, we find that except for the SURF experiment, the precipitation increment center of the other experiments is located in central Nanjing, and the increment center is in good agreement with the precipitation center. The 1 h accumulated precipitation of the ALL experiment is 25 mm more than that of the CTRL. Although the energy of the SURF is the most sufficient in central-southern Nanjing, the precipitation increment center is relatively northerly, which is related to the convergence of wind field and water vapor (Figure 6e).

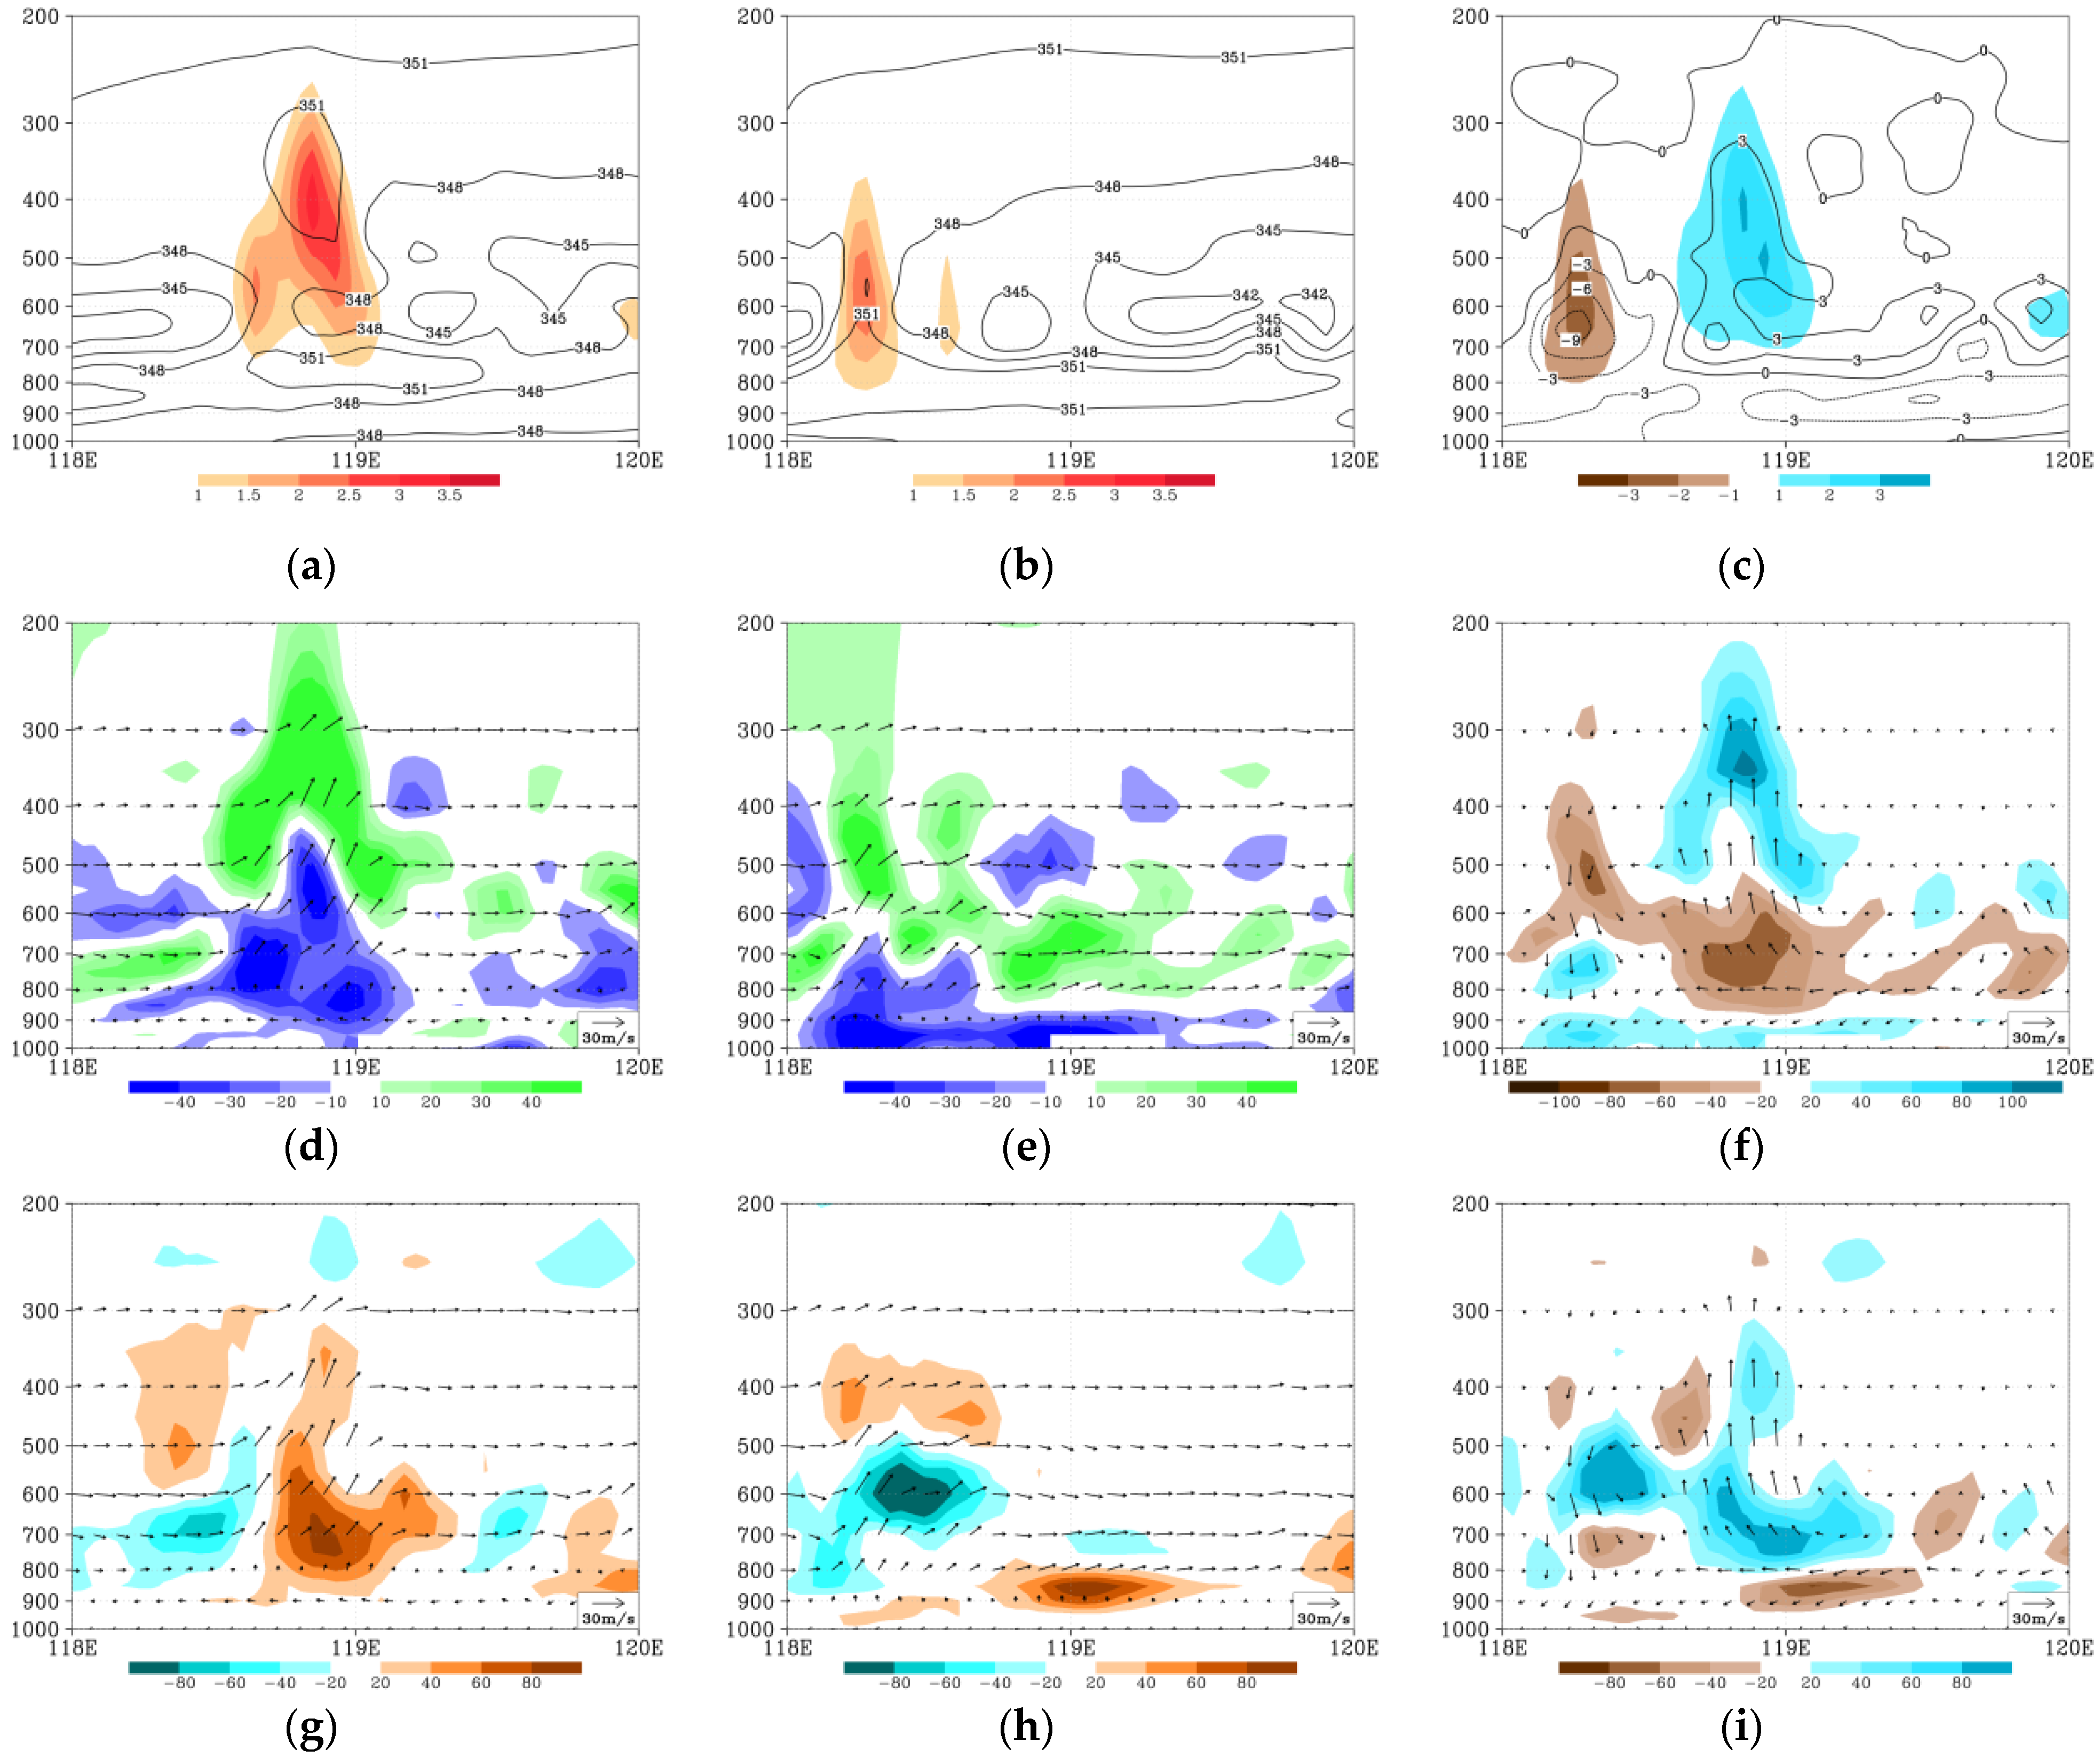
3.5. Vertical Structures of Physical Variables

The peak stage of this Meiyu-front rainstorm process is from 07:00 BJT to 11:00 BJT on the 15 June. In order to study the influence of assimilating multiple observation data on the vertical structures of the mesoscale systems, Figure 8 presents the cross sections of several variables along the heavy precipitation center (31.95° N) simulated by the ALL and SURF experiments at 09:00 BJT on 15 June. The difference of the variables between ALL and SURF is also presented in Figure 8. The pseudo-equivalent potential temperature is a physical quantity that characterizes atmospheric temperature and humidity, and its vertical distribution can characterize the vertical thermal structure of the atmosphere. From the vertical distribution of pseudo-equivalent potential temperature (Figure 8a,b), it can be seen that both ALL and SURF experiments well reproduce the convective unstable stratification over the rainstorm center and the uplift process of warm and humid air under the forcing of cold and dry air. The unstable stratification of the ALL test and the SURF test is basically consistent, but the convective unstable layer of the ALL experiment is deeper, and the warm air is lifted higher (up to 300 hPa).
Vertical motion is a necessary condition for the development and maintenance of mesoscale convective systems and the occurrence of heavy rainfall. It can not only promote the convergence and divergence of water vapor in the horizontal direction, but also transport the water vapor converging at the lower level to the higher level, resulting in the release of latent heat. In the CTRL experiment the ascending motion is mainly between 800 hPa and 400 hPa, and the center of ascending motion (near 118.2° E) is deviated from the precipitation center (Figure omitted). The vertical velocity of the ALL experiment is stronger, up to 3.5 m/s, and the range of high value area is wider, extending to 300 hPa. The position of the strong ascending motion is consistent with the position of heavy precipitation. In 500–300 hPa, the vertical velocity is significantly greater than in the low levels, indicating that the high-level pumping effect is obvious. The increment field of vertical velocity (Figure 8c) also shows that the addition of new-types data enhances the vertical motion over the precipitation center.
From the vertical structures of divergence (Figure 8d–f), it can be seen that both ALL and SURF experiments well reproduce the structure of low-level convergence and high-level divergence. After assimilation of multi-source observation data (Figure 8d), the range of convergence and divergence area increases, and the strong convergence area extends from the ground to near 500 hPa. There are three strong convergence centers along 31.95° N. The boundary of convergence and divergence is uplifted to about 400 hPa, and the height of strong divergence center is higher up to 200 hPa. It can also be seen from the wind field that the pumping effect caused by high-level divergence and low-level convergence makes the ascending motion much obvious in this area, and the secondary circulation is formed by the sinking compensation airflow on both sides of the top of the ascending motion. In SURF (Figure 8e), the convergence zone is mainly concentrated in the low level. The increment field (Figure 8f) shows that the assimilation of new-types data enhances the low-level convergence and high-level divergence over the precipitation center.
The vorticity field simulated by ALL and SURF experiments are different (Figure 8g,h). In the ALL experiment (Figure 8g), there is an obvious vorticity column near the rainstorm center. The height of the positive and negative vorticity column simulated by the ALL experiment is higher, which can reach more than 300 hPa, and the intensity is also stronger. The maximum positive vorticity reaches 80 × 10−5/s, and the negative vorticity reaches −60 × 10−5/s. The center of the positive vorticity is basically the same as the ascending motion. In the SURF experiment (Figure 8h), at the rainfall center at 119° E the positive vorticity only exists in the low level. The incremental field (Figure 8i) shows that the vorticity at the rainfall center is enhanced after the introduction of the new-types data, and the vorticity increment can reach the upper level.
In general, it can be seen from the increment field that the introduction of new-type data such as wind profiler radar, microwave radiometer and radiosonde sounding mainly improves the dynamic and thermal configuration of the middle and upper levels. The wind profile data, microwave radiometer data and sounding data can provide atmospheric profile information, and thus can improve the initial field and the simulation results.

4. Conclusions and Discussions

In this study, the WRF model and the three-dimensional variational assimilation system are used to simulate the rainstorm process in Nanjing on 15 June 2020 and to assimilate multiple types of observation data. Firstly, the simulation effect before and after assimilation is compared and evaluated, and then the influence of the new observation data on the dynamic field and thermal field during the rainstorm is studied. The main conclusions are as follows.
All the seven experiments can basically simulate the orientation of the rain belt. The data assimilated in ALL experiments contain more real atmospheric information from the ground to the upper air, which can improve the initial field more fully. Therefore, the ALL experiment can simulate the location of heavy rainstorms best, and it shows good performance for the precipitation above the moderate-rain level, especially for rainstorms and heavy rainstorms. The ETS of ALL experiment has been greatly improved compared with that of other experiments. The other experiments have their own advantages and disadvantages in rainfall simulation.
The assimilation of surface observation data can enhance the CAPE. The introduction of different types of data can efficiently improve the analysis field, for example, improving the wind field information and strengthening the convergence and the water vapor transport, which finally improves the precipitation efficiency. The improving effect of joint assimilation of multiple data is greater than that of assimilating single type of data, and the data mutual complementation is more important than the type of data.
The vertical structure of physical variables shows that in the heavy rainstorm process, there is strong convective unstable stratification, low-level convergence, high-level divergence, positive relative vorticity development and strong ascending motion. The addition of new-type data such as wind profiler radar, microwave radiometer and radiosonde sounding observation data improves the dynamic and thermal configuration of the middle and upper levels. The divergence, vorticity, vertical velocity, intensity and height of the atmospheric thermal structure are enhanced to varying degrees compared with only assimilating the conventional surface observation data.
In this study, some new-type observation data such as wind profile data, microwave radiometer data and radiosonde sounding data were assimilated to simulate a Meiyu-front rainstorm process in Nanjing. The results show that the introduction of new-type data can improve the dynamic and thermal fields, and thus, the prediction effect of extreme heavy precipitation could also be improved. However, this study only illustrates the role of multi-source new-type observations in data assimilation through a case study. In order to explain the role of various new observation data more fully in numerical weather prediction and data assimilation, we will conduct more data assimilation studies based on different disastrous weather events. In recent years, multi-scale assimilation technology has made a lot of progress. Our subsequent work will consider the use of multi-scale assimilation technology to extract information at different scales for various new observational data, so as to better improve the effect of data assimilation and model prediction.

Author Contributions

H.Z. and Y.S. contributed to the conception and design of the study. Y.M. wrote case overview section. Y.L. carried out the numerical simulations. K.Y. provided the data for this work. H.Z. and Y.S. revised this paper and polish the English. All authors have read and agreed to the published version of the manuscript.

Funding

This work was supported by the Open Grants of the State Key Laboratory of Severe Weather (2020LASW-B11), the Joint Research Project for Meteorological Capacity Improvement (22NLTSY009), Key Scientific Research Projects of Jiangsu Provincial Meteorological Bureau (KZ202203), the fund of “Key Laboratory of Atmosphere Sounding, CMA” (2021KLAS01M) and the Research Projects of Nanjing Meteorology Bureau (NJ202211).

Institutional Review Board Statement

Not applicable.

Informed Consent Statement

Not applicable.

Data Availability Statement

The FNL data used in WRF model is from https://rda.ucar.edu/datasets/ds083.2/dataaccess/ (accessed on 14 June 2020). Data from surface stations, wind profiler radars, microwave radiometers and radiosonde sounding is provided by Nanjing Meteorology Bureau.

Acknowledgments

We acknowledge the support from the Open Grants of the State Key Laboratory of Severe Weather (2020LASW-B11), the Joint Research Project for Meteorological Capacity Improvement (22NLTSY009), Key Scientific Research Projects of Jiangsu Provincial Meteorological Bureau (KZ202203), the fund of “Key Laboratory of Atmosphere Sounding, CMA” (2021KLAS01M) and the Research Projects of Nanjing Meteorology Bureau (NJ202211).

Conflicts of Interest

The authors declare no conflict of interest.

References

  1. Chen, S.J.; Kuo, Y.H.; Wang, W.; Tao, Z.Y.; Cui, B. A modeling case study of heavy rainstorms along the Mei-Yu front. Mon. Weather Rev. 1998, 126, 2330–2351. [Google Scholar] [CrossRef]
  2. Wang, W.C.; Gong, W.; Wei, H. A regional model simulation of the 1991 severe precipitation event over the Yangtze–Huai River valley. Part I: Precipitation and circulation statistics. J. Clim. 2000, 13, 74–92. [Google Scholar] [CrossRef]
  3. Chen, G.T.J.; Wang, C.C.; Liu, S.C.S. Potential vorticity diagnostics of a Mei-Yu front case. Mon. Weather Rev. 2003, 131, 2680–2696. [Google Scholar] [CrossRef]
  4. Chen, T.C.; Huang, W.R.; Yen, M.C. Interannual variation of the late spring–early summer monsoon rainfall in the northern part of the South China Sea. J. Clim. 2011, 24, 4295–4313. [Google Scholar] [CrossRef]
  5. Wang, C.C.; Tai-Jen Chen, G.; Ho, K.H. A diagnostic case study of mei-yu frontal retreat and associated low development near Taiwan. Mon. Weather Rev. 2016, 144, 2327–2349. [Google Scholar] [CrossRef]
  6. Zhang, Y.; Zhang, F.; Davis, C.A.; Sun, J. Diurnal evolution and structure of long-lived mesoscale convective vortices along the mei-yu front over the East China plains. J. Atmos. Sci. 2018, 75, 1005–1025. [Google Scholar] [CrossRef]
  7. Bryan, G.H.; Morrison, H. Sensitivity of a simulated squall line to horizontal resolution and parameterization of microphysics. Mon. Weather Rev. 2012, 140, 202–225. [Google Scholar] [CrossRef]
  8. Luo, Y.; Gong, Y.; Zhang, D.L. Initiation and organizational modes of an extreme-rain-producing mesoscale convective system along a mei-yu front in East China. Mon. Weather Rev. 2014, 142, 203–221. [Google Scholar] [CrossRef] [Green Version]
  9. Lupo, K.M.; Torn, R.D.; Yang, S.C. Evaluation of stochastic perturbed parameterization tendencies on convective-permitting ensemble forecasts of heavy rainfall events in New York and Taiwan. Wea. Forecast. 2020, 35, 5–24. [Google Scholar] [CrossRef]
  10. Grell, G.A.; Dévényi, D. A generalized approach to parameterizing convection combining ensemble and data assimilation techniques. Geophys. Res. Lett. 2002, 29, 38-1–38-4. [Google Scholar] [CrossRef] [Green Version]
  11. Xu, D.; Liu, Z.; Huang, X.Y.; Min, J.; Wang, H. Impact of assimilating IASI radiance observations on forecasts of two tropical cyclones. Meteorol. Atmos. Phys. 2013, 122, 1–18. [Google Scholar] [CrossRef] [Green Version]
  12. Zhang, X.; Liu, Y.W.; Wang, B.; Ji, Z.Z. Study on Four-Dimensional Variational Data Assimilation in Simulation of “98·7”‘ Rainstorm in Wuhan. Prog. Nat. Sci. 2000, 13, 1329–1333. (In Chinese) [Google Scholar]
  13. Zhang, X.; Wang, B.; Ji, Z.Z.; Lin, W.T. Study on Three-Dimensional Variational Data Assimilation in Simulation of “98·7”‘ Rainstorm in Wuhan. Prog. Nat. Sci. 2000, 12, 156–160. (In Chinese) [Google Scholar]
  14. Chen, C.P.; Zhang, L.H.; Fang, G.Q.; Lu, Y.H. Quality Control Experiments of Surface Observation Data in GRAPES 3Dvar over Sichuan Province. Plateau Mt. Meteorol. Res. 2010, 3, 18–23. (In Chinese) [Google Scholar]
  15. Sun, J.; Zhang, Y.; Ban, J.; Hong, J.S.; Lin, C.Y. Impact of combined assimilation of radar and rainfall data on short-term heavy rainfall prediction: A case study. Mon. Weather Rev. 2020, 148, 2211–2232. [Google Scholar] [CrossRef] [Green Version]
  16. Xu, D.; Huang, X.Y.; Wang, H.; Mizzi, A.P.; Min, J. Impact of assimilating radiances with the WRFDA ETKF/3DVAR hybrid system on prediction of two typhoons in 2012. J. Meteorol. Res. 2015, 29, 28–40. [Google Scholar] [CrossRef]
  17. Wagner, A.; Fersch, B.; Yuan, P.; Rummler, T.; Kunstmann, H. Assimilation of GNSS and synoptic data in a convection permitting limited area model: Improvement of simulated tropospheric water vapor content. Front. Earth Sci. 2022, 10, 1–20. [Google Scholar] [CrossRef]
  18. Won, H.Y.; Kim, Y.H.; Lee, H.S. An application of brightness temperature received from a ground-based microwave radiometer to estimation of precipitation occurrences and rainfall intensity. Asia-Pac. J. Atmos. Sci. 2009, 45, 55–69. [Google Scholar]
  19. He, W.; Chen, H.; Li, J. Influence of assimilating ground-based microwave radiometer data into the WRF model on precipitation. Atmos. Ocean. Sci. Lett. 2020, 13, 107–112. [Google Scholar] [CrossRef] [Green Version]
  20. Ishihara, M.; Kato, Y.; Abo, T.; Kobayashi, K.; Izumikawa, Y. Characteristics and performance of the operational wind profiler network of the Japan Meteorological Agency. J. Meteorol. Soc. Jpn. Ser. II 2006, 84, 1085–1096. [Google Scholar] [CrossRef] [Green Version]
  21. Huo, T.; Shan, N.; Tang, X.N.; Fan, Y.; Liu, D.X. Application of New Type of Detection Data in a Heavy Rainfall Process in Changsha. Meteorol. Environ. Res. 2019, 10, 37–38. [Google Scholar]
  22. Liu, D.; Huang, C.; Feng, J. Influence of Assimilating Wind Profiling Radar Observations in Distinct Dynamic Instability Regions on the Analysis and Forecast of an Extreme Rainstorm Event in Southern China. Remote Sens. 2022, 14, 3478. [Google Scholar] [CrossRef]
  23. Colle, B.A.; Mass, C.F. The 5–9 February 1996 flooding event over the Pacific Northwest: Sensitivity studies and evaluation of the MM5 precipitation forecasts. Mon. Weather Rev. 2000, 128, 593–617. [Google Scholar] [CrossRef]
  24. Wang, C.M.; Wang, Y.; Wu, R.S. The effect of model horizontal resolution on quantitative precipitation forecast for Meiyu front torrential rainfall. J. Hydrodyn. 2004, 19, 71–80. (In Chinese) [Google Scholar]
  25. Chow, F.K.; Weigel, A.P.; Street, R.L.; Rotach, M.W.; Xue, M. High-resolution large-eddy simulations of flow in a steep Alpine valley. Part I: Methodology, verification, and sensitivity experiments. J. Appl. Meteorol. Climatol. 2006, 45, 63–86. [Google Scholar] [CrossRef] [Green Version]
  26. Ma, H.; Cao, X.; Ma, X.; Su, H.; Jing, Y.; Zhu, K. Improving the Wind Power Density Forecast in the Middle- and High-Latitude Regions of China by Selecting the Relatively Optimal Planetary Boundary Layer Schemes. Atmosphere 2022, 13, 2034. [Google Scholar] [CrossRef]
  27. Shikhovtsev, A.Y.; Kovadlo, P.G.; Lezhenin, A.A.; Korobov, O.A.; Kiselev, A.V.; Russkikh, I.V.; Kolobov, D.Y.; Shikhovtsev, M.Y. Influence of Atmospheric Flow Structure on Optical Turbulence Characteristics. Appl. Sci. 2023, 13, 1282. [Google Scholar] [CrossRef]
  28. Mikkola, J.; Sinclair, V.; Bister, M.; Bianchi, F. Daytime along-valley winds in the Himalayas as simulated by the Weather Research and Forecasting (WRF) model. Atmos. Chem. Phys. 2023, 23, 821–842. [Google Scholar]
  29. Zhao, H.; Zou, X.; Qin, Z. Quality control of specific humidity from surface stations based on EOF and FFT—Case study. Front. Earth Sci. 2015, 9, 381–393. [Google Scholar] [CrossRef]
  30. Xu, D.; Auligné, T.; Descombes, G.; Snyder, C. A method for retrieving clouds with satellite infrared radiances using the particle filter. Geosci. Model Dev. 2016, 9, 3919–3932. [Google Scholar] [CrossRef] [Green Version]
  31. Donaher, S.L.; Albrecht, B.A.; Fang, M.; Brown, W. Wind profiles in tropical cyclone stratiform rainbands over land. Mon. Weather Rev. 2013, 141, 3933–3949. [Google Scholar] [CrossRef] [Green Version]
Figure 1. 500 hPa geopotential height (unit: dagpm, blue contour) and 850 hPa wind (unit: m/s, red wind bar) and humidity (unit:%, green shadow) at (A) 14:00 BJT (Beijing Time) on 14 June and (B) 08:00 BJT on 15 June. The area surrounded by gray lines is China, and the area surrounded by black lines is Jiangsu Province.
Atmosphere 14 00693 g001
Figure 2. The block diagram of the cyclic assimilation process.
Atmosphere 14 00693 g002
Figure 3. Geographical distribution of observation sites (red solid dots: wind profiler radar stations, from south to north in turn are Luhe, Pukou, Nanjing, Lishui and Gaochun; black hollow circles: microwave radiometer stations. Black solid circles: radiosonde sounding station; the area surrounded by black lines is Nanjing; the river across Nanjing is the Yangtze River).
Atmosphere 14 00693 g003
Figure 4. The 24 h accumulated precipitation (unit:mm) from 02:00 BJT on 15 June to 02:00 BJT on 16 June from the (a) observation, (b) CTRL, (c) SURF, (d) WNDR, (e) MR, (f) SOUND (g) MR_SOUND and (h) ALL. (The area surrounded by black lines is Nanjing. The river across Nanjing is the Yangtze River).
Atmosphere 14 00693 g004
Figure 5. The (a) BIAS (bias score) and (b) ETS (equitable threat score) of the seven experiments for different rainfall categories. The black straight line in (a) indicates BIAS = 1, which represents the forecast has no bias.
Atmosphere 14 00693 g005
Figure 6. The increments of wind (unit: m/s, streamline) and water vapor flux divergence (unit:g/cm2·hpa·s, shadow) at 850 hPa at 01:00 BJT and 09:00 BJT on June 15. At 01:00 BJT on 15 June: (a) ALL–CTRL, (b) SURF–CTRL and (c) WNDR–CTRL; At 09:00 BJT on 15 June: (d) ALL–CTRL, (e) SURF–CTRL and (f) WNDR–CTRL.
Atmosphere 14 00693 g006
Figure 7. The increments of convective available potential energy (unit: J/kg, shadow) and 1 h accumulated precipitation (unit: mm, contour) at 09:00 BJT on 15 June: (a) ALL–CTRL, (b) SURF–CTRL, (c) WNDR–CTRL, (d) MR–CTRL, (e) SOUND–CTRL and (f) MR_SOUND–CTRL.
Atmosphere 14 00693 g007
Figure 8. The cross sections along 31.95° N at 09:00 BJT on 15 June. The left column is ALL experiment, the middle is SURF experiment, and the right column is ALL−SURF: (ac) pseudo-equivalent potential temperature (unit: J/kg, contour) and vertical velocity (unit: m/s, shadow) and their increments; (df) divergence (unit: s−1, shadow) and wind field (unit: 10·m/s, vector, composite of U component and W10 component) and their increments; (gi) vorticity (unit: s−1, shadow) and wind field (unit: 10·m/s, vector, composite of U component and W10 component) and their increments.
Atmosphere 14 00693 g008
Table 1. List of the CONUS [28].
Parameterized TypesCumulus Parameterization Scheme
MicrophysicsNew Thompson scheme
Cumulus ParameterizationTiedtke scheme
Longwave RadiationRRTMG scheme
Shortwave RadiationRRTMG shortwave
Planetary Boundary layerMellor–Yamada–Janjic scheme
Surface LayerMonin–Obukhov scheme
Land Surface Noah Land Surface Model
Table 2. List of the assimilation experiments.
NameAssimilation DataLocation
CTRL--
ALLsurface observation (air temperature, air pressure, relative humidity, wind direction and wind speed), 5 wind profiler radars (wind direction and wind speed), 3 microwave radiometers (air temperature and humidity) and 1 radiosonde sounding (air temperature, air pressure, relative humidity, wind direction and wind speed) in East China and 5 stations in Nanjing
SURFconventional surface observationEast China
WNDR5 wind profiler radarsLuhe, Nanjing, Pukou, Lishui, Gaochun
MR3 microwave radiometersLuhe, Nanjing, Pukou
SOUND1 radiosonde soundingNanjing
MR_SOUND3 microwave radiometers and 1 soundingLuhe, Nanjing, Pukou
Disclaimer/Publisher’s Note: The statements, opinions and data contained in all publications are solely those of the individual author(s) and contributor(s) and not of MDPI and/or the editor(s). MDPI and/or the editor(s) disclaim responsibility for any injury to people or property resulting from any ideas, methods, instructions or products referred to in the content.

