Article

Apportionment of Chemical Components and Sources of PM2.5 in Shihezi City of Xinjiang, China

1
Institute of Desert Meteorology, China Meteorological Administration/Xinjiang Key Laboratory of Desert Meteorology and Sandstorm/Key Laboratory of Tree-ring Physical and Chemical Research, China Meteorological Administration, Urumqi 830002, China
2
Field Scientific Experiment Base of Akdala Atmospheric Background, China Meteorological Administration, Urumqi 830002, China
3
State Key Laboratory of Environmental Criteria and Risk Assessment, Chinese Research Academy of Environmental Sciences, Beijing 100012, China
*
Author to whom correspondence should be addressed.
Atmosphere 2023, 14(4), 703; https://doi.org/10.3390/atmos14040703
Submission received: 17 March 2023 / Revised: 7 April 2023 / Accepted: 8 April 2023 / Published: 11 April 2023
(This article belongs to the Section Air Quality)

Abstract

:
In order to reveal the pollution characteristics and sources of PM2.5, in this study, we collected PM2.5 filter membrane samples in Shihezi continuously from December 2020 to January 2021, and analyzed 10 kinds of water-soluble inorganic ions (WSIIs) and 24 inorganic elements (IEs), as well as organic carbon (OC) and elemental carbon (EC). The sources and transport paths of PM2.5 were also analyzed via PMF modeling and backward trajectory clustering analysis. The results show that, in winter, Shihezi can have a mean PM2.5 mass concentration as high as 164.69 ± 76.48 μg/m3, and the PM2.5 mass concentration on polluted days is 3.3 times that of clean days. Water-soluble inorganic ions (WSIIs), total carbon (TC), and inorganic elements (IEs) make up the percentage of PM2.5 mass concentration by 64.9%, 9.3%, and 2.6%, respectively. SO42−, NO3, and NH4+ (SIAs) are the major WSIIs, accounting for 91.0% of the WSII concentration. The heavier the pollution, the more SIAs contribute to PM2.5. The OC mean mass concentration is 14.04 ± 5.32 μg/m3. As the winter pollution becomes worse and worse, the value of OC/PM2.5 decreases constantly while that of SOC/OC follows an opposite trend. During the process of heavy pollution in Shihezi, the secondary transformation of total carbon cannot be ignored. The positive definite matrix factorization (PMF) model result suggests that the main pollution origins of PM2.5 in Shihezi City comprise secondary sources, coal-burning sources, motor vehicle sources, industrial sources, and flying dust sources. The backward trajectory clustering analysis denotes that the winter pollution in Shihezi mainly comes from the local pollutants in Manas and the short-distance transport of pollutants from the Urumqi-Changji Region.

1. Introduction

PM2.5 is a mixture of primary and secondary fine particles, formed by the conversion of many gaseous and solid precursors, such as sulfur dioxide (SO2), nitrogen oxides (NOX), elemental carbon (EC), and organic carbon (OC), through homogeneous and heterogeneous reactions [1]. PM2.5, with its complex constituents, is an important factor affecting environmental air quality and human health [2,3], and has been listed as one of the most important atmospheric pollutants. The composition of PM2.5 can be divided into three main parts, including water-soluble inorganic ions, carbonaceous aerosols, and elemental components [4], of which the first two make up the largest proportion in PM2.5 [5,6], with water-soluble inorganic ions (WSIIs) usually accounting for 30–80% [7,8]. Moreover, the secondary ions (SIAs, namely NH4+, NO3, and SO42−) are not only the main proportion of WSIIs [9], but also have a strong dependence on ozone, which is the key point of coordinated control of PM2.5 and ozone [10]. The total carbon (TC) in PM2.5 scatters and absorbs light, which can significantly affect atmospheric visibility [11]. The organic carbon (OC), due to its complex composition and sources, has a harmful influence on human health [12,13], and the secondary organic carbon (SOC) in it is identified as the key component causing heavy pollution [14]. Inorganic carbon (EC), which mainly comes from incomplete combustion of fossil or biomass fuels, has strong stability and can be used as a marker of the primary pollution source [15]. Inorganic elements (IEs) occupy a relatively low percentage in PM2.5, but they easily attach to fine particles, resulting in more harm to humans [16]. With unique source apportionment, inorganic elements are often used as tracer components of particulate matter [17]. Therefore, studying the chemical composition of PM2.5 not only provides an understanding of its physical and chemical characteristics, but also aids in exploring the origin and formation mechanism of air pollution, and provides a basis for the formulation and implementation of air pollution prevention and control measures.
In recent years, four pollution areas of fine particulate matter (PM2.5) have formed in China geographically: the Beijing–Tianjin–Hebei region, the Yangtze River Delta, the Pearl River Delta, and the Sichuan Basin [18,19]. In addition, the clustered cities that are dotted along the economically developing belt in the northern slope of the Tianshan Mountains in Xinjiang have also turned into typical pollution areas of PM2.5 in Northwest China, because of the frequent occurrence of air pollution with serious haze in winter. Shihezi City sits in the middle of the northern foot of the Tianshan Mountains, on the southern edge of Junggar Basin. Relying on farms and dominated by industry, it is one of the major cities in the economic belt on the northern slope of the Tianshan Mountains in Xinjiang [20]. The weather in Junggar Basin is mostly in a static and stable state in winter, which allows easterly winds to prevail in its central and eastern parts, transporting the air pollutants discharged from the eastern industrial zone to the west. As a result, the pollutants from the east accumulate at the foot of the Tianshan Mountains in the west of the basin, resulting in increasingly serious haze pollution in this region in winter [21,22]. It has been found that the PM2.5 concentration (103 μg·m−3) during the winter heating season in Shihezi is even higher than that (85 μg·m−3) in the Beijing–Tianjin–Hebei region [23], making Shihezi one of the cities with the heaviest air pollution in China. Thus far, a series of studies on the fine particles and their chemical composition features and sources in the four above-mentioned heavily polluted areas in China have been conducted by Chinese and overseas scholars, but there is still a lack of systematic research on PM2.5 in the severe fog–haze-affected area of Junggar Basin in Northwest China [24]. In order to fill this gap, we, in this paper, intend to use the PM2.5 filter membrane samples, which were collected continuously for two months in Shihezi City in winter, to analyze the concentration variation characteristics and impact factors of water-soluble inorganic ions (WSIIs), total carbon (TC), and inorganic elements (IEs) in PM2.5, and then to parse the sources and conveying paths of PM2.5 by adopting the positive matrix factorization (PMF) model and the backward trajectory clustering analysis method. Our research results are expected to be of some scientific significance for deeply understanding the causes of air pollution in Shihezi City and guiding the joint prevention and control measures of air pollution in the Urumqi–Changji–Shihezi Region of Xinjiang.

2. Materials and Methods

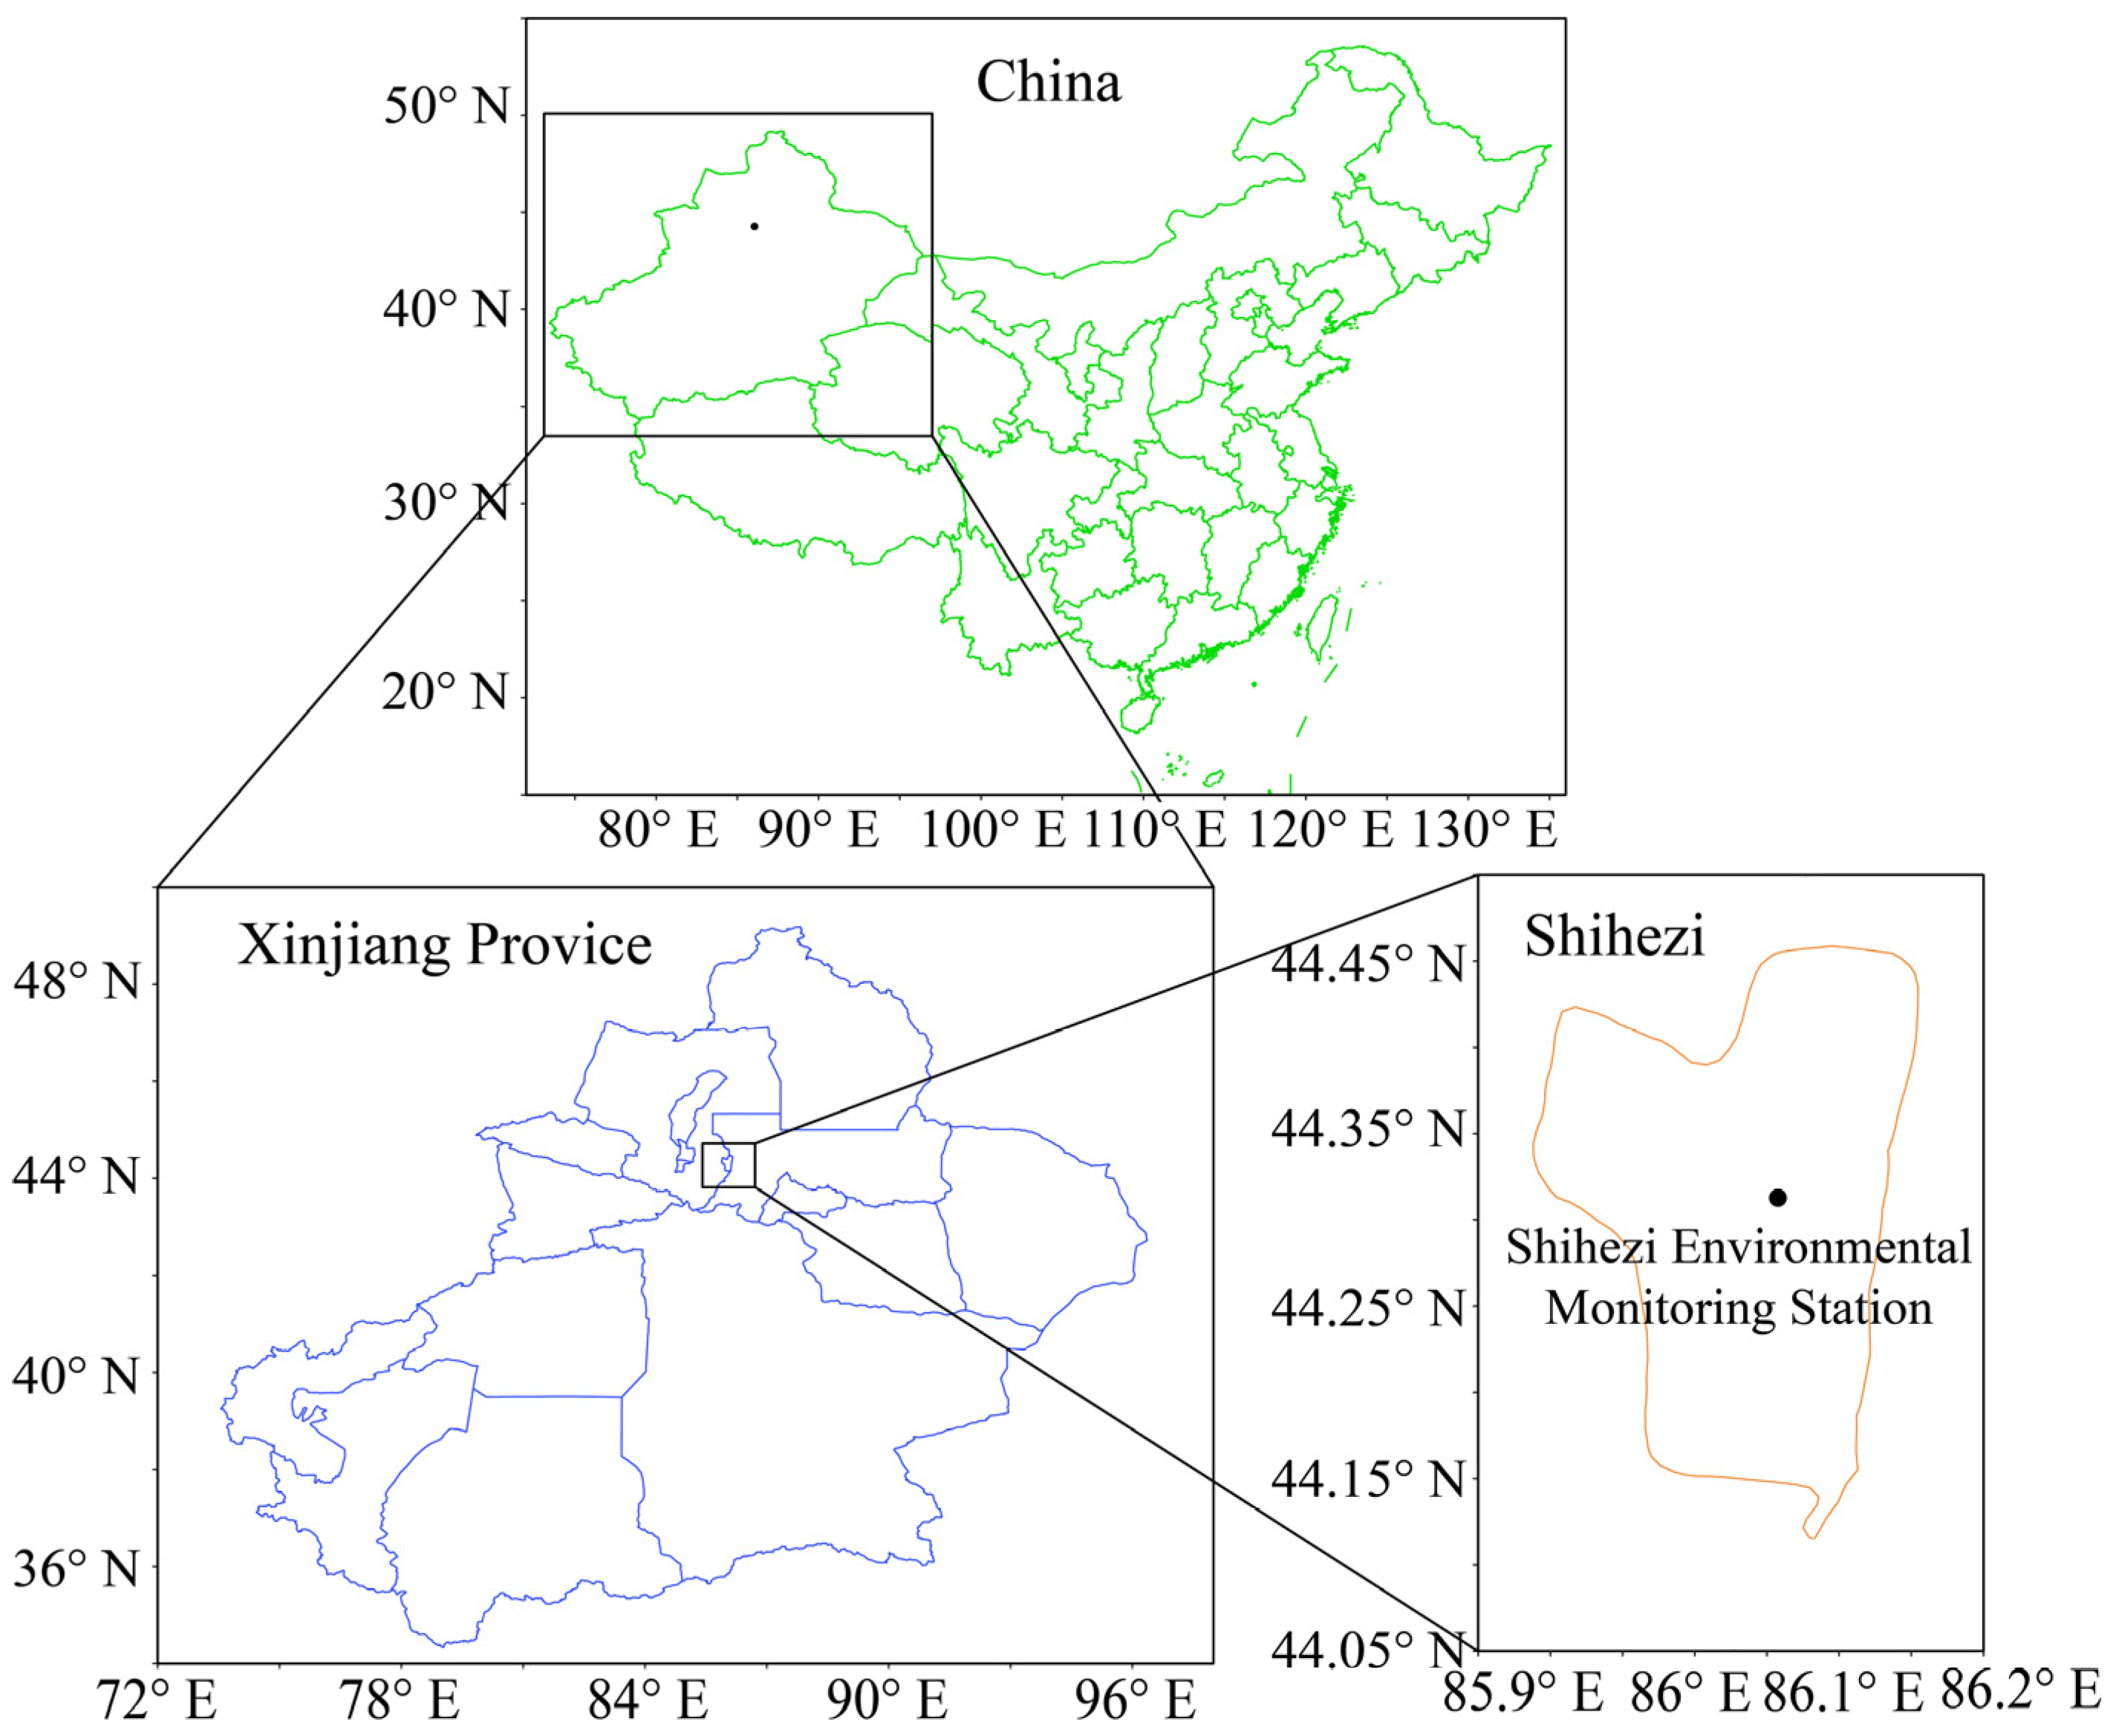
2.1. Sample Collection

The sampling site of PM2.5 in this study is located at the Shihezi Environmental Monitoring Station (86.057637° E, 44.313262° N) (Figure 1), and there are no obvious emission sources around the site. A low-volume sampling instrument (16.7 L/min, Wuhan Tianhong, TH-16A, Wuhan, China) with two quartz microfiber filters (47 mm in diameter, Qmembrane, Pall, Lund, Sweden) and two polypropylene filters (47 mm in diameter, P membrane, Merck KGaA, Darmstadt, Germany) was used to collect PM2.5 samples. PM2.5 samples were collected once a day, after exposure from 10:00 a.m. to 9:00 a.m. of the following day. During the observation and sampling episode from 1 December 2020 to 31 January 2021, a total of 240 usable samples of PM2.5 were gained in the urban area of Shihezi City.
The collected particulate matter samples have met the technical requirements of Gravimetric Method for Determination of PM10 and PM2.5 in Ambient Air, and the cumulative sampling time per day met the detection limit requirement of sample analysis. According to the characteristics of the filter membrane and the requirement of chemical analysis, quartz membrane samples are to be used to analyze organic carbon and elemental carbon, and polypropylene membrane samples are to be used for analyzing water-soluble inorganic ions and inorganic elements.
Quartz filters were baked in a 480 °C muffle furnace for 6 h before sampling in order to eliminate the possible presence of organics. All filtering membranes were placed in a super clean room (temperature: 20 ± 5 °C; relative humidity: 50 ± 4%) for 48 h and weighed by a high-precision electronic balance before and after sampling, with an accuracy of 10 μg. All filters were stored in a freezer at −20 °C before analysis, in order to prevent the loss of volatile components.

2.2. Analysis Methods

This study adopts the weighing method to measure the mass concentration of PM2.5. The analytical components are made up of 10 kinds of water-soluble inorganic ions, 24 kinds of inorganic elements, as well as OC and EC.
Regarding the collected samples, the ion chromatography (ICS-100, ICS-80, Dionex, Sunnyvale, CA, USA) is used for measuring and analyzing the water-soluble inorganic ions (NH4+, Ca2+, K+, Na+, Mg2+, Cl, NO3, SO42−, NO2, and F). The detection limits are 0.007, 0.009, 0.005, 0.002, 0.004, 0.01, 0.03, 0.024, 0.002, and 0.005 μg/m3 for NH4+, Ca2+, K+, Na+, Mg2+, Cl, NO3, SO42−, NO2, and F, respectively. Additionally, the recovery rates are in the range of 80–120%. Place 1/4 quartz filter membrane in the centrifuge tube, add 40 mL ultra-pure water (18.2 MΩ·cm), and then the ultrasonic wave shocks it for 20 min. After it settles, it is filtered with the 0.45 μm filter before analysis is completed.
Two punches of filters (each with an area of 0.5 cm2) are removed from each quartz microfiber filter, and the thermo-optical carbon analyzer (DRI 2001A, WaveMetrics, Inc., Portland, OR, USA) is set for organic carbon and elemental carbon. The detection limits of OC and EC are 0.82 μgC/cm2 and 0.19 μgC/cm2, respectively, with an accuracy of 2–6%.
Inductively coupled plasma mass spectrometry (ICP-MS, Agilent 7800, Santa Clara, CA, USA) is adopted for the inorganic elements (Be, Na, Mg, Al, K, Ca, V, Cr, Mn, Fe, Co, Ni, Cu, Zn, As, Se, Mo, Ag, Cd, Ba, Tl, Pb, Th, and U). First, place 1/4 filter membrane into a polytetrafluoroethylene (PTFE) digestion tank, add 5.0 mL nitric acid of MOS grade quality, leave it for 2 h, then add 2.0 mL hydrochloric acid of MOS grade quality plus 2.0 mL H2O2 of guaranteed reagent (GR). Thereafter, cover and seal the tank, and digest it with a microwave digestion extractor (leave it for at least 30 min after heating to 190 °C within 10 min). After the digestion tank is cooled to the environmental temperature, the digestion solution is concentrated to about 0.5 mL at 140 °C by an acid catcher (taking about 4–5 h), and the volume is transferred to 25.0 mL with ultra-pure water for subsequent analysis. Element detection limits vary in the range of 0.001–0.049 ng/m3, with short-term precision ≤ 3% RSD (20 min) and long-term accuracy ≤ 4% RSD (2 h), and the recovery rate of standard samples between 80–120%.

2.3. Source Apportionment Receptor Model

The positive definite matrix factorization (PMF) model is a widely used receptor model currently, especially in the source apportionment of atmospheric particulate matter [25,26,27]. Firstly, the concentration, total mass concentration, and measurement deviation of each chemical species in particulate matter are put into the model, and then the errors of each chemical species in particulate matter are calculated by the use of weighting, and the main pollution sources and their contribution rates are determined by the least squares method. Compared with other source analysis methods, PMF has the advantages that it is based on mass balance without relying on source component spectrum, and the elements in the decomposition matrix are based on non-negative constraints, so the model can be optimized by using data with standard deviation. The basic principle of PMF source analysis is as follows: Assuming that matrix X(ij) is the sample data, matrix X(ij) can be decomposed into the fractional matrix G(ik), load matrix F(kj), and residual matrix E(ij), of which i is the number of samples, j is the number of chemical species, and k is the number of major pollution sources resolved. The following is the basic equation:
X = G F + E
X i j = k = 1 p g i k f i k + e i j
where xij, gik, fkj, and eij are the elements of the X, G, F, and E matrices, respectively.
The purpose of PMF analysis is to minimize Q. Q is defined as:
Q = i = 1 n j = 1 m [ e i j u i j ] 2
i = 1, 2,…, n; j = 1, 2,…, m; k = 1, 2,…, p.
uij denotes the uncertainty of the jth chemical species in the ith sample.
The equation-based uncertainty file provides species-specific parameters that EPA PMF 5.0 uses to calculate uncertainties for each sample.
U n c = 5 6 × M D L
U n c = E r r o r   F r a c t i o n × c o n c e n t r a t i o n 2 + 0.5 × M D L 2
where MDL is the method of detection limit. If the concentration is less than or equal to the MDL provided, the uncertainty (Unc) is calculated using a fixed fraction of the MDL (Equation (4)). Otherwise, the calculation is conducted based on Equation (5). There are further details described in the PMF 5.0 User Guide (US EPA, 2014).

2.4. HYSPLIT Model

The Hybrid Single Particle Lagrangian Integrated Trajectory Model (HYSPLIT), developed jointly by the US National Oceanic and Atmospheric Administration (NOAA) and the Australian Bureau of Meteorology (ABOM), has been widely utilized in analyzing the transport and diffusion of air pollutants [28,29]. In this paper, the data of meteorological elements from the National Center for Environmental Prediction (NCEP) of the United States and the HYSPLIT model are used to perform the clustering analysis on the sources and backward trajectory of air mass during the observation period. The Shihezi environmental monitoring station is set as the initial point, with the height at 500 m above the ground. Clustering analysis of 24 h backward trajectories is carried out at 0:00, 6:00, 12:00, and 18:00 (Beijing Time) every day.

3. Results and Discussion

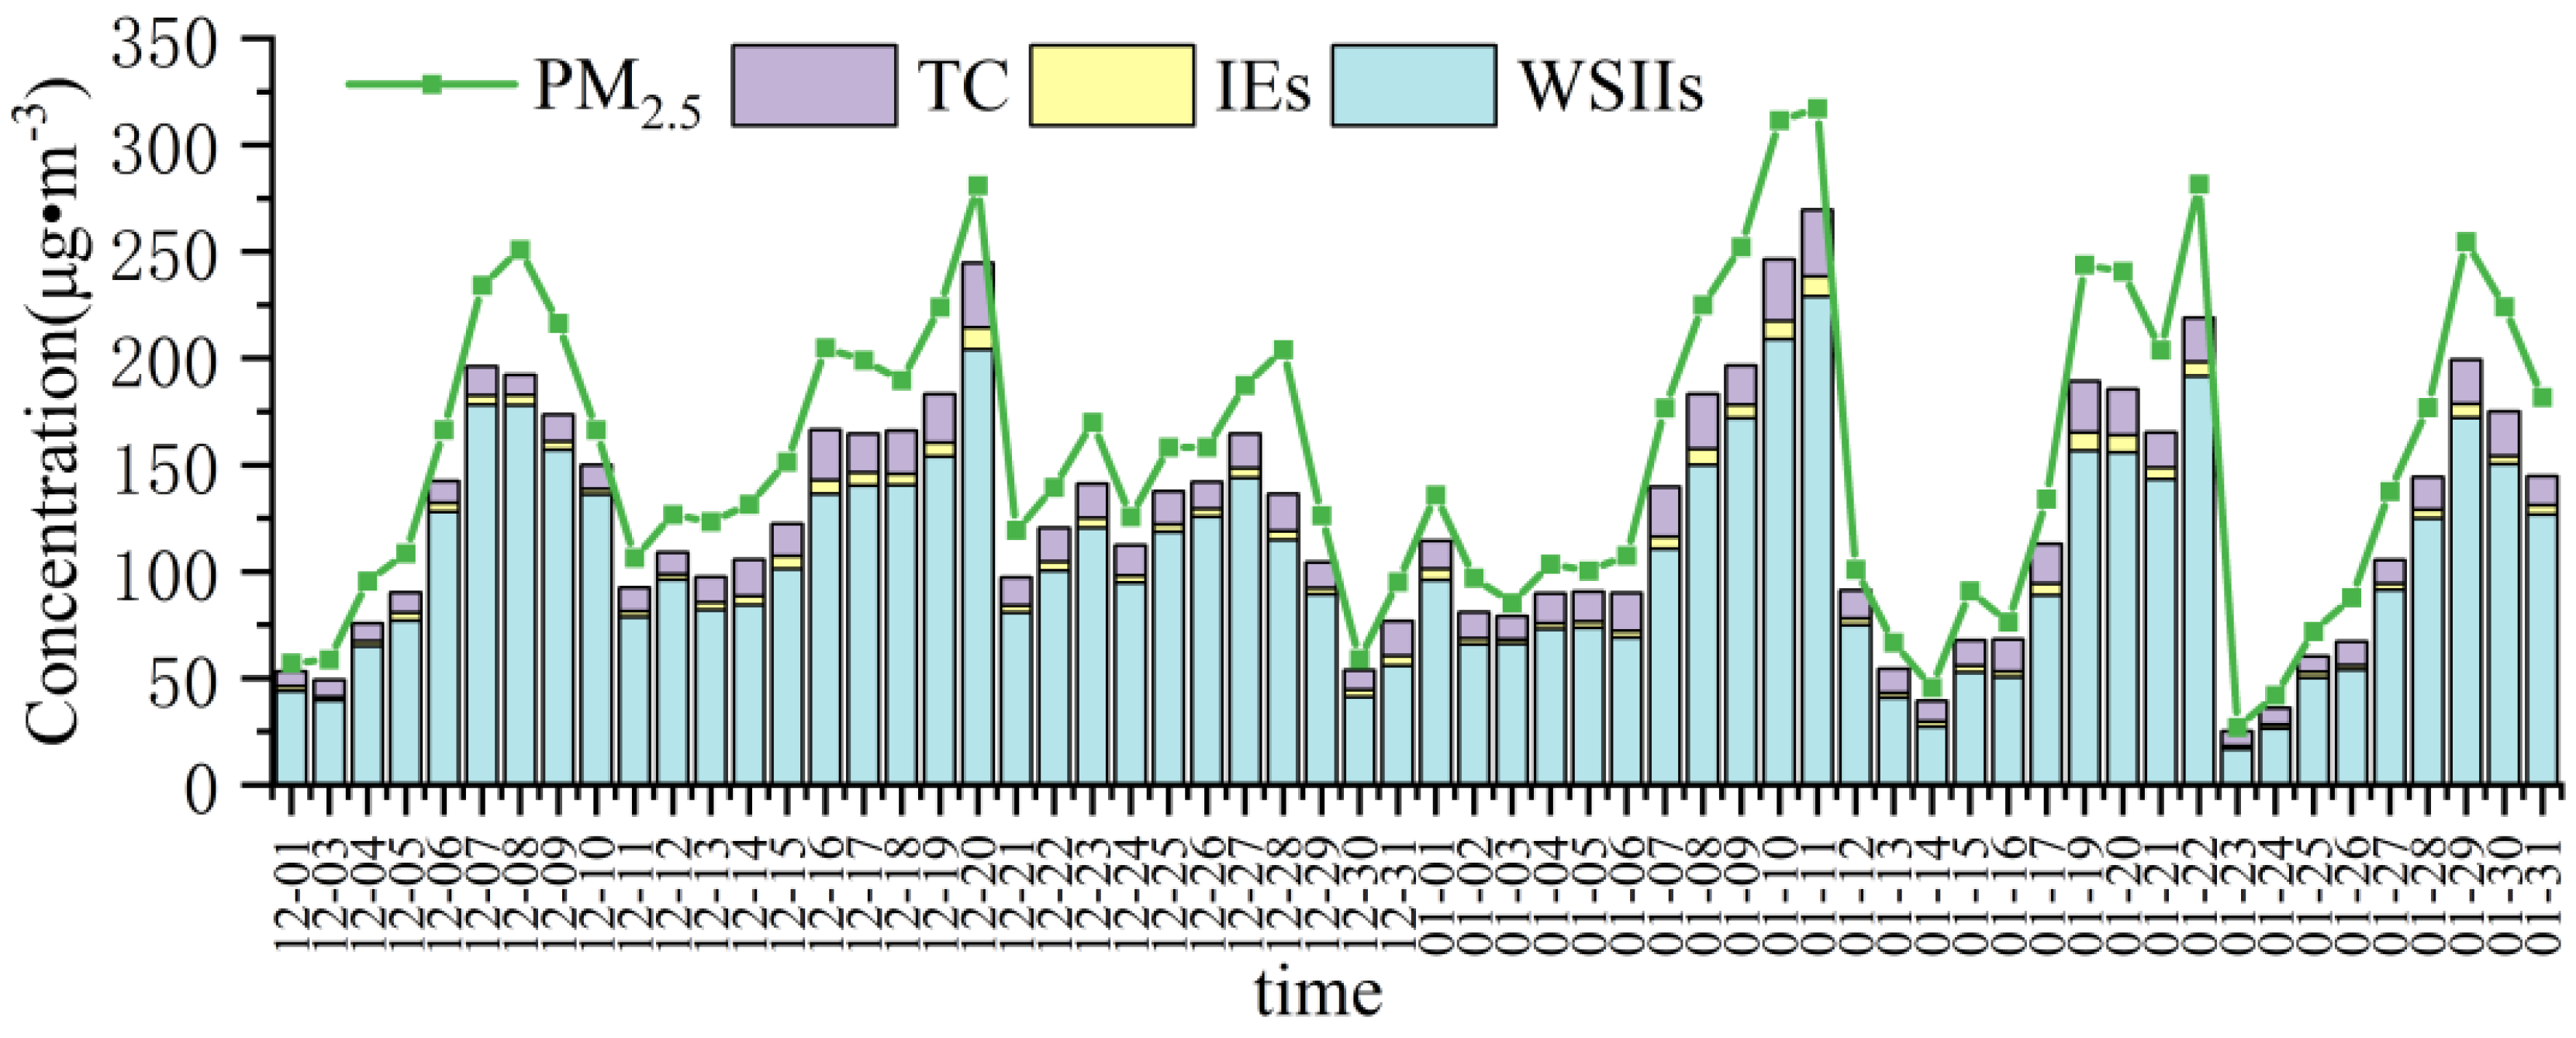
3.1. Characteristicsof PM2.5 Mass Concentration

The daily variations of the PM2.5 mass concentration and the concentrations of water-soluble inorganic ions, carbon components, and inorganic elements in the Shihezi urban area during the observation period are shown in Figure 2. The mass concentration of PM2.5 varies in the range of 28.6–339.6 μg/m3, with an average of 164.69 ± 76.48 μg/m3. Such high PM2.5 concentration is far beyond the secondary concentration limit (75 μg/m3) set in the Chinese National Ambient Air Quality Standard (NAAQS) (GB 3095-2012). The total concentration of water-soluble inorganic ions ranges from 16.63 to 228.92 μg/m3, and its average value is within 106.87 ± 50.42 μg/m3, accounting for 64.9% of the PM2.5 mass concentration. The variation range of total carbon concentration is between 6.89 μg/m3 and 31.12 μg/m3, and the average value is 15.26 ± 5.78 μg/m3, which makes up about 9.3% of the PM2.5 mass concentration. The concentration of inorganic elements varies from 1.50 μg/m3 to 10.19 μg/m3, and the average value is 4.35 ± 2.02 μg/m3, only 2.6% of the mass concentration of PM2.5.
In studying the pollution characteristics of PM2.5 in Shihezi City under different air quality conditions, according to the Chinese NAAQS (GB3095-2012), air quality is classified into six levels: excellent (0–35 µg/m3), good (35–75 µg/m3), mild pollution (75–115 µg/m3), moderate pollution (115–150 µg/m3), heavy pollution (150–250 µg/m3), and serious pollution (≥250 µg/m3). During the period of observation and sampling, there were 53 days on which the daily averaged concentrations of PM2.5 exceeded the standard, and the over-standard rate was 88.3%. The average mass concentration of PM2.5 on clean days (excellent and good) was 54.26 ± 14.48 μg/m3, and those on mild pollution days, moderate pollution days, heavy pollution days, and serious pollution days were 100.21 ± 11.77 μg/m3, 136.96 ± 9.71 μg/m3, 201.9 ± 52.7 μg/m3, and 285.59 ± 31.66 μg/m3, respectively. Thus, the averaged mass concentration of PM2.5 on polluted days reached 3.3 times that on clean days.

3.2. Mass Concentration Characteristics of Chemical Components in PM2.5

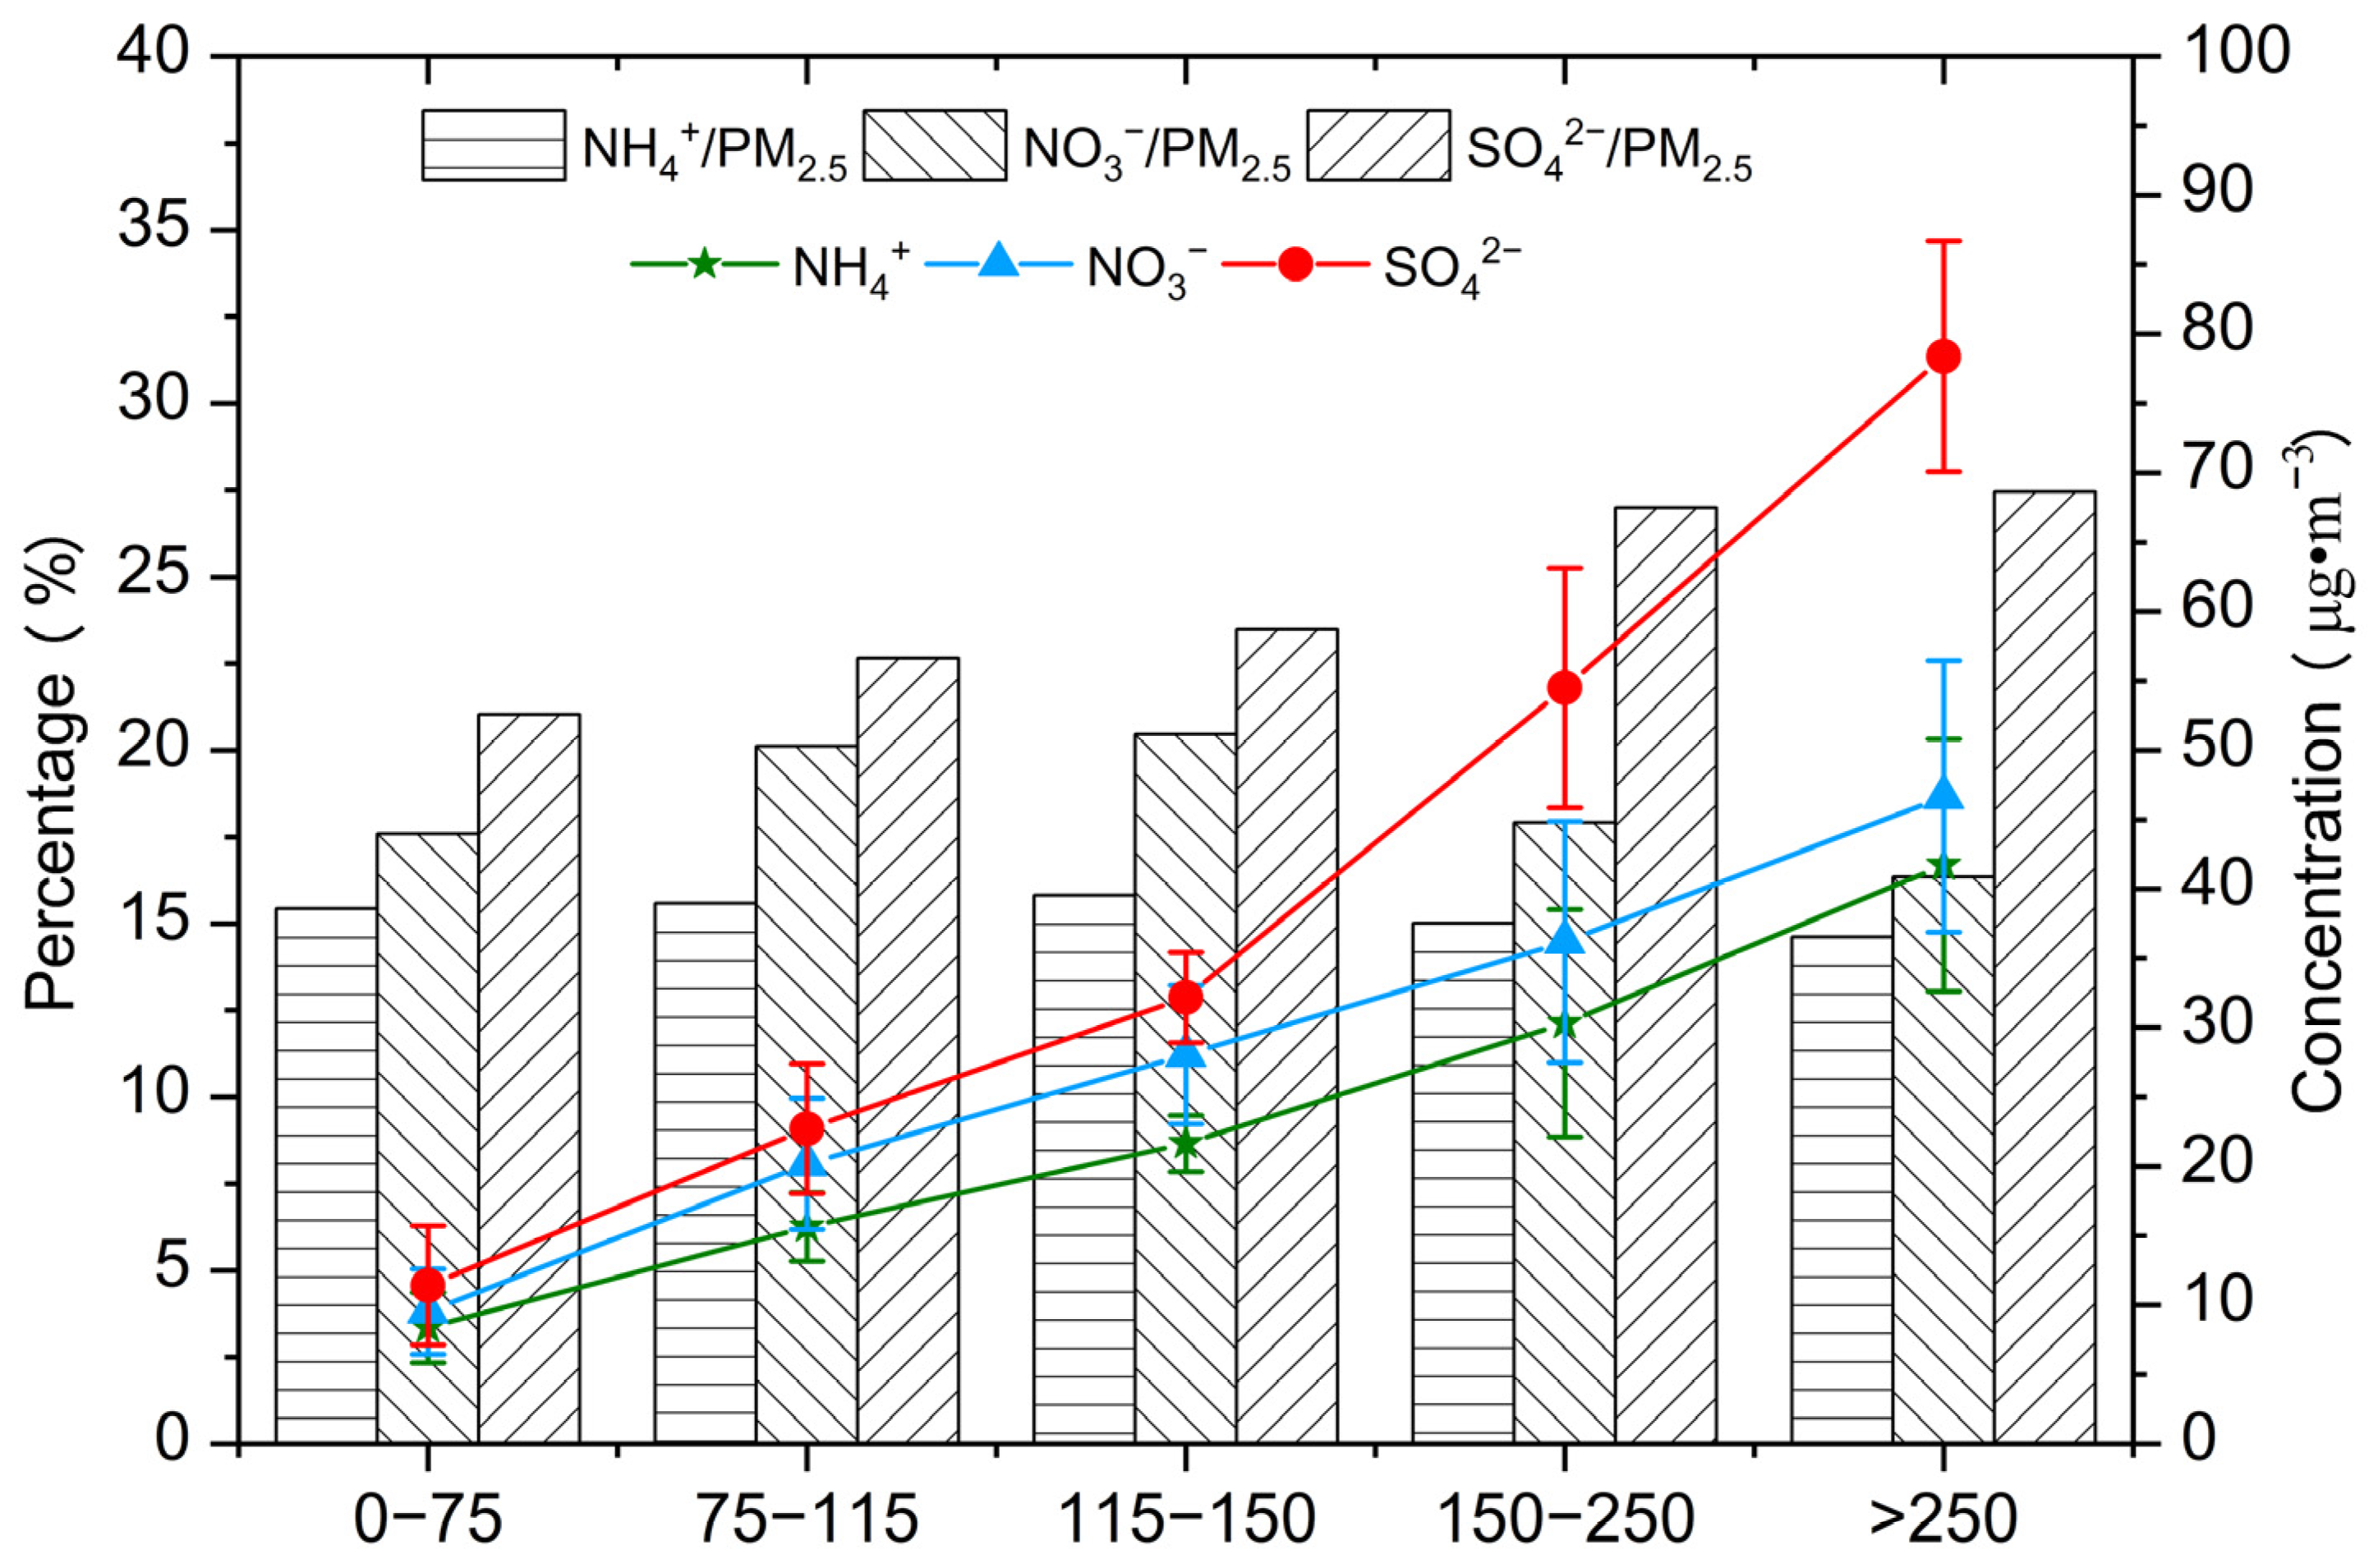
3.2.1. Water-Soluble Inorganic Ions

Water-soluble inorganic ions are the primary components of PM2.5 in winter in the Shihezi urban area, and the mass concentrations of these ions can be ordered as: SO42− (42.48 ± 22.96 μg/m3) > NO3 (29.85 ± 13.36 μg/m3) > NH4+ (24.88 ± 12.10 μg/m3) > Cl (5.27 ± 3.84 μg/m3) > Ca2+ (1.63 ± 0.99 μg/m3) > Na+ (1.54 ± 0.7 μg/m3) > F (0.59 ± 0.47 μg/m3) > K+ (0.27 ± 0.13 μg/m3) > NO2 (0.19 ± 0.19 μg/m3) > Mg2+ (0.17 ± 0.14 μg/m3) (Figure 3). Among them, SO42−, NO3, and NH4+ are the three major water-soluble inorganic ions, accounting for 39.8%, 27.9%, and 23.3% of the mass concentration of water-soluble inorganic ions, respectively, and the three, in total, comprise 91.0% of the mass concentration of water-soluble inorganic ions and 59.0% of the mass concentration of PM2.5, which indicates that the secondary inorganic aerosols are dominant in PM2.5. In addition, Cl comprises 4.9% of the concentration of water-soluble inorganic ions. Cl in the atmosphere mainly originates from fossil fuel combustion and biomass combustion, and some may come from sea salt [30]. Shihezi is an inland city, less affected by sea salt, so Cl is mainly generated by combustion. As for Ca2+ and Na+, their concentrations in precipitation and TSP are higher [31,32], but are lower in PM2.5, indicating that Ca2+ and Na+ mainly exist in coarse particles. The mass concentrations of F, K+, NO2, and Mg2+ are relatively low.
Compared with other cities in China (Table 1), the mass concentration of PM2.5 in Shihezi in winter is higher than the concentrations in Beijing, Tianjin, and Huanggang, and is several times those in Baoshan, Guiyang, and Wenshan, which indicates that the winter pollution in Shihezi is very serious. The concentrations of most water-soluble inorganic ions in Shihezi are apparently higher than in other cities, among which the concentration of NH4+ is 1.9 times that in Huanggang, 3.9 times that in Beijing, 3.3 times that in Tianjin, about 9 times that in Wenshan and Guiyang, and more than 10 times that in Baoshan and Kunming; the concentration of SO42− is 2.2 times that in Beijing, 1.9 times that in Tianjin, 2.8 times that in Huanggang, and about 4–30 times that in other cities; and the concentration of NO3 is slightly lower than that in Huanggang, but higher than in Beijing and Tianjin, and significantly higher than in Baoshan, Kunming, Wenshan, and Guiyang. From the perspective of ion proportion, atmospheric pollution in Chinese cities is dominated mainly by anthropogenic pollutants SO42−, NO3, and NH4+. Compared to data from other cities, SO42−, NO3, and NH4+ occupy a higher proportion in this study, and secondary aerosol pollution is very serious, which is greatly influenced by local pollution sources. The ratio value of NO3/SO42− in atmospheric particulates is usually used to measure the relative contribution of emissions from coal burning and vehicle exhaust to atmospheric PM pollution. The higher the value is, the greater the contribution of vehicle exhaust emission is relative to coal burning. During our sampling, the value of NO3/SO42− in PM2.5 in the Shihezi urban area was 0.70, higher than that in Baoshan, Kunming, Wenshan, and Guiyang, but lower than that in Huanggang, Beijing, and Tianjin. This indicates that, in winter, the contribution of the stationary sources to the local air pollution in Shihezi is greater than that in developed cities, and for those relatively less polluted cities, the moving pollutant sources contribute even more.
Secondary inorganic aerosols (SIAs) are important components of PM2.5 in Shihezi in winter. Under different air quality conditions, the mass concentrations of secondary inorganic aerosols (i.e., SO42−, NO3, NH4+) in PM2.5 are SO42− > NO3 > NH4+ (Figure 4). From clean air to serious pollution, the mass concentration of SO42− increases from 11.42 ± 4.3 μg/m3 to 78.39 ± 8.3 μg/m3, with the ratio of SO42−/PM2.5 rising from 21.0% to 27.5%. On days with heavy or much heavier pollution, SO42− contributes nearly 30% to PM2.5. The mass concentrations of NO3 and NH4+ show an obvious increasing trend with the aggravation of air pollution, but their increasing trend slows down during periods of mild to moderate pollution. However, on heavy or much heavier pollution days, the increasing trend becomes obvious again. As air pollution becomes worse and worse, the values of NO3/PM2.5 and NH4+/PM2.5 first rise and then decline. Specifically, these ratio values tend to keep increasing under the synoptic situation from clean air to moderate pollution, but gradually decrease under weather conditions from moderate to heavy pollution, with the values even below the ratios during clean-air days. The above results suggest that the secondary generation of inorganic salts leads to the rapid rise of PM2.5 in the case of heavy pollution; and the heavier the pollution, the faster its growth rate, and the more obviously the SO42− mass concentration contributes to PM2.5. In addition, with the negative development of pollution, the ratio of NO3/SO42− ascends at first and later descends, indicating that when the PM2.5 mass concentration is below 150 μg/m3, movable sources, such as motor vehicle exhaust, contribute relatively more to air pollution; when PM2.5 mass concentration exceeds 150 μg/m3, the contribution of movable sources to heavy air pollution tends to gradually decrease, but the contribution of fossil fuel combustion and other stationary sources increases unceasingly.

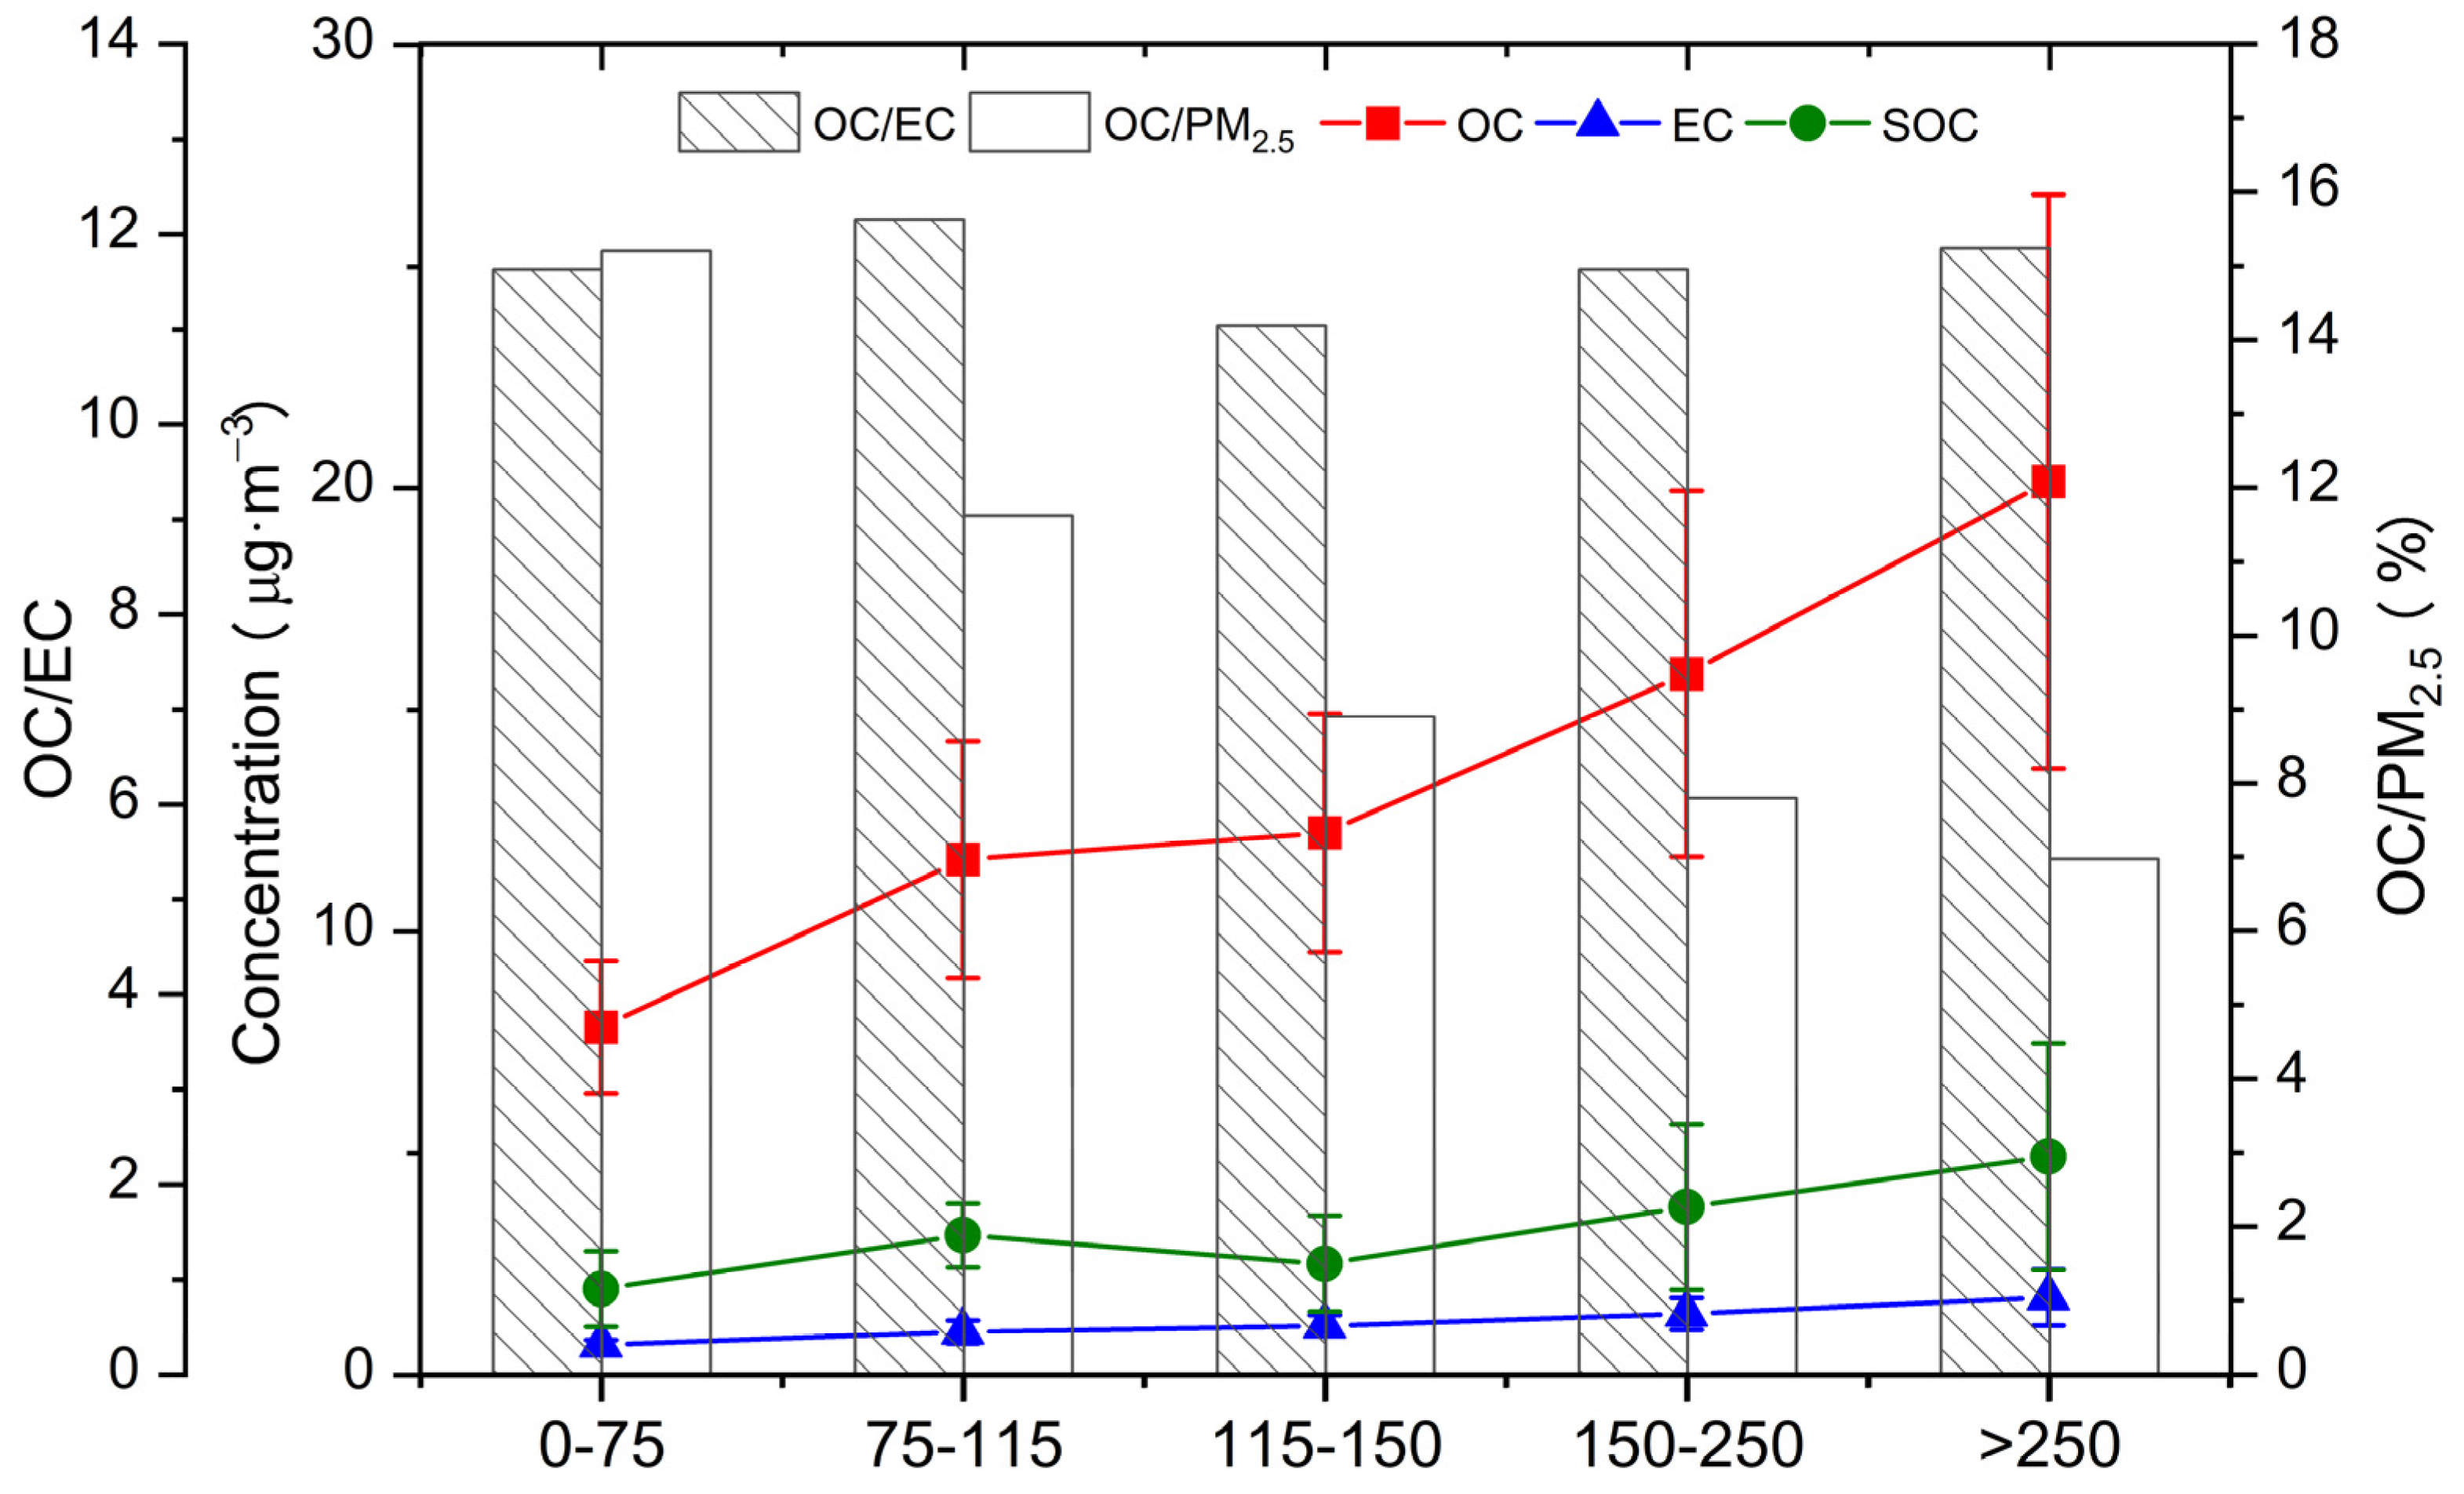
3.2.2. Organic Carbon and Elemental Carbon

Total carbon (TC) is usually composed of organic carbon (OC) and elemental carbon (EC), of which OC consists of primary organic carbon (POC) and secondary organic carbon (SOC). In this paper, the empirical formula proposed by Castro et al. [38] is adopted in order to estimate the concentrations of POC and SOC:
POC = EC × (OC/EC)min
SOC = OC − POC
where (OC/EC)min is the daily mean minimum value of the mass concentration ratio of OC to EC during the sampling period.
The mass concentration of total carbon (TC) in PM2.5 in winter in the Shihezi urban area ranges from 6.89 μg/m3 to 31.12 μg/m3, and its average mass concentration is 15.26 ± 5.78 μg/m3, accounting for 9.3% of the mass concentration of PM2.5. The variation of the OC mass concentration ranges from 6.29 μg/m3 to 28.76 μg/m3, and its average mass concentration is 14.04 ± 5.32 μg/m3, making up 92% of the mass concentration of TC, which denotes that those carbonaceous aerosols are dominated by OC. With regard to the situation in other cities, the OC concentration in Shihezi is lower than the values in Shijiazhuang (26.5 ± 21.7 μg/m3), Tianjin (18.8 ± 12.9 μg/m3), and Beijing (18.2 ± 13.8 μg/m3) [37], and close to that in Chengdu (14.50 μg/m3) [39], but higher than in Xi’an (13.02 ± 6.69 μg/m3) [40], Shanghai (11.8 μg/m3) [41], Shenzhen (13.2 μg/m3), and Zhuhai (12.2 μg/m3) [42]. The mass concentration of EC varies from 0.49 μg/m3 to 2.47 μg/m3, and its average mass concentration is 1.22 ± 0.48 μg/m3.
On clean days in Shihezi City, the average mass concentration of OC in PM2.5 is 7.84 ± 1.49 μg/m3, accounting for 15.2% of PM2.5 mass concentration. As pollution is aggravated, the OC concentration in PM2.5 can gradually climb to 20.15 ± 6.47 μg/m3 (Figure 5). However, because the growth range of OC concentration is not as great as that of PM2.5, the ratio of OC/PM2.5 keeps declining, to 7.8%. Similarly, the mass concentration of EC also grows gradually with the rising level of pollution, but its contribution to the mass concentration of fine particulate matter remains at around 1%, due to its low concentration. Conversely, the mass concentration of SOC increases significantly with the aggravation of air pollution, except during episodes of moderate pollution, and, accordingly, the SOC/OC ratio also follows an increasing trend, which demonstrates that SOC contributes much more to OC when pollution is serious, and the secondary transformation is an important part of particulate matter in the process of heavy pollution. Coal-fired heating in winter raises the emission of organic gases and carbonaceous aerosols, while the adverse meteorological conditions during heavy pollution episodes can cause air pollutants to remain in the atmosphere for a long time, promoting the generation of SOC. Therefore, the emission conditions and meteorological factors in winter compensate for the low temperature element that is not conducive to the generation of SOC, resulting in the apparent increase of SOC mass concentration in Shihezi in winter, with the worsening of pollution.
OC/EC is usually used to characterize the emission and transformation process of carbonaceous aerosols [43]. The value of OC/EC exceeding 2.0 indicates that secondary pollution has occurred [42]. It is generally believed that when the OC/EC value is between 1.0 and 4.2, air pollution is primarily caused by motor vehicles; when the OC/EC value ranges from 2.5 to 10.5, the carbonaceous aerosols are mainly produced by coalburning; and when the OC/EC value varies within 8.1–12.7, biomass combustion becomes the major supplier for carbonaceous aerosols [44,45,46]. In this study, the OC/EC ratio ranges from 8.72 to 15.36, with an average of 11.67, suggesting that the carbonaceous aerosols in PM2.5 in the Shihezi urban area are mainly affected by traffic sources and coal-burning emissions, as well as by biomass combustion to a certain extent [47].

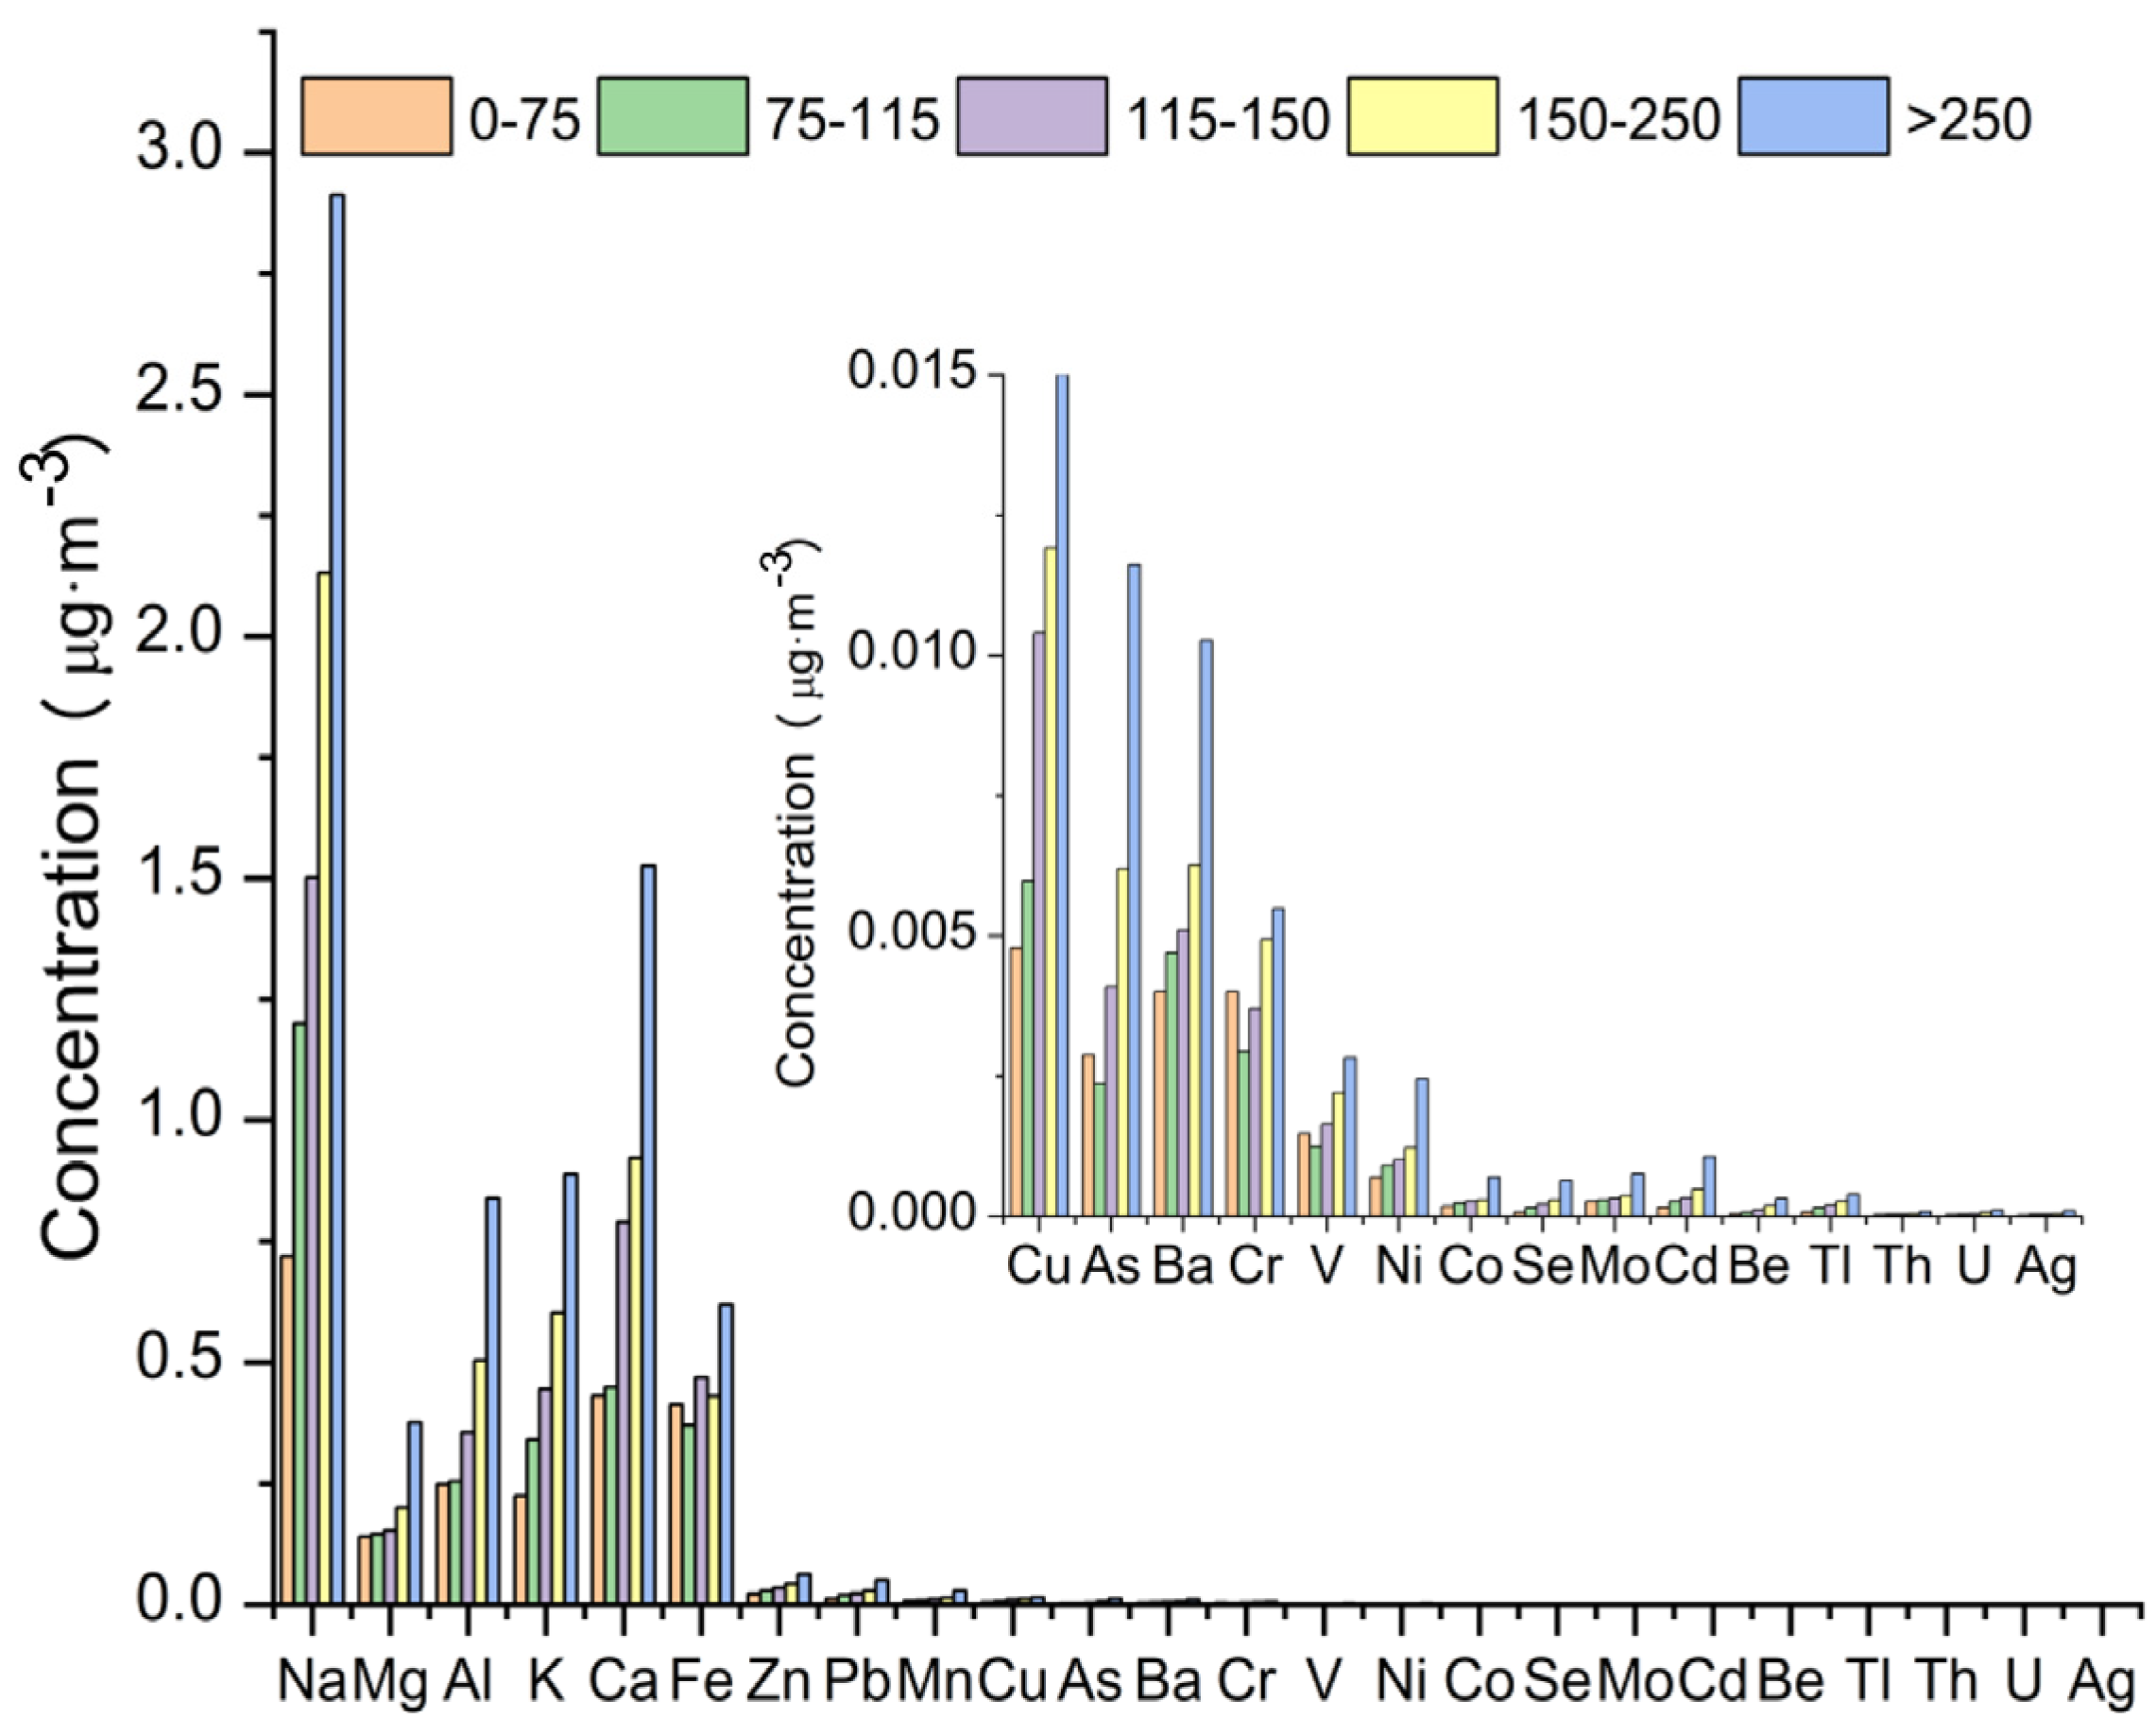
3.2.3. Inorganic Elements

The average concentration of inorganic elements in the Shihezi urban area in winter is 4.35 μg/m3, or 2.6% of the mass concentration of PM2.5, and there have been 24 inorganic elements detected, whose concentrations are arrayed in the following order: Na > Ca > K > Fe > Al > Mg > Zn > Pb > Mn > Cu > Ba > As > Cr > V > Ni > Cd > Mo > Co > Se > Tl > Be > U > Ag > Th, among which crustal elements such as Na, Ca, Fe, and Al have higher mass concentrations, accounting for 80.9% of inorganic elements, so the inorganic elements in PM2.5 mainly come from soil. Figure 6 shows the concentrations of inorganic elements during different air qualities. It is seen from the figure that on clean-air days, the average concentration of inorganic elements in PM2.5 is 2.23 μg/m3, taking up 4.1% of PM2.5 mass concentration. As pollution becomes heavier and heavier, the concentration of inorganic elements in PM2.5 gradually rises to 7.35 μg/m3, but this is still smaller than the increase degrees of other main components in PM2.5; thus, its proportion decreases to 2.6% of PM2.5. The concentration of Pb is averaged at 0.03 μg/m3, and its concentration during clean-air days is only 0.01 μg/m3. However, as pollution worsens, its concentration grows gradually and reaches 0.05 μg/m3 during episodes of severe pollution.

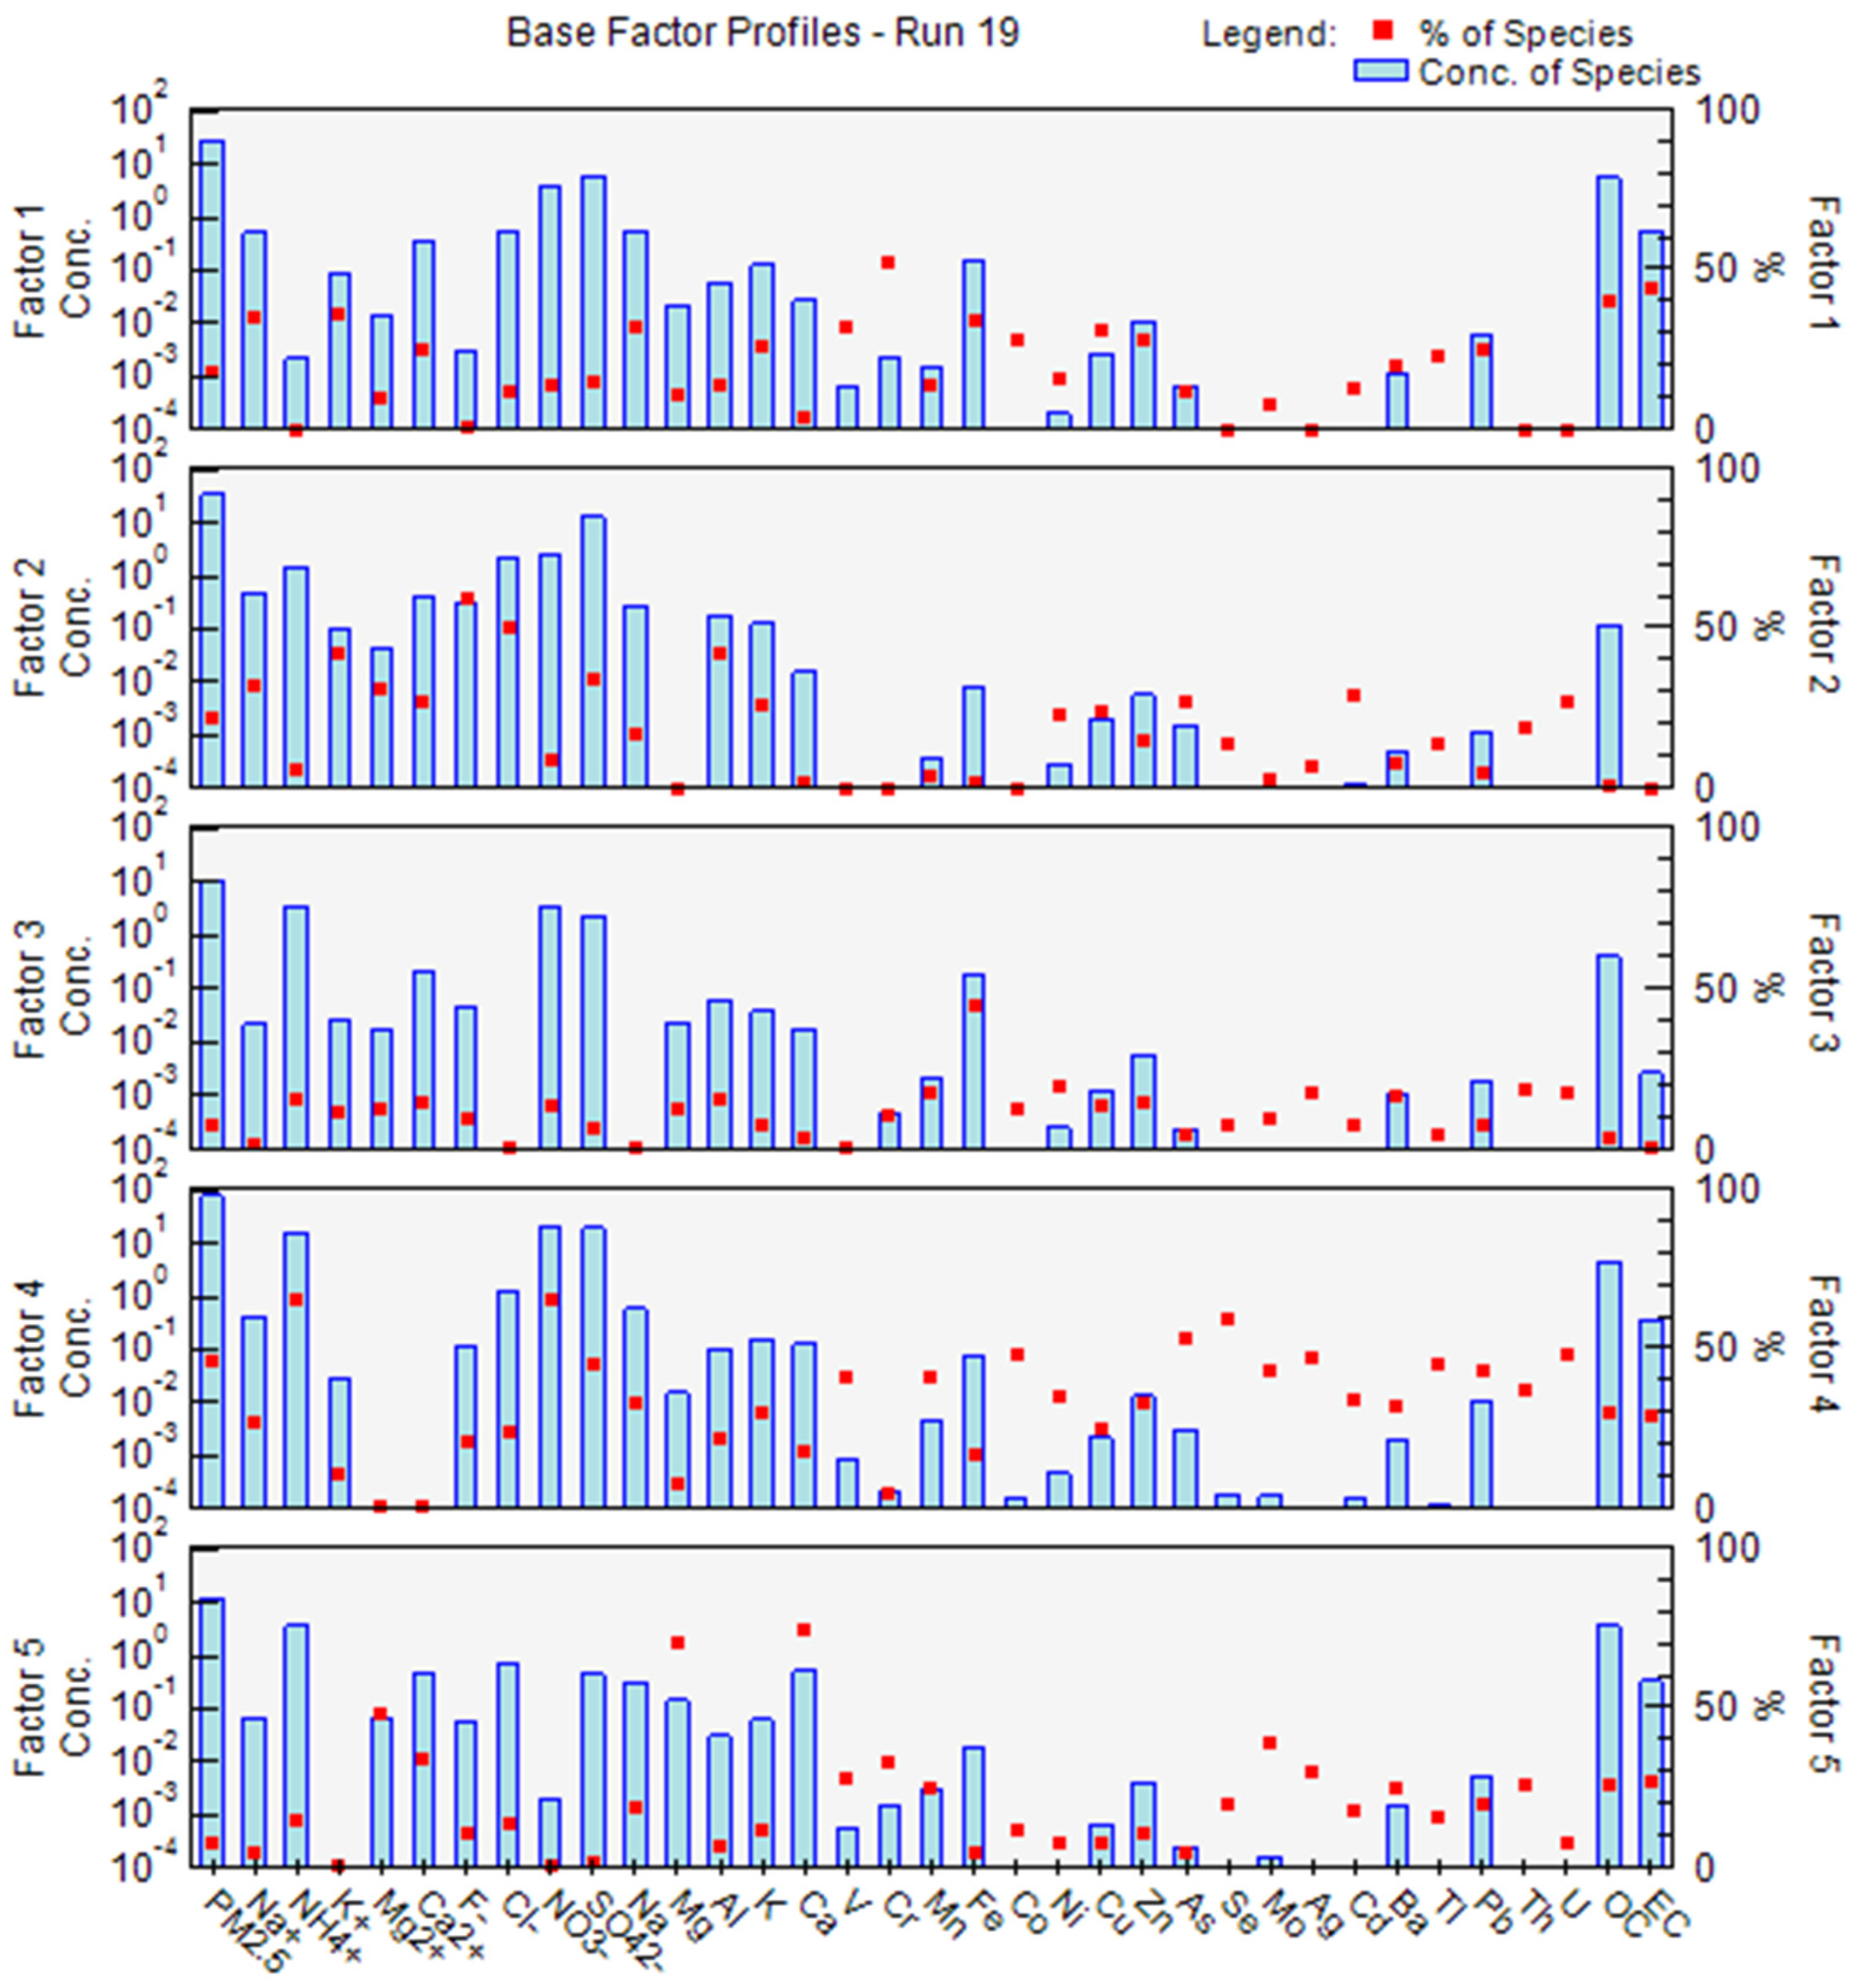
3.3. Source Apportionment by PMF

In order to further and analyze the contribution of different pollution sources to PM2.5 concentrations, the data of PM2.5 and chemical compositions were input into the PMF5.0 model, which quantitatively parsed their contributions [48]. After the model’s optimization calculation, the five major pollution sources—coal-burning sources, secondary sources, industrial sources, motor vehicle sources, and flying dust sources—were finally obtained (Figure 7).
In factor 1, NO3, Mn, Cu, Zn, Cr, OC, and EC contribute relatively more than other components to PM2.5, among which NO3, OC, and EC come mainly from automobile exhaust emissions and gasoline combustion, while Mn, Cu, and Zn are mainly from automobile exhaust and tire wear. Therefore, factor 1 is determined to be motor vehicles, whose contribution to PM2.5 is 17.8% of the total sources. In factor 2, SO42−, Cl, F, As, Se, Zn, and Cu all have higher contributions to PM2.5. Generally, Cl can be taken as the characteristic component of coal-burning emissions, and As and Se can also be used as identifying elements of coal burning. Hence, factor 2 is determined to be coal burning, and its contribution accounts for 22.4% of the total sources. The main load elements in factor 3 contain mostly inorganic elements, of which Zn, Cu, and Fe are inseparable from industrial production and metal processing and contribute more to PM2.5, so factor 3 is considered industrial pollution, and its contribution accounts for 6.8% of the total sources. In factor 4, the secondary ions, such as SO42−, NO3, and NH4+, contribute significantly to PM2.5, showing obvious characteristics of secondary sources, so factor 4 is judged as emissions from secondary sources, with its contribution accounting for 45.8% of the total source, which makes it the source with the largest contribution percentage. In factor 5, the contributions of Ca and Mg to PM2.5 are relatively higher, and the two elements are usually considered to be typical characteristic components of flying dust, so this factor is judged to be that of flying dust, and accounts for 7.2% of the contribution from the total sources. To sum up, the major pollution sources of PM2.5 in Shihezi City in winter include these 5 types, i.e., secondary sources, coal burning sources, motor vehicle sources, industrial sources, and flying dust sources, among which the secondary sources contribute the most to PM2.5. Therefore, in order to alleviate the winter pollution in the Shihezi region, more attention should be paid to the control of precursors of secondary sources, on the basis of strengthening the control of coal-burning and motor vehicle emissions, and other primary emission sources.

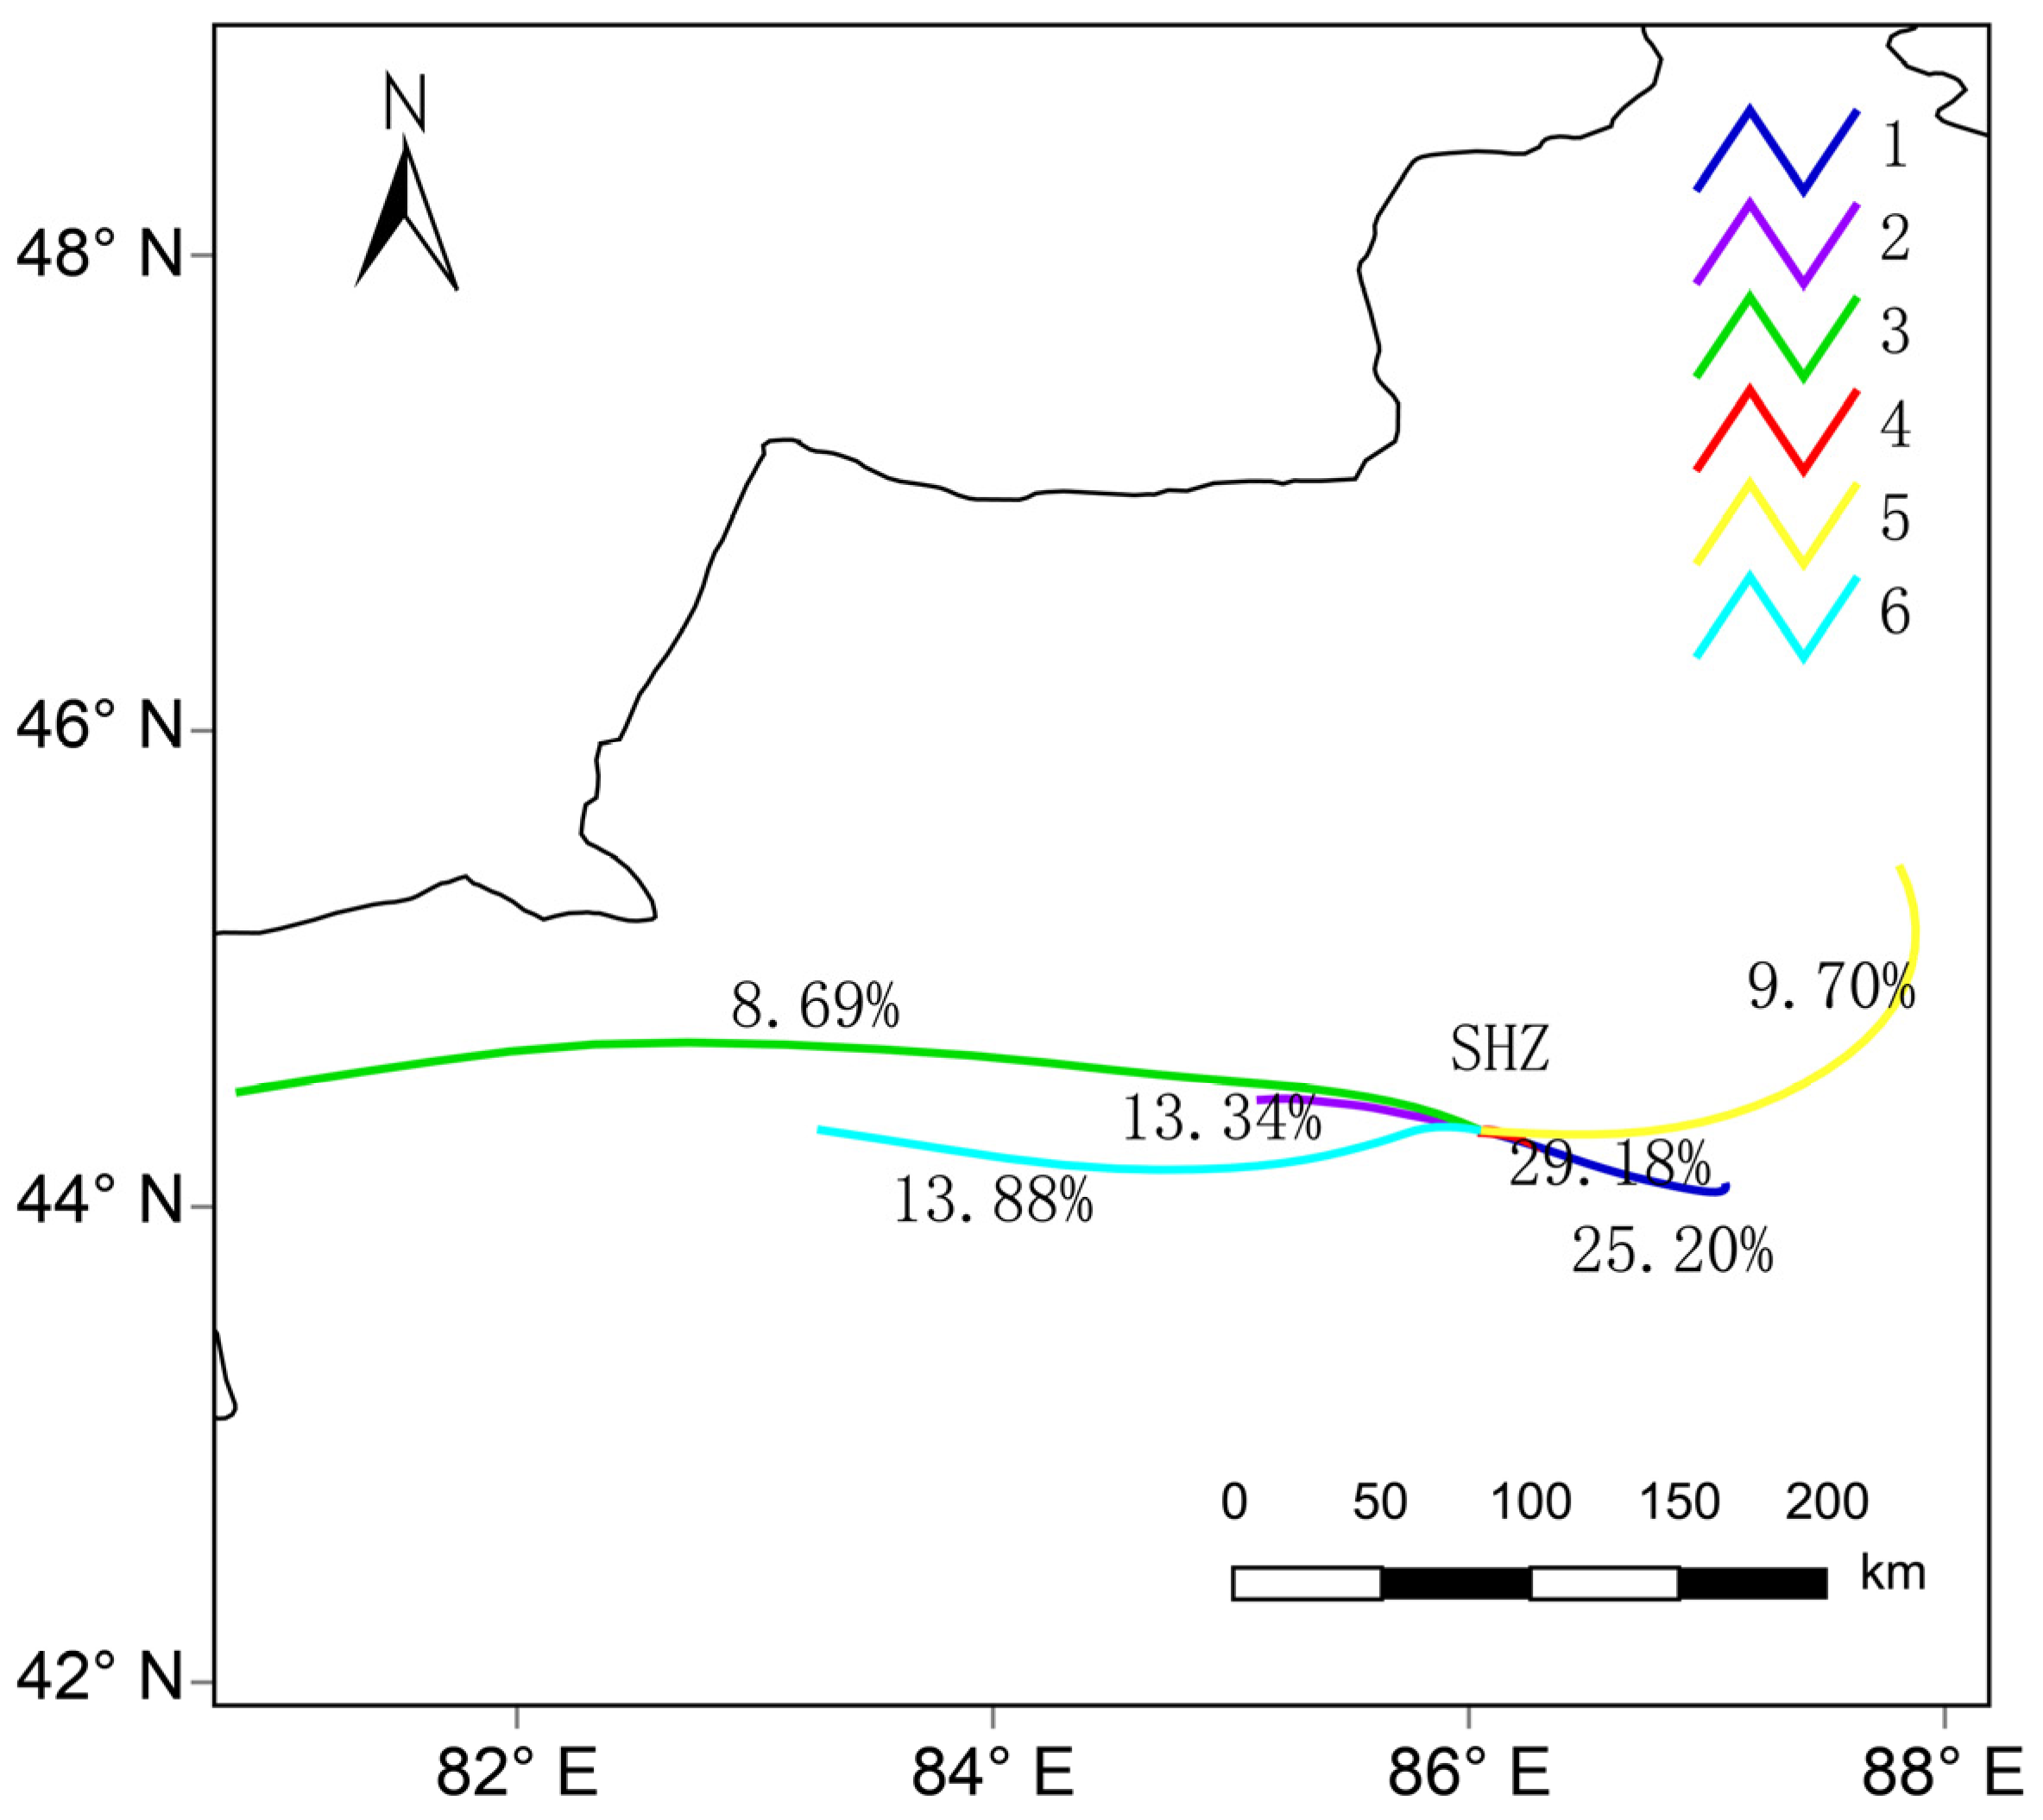
3.4. Backward Trajectory Analysis

The inversion layer in Shihezi City is low in winter, and the air in its airflow path in upper central Asia and the northern Junggar Basin is relatively clean [49,50], so we chose the backward trajectory of 24 h airflow at 500 m height in Shihezi during the observation period, and used The Hybrid Single Particle Lagrangian Integrated Trajectory Model (HYSPLIT) (HYSPLIT)model for cluster analysis (Figure 8). According to the origin and transport routes of air mass trajectories, the major flow field is divided into six types of air mass transport paths, and the mean concentrations of PM2.5 in different trajectories are counted.
In combination with Table 2, we can see that, during the sampling process, Mongolian cold high pressure plays an obvious controlling role, causing about 35.91% of airflow to come from the west, while 64.08% comes from the east; thus, the latter is the main transport direction of PM2.5 mass concentration to Shihezi City in winter. Starting from the Yili River Valley, Trajectory 3 passes through Bole, Kuitun, and other cities in the economic belt on the northern slope of the Tianshan Mountains. Although this trajectory occupies only 8.96% of the six paths, the PM2.5 concentration it carries can reach up to 175.67 μg/m3. Trajectory 6 refers to another air mass from the west, which passes through the Shawan Industrial Zone from Jinghe along the Tianshan Mountains. It accounts for 13.88% of the airflow from the six paths, but the mass concentration of PM2.5 with it peaks at a value of 218.90 μg/m3. Trajectory 2, moving slowly through a short airflow track, is also from the west, and passes through Kuitun and Shawan. Its percentage among the six paths is 13.34%, and the average concentration of PM2.5 it carries is 167.90 μg/m3. Although the proportions of the above three trajectories are not great among the six paths, they carry high-value PM2.5 mass concentrations, which is attributed to their passing through more seriously-polluted regions. Trajectories 1 and 4 come from the east. Trajectory 4 originates from the local pollution in Manas, while Trajectory 1 originates from the short-distance airflow from the Urumqi–Changji region. The PM2.5 concentrations of these two tracks are relatively low, but the percentage of airflow they account for among the six paths (Trajectory 4 has the peak proportion followed by Trajectory 1) is as high as 54.38%, in total, so these two trajectories are the main providers for the winter air pollution in Shihezi City. Finally, Trajectory 5 comes from the southern margin of the Junggar Basin, with a longer track and lower PM2.5 concentration, thus having very little influence on the winter pollution in Shihezi. In summary, Shihezi is under the control of Mongolian high pressure in winter, and has stable stratification and a thick inversion layer, which is not good for the diffusion of air pollutants. The heavy pollution in Shihezi in winter is mainly affected by the local pollutants in Manas and the short-distance pollutant transport from the Urumqi–Changji region.

4. Conclusions

In this paper, we have probed the mass concentration of PM2.5 and its chemical components in Shihezi City in winter, based on observation and sampling from 1 December 2020 to 31 January 2021, and obtained the following conclusions:
The variation range of the winter PM2.5 mass concentration in Shihezi urban area is 28.6–339.6 μg/m3, with a mean mass concentration of 164.69 ± 76.48 μg/m3. Water-soluble ions, total carbon, and inorganic elements account for 64.9%, 9.3%, and 2.6% of the PM2.5 mass concentration, respectively. During the two-months observation and sampling period, the average daily concentration of PM2.5 exceeded the second-grade concentration limit (75 μg/m3) for 53 days, resulting in an over-standard rate of 88.3%. The mass concentration of PM2.5 on polluted days was 3.3 times that on clean-air days. SO42−, NO3, and NH4+ (SIAs) are the most important water-soluble inorganic ions, accounting for 59.0% of the PM2.5 mass concentration. The heavier the pollution, the more obvious the contribution of SIAs to PM2.5, showing that the secondary generation of inorganic salts is the major cause for the rapid rise of PM2.5 on heavy pollution days. Organic carbon (OC) is the most important carbonaceous aerosol, accounting fora percentage of 8.5% in the PM2.5 mass concentration. As the pollution is aggravated, the ratio value of OC/PM2.5 descends, but that of SOC/OC ascends, which indicates that the secondary transformation of total carbon in the process of heavy pollution cannot be ignored. Inorganic elements account for a relatively small proportion of about 3% in PM2.5, of which the crustal elements, such as Na, Ca, Fe, and Al, have higher mass concentrations, accounting for 80.9% of inorganic element contribution, indicating that soil is the major source of inorganic elements in PM2.5.
The PMF model was used to determine the five contributing factors: secondary sources (45.8%), coal burning sources (22.4%), motor vehicle sources (17.8%), industrial sources (6.8%), and flying dust sources (7.2%). Secondary sources contribute the most to PM2.5. Therefore, while continuing to enhance the control of primary emission sources, such as coal burning and motor vehicles, we should also pay more attention to the control of secondary source precursors. Based on the backward trajectory clustering analysis, Shihezi is found to be apparently affected by Mongolian cold high pressure in winter. As a result, about 35.91% of airflow comes from the west, and 64.08% from the east. In addition, the atmosphere in Shihezi is stable, and the temperature inversion layer is thick in winter. Such a synoptic condition is not helpful at all in enabling air pollutants to disperse. In short, the winter pollution in Shihezi City is mainly caused by the local pollutants in Manas and the short-distance transport of pollutants from the Urumqi–Changji Region.

Author Contributions

Conceptualization, Y.Z. and Y.H.; methodology, Y.Z. and X.L. (Xia Li); formal analysis, Y.Z. and X.L. (Xia Li); investigation, Y.H. and X.L. (Xinchun Liu); resources, Y.H.; writing—original draft preparation, Y.Z.; writing—review and editing, Y.Z. and Y.H.; visualization, Y.Z., S.L. and M.A. All authors have read and agreed to the published version of the manuscript.

Funding

This research was funded by the Xinjiang Natural Science Foundation (Grant No. 2022D01A161, 2022D01A364), the Xinjiang Meteorological Bureau Science and Technology Innovation Development Fund Project (Grant No. MS202303), the National Natural Science Foundation of China (Grant No. 42205010) and The Third Comprehensive Scientific Expedition Project of Xinjiang (Grant No. 2021xjkk1102).

Institutional Review Board Statement

Not applicable.

Informed Consent Statement

Not applicable.

Data Availability Statement

The datasets analyzed during the current study are available from the corresponding author on reasonable request.

Acknowledgments

Thanks, are also extended to members of the Shihezi Meteorological Bureau and the Chinese Research Academy of Environmental Sciences, for their support and many contributions to the project.

Conflicts of Interest

The authors declare that they have no known competing financial interest or personal relationship that could have appeared to influence the work reported in this paper.

References

  1. Tang, X.Y.; Zhang, Y.H.; Shao, M. Atmospheric and Environmental Chemistry, 2nd ed.; Higher Education Press: Beijing, China, 2006; pp. 365–446. [Google Scholar]
  2. Liu, F.; Tan, Q.; Jiang, X.; Yang, F.; Jiang, W. Effects of relative humidity and PM2.5 chemical compositions on visibility impairment in Chengdu, China. J. Environ. Sci. 2019, 86, 15–23. [Google Scholar] [CrossRef]
  3. Zhao, L.; Wang, L.; Tan, J.; Duan, J.; Ma, X.; Zhang, C.; Ji, S.; Qi, M.; Lu, X.H.; Wang, Y. Changes of chemical composition and source apportionment of PM2.5 during 2013–2017 in urban handan, China. Atmos. Environ. 2019, 206, 119–131. [Google Scholar] [CrossRef]
  4. Yang, L.X. Characteristics, Source Apportionment and Influence on Visual Range of PM2.5 in Jinna. Ph.D. Thesis, Shandong University, Jinan, China, 2008. [Google Scholar]
  5. Wang, J.; Zhao, B.; Wang, S.; Yang, F.; Xing, J.; Morawska, L.; Ding, A.; Kulmala, M.; Kerminen, V.M.; Kujansuu, J. Particulate matter pollution over China and the effects of control policies. Sci. Total Environ. 2017, 584–585, 426–447. [Google Scholar] [CrossRef] [PubMed]
  6. Suwubinuer, R.; Yusan, T.; Dilnuer, T.; Wang, X.; Ding, X. Chemical characterization and source apportionment of PM2.5 in urban area of hotan city, China. Res. Environ. Sci. 2018, 31, 823–833. [Google Scholar] [CrossRef]
  7. Wang, H.; Zhu, B.; Shen, L.; Xu, H.; An, J.; Xue, G.; Cao, J. Water-soluble ions in atmospheric aerosols measured in five sites in the Yangtze river delta, China: Size-fractionated, seasonal variations and sources. Atmos. Environ. 2015, 123, 370–379. [Google Scholar] [CrossRef]
  8. Xu, L.; Duan, F.; He, K.; Ma, Y.; Zhu, L.; Zheng, Y.; Xu, B. Characteristics of the secondary water-soluble ions in a typical autumn haze in Beijing. Environ. Pollut. 2017, 227, 296–305. [Google Scholar] [CrossRef] [PubMed]
  9. Feng, Y.P.; Zhang, J.K.; Huang, X.J.; Liu, Q.; Zhang, W.; Zhang, J.Q. Pollution characteristics of water-soluble inorganic ions in Chengdu in summer and winter. Environ. Sci. 2020, 41, 3012–3020. [Google Scholar] [CrossRef]
  10. Li, H.; Bao, J.M.; Bi, F.; Gao, R.; Peng, L.; Xu, Y.S.; Chai, F.H. Synergistic control of PM2.5 and ozone pollution: Challenges and responses. World Environ. 2020, 5, 24–29. [Google Scholar]
  11. Li, A.N.; Wen, T.X.; Hua, W.; Yang, Y.; Meng, Z.; Hu, B.; Xin, J. Characterization and size distribution of carbonaceous aerosols at Mountain Dinghu. Environ. Sci. 2020, 41, 3908–3917. [Google Scholar] [CrossRef]
  12. Wu, X.F.; Chen, C.R.; Vu, T.V.; Liu, D.; Harrison, R.M. Source apportionment of fine organic carbon (OC) using receptor modelling at a rural site of Beijing: Insight into seasonal and diurnal variation of source contributions. Environ. Pollut. 2020, 266, 115078. [Google Scholar] [CrossRef]
  13. Wang, C.; Cao, J.Y.; Duan, X.L.; Chen, H.; Yan, Y.L.; Peng, L. Characteristics and sources analysis of carbonaceous components in PM2.5 in winter in four cities of Shanxi Province. Environ. Eng. 2021, 39, 114–121. [Google Scholar] [CrossRef]
  14. Dong, G.M.; Tang, G.Q.; Zhang, J.K.; Liu, Q.; Yan, G.X.; Chen, M.M.; Gao, W.K.; Wang, Y.H.; Wang, S.Y. Characteristics of carbonaceous species in PM2.5 in southern Beijing. Environ. Sci. 2020, 41, 4374–4381. [Google Scholar] [CrossRef]
  15. Chen, P.F.; Kang, S.C.; Tripathee, L.; Ram, K.; Li, C. Light absorption properties of elemental carbon (EC) and water-soluble brown carbon (WS-BrC) in the Kathmandu Valley, Nepal: A 5-year study. Environ. Pollut. 2020, 261, 114239. [Google Scholar] [CrossRef] [PubMed]
  16. Zhao, Q.; Li, X.R.; Wang, G.X.; Zhang, L.; Yang, Y.; Liu, S.Q.; Sun, N.; Huang, Y.; Lei, W.K.; Liu, X.G. Chemical composition and source analysis of PM2.5 in Yuncheng, Shanxi Province in autumn and winter. Environ. Sci. 2021, 42, 1626–1635. [Google Scholar] [CrossRef]
  17. Zhou, A.Q.; Liu, J.W.; Zhou, X.; Bi, S.Q.; Zhang, B.H.; Gao, Y.; Cao, H.B. Concentrations, sources, and health risks of PM2.5 carrier metals in the Beijing urban area and suburbs. Environ. Sci. 2021, 42, 2595–2603. [Google Scholar] [CrossRef]
  18. Guo, J.P.; Zhang, X.Y.; Wu, Y.R.; Zhaxi, Y.; Ba, L.; Wang, W.; Li, X.W. Spatio-temporal variation trends of satellite-based aerosol optical depth in China during 1980–2008. Atmos. Environ. 2011, 45, 6802–6811. [Google Scholar] [CrossRef]
  19. Wu, D. Hazy weather research in China in the last decade: A review. Acta Sci. Circumstantiae 2012, 32, 257–269. [Google Scholar] [CrossRef]
  20. Chen, B.Y. Build Tianshan mountain north slope economic development belt of Xinjiang China. China Soft Sci. Mag. 2002, 3, 92–95. [Google Scholar] [CrossRef]
  21. Cai, R.; Li, X.; Zhao, K.M.; Wang, L.; Qin, H.; Feng, Z.M. The air pollution characteristics and the impact of meteorological conditions in Urumqi. Environ. Sci. Technol. 2014, 37, 40–48. [Google Scholar] [CrossRef]
  22. Li, S.T.; Li, X.; Mauren, A.; Zhong, Y.T.; Wang, H.Q. Characteristics of air pollution and its polluted weather types of urban agglomeration on the north slope of the middle Tianshan Mountains from 2017 to 2019. Arid. Land Geogr. 2022, 45, 1082–1092. [Google Scholar] [CrossRef]
  23. Sun, X.Y.; Liu, Y.; Kou, J.Z. The Causes of Heavy Atmospheric Pollution in the Beijing-Tianjin-Hebei Region and Surrounding Areas Are Clearer. People’s Daily, 21 March 2019. [Google Scholar]
  24. Zheng, X.; Cheng, J.; Liu, Z.; Li, M.; Ning, J.; Lu, J. Characteristics and source apportionment of organic carbon and elemental carbon in PM2.5 in Shihezi, Xinjiang, China. Environ. Chem. 2018, 37, 115–122. [Google Scholar] [CrossRef]
  25. Paatero, P.; Tapper, U. Analysis of different modes of factor analysis as least squares fit problems. Chemom. Intell. Lab. Syst. 1993, 18, 183–194. [Google Scholar] [CrossRef]
  26. Ning, P. Chemical composition and source apportionment of PM2.5 in a border city in southwest China. Atmosphere 2021, 13, 7. [Google Scholar] [CrossRef]
  27. Ikemori, F.; Uranishi, K.; Asakawa, D.; Nakatsubo, R.; Sugata, S. Source apportionment in PM2.5 in central Japan using positive matrix factorization focusing on small-scale local biomass burning. Atmos. Pollut. Res. 2021, 12, 349–359. [Google Scholar] [CrossRef]
  28. Stein, A.F.; Draxler, R.R.; Rolph, G.D.; Stunder, B.J.B.; Cohen, M.D.; Ngan, F. NOAA’s HYSPLIT atmospheric transport and dispersion modeling system. Bull. Am. Meteorol. Soc. 2015, 96, 2059–2077. [Google Scholar] [CrossRef]
  29. Rolph, G.; Stein, A.; Stunder, B. Real-Time Environmental Applications and Display System: READY. Environ. Modell. Softw. 2017, 95, 210–228. [Google Scholar] [CrossRef]
  30. Jiang, N.; Yin, S.S.; Guo, Y.; Li, J.Y.; Kang, P.R.; Zhang, R.Q.; Tang, X.Y. Characteristics of mass concentration, chemical composition, source apportionment of PM2.5 and PM10 and health risk assessment in the emerging megacity in China. Atmos. Pollut. Res. 2018, 9, 309–321. [Google Scholar] [CrossRef]
  31. Zhang, L.; Meng, Y.; Zhang, A.B.; Liu, M. Comparative Study on Pollution Characteristics of PM2.5 and Total Suspended Particulate in Qingdao Suburban Area. Urban Environ. Urban Ecol. 2016, 29, 21–27. [Google Scholar]
  32. Zhong, Y.T.; Li, X.; Fan, Z.A.; Ayitken, M.; Li, S.T.; Liu, X.C. Chemical Composition Characteristics and Source Contributions of Precipitation in Typical Cities on the North Slope of Tianshan Mountain in Xinjiang during 2010–2019. Atmosphere 2022, 13, 646. [Google Scholar] [CrossRef]
  33. Cheng, C.; Shi, M.; Liu, W.; Mao, Y.; Hu, J.; Tian, Q.; Chen, Z.; Hu, T.; Xing, X.; Qi, S. Characteristics and source apportionment of water-soluble inorganic ions in PM2.5 during a wintertime haze event in huanggang, central China. Atmos. Pollut. Res. 2020, 12, 111–123. [Google Scholar] [CrossRef]
  34. Shi, Z.; Bi, L.; Shi, J.; Xiang, F.; Qian, L.; Ning, P. Characterization and source identification of PM2.5 in ambient air of Kunming in windy spring. Environ. Sci. Technol. 2014, 37, 143–147. [Google Scholar] [CrossRef]
  35. Shi, J.; Feng, Y.; Ren, L.; Lu, X.; Zhong, Y.; Han, X.; Ning, P. Mass concentration, chemical composition, and source characteristics of PM2.5 in a plateau slope city in southwest China. Atmosphere 2021, 12, 611. [Google Scholar] [CrossRef]
  36. Xiao, H.; Xiao, H.; Wu, P.; Xiao, H.; Zhang, Z.; Zheng, N. Composition and source analysis of water-soluble ions in PM2.5 during autumn in Guiyang. Environ. Chem. 2019, 38, 548–555. [Google Scholar] [CrossRef]
  37. Zhao, P.S.; Dong, F.; He, D.; Zhao, X.J.; Zhang, X.L.; Zhang, W.Z.; Yao, Q.; Liu, H.Y. Characteristics of concentrations and chemical compositions for PM2.5 in the region of Beijing, Tianjin, and Hebei, China. Atmos. Chem. Phys. 2013, 13, 4631–4644. [Google Scholar] [CrossRef] [Green Version]
  38. Castro, L.M.; Harrison, R.M.; Djt, S.; Pio, C.A. Carbonaceous aerosol in urban and rural European atmospheres: Estimation of secondary organic carbon concentrations. Atmos. Environ. 1999, 33, 2771–2781. [Google Scholar] [CrossRef]
  39. Shi, H.; Huang, Y.; Cheng, X.; Li, T.; He, M.; Wang, J. Pollution characteristics and sources of carbonaceous components in PM2.5 during winter in Chengdu. Ecol. Environ. Sci. 2021, 30, 1420–1427. [Google Scholar] [CrossRef]
  40. Wang, Y.; Li, S.; Chen, Q.; Li, Y. Study on chemical composition and pollution source of atmospheric PM2.5 in Xi’an City. Environ. Chem. 2021, 40, 1431–1441. [Google Scholar] [CrossRef]
  41. Zhang, Y.H.; Wang, D.F.; Zhao, Q.B.; Cui, H.X.; Li, J.; Duan, Y.S.; Fu, Q.Y. Characteristics and sources of organic carbon and elemental carbon in PM2.5 in Shanghai urban area. Environ. Sci. 2014, 35, 3263–3270. [Google Scholar] [CrossRef]
  42. Cao, J.J.; Wu, F.; Chow, J.C.; Lee, S.C.; Li, Y.; Chen, S.W.; An, Z.S.; Fung, K.K.; Watson, J.G.; Zhu, C.S.; et al. Characterization and source apportionment of atmospheric organic and elemental carbon during fall and winter of 2003 in Xi’an, China. Atmos. Chem. Phys. 2005, 5, 3127–3137. [Google Scholar] [CrossRef] [Green Version]
  43. He, B.W.; Nie, S.S.; Wang, S.; Feng, Y.P.; Yao, B.; Cui, J.S. Seasonal variation and source apportionment of carbonaceous species in PM2.5 in Chengde. Environ. Sci. 2021, 42, 5152–5161. [Google Scholar] [CrossRef]
  44. Zhang, C.; Zhou, Z.E.; Zhai, C.Z.; Bai, Z.G.; Chen, G.C.; Ji, Y.Q.; Ren, L.H.; Fang, W.K. Carbon source apportionment of PM2.5 in Chongqing based on local carbon profiles. Environ. Sci. 2014, 35, 810–819. [Google Scholar] [CrossRef]
  45. Chen, Y.; Sheng, G.; Bi, X.; Feng, Y.; Mai, B.; Fu, J. Emission factors for carbonaceous particles and polycyclic aromatic hydrocarbons from residential coal combustion in China. Environ. Sci. Technol. 2005, 39, 1861–1867. [Google Scholar] [CrossRef] [PubMed]
  46. Chow, J.C.; Watson, J.G.; Lu, Z.; Lowenthal, D.H.; Frazier, C.A.; Solomon, P.A.; Thuillier, R.H.; Magliano, K. Descriptive analysis of PM2.5 and PM10 at regionally representative locations during SJVAQS/AUSPEX. Atmos. Environ. 1996, 30, 2079–2112. [Google Scholar] [CrossRef]
  47. Xu, X.M.; Feng, X.Q.; Chen, J.H.; Yin, H.M.; Zhang, Y.; Liu, Z. Pollution characteristics of carbonaceous components in PM2.5 in the Chengdu City. Environ. Chem. 2021, 40, 2481–2492. [Google Scholar] [CrossRef]
  48. Wang, Y.Q.; Li, S.P.; Wang, M.M.; Sun, H.Y.; Zhen, M.; Zhang, L.X.; Li, Y.G.; Chen, Q.C. Source apportionment of environmentally persistent free radicals (EPFRs) in PM2.5 over Xi’an, China. Sci. Total Environ. 2019, 689, 193–202. [Google Scholar] [CrossRef] [PubMed]
  49. Zhao, K.; Li, X.; Yang, J. Environmental response to variation of the atmospheric maximum mixing depth in Urumqi. Arid. Zone Res. 2011, 28, 509–513. [Google Scholar] [CrossRef]
  50. Yu, Z.; Li, X.; Yu, X.; Zhen, Y.; Ayitken, M.; Li, S.; Wang, N. Spatiotemporal variation characteristics of aerosol optical depth in Xinjiangfrom 2003 to 2019. Arid. Land. Geo. 2022, 45, 346–358. [Google Scholar] [CrossRef]
Figure 1. Location of the sampling site in Shihezi City, Xinjiang, China.
Atmosphere 14 00703 g001
Figure 2. Diurnal variations of mass concentrations of PM2.5 and chemical components in Shihezi urban area in winter.
Atmosphere 14 00703 g002
Figure 3. Diurnal variation of mass concentration of water-soluble inorganic ions (WSIIs) in PM2.5 in Shihezi in winter.
Atmosphere 14 00703 g003
Figure 4. Concentrations of secondary inorganic aerosols (SIAs) and their ratios in PM2.5 during different air qualities in Shihezi.
Atmosphere 14 00703 g004
Figure 5. Concentrations of OC and EC, the values of OC/EC and OC/PM2.5 in PM2.5 during different air qualities in Shihezi.
Atmosphere 14 00703 g005
Figure 6. Mean concentrations of inorganic elements (IEs) in PM2.5 during different air qualities in Shihezi.
Atmosphere 14 00703 g006
Figure 7. Source profiles of PM2.5 in Shihezi in winter, based on the PMF model analysis.
Atmosphere 14 00703 g007
Figure 8. Clustering analysis of the 24 h backward trajectories in Shihezi City in winter.
Atmosphere 14 00703 g008
Table 1. Mean concentrations of WSIIs sampled in Shihezi compared with the data from other cities in China (μg/m3).
ShiheziBaoshan [26]Huanggang [33]Kunming [34]Wenshan [35]Guiyang [36]Beijing [37]Tianjing [37]
Year2020–20212016201820132016201720092009
SeasonWinterWet and Dry SeasonWinterSpringSpring and AutumnAutumnFour
Seasons
Four
Seasons
PM2.5164.69 ± 76.4823.17 ± 12.32110.40 ± 45.9-44.85 ± 10.9927.12123.45 ± 71.59141.47 ± 78.03
Na+1.54 ± 0.70.33 ± 0.251.10 ± 0.50--0.070.53 ± 0.450.63 ± 0.30
NH4+24.88 ± 12.10.95 ± 0.4813.0 ± 6.900.522.81 ± 1.162.566.37 ± 3.917.64 ± 4.27
K+0.27 ± 0.130.42 ± 0.280.20 ± 0.100.770.63 ± 0.240.371.68 ± 1.292.08 ± 1.36
Mg2+0.17 ± 0.140.13 ± 0.040.90 ± 0.300.30.07 ± 0.020.110.18 ± 0.110.23 ± 0.13
Ca2+1.63 ± 0.991.17 ± 0.350.60 ± 0.302.831.04 ± 0.51.981.55 ± 1.381.79 ± 1.44
F0.59 ± 0.470.19 ± 0.070.04 ± 0.020.540.19 ± 0.070.03--
Cl5.27 ± 3.840.34 ± 0.232.70 ± 1.200.720.31 ± 0.1090.162.92 ± 3.468.14 ± 6.10
SO42−42.47 ± 22.961.42 ± 0.6915.0 ± 7.309.725.98 ± 2.078.5319.07 ± 16.3624.97 ± 22.59
NO329.85 ± 13.360.73 ± 0.3130.8 ± 15.70.511.00 ± 0.402.2120.47 ± 18.0718.83 ± 15.77
NO3/SO42−0.700.512.050.050.170.261.070.75
Table 2. The mean concentrations of PM2.5 in different trajectories.
C1C2C3C4C5C6
Trajectory proportion25.20%13.34%8.69%29.18%9.70%13.88%
PM2.5 mean concentration158.73167.90175.67160.3998.86218.90
Disclaimer/Publisher’s Note: The statements, opinions and data contained in all publications are solely those of the individual author(s) and contributor(s) and not of MDPI and/or the editor(s). MDPI and/or the editor(s) disclaim responsibility for any injury to people or property resulting from any ideas, methods, instructions or products referred to in the content.

