Article

Three-Dimensional Simulation of Corona Discharge in a Double-Needle System during a Thunderstorm

1
College of Atmosphere and Remote Sensing, Wuxi University, Wuxi 214105, China
2
State Key Laboratory of Severe Weather, Chinese Academy of Meteorological Sciences, Beijing 100081, China
3
College of Electronic and Information Engineering, Nanjing University of Information Science and Technology, Nanjing 211544, China
*
Author to whom correspondence should be addressed.
Atmosphere 2023, 14(5), 789; https://doi.org/10.3390/atmos14050789
Submission received: 7 March 2023 / Revised: 14 April 2023 / Accepted: 24 April 2023 / Published: 26 April 2023
(This article belongs to the Section Meteorology)

Abstract

:
The effect of corona discharge from buildings or structures on the surrounding atmospheric electric field is very important in the measurement of urban atmospheric electric fields and the early warning of lightning. However, most previous studies were focused on independent buildings, with little research on three-dimensional building groups. Therefore, based on three-dimensional numerical simulation technology, this paper uses a double-needle system to simulate the characteristics of thunderstorm corona discharge from two equal-height buildings separated by a variable distance. The shielding effect of the double-needle system on the ground electric field is evaluated both with and without corona discharge, and the main conclusions are as follows: (1) The larger the distance between the two needles, the closer the peak corona current from each tip of the double-needle system is to that from an independent lightning rod at the same height. When the peak corona current from each tip of the double-needle system equals the peak corona current from an independent lightning rod at the same height to some level of approximation, the distance between the two needle systems is determined by the needle height at this time. (2) If the distance between the two needles is 0.1 m, the corona charge released by the double-needle system is almost equal to that released by an independent lightning rod. The corona charge released by the double-needle system is approximately twice as much as that released by an independent lightning rod when the distance between the two needles is increased to a certain value that increases with the needle height and the time of corona discharge. (3) The greater the value of the time of corona discharge, the stronger the shielding effect of the corona discharge on the ground electric field and the larger the shielding range, but the greater the value of the needle height, the smaller the shielding range. (4) Compared with the shielding effect with no corona discharge, that with corona discharge is greater, but the greater the value of the needle height, the less the enhancement. For example, for corona discharge with a time of 10 s, the needle height is 20 m, and the shielding range is ca. 70 m, which is 8.8 times that without corona discharge; however, for the needle height of 100 m, the shielding range is ca. 150 m, which is only 1.5 times that without corona discharge.

1. Introduction

Corona discharge (CD) is an air breakdown that occurs on the surface of a tip when the local electric field strength at the tip exceeds the air breakdown threshold [1,2]. During a thunderstorm, an increase in the environmental electric field [3,4] can cause CD at the ground, releasing many corona charges and forming a corona charge layer extending to tens or even hundreds of meters in the air [5,6]. CD has some effects on the initiation and propagation of lightning leaders and on the distribution of the electric field near the ground [7,8], and in-cloud CD can also occur isolated from lightning and can be detected from space [9], so studying CD is very important regarding the process of lightning stroke [10,11], the measurement of the atmospheric electric field, and the early warning of lightning [12,13].
There has been much previous research on the CD of buildings, but most of the research objects were independent buildings rather than building groups. However, no matter the large number of buildings in the city and the lightning rod on top of the buildings, or the bushes and trees in the wilderness, they do not exist in the form of independent tips [14,15,16]. According to experimental studies of corona discharges on multiple objects, the ambient electric field required for corona onset is found to increase with decreasing distance between objects [17,18,19]. Using the one-dimensional (1D) model of Aleksandrov et al. [20,21], Bazelyan et al. [22] studied the CD characteristics of an array of equal-height lightning rods with variable height and separation distance, finding that the peak corona current depended on only the size of an independent lightning rod; however, their model neglected the diffusion of corona charges and so was quite different from reality. When studying the CD of buildings, the diffusion of corona charges cannot be ignored.
In early CD modeling, Aleksandrov et al. [23] discussed the relationship between corona current and environmental electric field based on their 1D CD model, concluding that the corona current increased with increasing environmental electric field but decreased slowly when the environmental electric field was stable and at its peak. For multiple tips, Bazelyan et al. [22,24] found that the height of a single tip and the distance between the tips determined the environmental threshold of corona initiation. Using a two-dimensional (2D) time-dependent CD model, Guo et al. [25,26] discussed the CD characteristics of a double-needle system with unequal height. Using a three-dimensional (3D) CD model, Guo et al. [25] studied the effect of wind on the CD of a single building, but their model did not consider two or more buildings.
Herein, based on the 2D uniform-grid double-needle CD model of Guo et al. [25,26] and the 3D independent-needle CD model of Guo et al. [27], a 3D variable-grid double-needle CD model is established to: (i) study the characteristics of CD between two buildings of equal height and variable separation; and (ii) evaluate the shielding effect of an equal-height building system on the ground electric field by comparing the cases with and without CD.

2. Model Settings

To study the interaction of CD between two buildings of equal height during a thunderstorm, the conceptual model of CD shown in Figure 1 is established, in which the main geometric variables are h, the height of either building’s tip, and d, the distance between tips. Herein, only h and d are considered; other factors, such as the building’s shape, are not. Therefore, the buildings in Figure 1A are assumed to be grounded by high lightning rods, as shown in Figure 1B, and the equal-height building system is simplified to a double-needle system.
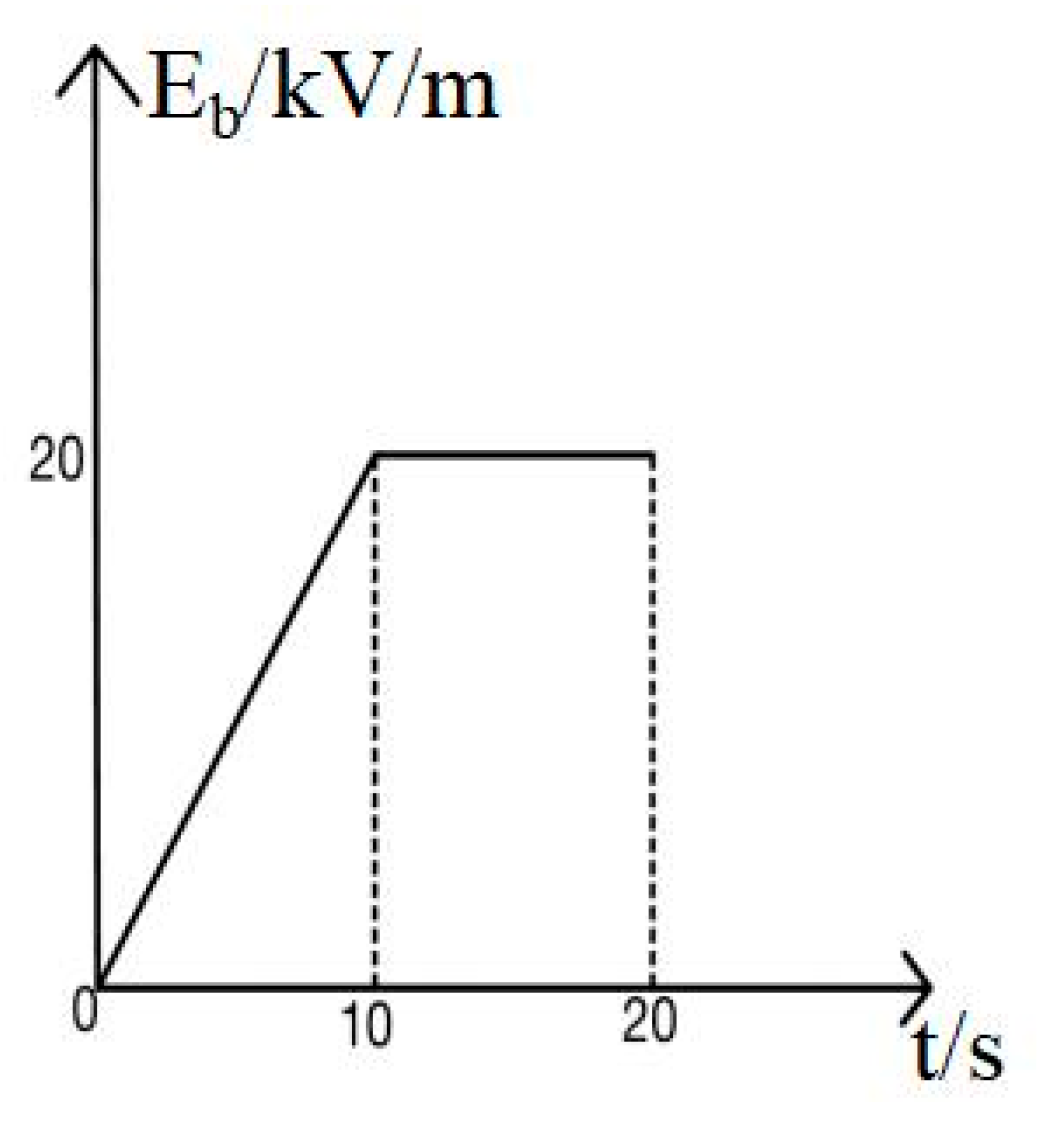
Based on the 2D uniform-grid two-pin CD model of Guo et al. [25,26] and the 3D independent-needle CD model of Guo et al. [26], the CD of the double-needle system is simulated numerically in the range of 500 m × 500 m × 500 m above the ground. The electric field strength Eb of the negative-polarity environment is increased linearly from zero to 20 kV/m in the first 10 s and then remains unchanged for the next 10 s; as shown in Formula (1) and Figure 2, and t is time. The minimum mesh size is 0.1 m, and the time resolution is 0.0001 s.
E b = 2 t k V / m , 0   s t 10   s , E b = 20 k V / m , 10   s t 20   s ,
herein, three mathematical realizations are considered: (i) the Peek formula [28], (ii) the Kaptzov hypothesis [29,30,31], and (iii) the ion convection–diffusion equation. The Peek formula is:
E cor = 27.2 1 + 1 r rod × 0.54 ,
where Ecor is the breakdown threshold of the electric field and rrod is the radius of curvature of the connecting flasher rod. In the case of an approaching net negative charge aloft in a thunderstorm cloud, the electric field near the ground forms upward and increases gradually, and when it reaches a certain extent, it distorts the electric field at the tip. Therefore, Equation (2) indicates that when the electric field on the surface of the tip exceeds Ecor, positive CD is initiated at the tip of a building, with the value of Ecor determined by the specific building and the relative density of air. With increasing electric field, corona ions are produced at the tip, the number of which is given by the Kaptzov hypothesis, and the electric field at the tip does not affect the corona threshold Ecor; the formula and data for the Kaptzov hypothesis are not repeated here [32].
Compared with the short-gap discharge simulation region of centimeter magnitude, the simulation region herein is larger, so the ionosphere on the surface of the tip is usually equivalent to an excitation source of small positive ions. However, only the characteristics of the corona layer in the migration region are considered, not the specific ionization process or the thickness of the corona layer. Within the migration zone, only small and large positive ions and neutral aerosols are considered [20,32], i.e.,
n + t = D 2 n + n + μ n + E b k n N n + N a , N + t = D 2 N + N μ N + E b + k n N n + N a , N a t = D 2 N a k n N n + N a ,
where n+ is the concentration of small positive ions, N+ is the concentration of large positive ions, Na is the concentration of neutral aerosol particles, knN (=2.9 × 10⁻¹² m3/s) is the attachment coefficient of small ions to aerosol particles [33], D (=1 m2/s) is the coefficient of turbulent diffusion, µn+ (=1.5 × 10⁻⁴ m2/V·s) and µN+ (=1.5 × 10⁻⁶ m2/V·s) are the mobilities of small and large aerosol ions, respectively [32,34,35]. Eb is the environmental electric field given by:
E b = φ .
The potential can be solved by converting the Poisson equation for the electrostatic field into iterative successive over-relaxation as given by:
2 φ = e 0 n + + N + ε 0 .
From Formula (5), e0 is electron charge and ε0 is vacuum permittivity.
Herein, we apply the first kind of fixed boundary condition to the ground and the second kind of boundary condition to the top and two side boundaries. The rationality of this model is verified by comparing it with the Becerra model; see Guo et al. (2022) [27] for details.

3. Simulation Results and Analysis

This section reports sensitivity tests performed using the 3D model established above and varying d and h. The CD characteristics of the double-needle system with h = 20 m, 60 m, and 100 m and d = 0.1 m, 5 m, 15 m, 30 m, 60 m, 90 m, 120 m, and 150 m are simulated, and the shielding effect of the double-needle system on the ground electric field is evaluated both with and without CD.

3.1. Corona Current in a Double-Needle System with Different Geometric Characteristics

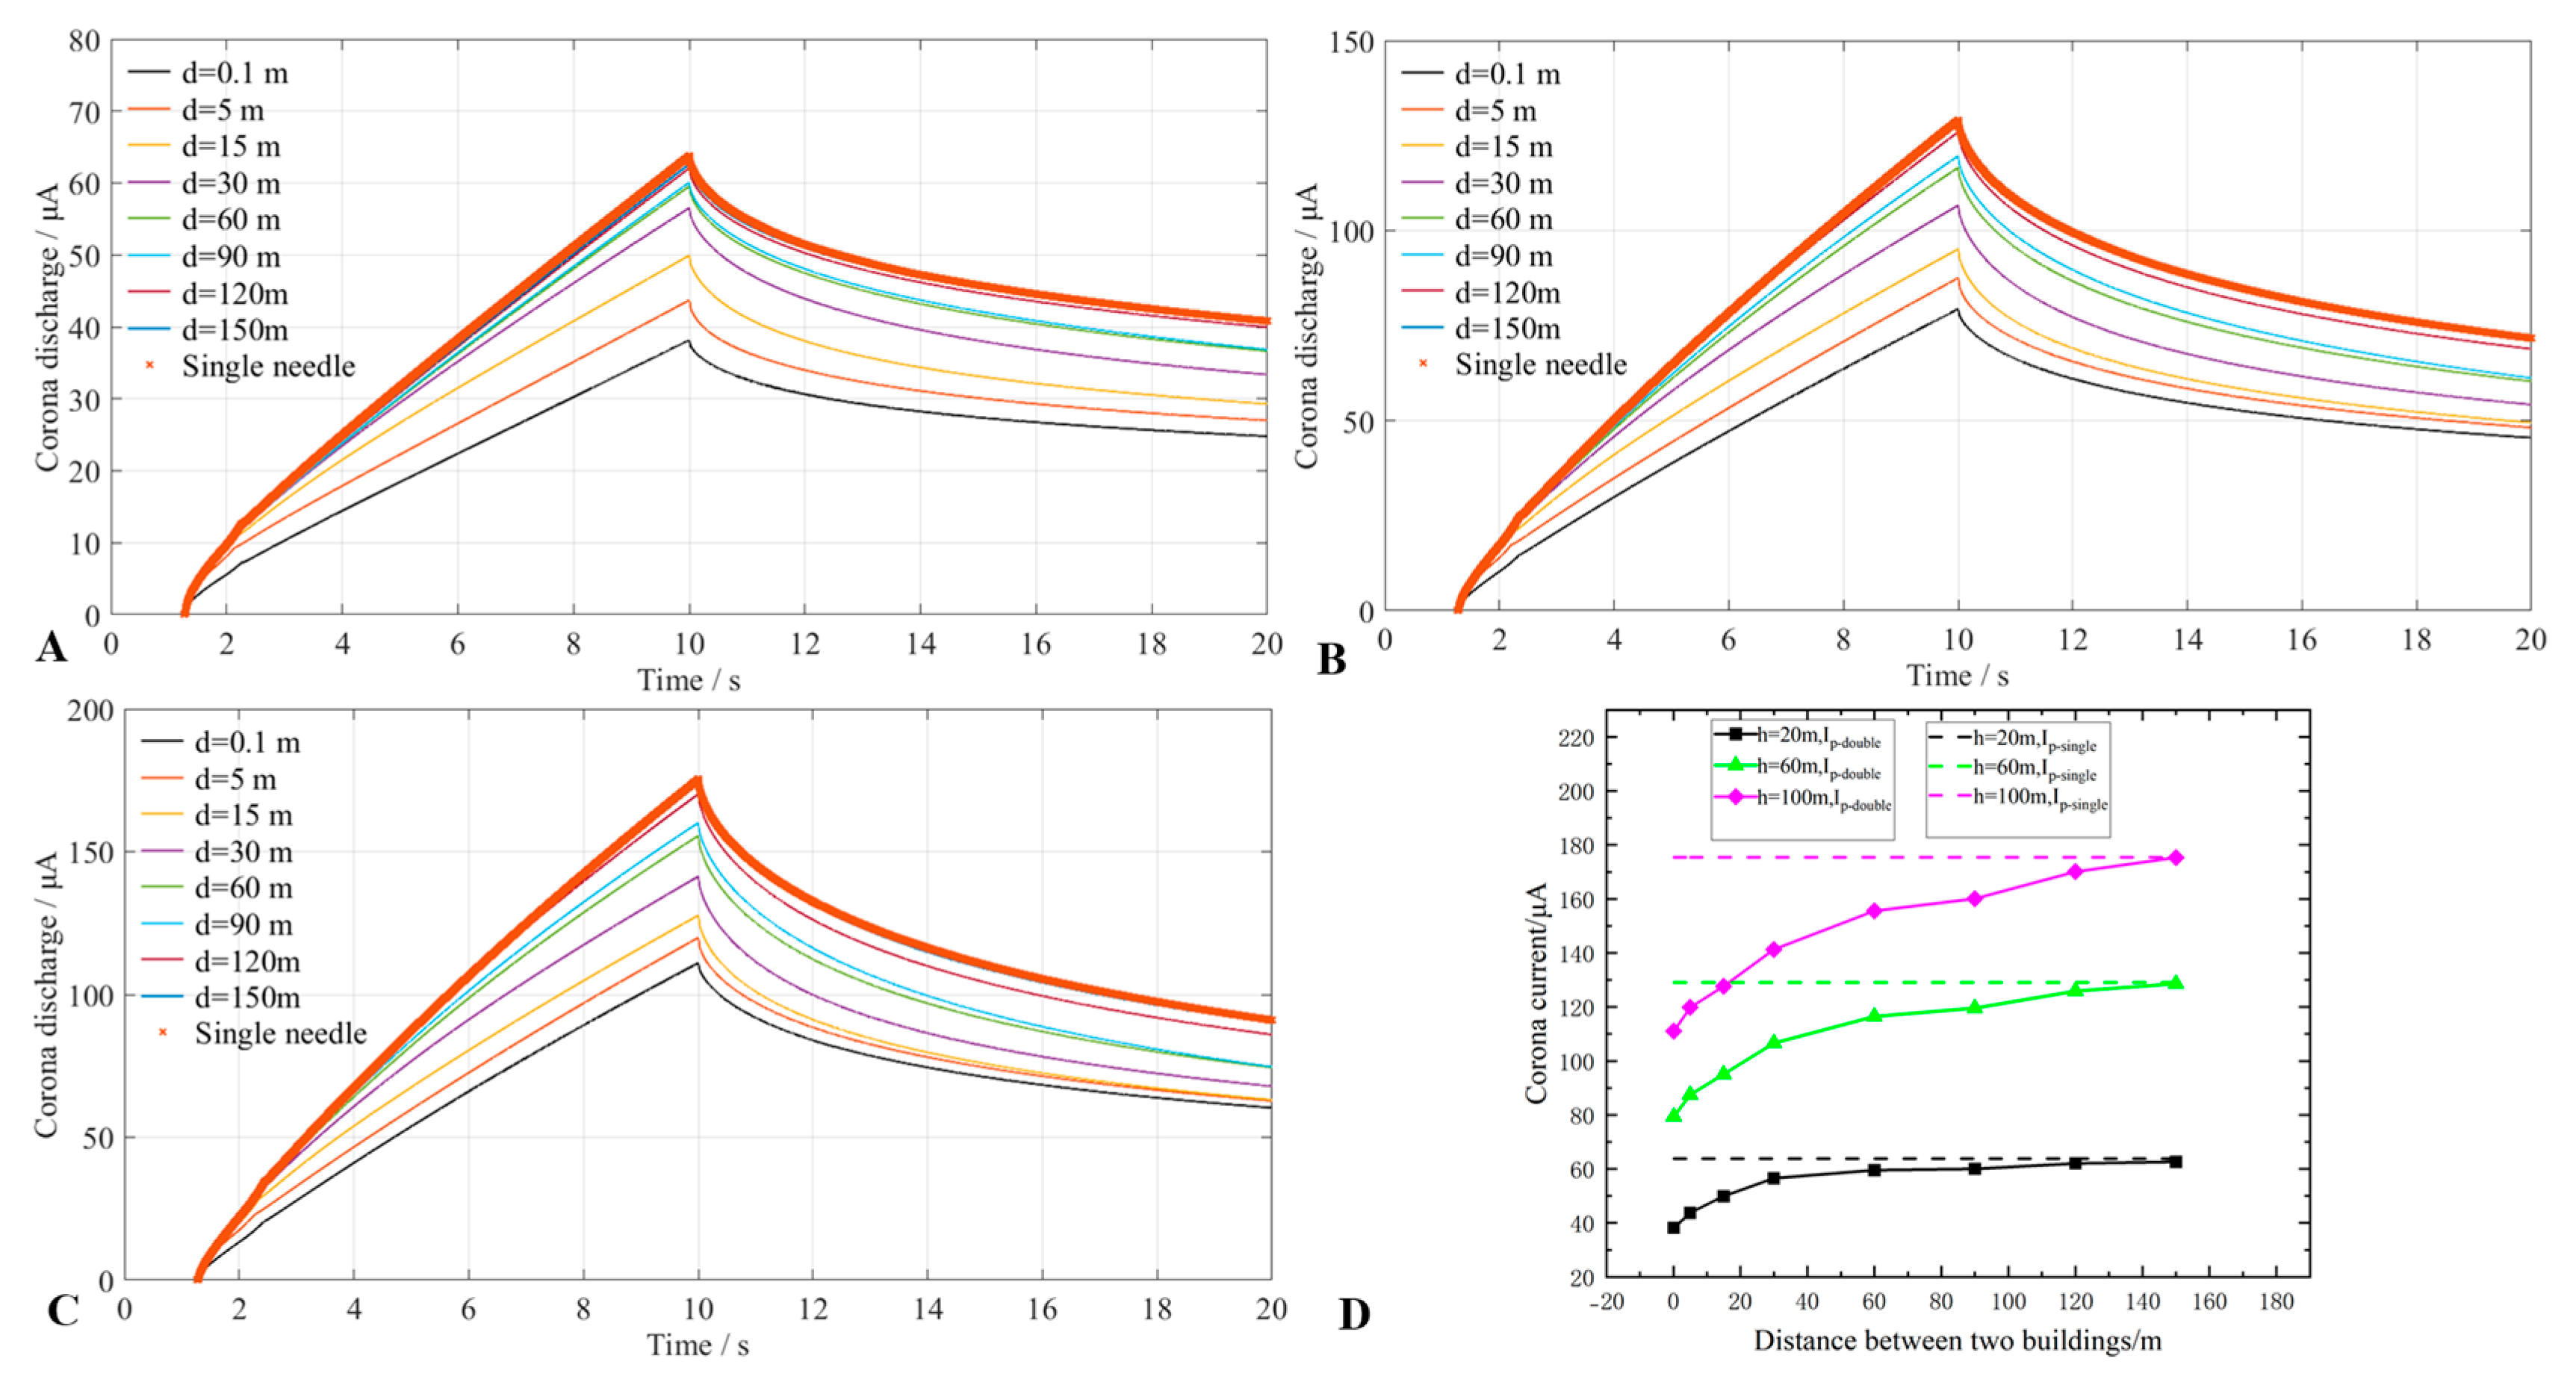
The corona current is an important physical parameter in the study of CD; it is closely related to the change of the background electric field and affects the initiation of the leader [36]. Against the background of the environmental electric field set up herein, we compare the variation trends of the corona current of the double-needle system with h = 20 m, 60 m, and 100 m at different values of d, as shown in Figure 3. We define Ip-double as the peak corona current of the double-needle system and Ip-single as the peak corona current of a single needle.
Figure 3A–C shows that the corona current at each tip of the equal-height double-needle system is consistent with that at the tip of an independent lightning rod, and both are consistent with the environmental electric field under the same thunderstorm-cloud electric field. When the environmental electric field reaches its peak, so does the corona current, and when the former remains constant, the latter decreases gradually, but the amplitude of the former is smaller than that of the latter. Ip-double increases with increasing d and gradually approaches Ip-single for the same height. Further comparison of the characteristics of Ip-double with the variation of d (as shown in Figure 3D) shows that the required d conditions for Ip-double to approach Ip-single will be different for the double-needle system with different heights. For h = 20 m, d should be ca. 120 m, and for h = 60 m and 100 m, d should exceed 150 m, but the change trends show that the value of d required for Ip-double = Ip-single is smaller for the 60 m double-needle system than for the 100 m one.

3.2. Corona Charges in a Double-Needle System with Different Geometric Characteristics

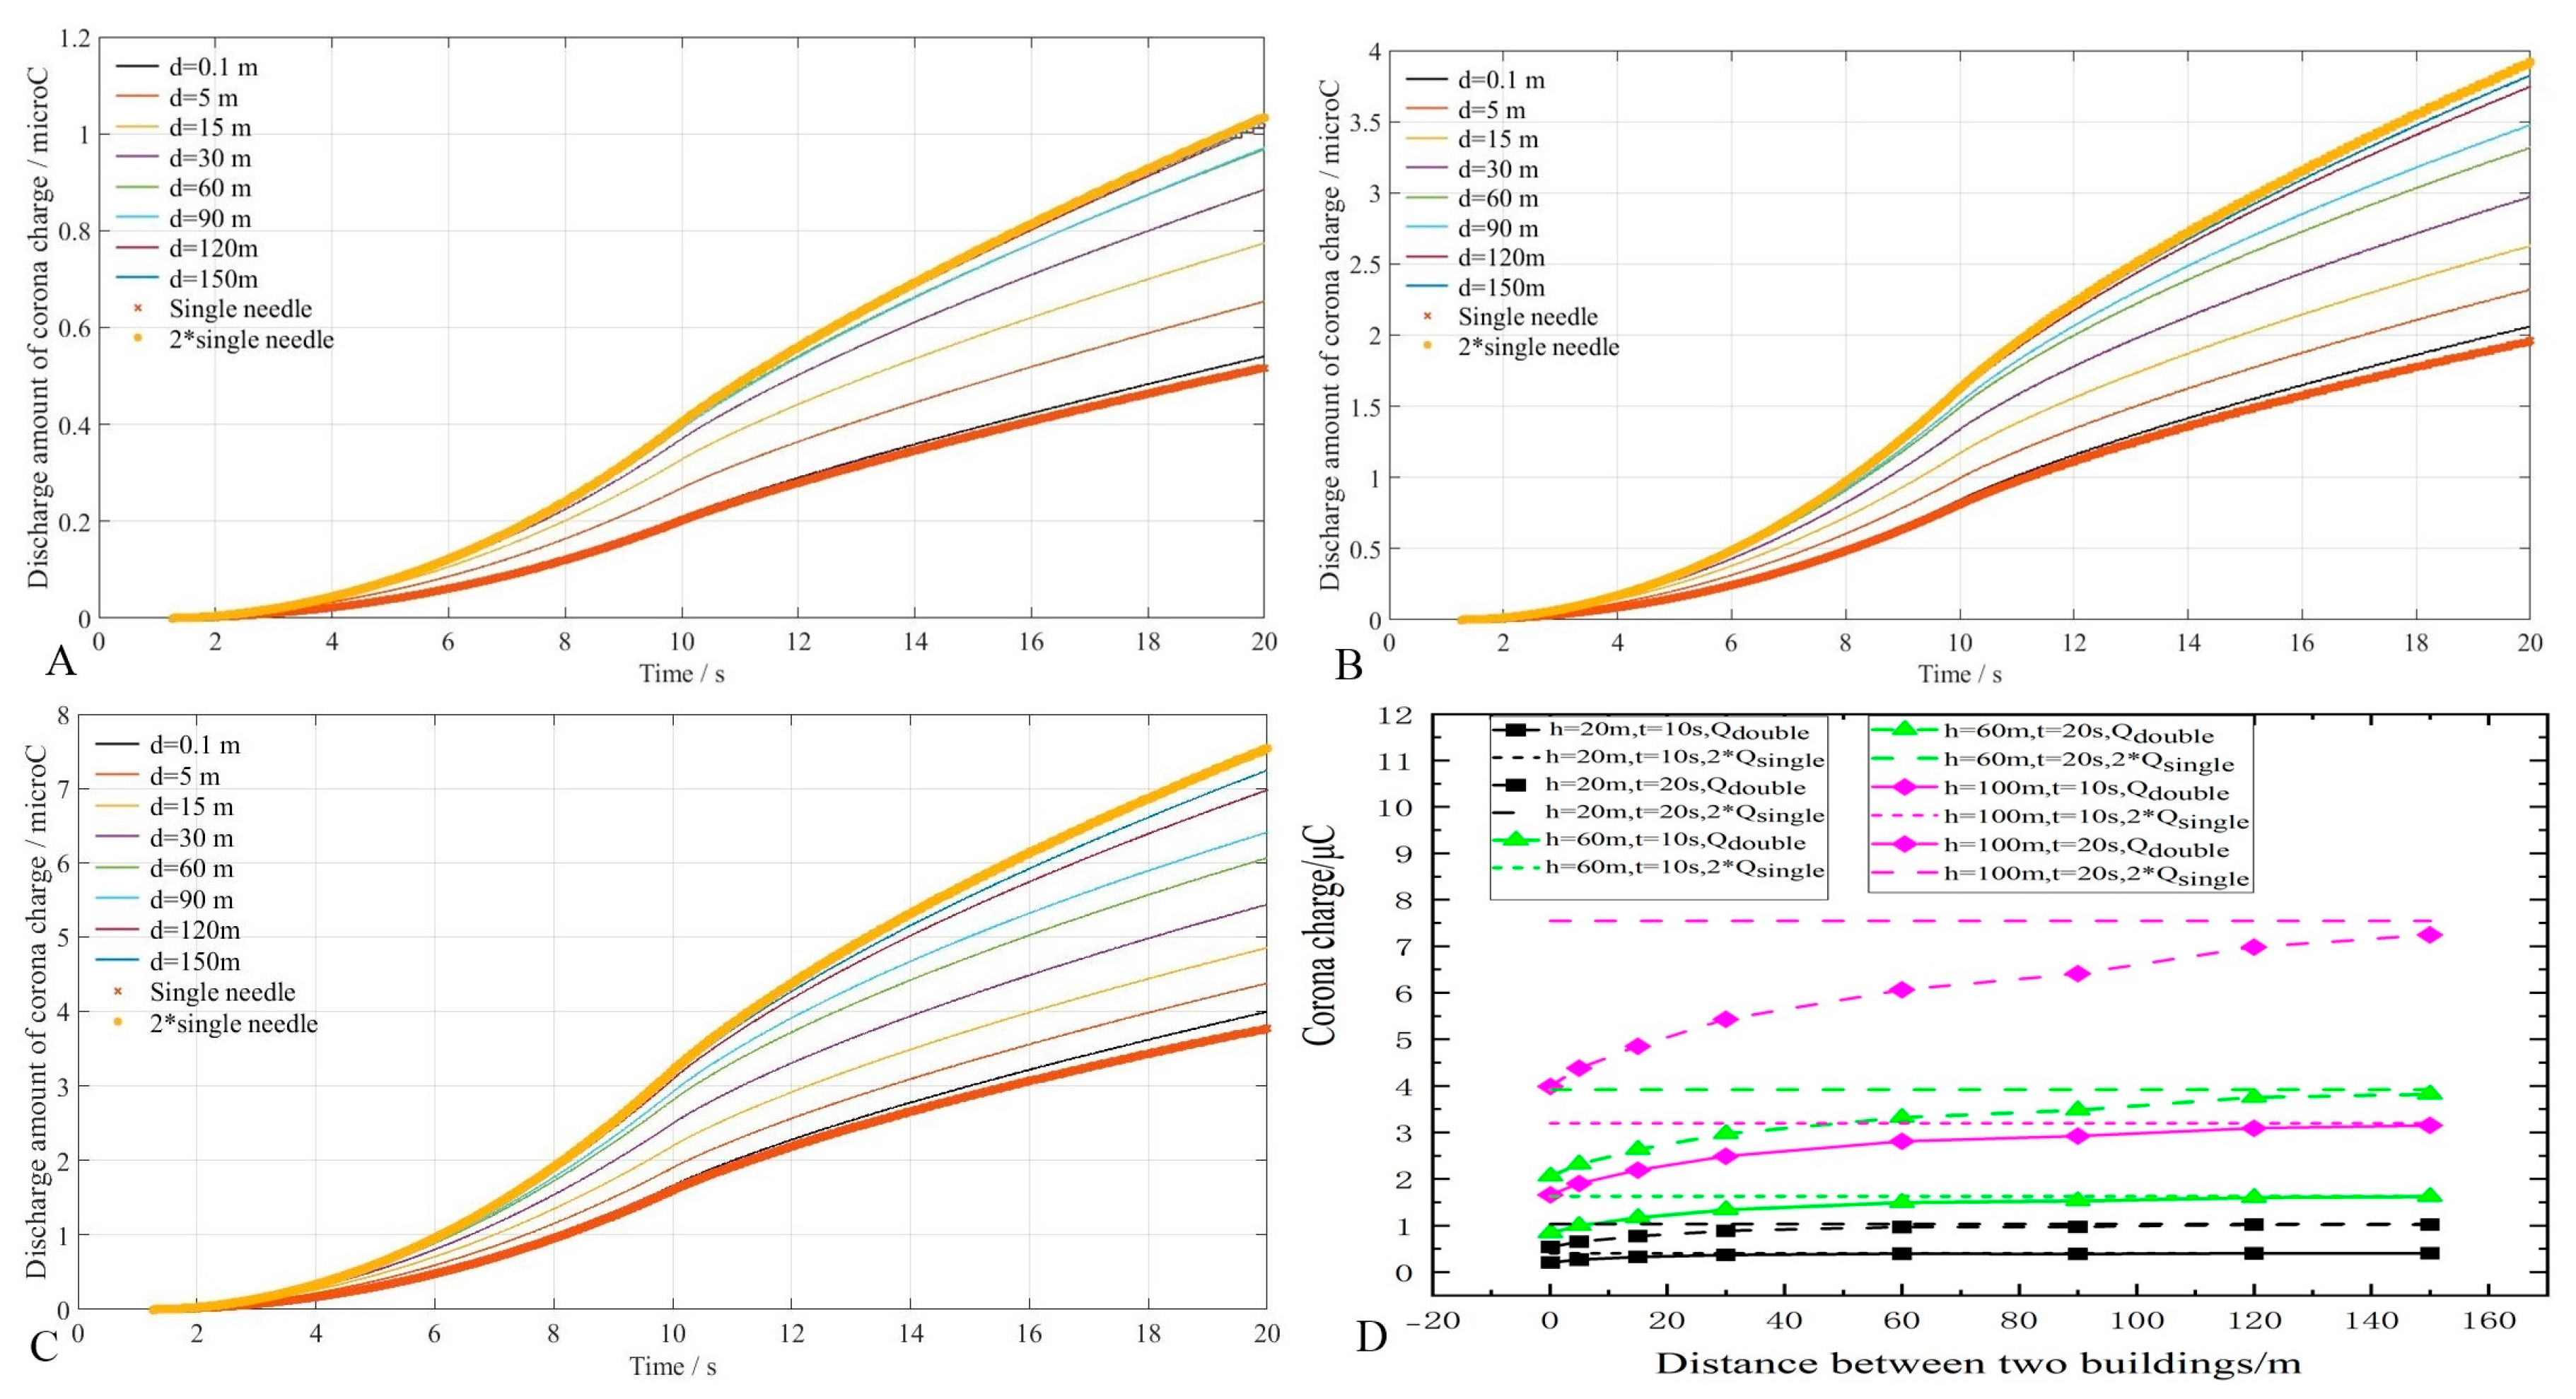
To study the characteristics of corona charges released in the double-needle system with different d, we focus here on the variation of corona charges for h = 20 m, 60 m, and 100 m and d = 0.1 m, 5 m, 15 m, 30 m, 60 m, 90 m, 120 m, and 150 m, as shown in Figure 4. We define Qsingle as the amount of corona charge released in a single-needle system and Qdouble as that released in a double-needle system.
Figure 4A–C shows that Qdouble increases with increasing d, and the larger the value of h, the larger that of Qdouble. Under the same environmental electric field, Figure 4D shows that at t = 10 s, the double-needle system with the three different heights achieves QdoubleQsingle when d = 0.1 m. For h = 20 m, the double-needle system achieves Qdouble ≈ 2Qsingle at d = 30 m, and for the double-needle system with h = 60 m and 100 m, the same is achieved at d = 90 m and 120 m, respectively. At t = 20 s, the double-needle system with h = 20 m achieves Qdouble ≈ 2Qsingle at d = 60 m, while for the double-needle system with h = 60 m and 100 m, d should exceed 150 m to achieve the same. From the variation trend of corona charges released, for the 60 m high double-needle system to achieve Qdouble ≈ 2Qsingle, the required value of d is less than that for the 100 m high double-needle system. Therefore, for d = 0.1 m, we have QdoubleQsingle, and when d is increased to a certain value, we have Qdouble ≈ 2Qsingle; the required value of d for Qdouble ≈ 2Qsingle increases with both t and h. Table 1 gives the differences at t = 10 s and 20 s between (i) the corona charges released by the double-needle system with the three different heights and (ii) twice the corona charges released by one needle.

4. Result

Table 1 shows that for a given time, the larger the value of d, the smaller those of ΔQ1 and ΔQ2, i.e., the corona charges released by the double-needle system are closer to those released by two independent lightning rods. For given d, with the passage of time, ΔQ2 is greater than ΔQ1, i.e., the difference between the corona charges released by the double-needle system and those released by two independent lightning rods increases with time.

Shielding Effect of a Double-Needle System on the Ground Electric Field with and without Corona Discharge

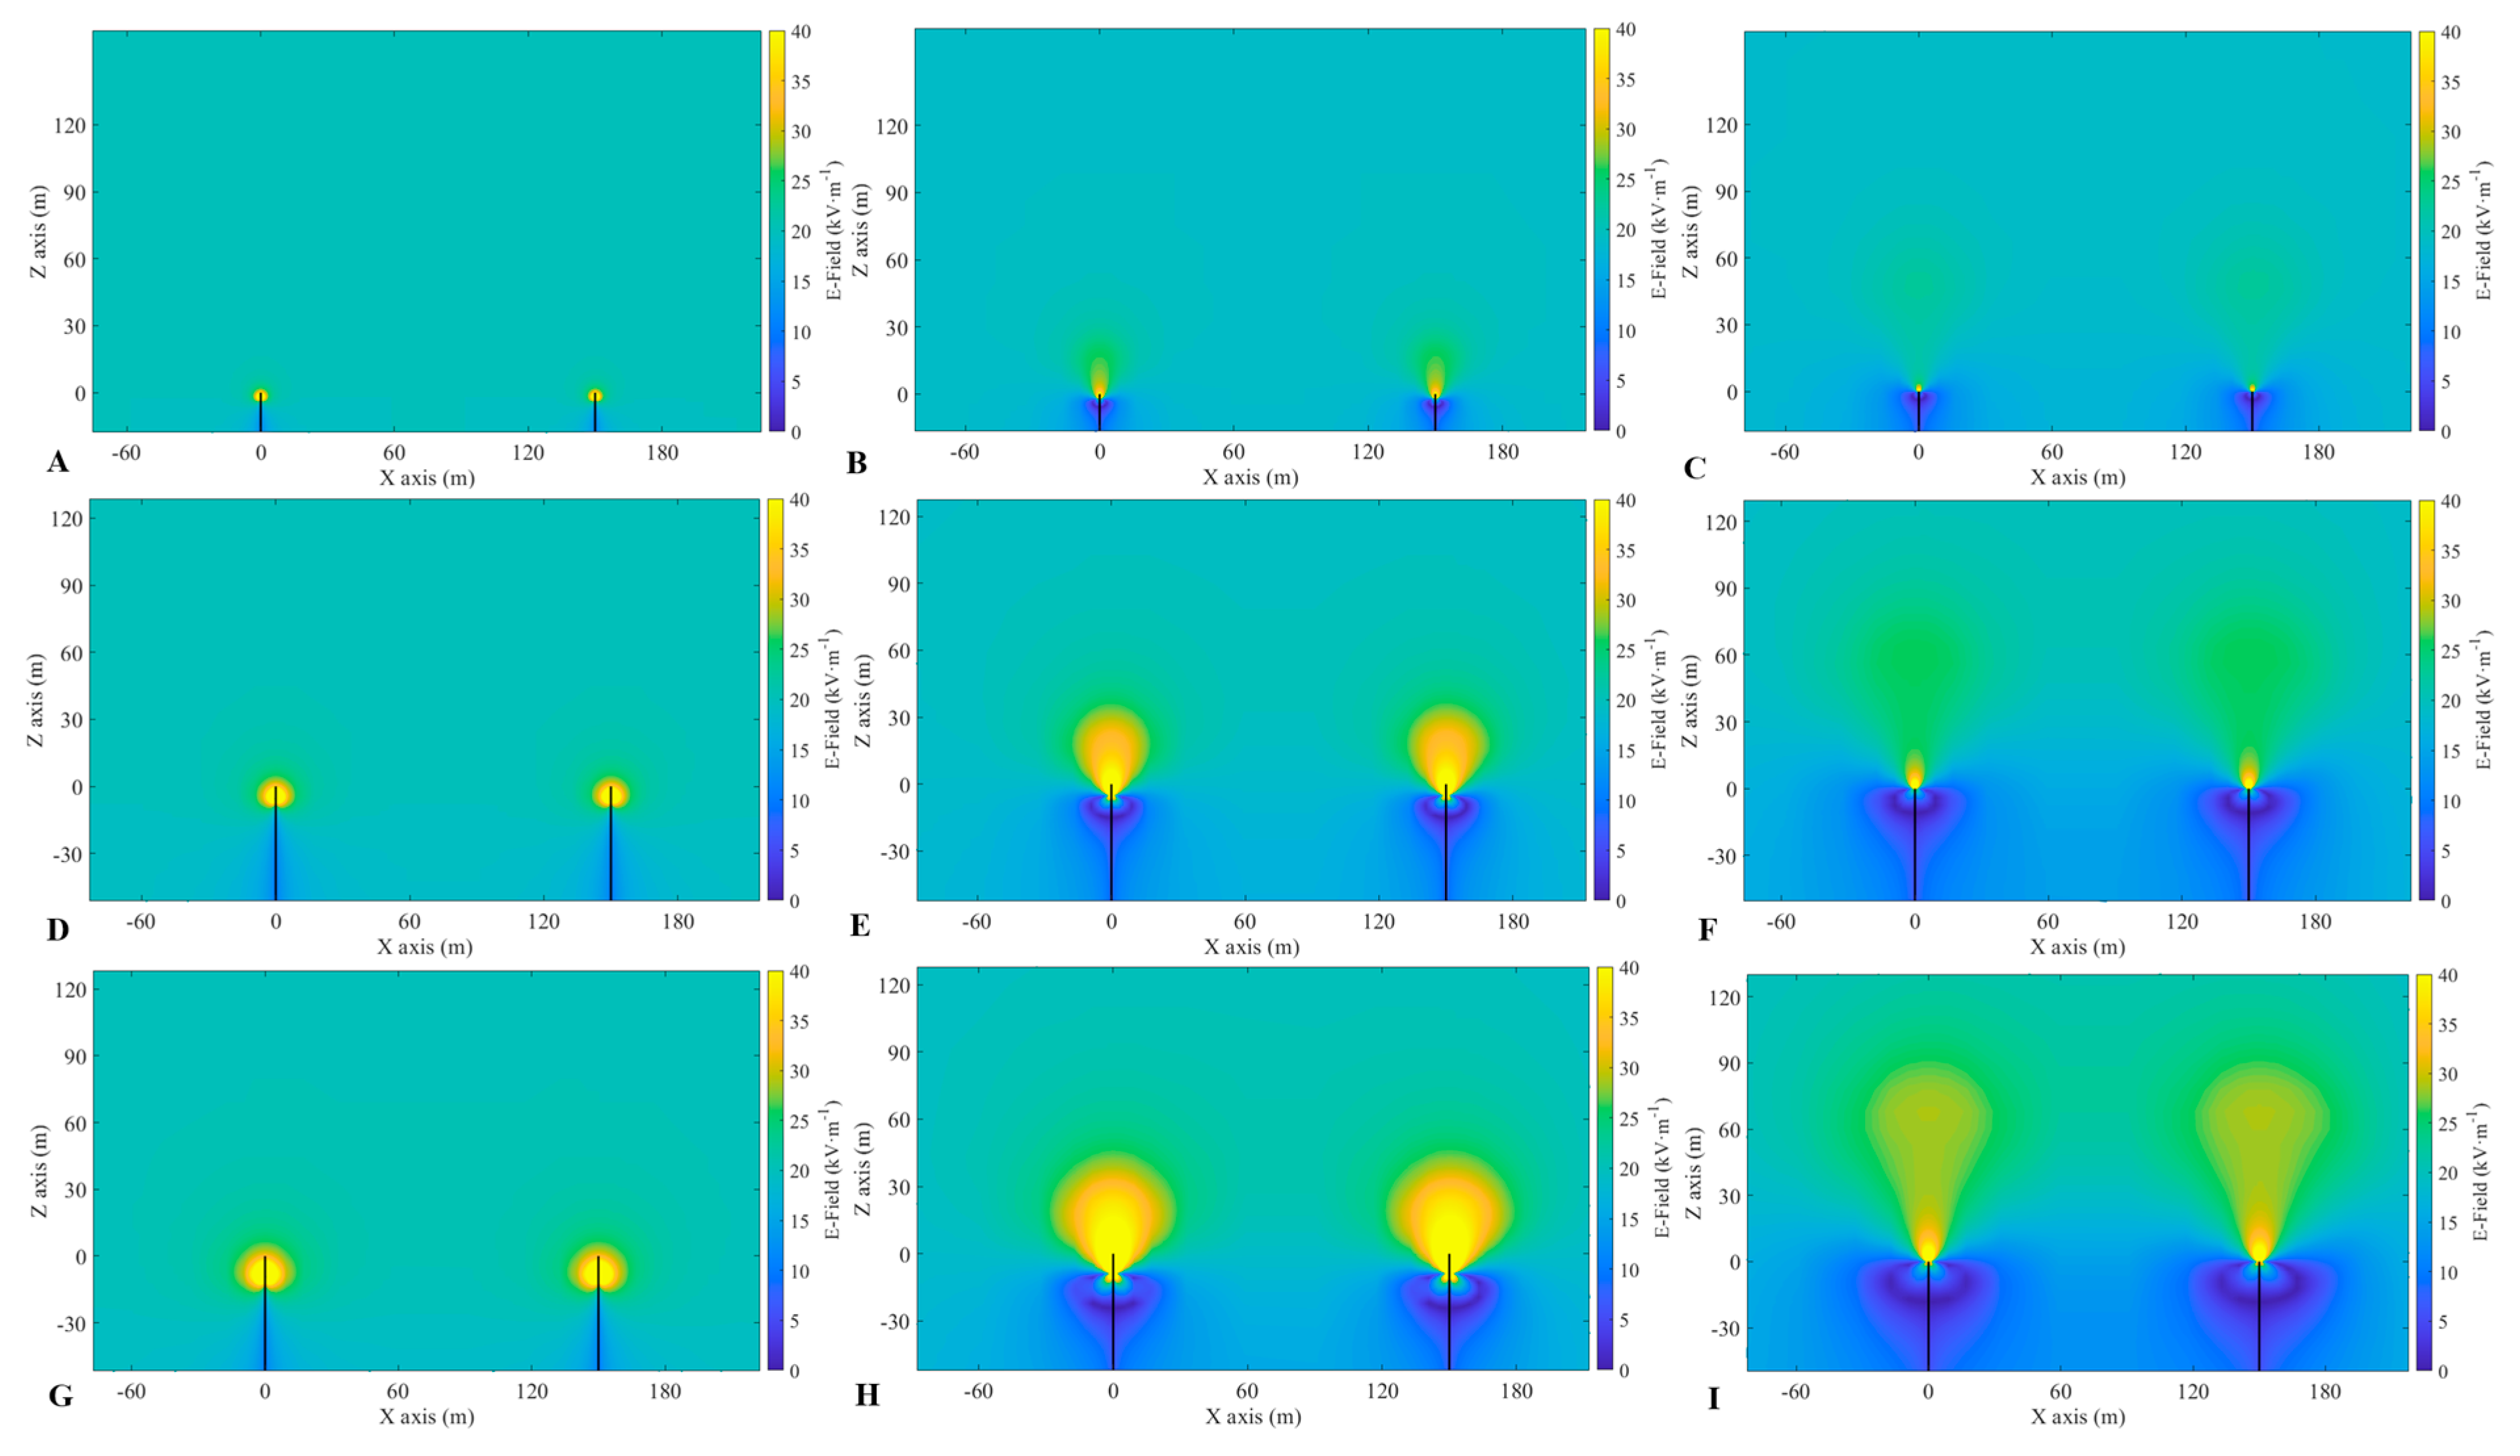
The corona charges released into the air during a thunderstorm affect the electric field near the ground, and the enhancement or shielding of the ground electric field is closely related to the protection of buildings and the instrumental detection of the atmospheric electric field [37,38,39,40]. As well as the effect of the building itself on the distortion of the electric field, the building’s CD should also be considered. Here, we study the shielding effect of the double-needle system with d = 150 m on the ground electric field both with and without CD. Figure 5 shows the spatial electric field distributions of the double-needle system at three different heights, both with and without CD.
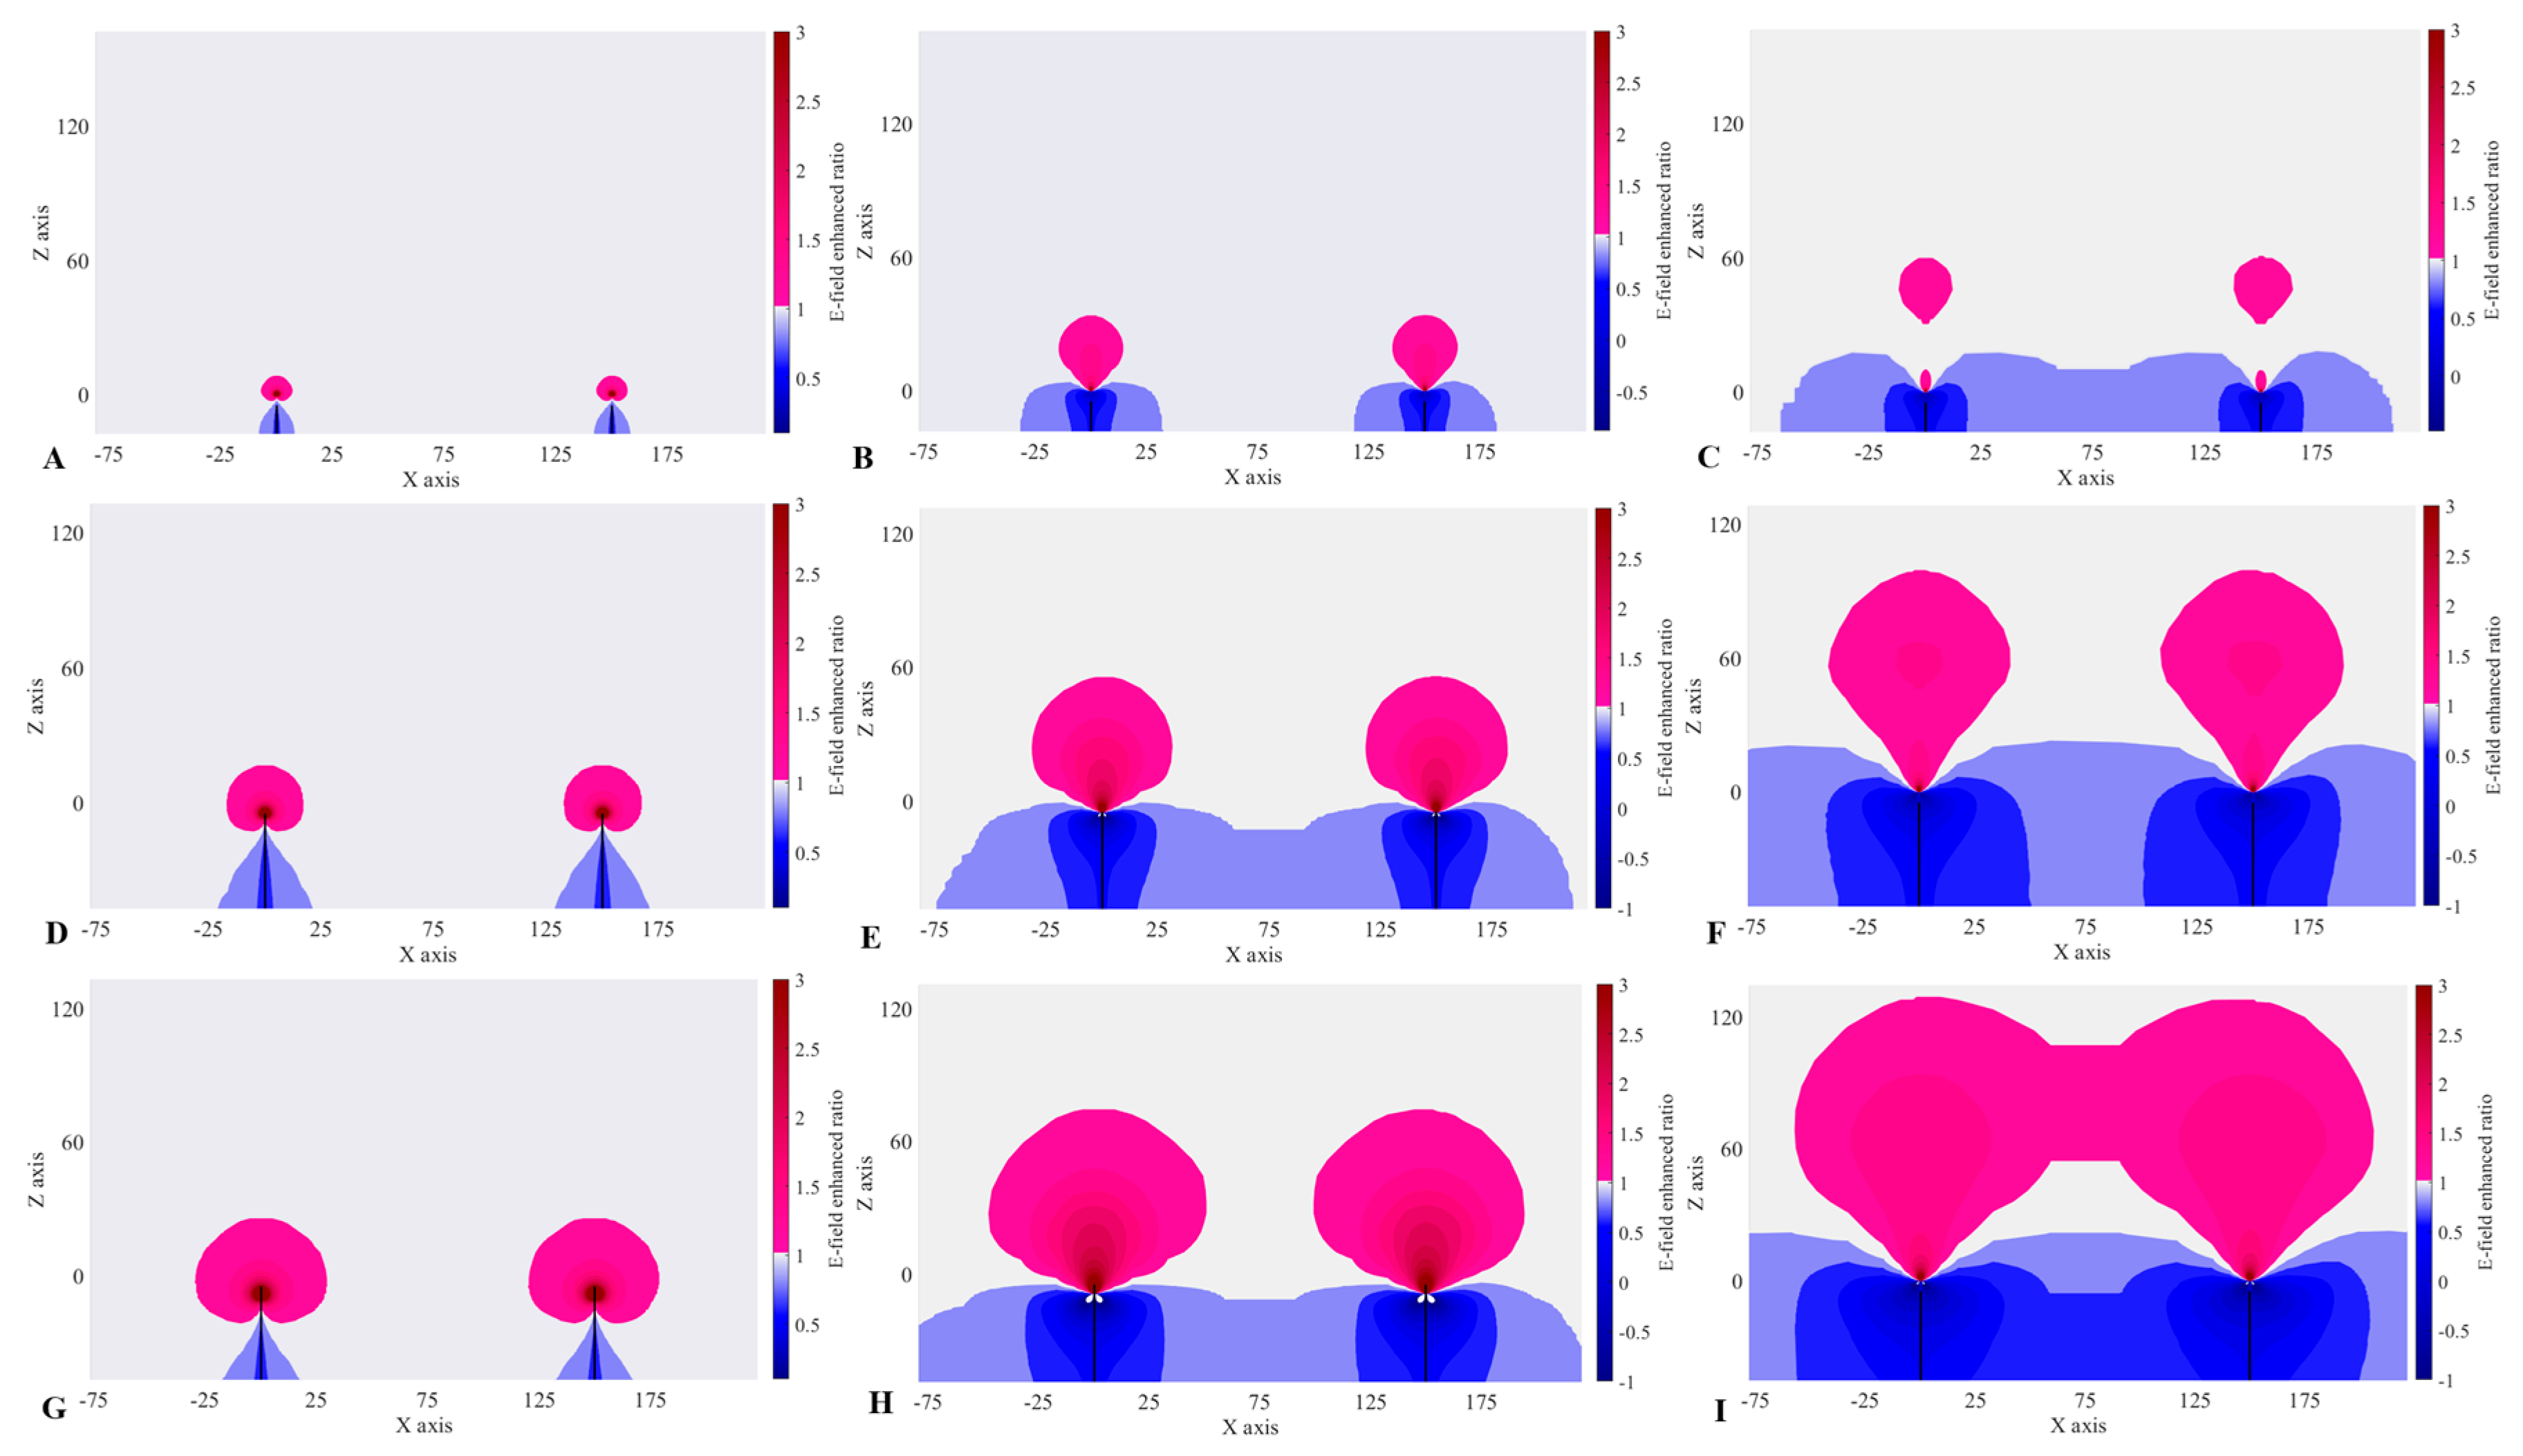
As shown in Figure 5, with the gradual generation of corona charges, the distortion at the tips of the double-needle system is amplified by the released ions, and the electric field is enhanced at the top but shielded at the bottom. At the same time, the higher the value of h, the larger the field enhancement range above and the larger field shielding range below, and for constant h, the field enhancement and shielding ranges will grow with time.
To study further the shielding effect of the double-needle system on the ground electric field with or without CD, we define the electric-field distortion coefficients N1 and N2, where N1 is the distortion coefficient of the electric field with CD and N2 is that without CD, and they are given by:
N 1 = E corona E b ,   N 2 = E original E b ,
where Ecorona is the electric field with CD and Eoriginal is that without CD (i.e., due to the building itself).
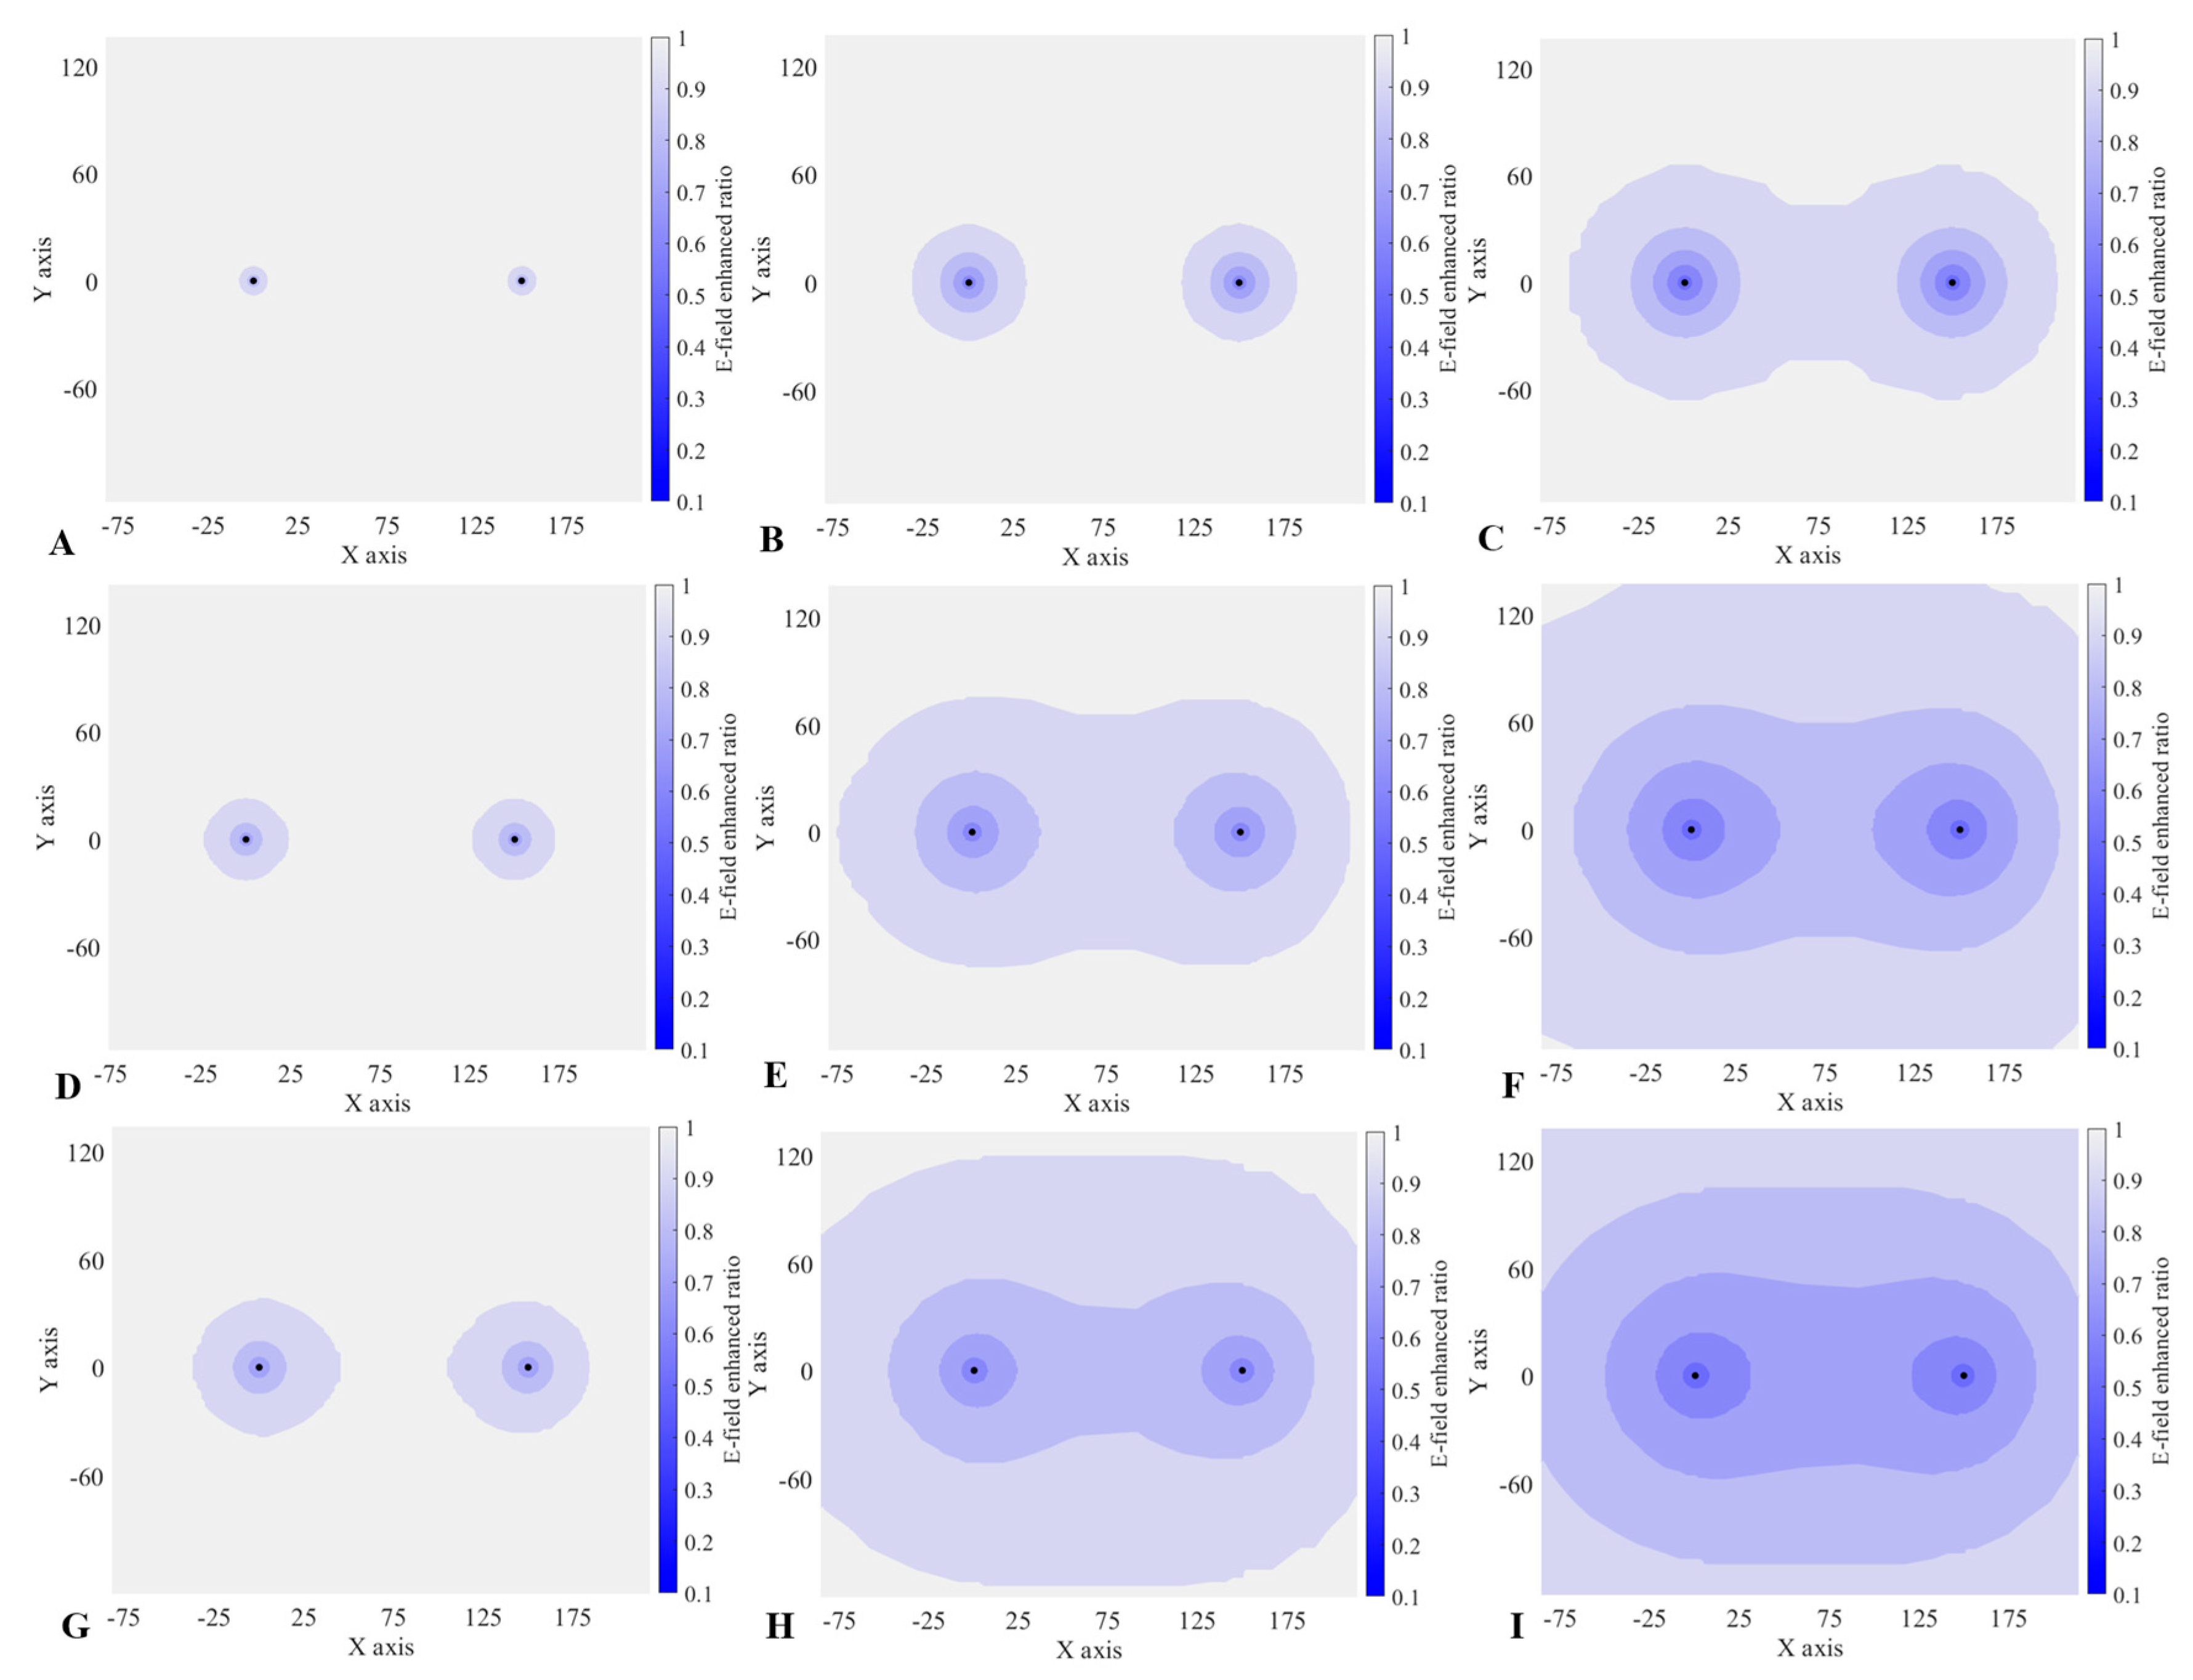
Figure 6 and Figure 7 show side views and the electric field at the ground level of the double-needle system, respectively, of the distributions of the electric-field distortion coefficients of the double-needle systems with and without CD. The red areas with N1 > 1 or N2 > 1 are where the electric field is enhanced; the darker the red, the greater the enhancement. The blue areas with N1 < 1 or N2 < 1 are where the electric field is shielded; the darker the blue, the greater the shielding effect. The regions with N1 < 0 or N2 < 0 are where the electric field is reversed, and the gray regions with N1 = 1 or N2 = 1 are where there is no electric-field distortion.
From Figure 6 and Figure 7, the effects of the double-needle system on the environmental electric field differ with and without CD. With CD and at a given time, the higher the value of h, the greater the effect of the double-needle CD on the environmental electric field. Taking the double-needle system with h = 20 m and 100 m as examples, at t = 10 s, the enhancement and shielding ranges of the environmental electric field total for two buildings with h = 20 m are ca. 1815 m2 and 5652 m2, respectively; those for h = 100 m are ca. 6035 m2 and 64,998 m2, respectively. For a given h, the effect of the double-needle CD on the environmental electric field increases with time. Taking the 60 m high double-needle system as an example, at t = 10 s, its enhancement and shielding ranges of the environmental electric field are ca. 5281 m2 and 27,318 m2, respectively, while at t = 20 s, they are ca. 6359 m2 and 103,620 m2, respectively. Figure 8 and Table 2 compare the shielding effects of the double-needle system on the ground electric field with and without CD.
In Table 2, x1 is the range of the shielding effect of the double-needle system on the ground electric field at t = 10 s without CD, x2 is that at t = 10 s with CD, and x3 is that at t = 20 s with CD; y1 is the range where the shielding effect of the double-needle system on the ground electric field exceeds 10% at t = 10 s without CD, y2 is that at t = 10 s with CD, and y3 is that at t = 20 s with CD; p1 is the range where the shielding effect of the double-needle system on the ground electric field exceeds 30% at t = 10 s without CD, p2 is that at t = 10 s with CD, and p3 is that at t = 20 s with CD.
From Figure 8 and Table 2, taking the double-needle system with d = 150 m as an example, comparing the shielding effects of the double-needle systems on the ground electric field with and without CD shows that with CD, the corona charges released from the tips of the two needles enhance the shielding of the ground electric field, and the enhancement increases with increasing h. Taking the double-needle system with h = 20 m and 100 m as examples, at t = 10 s, the shielding range of the 20 m high double-needle system on the ground electric field is ca. 70 m with CD but only 8 m without CD, which shows that the shielding range of the double-needle system on the ground electric field is 8.8 times greater with CD. The range of the shielding effect of the CD of the 100 m high double-needle system on the ground electric field is ca. 150 m, which is just 1.5 times larger than that without CD. At t = 20 s, everywhere between the two needles with the above two heights is affected by corona charges, and the ground electric field is shielded. By further comparison, at t = 10 s, the shielding range with CD decreases with h; this may be because the higher the tips, the farther the concentrated distribution area of corona charges is from the ground, so the effect on the ground electric field is relatively small and the shielding effect on the ground is relatively weak, i.e., the CD shielding range is weakened. Therefore, the larger the value of t, the stronger the shielding effect of corona charges on the ground electric field and the larger the shielding range between the two needles of the double-needle system, but the higher the value of h, the weaker the CD shielding range on the ground.

5. Conclusions and Discussion

Herein, we establish a 3D double-needle CD model to simulate: (i) the variation characteristics of corona current and corona charges in a double-needle system with different geometric characteristics; and (ii) the shielding effect of the double-needle system on the ground electric field with or without CD, from which we draw the following conclusions. The h is the height of either building’s tip, and the d is the distance between two tips:
(1)
By comparing the corona-current variation characteristics of the double-needle system with different geometric characteristics, it was found that the corona current at each tip of the equal-height double-needle system is consistent with that of an independent lightning rod under the same thunderstorm electric field. With increasing d, Ip-double approaches Ip-single gradually, and for the double-needle system with different heights, the required d conditions for Ip-doubleIp-single are different. For example, for h = 20 m, the required d is ca. 120 m, but for h = 60 m and 100 m, the required d exceeds 150 m, with the value for h = 60 m being less than that for h = 100 m;
(2)
For d = 0.1 m, Qdouble is almost equal to Qsingle. When d is increased to a certain value, Qdouble is almost equal to 2Qsingle. For Qdouble ≈ Qsingle, the required value of d increases with both h and t: at t = 10 s, d should be 60 m for the 20 m high double-needle system, 90 m for the 60 m high one, and 120 m for the 100 m high one, and the corresponding values of d are less at t = 20 s;
(3)
The greater the value of t, the stronger the shielding effect of corona charges on the ground electric field and the larger the shielding range between the two needles of the double-needle system. However, the higher the value of h, the smaller the CD shielding range on the ground;
(4)
Herein, the shielding effect of CD on the ground electric field in the double-needle system was studied by comparing the cases of CD and no CD, and the conclusions are as follows. With CD, the shielding effect on the ground electric field is increased, and the higher the value of h, the greater the increase. The range of the CD shielding effect of the 20 m high double-needle system on the ground electric field is about 70 m, which is 8.8 times that without CD. However, the range of the CD shielding effect of the 100 m high double-needle system is about 150 m, which is just 1.5 times that without CD.
In conclusion, the effect of CD on the ground electric field cannot be neglected, which provides a basis for future lightning warnings and the evaluation of detectors of the atmospheric electric field [38]. However, the present model only simulates two buildings, and there has been little research to date on the interaction between multiple points, so in future work, we will discuss further the effects of the geometrical characteristics of multiple tips on CD and the correlation among them.

Author Contributions

Conceptualization, X.G. and L.Z.; methodology, X.G.; software, L.Z.; validation, X.G. and L.Z.; writing—original draft preparation, L.Z.; checking, Z.J., Y.G., Z.W. and N.Z. All authors have read and agreed to the published version of the manuscript.

Funding

This work was supported by the National Natural Science Foundation of China (Youth Fund Project) [grant number 42205078]; the Natural Science Foundation of Jiangsu Province [grant number BK20190147]; the Open Grants of the State Key Laboratory of Severe Weather [grant number 2021LASW-B04]; the 2021 Shandong Natural Science Youth Fund [grant number ZR2021QD023]; and the Key Project of the Natural Science Foundation of Wuxi University [grant number 2019bjynk005].

Conflicts of Interest

The authors declare that this research was conducted in the absence of any commercial or financial relationships that could be construed as a potential conflict of interest.

References

  1. Bazelyan, E.M.; Raizer, Y.P.; Aleksandrov, N.L.; D’Alessandro, F. Corona processes and lightning attachment: The effect of wind during thunderstorms. Atmos. Res. 2009, 94, 436–447. [Google Scholar] [CrossRef]
  2. Bazelyan, E.M.; Raizer, Y.P.; Aleksandrov, N.L. The effect of space charge produced by corona at ground level on lightning attachment to high objects. Atmos. Res. 2015, 153, 74–86. [Google Scholar] [CrossRef]
  3. Tan, Y.; Guo, X.; Zhu, J.; Shi, Z.; Zhang, D. Influence on simulation accuracy of atmospheric electric field around a building by space resolution. Atmos. Res. 2013, 138, 301–307. [Google Scholar] [CrossRef]
  4. Tan, Y.; Liang, Z.; Shi, Z.; Zhu, J.; Guo, X. Numerical simulation of the effect of lower positive charge region in thunderstorms on different types of lightning. Sci. China Earth Sci. 2014, 57, 2125–2134. [Google Scholar] [CrossRef]
  5. Mazur, V.; Ruhnke, L.H. Model of electric charges in thunderstorms and associated lightning. J. Geophys. Res. Atmos. 1998, 103, 23299–23308. [Google Scholar] [CrossRef]
  6. Soula, S. Transfer of electrical space charge from corona between ground and thundercloud: Measurements and modeling. J. Geophys. Res. Atmos. 1994, 99, 10759–10765. [Google Scholar] [CrossRef]
  7. Pérez-Invernón, F.J.; Malagón-Romero, A. Editorial for the Special Issue “Advances in Atmospheric Electricity”. Atmosphere 2022, 13, 1829. [Google Scholar] [CrossRef]
  8. Romanovskii, O.A.; Kharchenko, O.V. Atmospheric and Ocean Optics: Atmospheric Physics III. Atmosphere 2022, 13, 1912. [Google Scholar] [CrossRef]
  9. Soler, S.; Pérez-Invernón, F.J.; Gordillo-Vázquez, F.J.; Luque, A.; Li, D.; Malagón-Romero, A.; Neubert, T.; Chanrion, O.; Reglero, V.; Navarro-Gonzalez, J.; et al. Blue optical observations of narrow bipolar events by ASIM suggest corona streamer activity in thunderstorms. J. Geophys. Res. Atmos. 2020, 125, e2020JD032708. [Google Scholar] [CrossRef]
  10. Becerra, M. Corona discharges and their effect on lightning attachment revisited: Upward leader initiation and downward leader interception. Atmos. Res. 2014, 149, 316–323. [Google Scholar] [CrossRef]
  11. Yuan, S.; Jiang, R.; Qie, X.; Wang, D.; Sun, Z.; Liu, M. Characteristics of Upward Lightning on the Beijing 325 m Meteorology Tower and Corresponding Thunderstorm Conditions. J. Geophys. Res. Atmos. 2017, 122, 12093–12105. [Google Scholar] [CrossRef]
  12. Bao, R.; Zhang, Y.; Ma, B.J.; Zhang, Z.; He, Z. An Artificial Neural Network for Lightning Prediction Based on Atmospheric Electric Field Observations. Remote Sens. 2022, 14, 4131. [Google Scholar] [CrossRef]
  13. Zhang, Y.; Zhang, Y.; Zou, M.; Wang, J.; Li, Y.; Tan, Y.; Feng, Y.; Zhang, H.; Zhu, S. Advances in Lightning Monitoring and Location Technology Research in China. Remote Sens. 2022, 14, 1293. [Google Scholar] [CrossRef]
  14. Goelian, N.; Lalande, P.; Bondiou-Clergerie, A.; Bacchiega, G.; Gazzani, A.; Gallimberti, I. A simplified model for the simulation of positive-spark development in long air gaps. J. Phys. D Appl. Phys. 1997, 30, 2441–2452. [Google Scholar] [CrossRef]
  15. Bazelyan, E.M.; Drabkin, M.M. Scientific and technical basis for preventing lightning strikes to earthbound objects. In Proceedings of the 2003 IEEE Power Engineering Society General Meeting (IEEE Cat. No. 03CH37491), Toronto, ON, Canada, 13–17 July 2003; IEEE: Piscataway, NJ, USA, 2003; Volume 4, pp. 2201–2208. [Google Scholar]
  16. Rizk, F.A. Analysis of space charge generating devices for lightning protection: Performance in slow varying fields. IEEE Trans. Power Deliv. 2010, 25, 1996–2006. [Google Scholar] [CrossRef]
  17. Chalmers, J.A. Atmospheric Electricity, 2nd ed.; Elsevier: Amsterdam, The Netherlands, 1976; pp. 451–499. [Google Scholar]
  18. Aubrecht, L.; Koller, J.; Stanek, Z. Onset voltages of atmospheric corona discharges on coniferous trees. J. Atmos. Sol. Terr. Phys. 2001, 63, 1901–1906. [Google Scholar] [CrossRef]
  19. Aubrecht, L.; Stanek, Z.; Koller, J. Corona discharge on coniferous trees-spruce and pine. Europhys. Lett. 2001, 53, 304. [Google Scholar] [CrossRef]
  20. Aleksandrov, N.L.; Bazelyan, E.M.; Carpenter, R.B., Jr.; Drabkin, M.M.; Raizer, Y.P. The effect of coronae on leader initiation and development under thunderstorm conditions and in long air gaps. J. Phys. D Appl. Phys. 2001, 34, 3256. [Google Scholar] [CrossRef]
  21. Aleksandrov, N.L.; Bazelyan, E.M.; Drabkin, M.M.; Carpenter, R.B.; Raizer, Y.P. Corona discharge at the tip of a tall object in the electric field of a thundercloud. Plasma Phys. Rep. 2002, 28, 953–964. [Google Scholar] [CrossRef]
  22. Bazelyan, E.M.; Raizer, Y.P.; Aleksandrov, N.L. Corona initiated from grounded objects under thunderstorm conditions and its influence on lightning attachment. Plasma Sources Sci. Technol. 2008, 17, 24015. [Google Scholar] [CrossRef]
  23. Aleksandrov, N.L.; Bazelyan, E.M.; Raizer, Y.P. The effect of a corona discharge on a lightning attachment. Plasma Phys. Rep. 2005, 31, 75–91. [Google Scholar] [CrossRef]
  24. Bazelyan, E.M.; Raizer, Y.P.; Aleksandrov, N.L. Non-stationary corona around multi-point system in atmospheric electric field: I. Onset electric field and discharge current. J. Atmos. Sol. Terr. Phys. 2014, 109, 80–90. [Google Scholar] [CrossRef]
  25. Guo, X.; Zhang, Q. Effects of geometrical parameters of two height-unequal adjacent objects on corona discharges from their tips during a thunderstorm. Atmos. Res. 2017, 190, 113–120. [Google Scholar] [CrossRef]
  26. Guo, X.; Zhang, Q.; Zhang, J. Improvement of corona discharge model and its application on simulating corona discharge in the presence of wind. Math. Prob. Eng. 2017, 2017, 9853439. [Google Scholar] [CrossRef]
  27. Guo, X.; Ji, Z.; Gao, Y.; Ding, J.; Zhang, L. 3D corona discharge model and its use in the presence of wind during a thunderstorm. Front. Environ. Sci. 2022, 10, 2–8. [Google Scholar] [CrossRef]
  28. Peek, F.W. Dielectric Phenomena in High Voltage Engineering; McGraw-Hill Book Company, Inc.: New York, NY, USA; London, UK, 1920. [Google Scholar]
  29. Cristina, S.; Dinelli, G.; Feliziani, M. Numerical computation of corona space charge and VI characteristic in DC electrostatic precipitators. IEEE Trans. Ind. Appl. 1991, 27, 147–153. [Google Scholar] [CrossRef]
  30. Caron, A.; Dascalescu, L. Numerical modeling of combined corona-electrostatic fields. J. Electrostat. 2004, 61, 43–55. [Google Scholar] [CrossRef]
  31. Nouri, H.; Zebboudj, Y. Analysis of positive corona in wire-to-plate electrostatic precipitator. Eur. Phys. J. Appl. Phys. 2010, 49, 11001. [Google Scholar] [CrossRef]
  32. Becerra, M. Glow corona generation and streamer inception at the tip of grounded objects during thunderstorms: Revisited. J. Phys. D Appl. Phys. 2013, 46, 135205. [Google Scholar] [CrossRef]
  33. Qie, X.S.; Soula, S.; Chauzy, S. Numerical calculation of evolution of corona ions produced from the ground under thunderstorm. Chin. J. Geophys. 1996, 39, 43–51. (In Chinese) [Google Scholar]
  34. Becerra, M.; Cooray, V.; Soula, S.; Chauzy, S. Effect of the space charge layer created by corona at ground level on the inception of upward lightning leaders from tall towers. J. Geophys. Res. Atmos. 2007, 112, 1103–1118. [Google Scholar] [CrossRef]
  35. Qie, X.; Soula, S.; Chauzy, S. Influence of ion attachment on the vertical distribution of the electric field and charge density below a thunderstorm. Ann. Geophys. 1994, 12, 1218–1228. [Google Scholar] [CrossRef]
  36. Willett, J.C.; Davis, D.A.; Laroche, P. An experimental study of positive leaders initiating rocket-triggered lightning. Atmos. Res. 1999, 51, 189–219. [Google Scholar] [CrossRef]
  37. Pierce, E.T. Atmospheric electricity and earthquake prediction. Geophys. Res. Lett. 1976, 3, 185–188. [Google Scholar] [CrossRef]
  38. Antunes de Sá, A.; Marshall, R.; Sousa, A.; Viets, A.; Deierling, W. An array of low-cost, high-speed, autonomous electric field mills for thunderstorm research. Earth Space Sci. 2020, 7, e2020EA001309. [Google Scholar] [CrossRef] [PubMed]
  39. Soula, S.; Chauzy, S. Multilevel measurement of the electric field underneath a thundercloud: 2. Dynamical evolution of a ground space charge layer. J. Geophys. Res. Atmos. 1991, 96, 22327–22336. [Google Scholar] [CrossRef]
  40. Standler, R.B.; Winn, W.P. Effects of coronae on electric fields beneath thunderstorms. Q. J. R. Meteorol. Soc. 1979, 105, 285–302. [Google Scholar] [CrossRef]
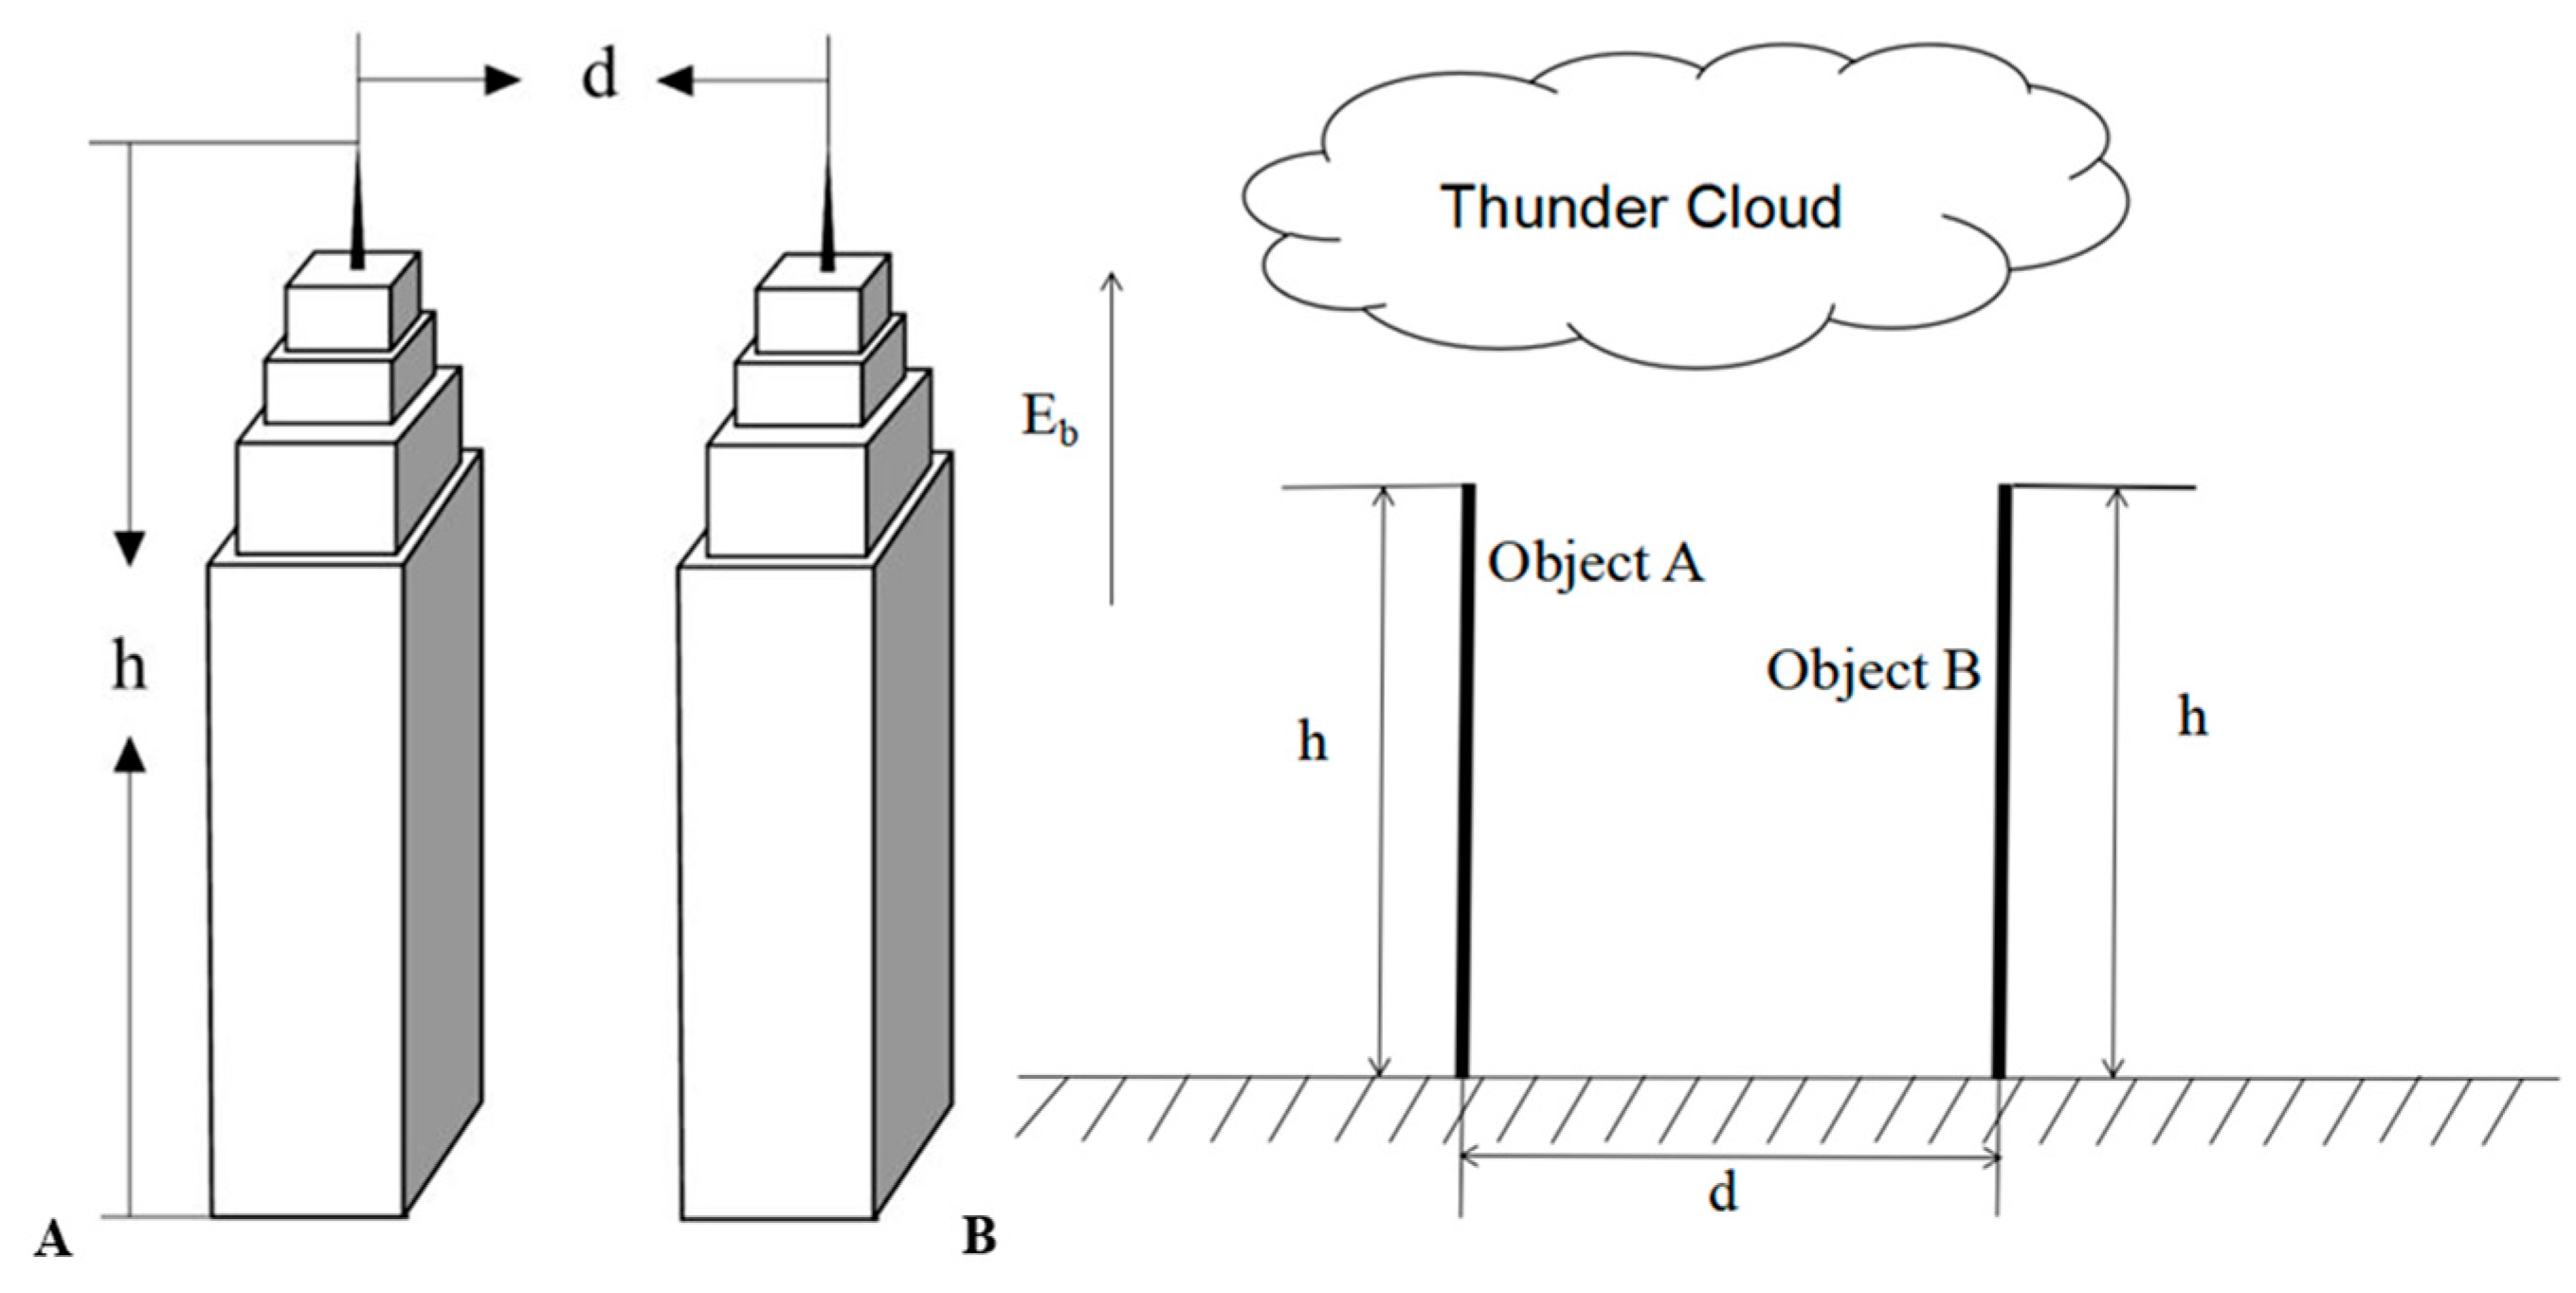
Figure 1. (A) is a schematic diagram of two building models. (B) is a simplified corona-discharge model diagram for a double-needle system.
Atmosphere 14 00789 g001
Figure 2. The trend of Eb changing with t.
Atmosphere 14 00789 g002
Figure 3. Variation of corona current with time in single− and double−needle systems with h = (A) 20 m, (B) 60 m, and (C) 100 m for different values of d. (D) Relationship between Ip-double and d in a double−needle system with different values of h.
Atmosphere 14 00789 g003
Figure 4. Characteristics of corona charges released for different d. Relationship between Qsingle and Qdouble with time for h = (A) 20 m, (B) 60 m, (C), and 100 m. (D) Relationship between Qdouble and d with different h.
Atmosphere 14 00789 g004
Figure 5. Distributions of the electric field in a double−needle system with or without CD at different heights. (A,D,G) Spatial electric field distributions without CD in a double−needle system with h = 20 m, 60 m, and 100 m, respectively. (B,E,H) Spatial electric field distributions of CD at t = 10 s in a double−needle system with h = 20 m, 60 m, and 100 m, respectively. (C,F,I) Spatial electric field distributions of CD at t = 20 s in a double−needle system with h = 20 m, 60 m, and 100 m, respectively. Additionally, the minimum value of z is in (H), which is at ground level.
Atmosphere 14 00789 g005
Figure 6. Side views of distributions of electric−field distortion coefficients of double−needle systems with different heights. (A,D,G) represent the distribution maps of the double−needle system without corona with heights of 20 m, 60 m, and 100 m, respectively. (B,E,H) represent the distribution maps of corona at t = 10 s in a double−needle system with h = 20 m, 60 m, and 100 m, respectively. (C,F,I) represent the distribution maps of corona at t = 20 s in a double−needle system with h = 20 m, 60 m, and 100 m, respectively. Additionally, the value of z is the same as in Figure 5.
Atmosphere 14 00789 g006
Figure 7. Electric field at the ground level of the double−needle system with different heights. (A,D,G) represent the distribution maps of the double−needle system without corona with heights of 20 m, 60 m, and 100 m, respectively. (B,E,H) represent the distribution maps of corona at t = 10 s in a double−needle system with h = 20 m, 60 m, and 100 m, respectively. (C,F,I) represent the distribution maps of corona at t = 20 s in a double−needle system with h = 20 m, 60 m, and 100 m, respectively.
Atmosphere 14 00789 g007
Figure 8. Shielding effects of the double−needle system on the ground electric field with and without CD at different times: h = (A) 20 m, (B) 60 m, and (C) 100 m. x represents the distance between object 1 and object 2, with positive to the right and negative to the left.
Atmosphere 14 00789 g008
Table 1. Differences between (i) corona charge released by two needles with different h and d and (ii) twice the corona charge released by a single needle.
h [m]d [m]Qsingle
at t = 10 s,
q1 [µC]
Qdouble
at t = 10 s,
q2 [µC]
Qdouble
at t = 20 s,
q3 [µC]
Qdouble
at t = 20 s, q4 [µC]
ΔQ1 = 2q1q2 [µC]ΔQ2 = 2q3q4 [µC]
20900.2020.3910.5170.9710.0130.063
1200.2020.4010.5171.0220.0030.012
1500.2020.4040.5171.02200.012
60900.8131.531.963.480.0960.44
1200.8131.601.963.750.0260.17
1500.8131.621.963.820.0060.10
100901.602.923.776.410.281.13
1201.603.093.776.980.110.56
1501.603.153.777.240.050.30
Table 2. Specific ranges of shielding of the ground electric field by a double-needle system with and without CD (all dimensional quantities are in meters).
h/mx1/mx2/mx2/x1x3/my1/my2/my2/y1y3/mp1/mp2/mp2/p1p3/m
208708.81504307.56215510
60531502.815017804.71503103.340
1001001501.5150331504.51505142.862
Disclaimer/Publisher’s Note: The statements, opinions and data contained in all publications are solely those of the individual author(s) and contributor(s) and not of MDPI and/or the editor(s). MDPI and/or the editor(s) disclaim responsibility for any injury to people or property resulting from any ideas, methods, instructions or products referred to in the content.