Article

Effects of the Trends in Spring Sensible Heating over the Tibetan Plateau during Different Stages on Precipitation in China

1
Key Laboratory of Meteorological Disaster, Ministry of Education (KLME)/Collaborative Innovation Center on Forecast and Evaluation of Meteorological Disasters (CIC-FEMD)/Joint International Research Laboratory of Climate and Environment Change (ILCEC)/Joint Center for Data Assimilation Research and Applications, School of Atmospheric Sciences, Nanjing University of Information Science & Technology, Nanjing 210044, China
2
Bijie Meteorological Bureau, Bijie 551700, China
*
Authors to whom correspondence should be addressed.
Atmosphere 2023, 14(5), 812; https://doi.org/10.3390/atmos14050812
Submission received: 28 March 2023 / Revised: 25 April 2023 / Accepted: 27 April 2023 / Published: 29 April 2023
(This article belongs to the Special Issue Tibetan Plateau Weather and Climate & Asian Monsoon)

Abstract

:
The spring sensible heating (SSH) over the Tibetan Plateau (TP), which can significantly affect the precipitation in China, has experienced three different stages of change, showing significant increasing (1961–1979, Stage I), decreasing (1980–2002, Stage II), and increasing (2003–2014, Stage III) trends. In this study, the impact of these different trends in TP SSH on spring precipitation (SPR) in China and their possible mechanisms are investigated, based on observations and the reanalysis product. In Stage I, the SPR represents a contrasting north-south pattern associated with the increasing TP SSH, showing increasing trends over southern China and decreasing trends over central and northern China. Further, the spatial distribution of SPR trends shows a contrasting east-west pattern in Stage II. That is, persistent weakening TP SSH plays a more crucial role in increasing and decreasing SPR over southwestern and southern China, respectively. However, compared with the significant trend in SPR in Stage III, the regulation of TP SSH on SPR weakens significantly. Dynamically, the increasing TP SSH in Stage I can strengthen the subtropical westerly jet in the upper layer, simultaneously configured with an anomalous cyclone in northeastern China, which deepens the East Asian trough. Thus, anomalous convergence in the upper layer occurs over central and northern China, favoring the downdraft. It then causes more cold and dry air to move southward in the lower troposphere, which then encounters the warm and wet southwest airflows, boosting the updraft over southern China. In Stage II, regression analysis shows that if the TP SSH increases, an anomalous cyclone in the middle and upper troposphere occurs over the western TP, causing the downdraft and less precipitation over southwestern China, while a cyclone in the lower troposphere occurs over the western North Pacific and extends to southern China, promoting the ascending motions and more precipitation in southern China. However, in this stage, TP SSH actually weakens, thus contributing to more precipitation over southwestern China and less precipitation over southern China.

1. Introduction

The Tibetan Plateau (TP), with complex terrain and surface conditions, is well known as “the third pole of the Earth”. As a huge air pump [1], the TP directly acts on the middle troposphere and regulates the atmospheric circulation of the surrounding areas and even the entire northern hemisphere [2,3,4,5,6]. Numerous studies have pointed out that surface sensible heat flux (SH) dominates the thermal conditions over the TP in spring and has a close relationship with the weather and climate changes in the local and downstream regions [7,8,9,10,11,12,13,14,15,16].
The spring SH (SSH) over the TP plays important roles in the precipitation over eastern China. Duan et al. [7] pointed out that the TP SSH could affect the onset and evolution of the East Asian Summer Monsoon by changing the circulations of the winter-summer transition, further impacting the precipitation in South China and the middle and lower reaches of the Yangtze River. Li et al. [17] demonstrated that a positive anomaly of the TP SSH could change the wave train in the middle and high latitudes and generate an anomalous anticyclone in the northwest Pacific Ocean, which then provided sufficient water vapor for spring precipitation (SPR) in the middle and lower reaches of the Yangtze River. Additionally, the model results [2,18] also indicated that thermal anomalies over the TP could cause atmospheric low-frequency oscillations and variations in atmospheric remote-related circulation patterns, thus changing the precipitation distributions in China.
Actually, the TP SSH is shown to have undergone significant interdecadal changes. Several previous studies [19,20,21,22] have shown that the TP SSH has weakened since the 1980s, entering a stage of continuous strengthening, with a turning point around 2000. Thus, TP SH has shown three distinct trend changes in recent decades: strengthening (1960s–1980s), weakening (1980s–around 2000), and strengthening (after about 2000). The weakened trend in TP SSH from the 1980s to 2000 suppressed the effect of “SH air pump”, which gave rise to increased precipitation over southern China and decreased precipitation over northeast China and the southern and eastern slopes of the TP in summer [7,23,24], forming a triple pattern over China. However, the rebound of TP SSH after the 2000s has eased this summer precipitation pattern, to some extent [25].
Most previous studies actually focused mainly on the weakening trend in TP SSH from 1980s to 2000s and its effect on precipitation over China. It remains unclear whether the precipitation in China can be differently affected in the various stages of SSH trends, and the related mechanisms remain to be determined. Moreover, most of existing studies concern summer precipitation associated with the TP SSH, but the SPR has received much less attention. In fact, the SPR plays an important role in the vegetation phenology and agricultural practices in China because it can cause some natural disasters, such as spring droughts and heavy rainfalls during the pre-flood season in southern China. The in-depth investigation of SPR is of great value and practical significance. Hence, we here comprehensively investigate the characteristics of the interdecadal variations of the TP SSH, their impacts on the SPR over China, and the possible mechanisms at work during different trend stages.
This paper is organized as follows: Section 2 presents the data and methods; Section 3 describes the characteristics of the SH over the TP from 1961 to 2019; Section 4 investigates the effects of the TP SSH on the SPR over China; and Section 5 examines large-scale circulation fields related to the TP SSH affecting the trend in SPR over China. The discussion and conclusions are provided in Section 6 and Section 7, respectively.

2. Data and Methods

2.1. Data

This study used multi-source datasets, including:
(1)
The ground surface temperature (Tg), air temperature (Ta), the wind speed at 10 m (V10), and SH datasets at 293 stations was provided by Duan et al. [26], which were originally obtained from the China Meteorological Administration (CMA) and can be freely download at http://staff.lasg.ac.cn/amduan/index/article/index/arid/11.html (accessed on 3 July 2022). In this study, the respective data from 58 stations over the central and eastern TP from 1961–2019 are employed.
(2)
The precipitation data was obtained from the reanalysis meteorological dataset CN05.1 [27], with a resolution of 0.25° × 0.25° over the China region, which is a daily observational data interpolated from more than 2400 stations (basic stations, reference stations, and general stations) during the period of 1961–2014.
(3)
ERA5, the fifth generation European Center for Medium-Range Weather Forecasts (ECMWF) reanalysis for the global climate and weather (https://cds.climate.copernicus.eu/, accessed on 3 January 2023) [28,29], was also used. The spatial resolution is 0.25° × 0.25° and the time period is from 1940 to the present. The monthly averaged data (such as air divergence, water vapor flux, vapor flux divergence, vertical velocity, and the wind component) are used in this study.

2.2. Methods

The S H dataset from Duan (2022) is calculated according to the bulk transfer equation:
S H = ρ C p C D H V 10 ( T g T a )
where ρ is the air density, C p is the specific heat capacity of dry air under constant pressure, V 10 is the wind speed at 10 m, T g is the ground surface temperature, and T a is the air temperature at 1.5 m. The statistical downscaling method developed by Yang et al. [30] is used to calculate the heat transfer coefficient C D H by the interpolated high-resolution variables ( V 10 , T S and T g ) in Equation (1) to estimate the daily S H , which can reduce the uncertainty compared to the fixed C D H . The accuracy and reliability of this SH dataset have been examined in previous studies [31,32].
The linear regression is widely used in meteorology to analyze the relationship between two variables:
y i = a + b x i ( i = 1,2 , n )
where x i denotes the independent variable, y i is the dependent variable, and n is the sample size of these two variables. The regression constant a and the regression coefficient b can be solved by Equation (3):
b = i = 1 n y i x i 1 n ( i = 1 n y i ) ( i = 1 n x i ) i = 1 n x i 2 1 n ( i = 1 n x i ) 2 a = y b x
where x and y are the average value of x i and y i , respectively.
When analyzing the turning points of the interdecadal trend in SSH over the TP from 1961–2014, we employed the piecewise regression method [33,34], based on a Python library (pwlf) [35], which can be used to obtain the optimal positions of the breakpoints, if the required number of trend segments is given, through global optimization to minimize the error sum of squares.

3. Characteristics of the SH over the TP

3.1. Climatological SH over the TP

The climatological spatial distribution of the SH at 58 stations over the central and eastern TP is shown in Figure 1. The average value of SH at these stations is about 44.20 W m−2, which basically agreed with previously obtained results [19,20,21]. In space, the SH over the northern TP (north of 35° N) is larger, with an average value of 47.22 W m−2, and the SH over the eastern TP (east of 98° E) is relatively smaller, with an average value of 42.26 W m−2, which shows a similar spatial distribution to those in previous studies [31].
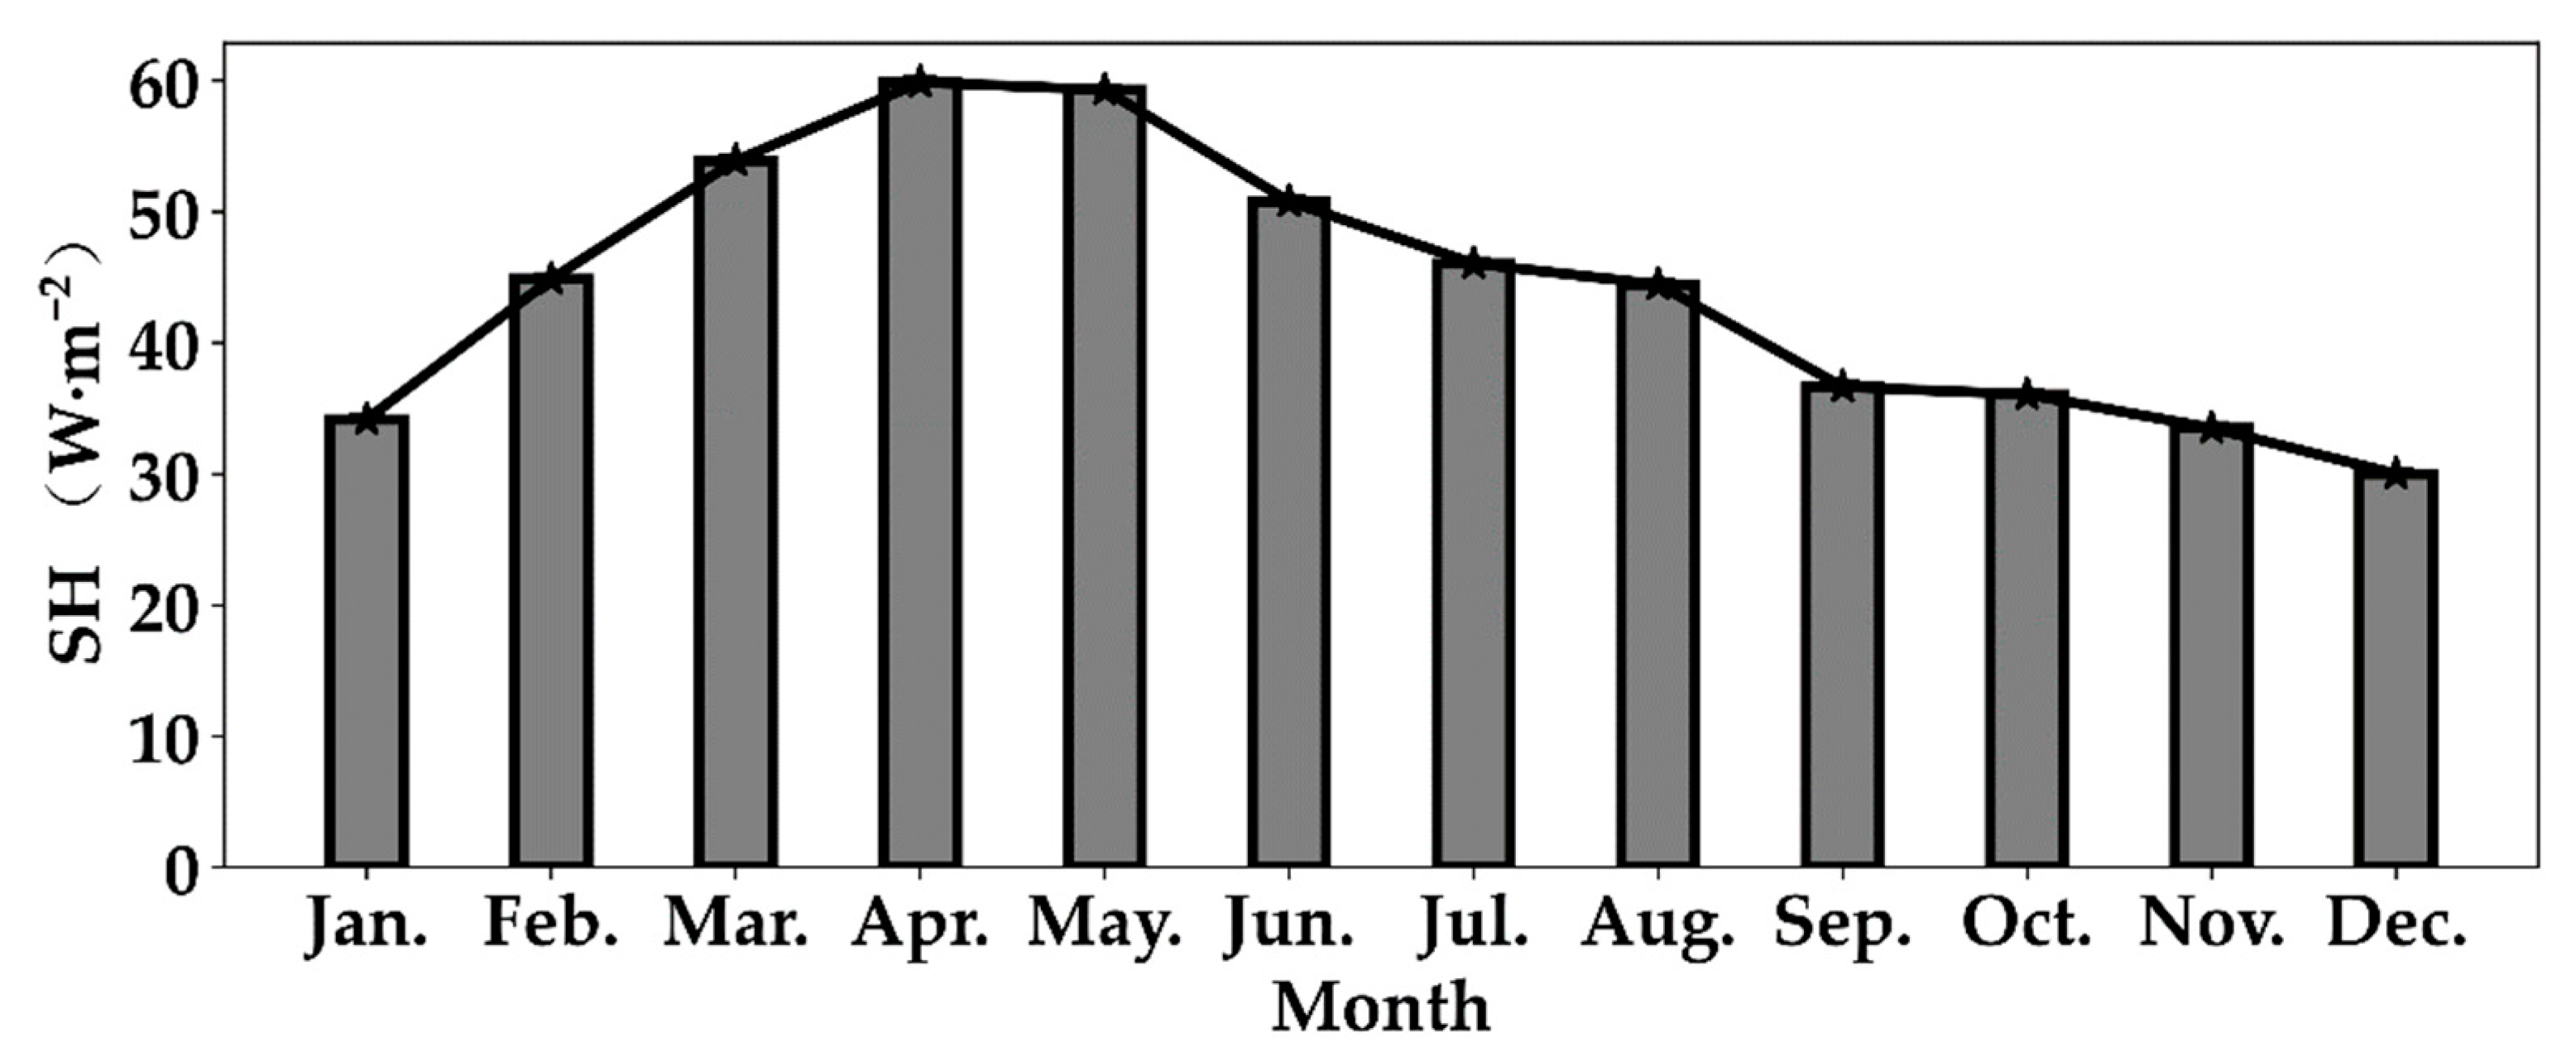
Figure 2 shows the annual cycle of the TP SH. The SH is positive throughout the year, showing a single peak with the maximum value of about 59.88 W m−2 in April, and then decreasing gradually, with only 30.01 W m−2 in December. Clearly, the SH in spring is the strongest for the whole year. As a transition season from winter to summer, spring is not only the time when the TP changes from a cold source to a heat source, but the stage of seasonal mutation of atmospheric circulation also changes [17]. Therefore, the SSH is very important and can play a prominent role in multi-scale changes.

3.2. Trends in SSH during Three Stages

Figure 3 presents the time series of SSH over the central and eastern TP, with obvious interannual and interdecadal variabilities. Specifically, the SSH displays a significant increasing trend, with 0.43 W m−2 yr−1 (p < 0.05) during the period of 1961–1979 (Stage I), a decreasing trend, with −0.12 W m−2 yr−1 (p < 0.05) from 1980 to 2002 (Stage II), and finally, a relatively slow increasing trend, with 0.23 W m−2 yr−1 (p < 0.1) during 2003–2014 (Stage III) (Table 1). This is basically consistent with previous conclusions [20]. For the evolution of the SSH, the three stages take 19, 23, and 12 years, respectively, with two key turning points at 1979 and 2002 (Table 1). After 2014, it seems that the SSH begins to again decrease somewhat, and there is no recovery until 2019, so we mainly focus on 1961–2014 in this study.
According to the calculation of SH (Equation (1)), the temperature difference between ground and air (Tg-Ta) and the wind speed at the height of 10 m (V10) are the key influencing factors of SH, so the variations in these two variables may explain the change in the SH trend. During the first period (1961–1979), the V10 represents a similar increasing trend to the SSH, while Tg-Ta shows strong interannual variations, without an obvious trend. Thus, the V10 is considered as the dominant factor leading to the upward trend of SSH. Similarly, the decreasing V10 is also responsible for the weakening trend in SSH in Stage II. However, it is clear that the increasing Tg-Ta accounts for the strengthening trend in SSH in Stage III. These findings further verify the results of previous studies [21,36,37,38]. Additionally, some studies also demonstrated that the turning point of SH occurring around 2000 is not an independent phenomenon, but is related to the adjustment of the global climate system [39,40].

4. Effects of the TP SSH on the SPR over China

The SSH over the TP can be used as an important indicator for the summer precipitation of eastern China [41,42], with the existing mechanisms of “soil memory” [1] and positive feedback between diabatic heating and local circulation [7]. However, the impacts of the TP SSH on the SPR over China and determining whether the key SPR areas affected by SSH will be different under the three stages still remained to be investigated.
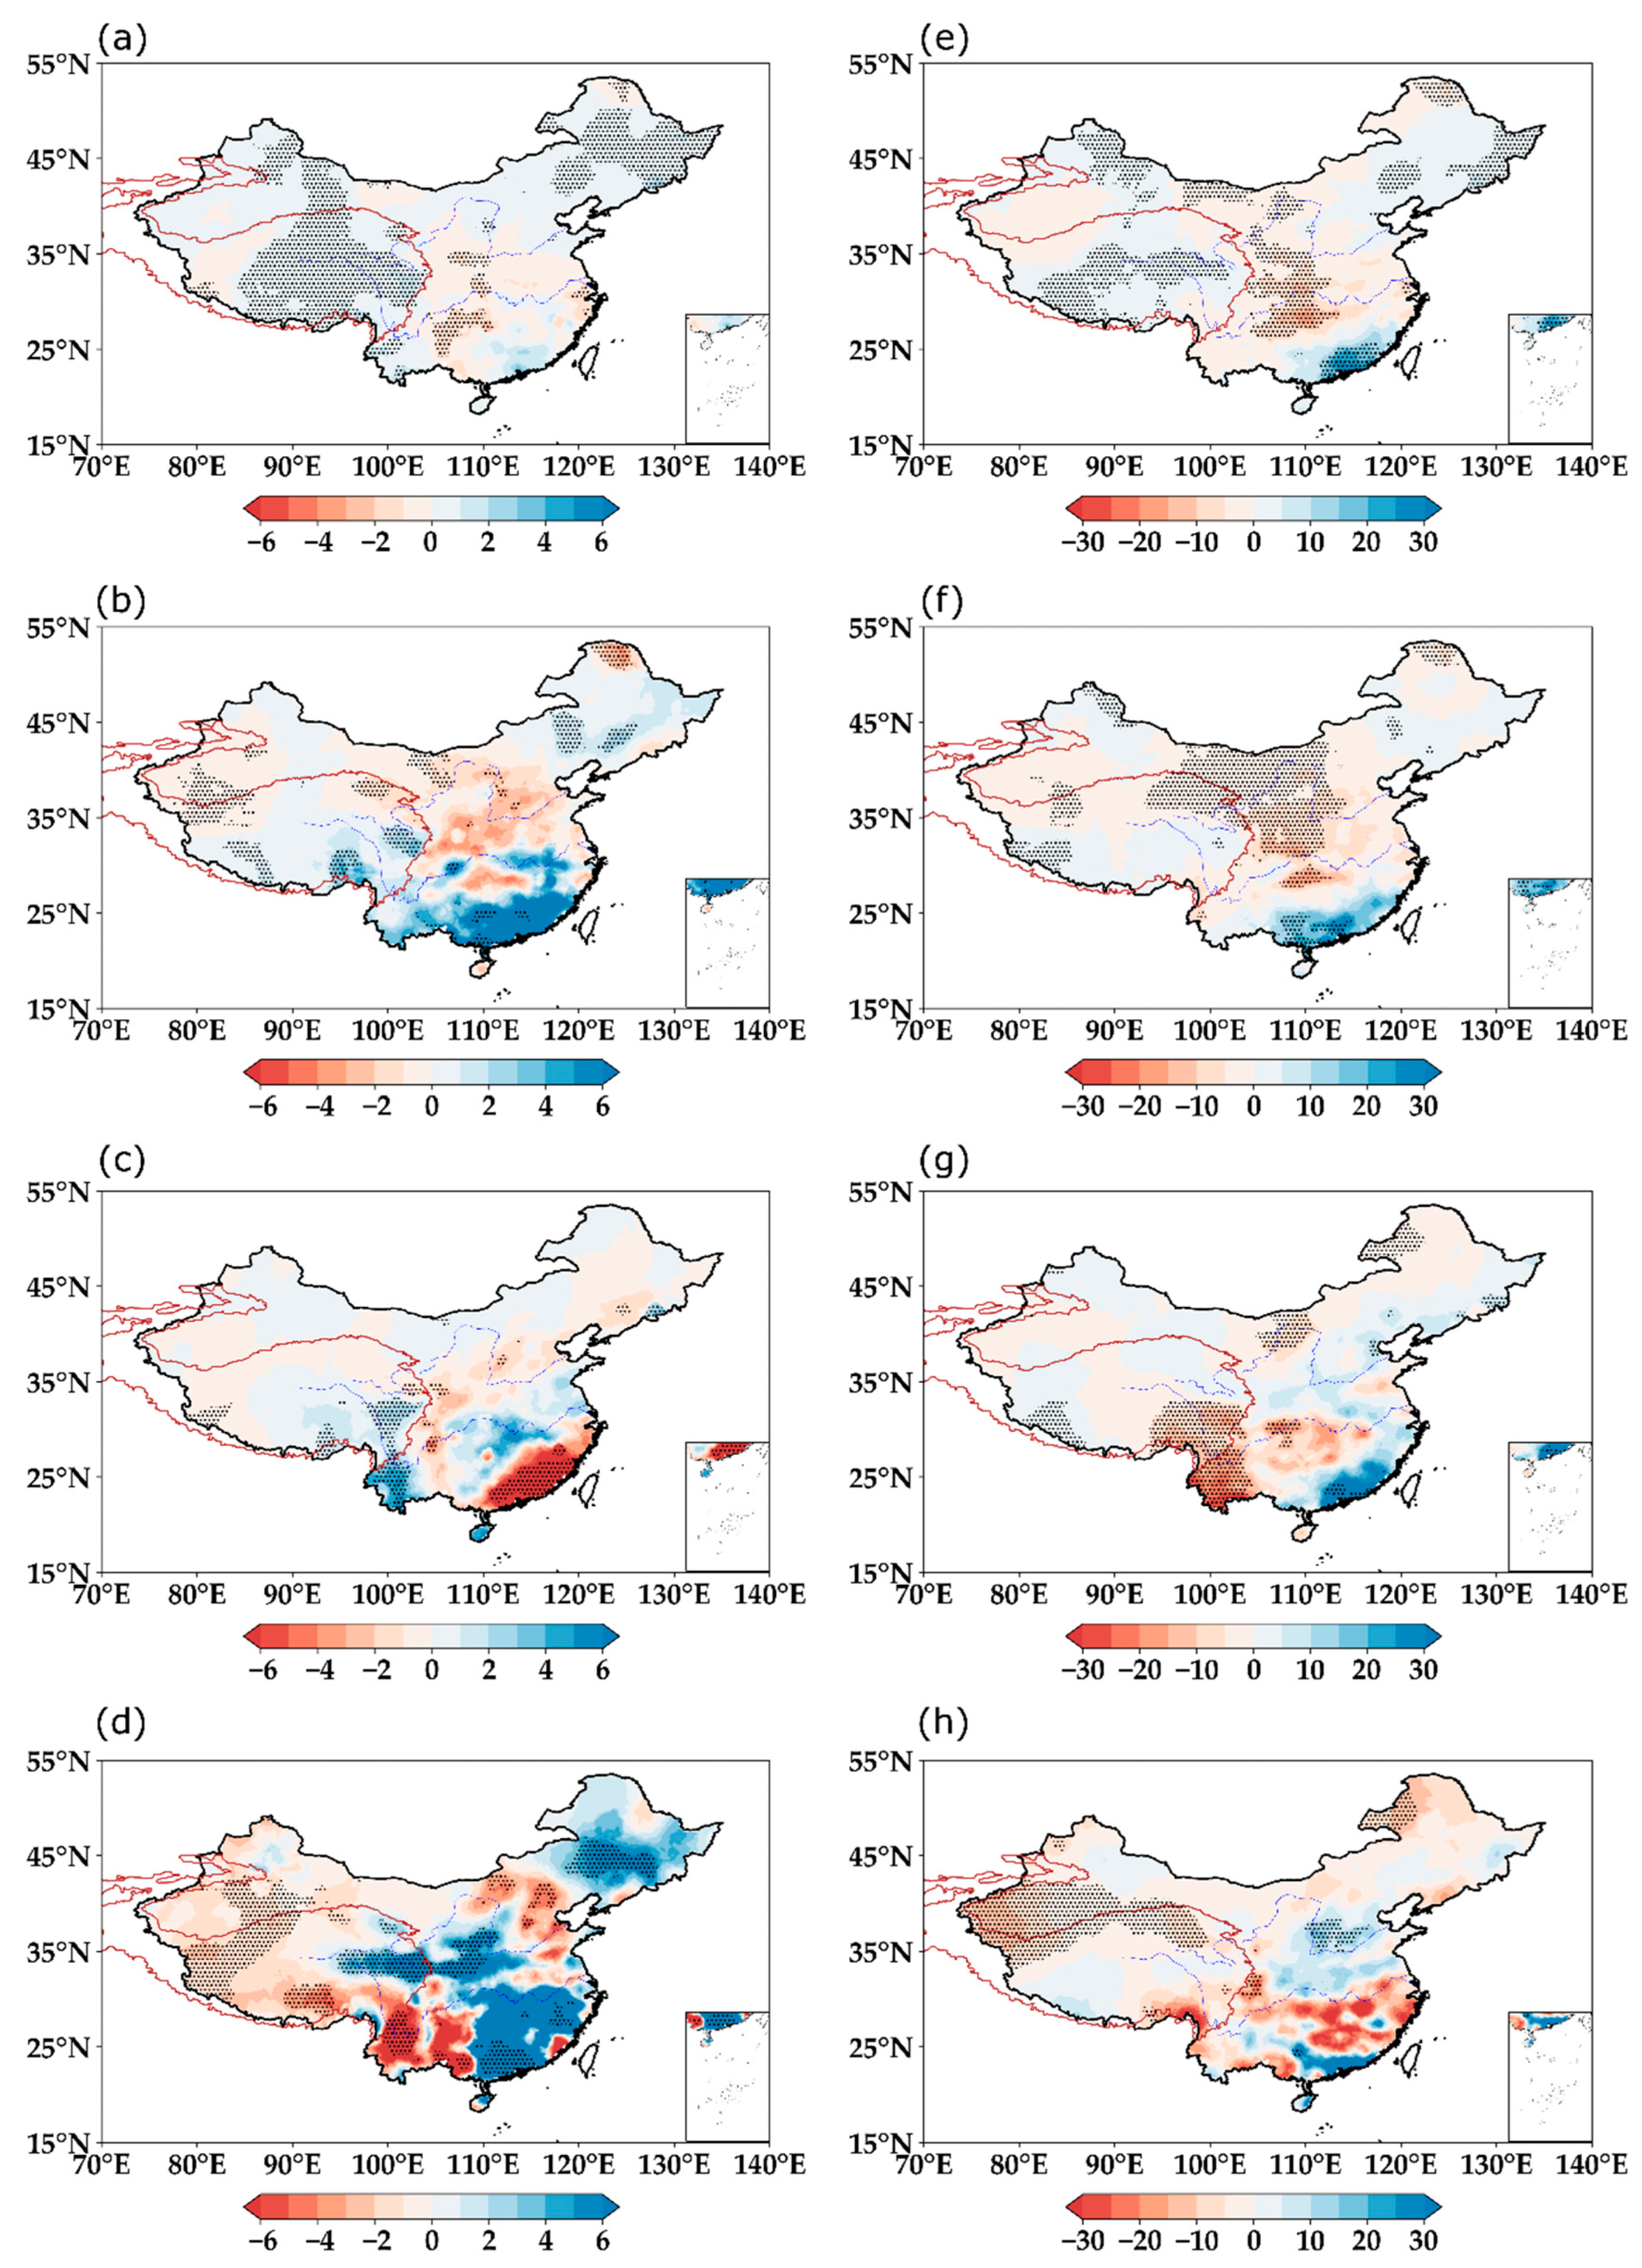
First, in Figure 4a, we can see the linear trend in SPR during the entire time period of 1961–2014. The spatial distribution of the SPR trend shows an east-west tripole pattern. The significant increasing trend of SPR is mainly distributed over northeastern China and the TP region, and the obvious decreasing trend of SPR is located in central China and the lower reaches of the Yangtze River, which is consistent with the results of previous research [43]. For the southern China, the SPR here shows an increasing, but weak, trend. The pattern of the regressed SPR on the TP SSH (Figure 4e) seems basically similar to that of the SPR trend, but with more significant signals over southern China, indicating that the SSH over the TP can affect the SPR in China to a great extent, especially for the TP region, central China, and southern China.
In order to confirm whether the TP SSH have different impacts on SPR in China during three stages, the situation for the three stages is separately examined. During Stage I (Figure 4b,f), the SPR pattern is quite different from that observed in Figure 4a, with fewer areas of obvious enhanced SPR over the TP and northeastern China, but much more strongly enhanced SPR over southern China (Figure 4b). Compared to the regressed field (Figure 4f), it can be seen that the increasing TP SSH has an obvious positive effect on the SPR over southern China, which is consistent with the actual increasing SPR trend shown here (Figure 4b). Essentially, significant negative sensitivities in central and northern China demonstrate that the SPR here should have obviously decreased with the increasing trend in TP SSH (Figure 4f), but in fact, the reduction in SPR here is not significant in most areas, suggesting that TP SSH may not be the dominant factor of the SPR trend here from 1961 to 1979.
In Stage II (1980–2002), the regions with notable trends in SPR have changed, with robust decreasing SPR over southern China and increasing SPR over southwestern China (Figure 4c), which is also quite different from the pattern observed during the entire time period (Figure 4a). The spatial distribution of the trends in SPR regressed on TP SSH shows the obvious positive sensitivity in southern China and negative sensitivity in southwestern China (Figure 4g). In this stage, the TP SSH actually weakens, which therefore contributes to more precipitation over southwestern China, but less precipitation over southern China, identical to these results shown in Figure 4c. It is quite certain that TP SSH is the dominant factor for controlling the key regions of SPR variations in China during the period of 1980–2002.
In Stage III (2003–2014), the trend in SPR throughout China is quite robust relative to the first two stages, and its spatial distribution is very complex, with an increasing trend over southern, central, and northeastern China, but a decreasing trend over other regions, especially southwestern China (Figure 4d). However, from Figure 4h we can see that TP SSH can only significantly influence the SPR in the Yellow River Basin and western Xinjiang, which actually suggests that the effect of TP SSH on the SPR trend in China at this stage is considerably weaker compared with the trend in SPR itself (Figure 4d).
Overall, the TP SSH, especially during the first two stages, can remarkably regulate the SPR trend and its spatial distribution pattern over China. Specifically, the SPR associated with TP SSH represents a contrasting north-south trend pattern in Stage I, but the contrasting east-west pattern in Stage II. During these two stages, the SPR over southern China always exhibits a positive sensitivity with the TP SSH. In Stage III, it seems that the effect of TP SSH on the SPR trend over China is greatly weakened. Moreover, it is worth noting that the SPR trend in southwestern China and its association with the TP SSH are only obvious in Stage II (Figure 4c,g), but are not observed in the entire period of 1961–2014 (Figure 4a,e), suggesting the necessity for us to separate the stages to better understand the impacts of TP SSH on SPR variations.

5. Large-Scale Circulation Fields Related to the Trend in SPR Affected by TP SSH

The above analyses show that the SSH over the TP has a significant impact on the SPR over China, and the regions are affected differently during the different stages. In order to analyze how the TP SSH affects the SPR over China, in the following text, the possible mechanism is discussed from the viewpoint of atmospheric circulations.
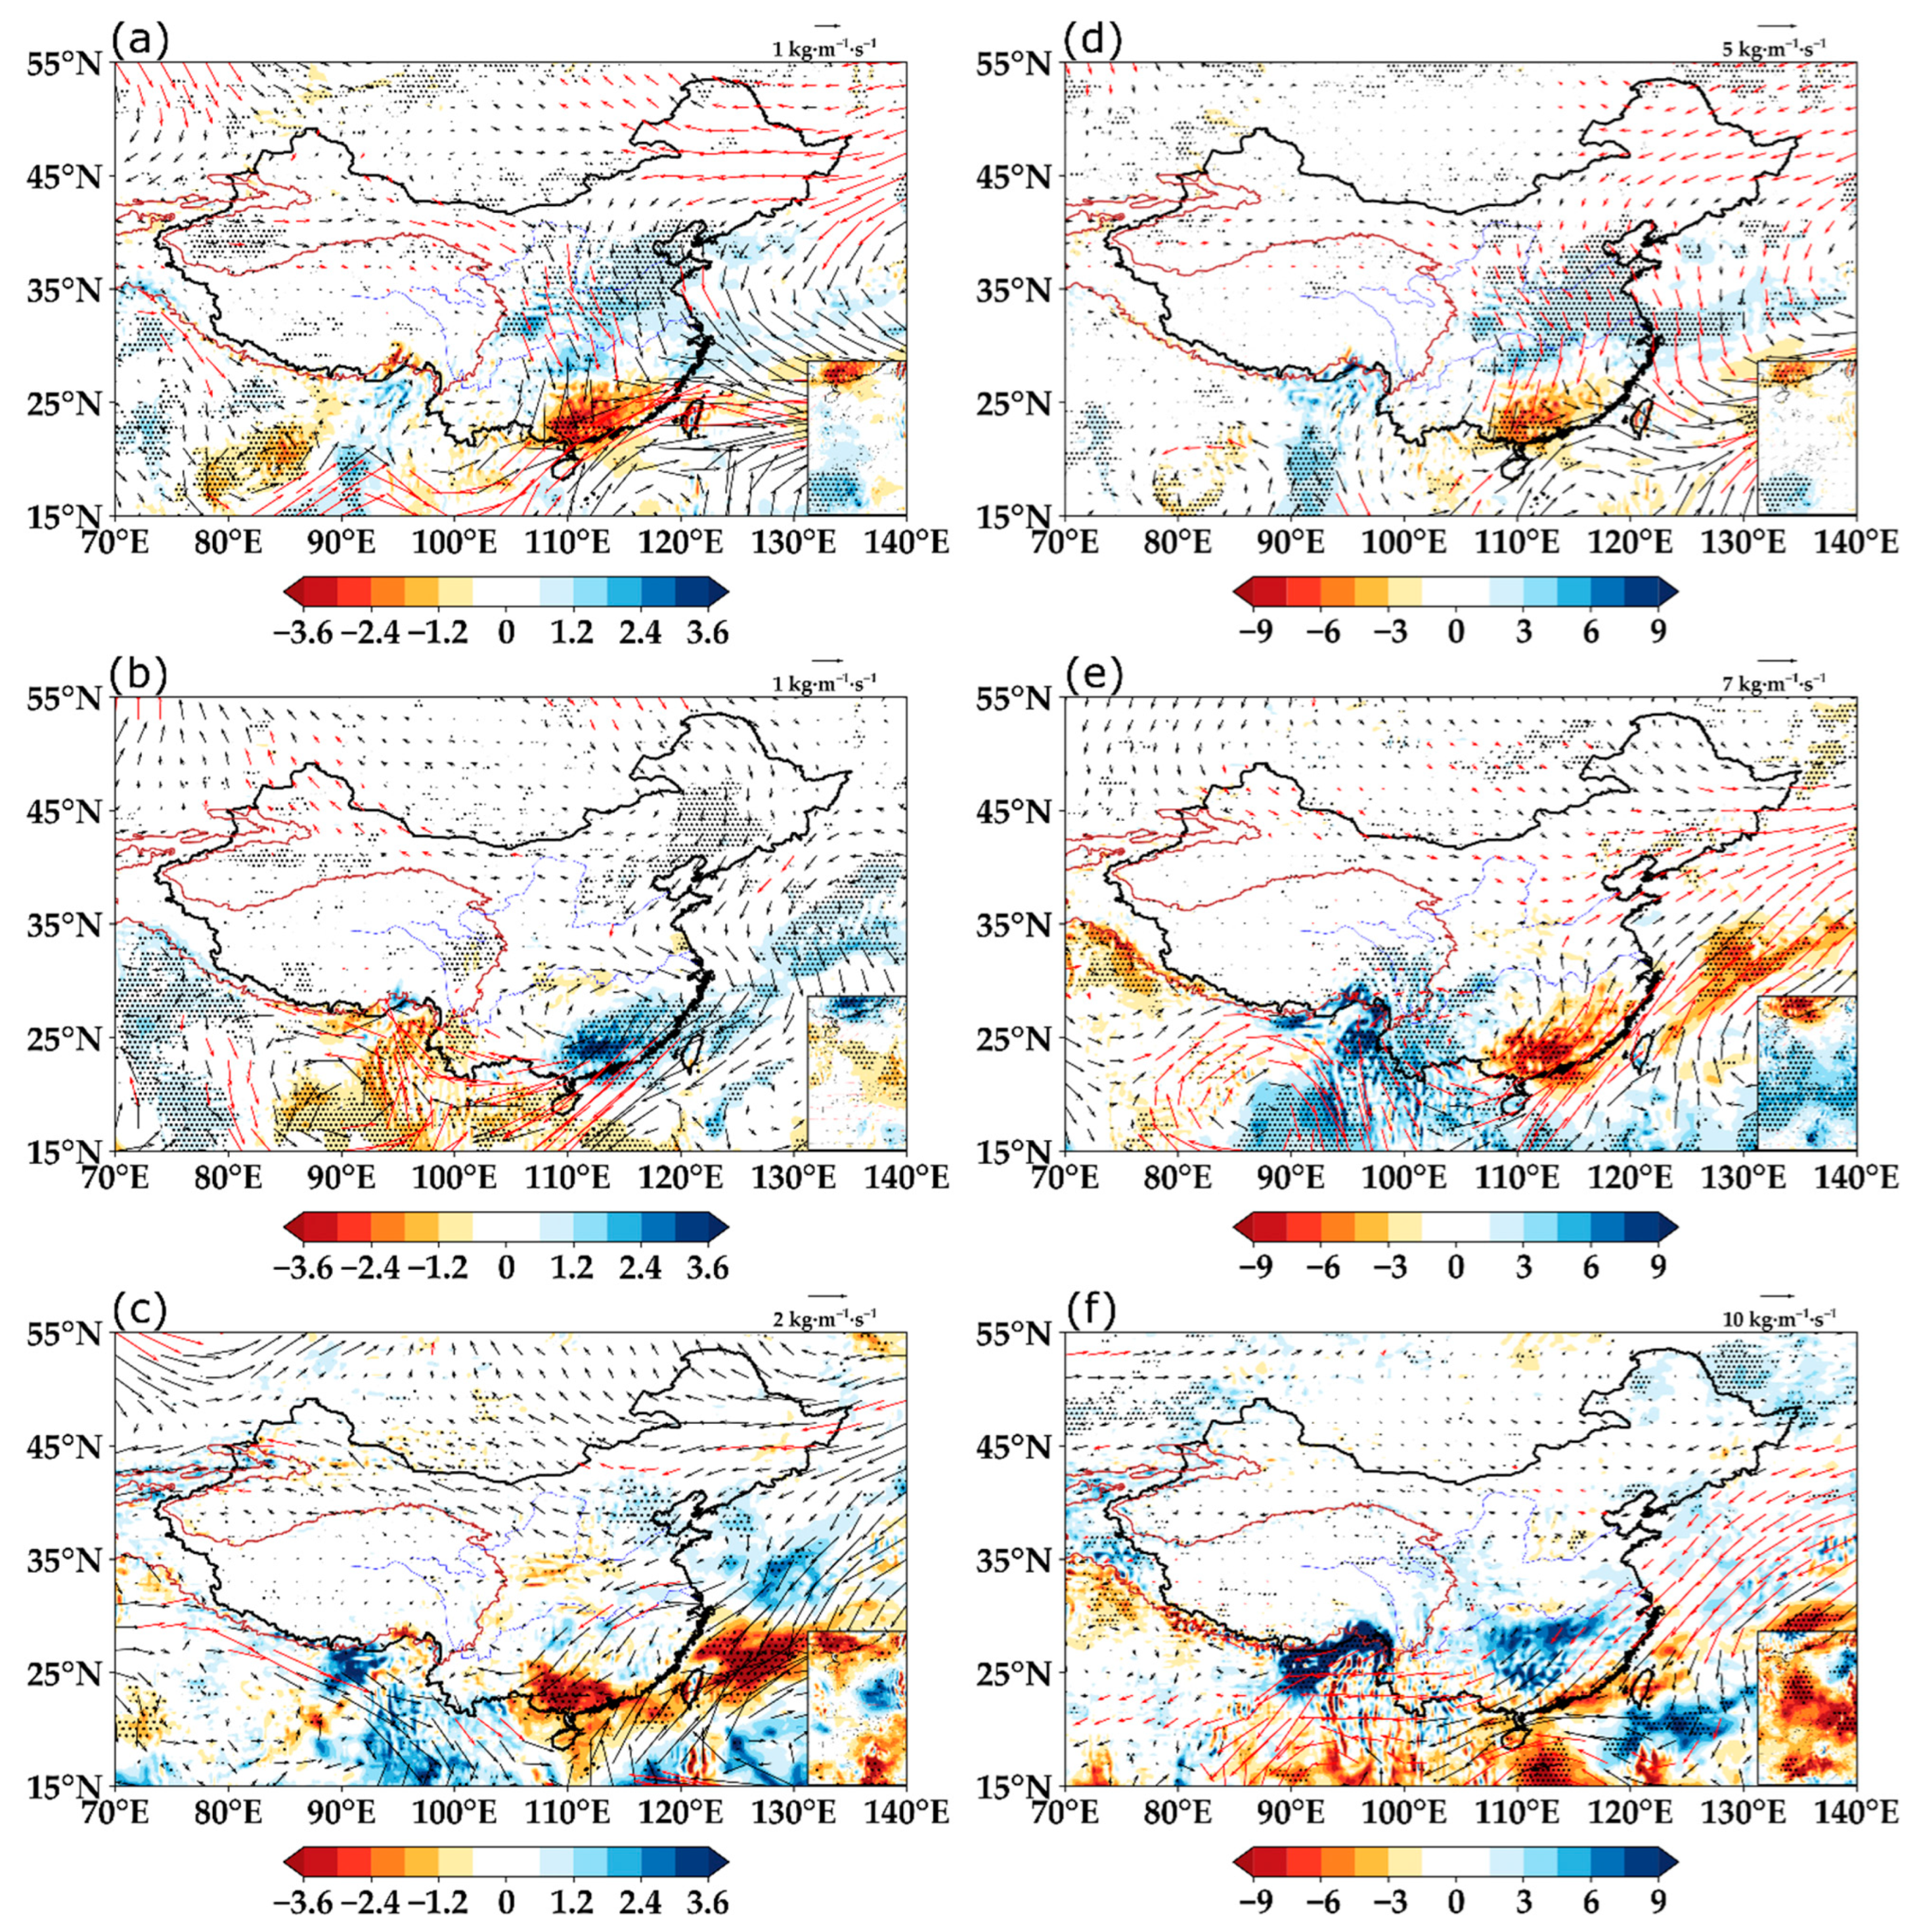
The long-term trend and regression coefficients of the integrated water vapor flux and divergence in the three stages are shown in Figure 5. In Stage I, a robust southwesterly flow can only extend northward to 25° N, providing a plentiful supply of water vapor to southern China (Figure 5a), with the significant moisture convergence corresponding to the enhanced SPR center (Figure 4b). Simultaneously, an anomalous northerly moisture flow prevails in central China, with strong moisture divergence, which is responsible for the weakening trend in SPR observed here (Figure 4b). The regression fields of the moisture flux and divergence on the TP SSH (Figure 5d) are very similar to the observed trends (Figure 5a), suggesting that TP SSH has an important role in the trend in SPR over eastern China, especially for southern China in this stage.
In Stage II, the northeasterly wind of an anticyclonic circulation prevails in southern China, opposite to the southwestern airflow in the climatic state, causing a vapor reduction with a divergence (Figure 5b), and the airflows from the South China Sea and the Bay of Bengal enter southwestern China and southeastern TP, leading to a water vapor convergence. Hence the moisture conditions correspond to the decreasing SPR in southern China and the increasing SPR over southwestern China (Figure 4c). Considering that the actual SSH is downward in this stage, the regression field (Figure 5e) shows a coherent pattern with the linear trend (Figure 5b), indicating that the trend of TP SSH in stage Ⅱ can greatly affect the SPR changes in southern China, southwestern China, and the southeastern TP.
In Stage III, an anomalous cyclonic circulation occurs in southern China (Figure 5c), which can lead the moisture from the western Pacific and the South China Sea to southern China, forming an obvious vapor convergence, which is conductive for the increasing regional SPR (Figure 4d). However, for the regression field of the moisture flux and divergence (Figure 5f), there is no significant vapor convergence in southern China, but an obvious vapor divergence in the north of southern China. This is consistent with the SPR situations (Figure 4d,h). It potentially indicates that the SSH over the TP is not the dominant factor of the SPR changes in China from 2003 to 2014.
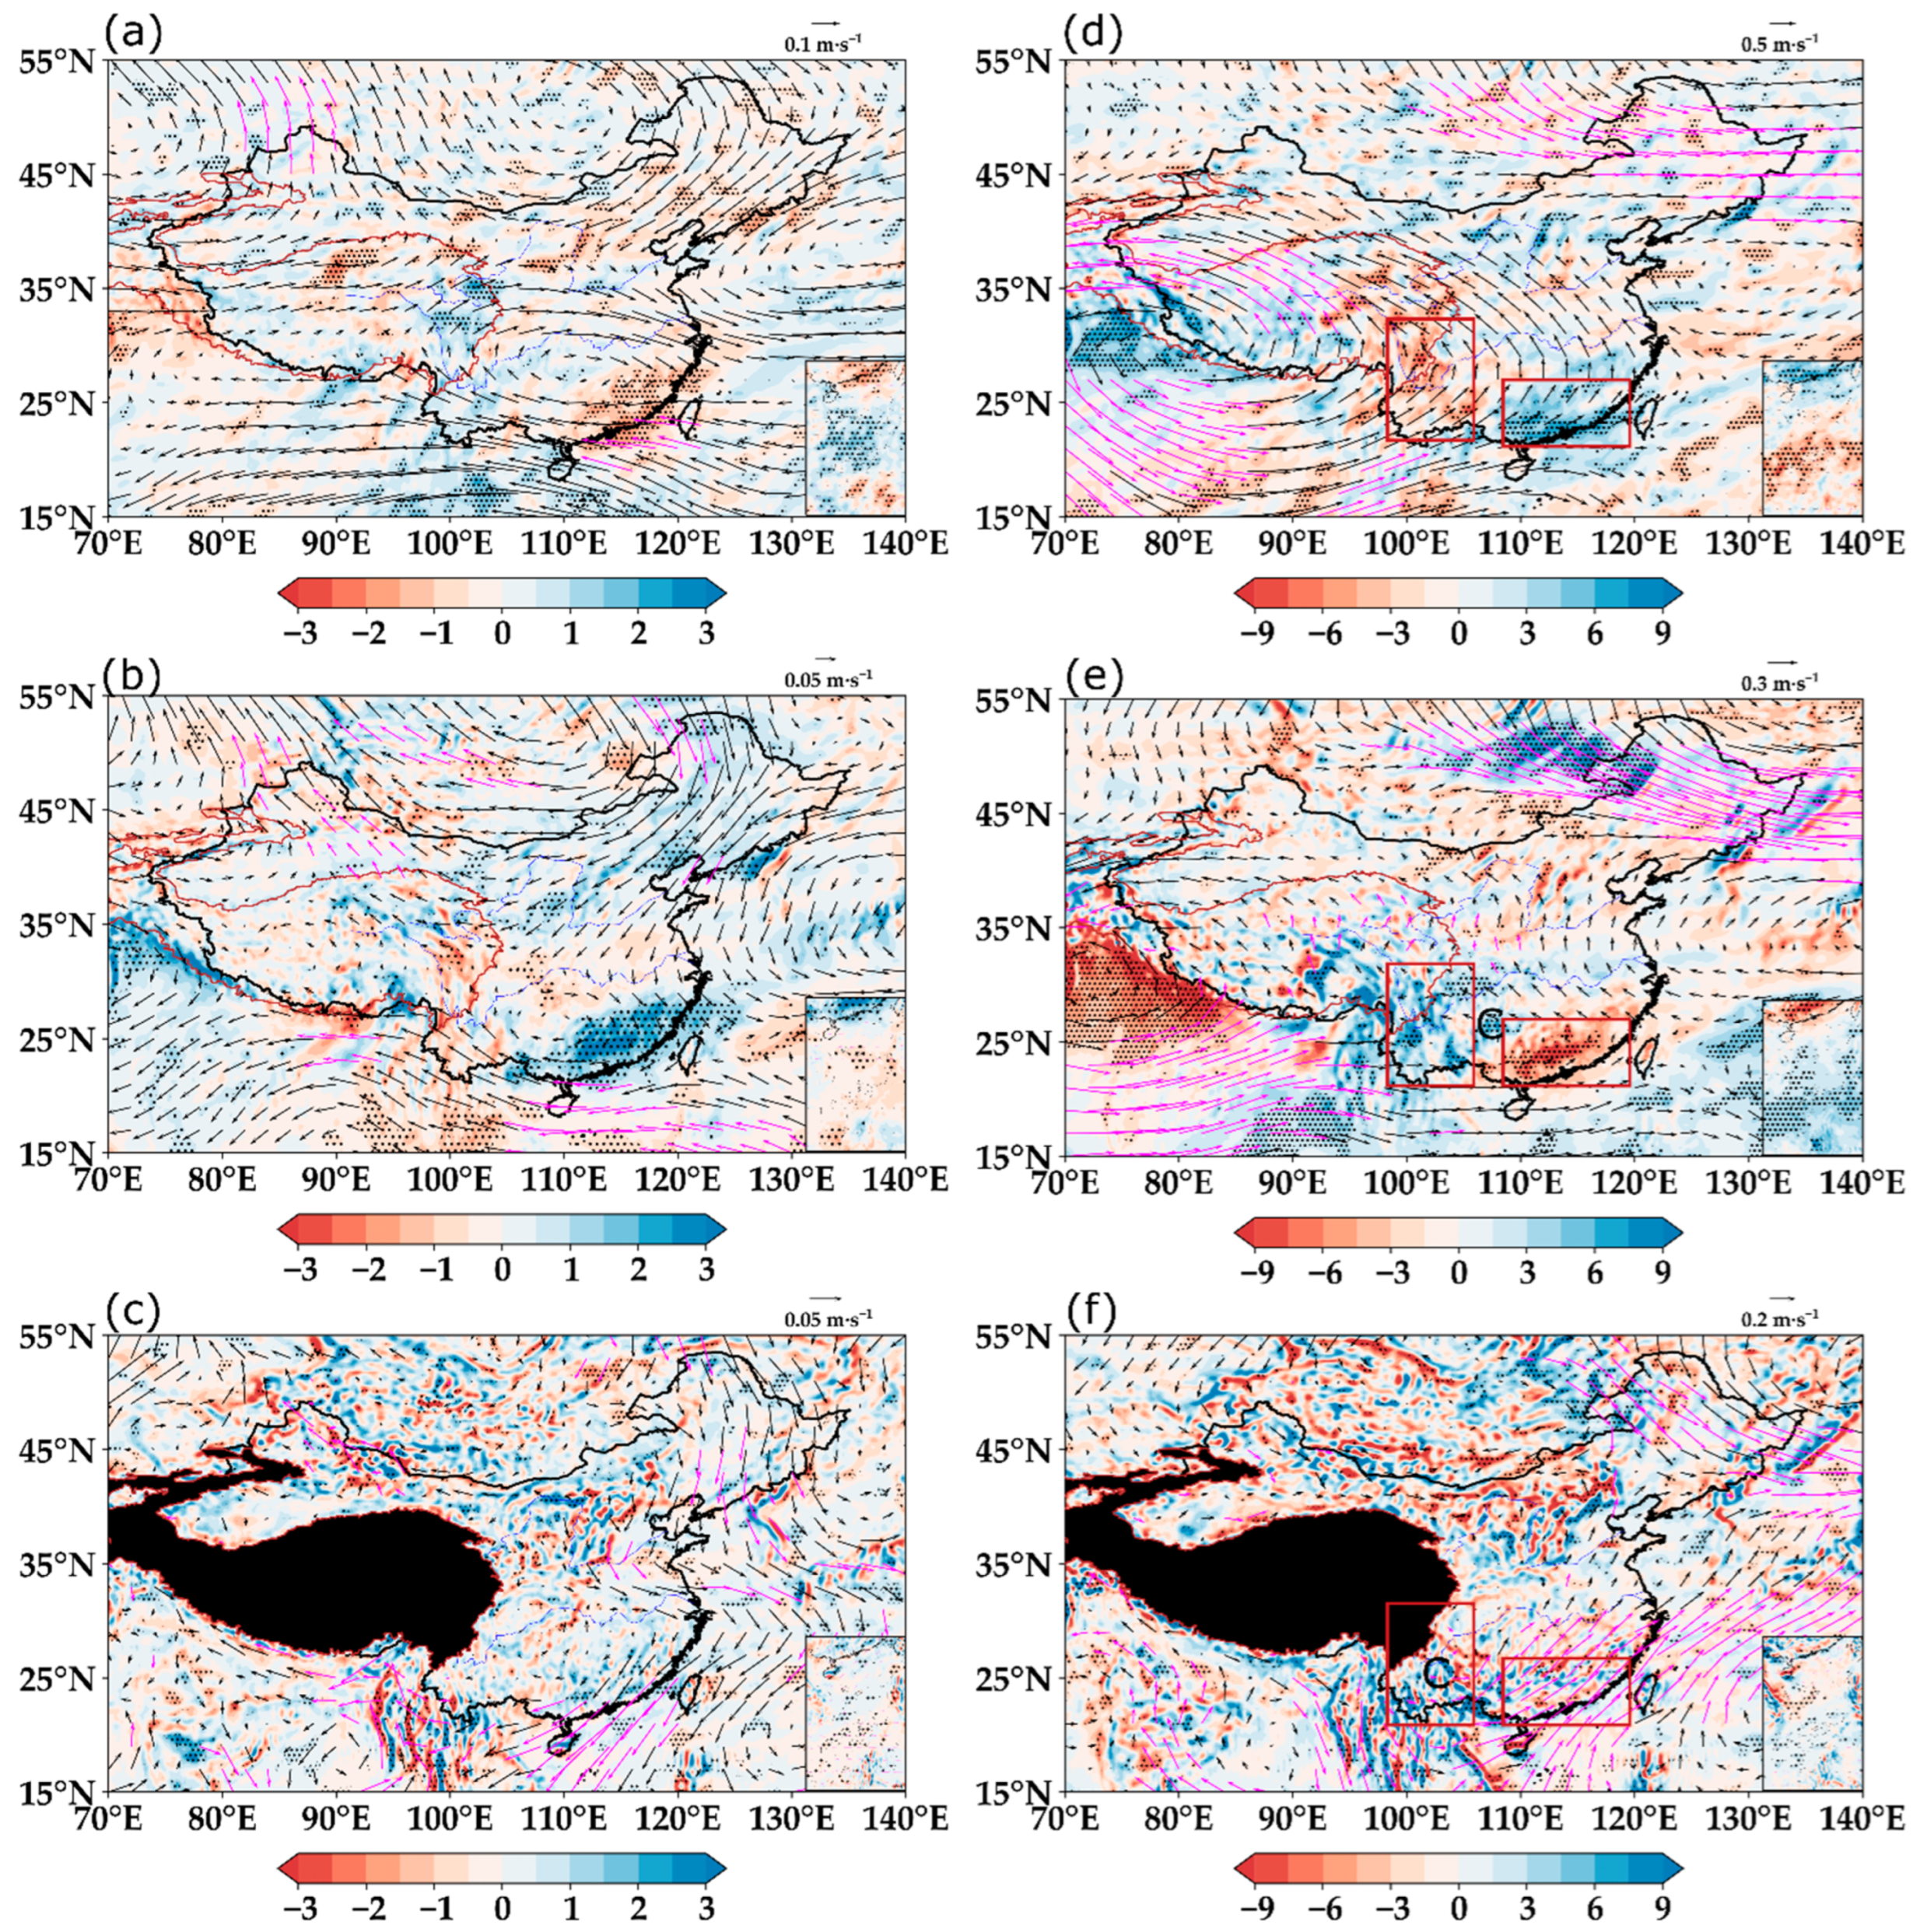
Figure 6 shows the long-term trend and regression coefficients of the atmospheric circulations at 200, 500, and 850 hPa in Stage I. They are basically similar, suggesting that circulations influencing the trend in SPR are mainly regulated by the TP SSH during this stage. For simplicity, we only need to focus on the regression fields in Figure 6d–f.
The strengthening subtropical westerly jet at 200 hPa, accompanied by an anomalous cyclonic circulation in northeastern China, both lead to a significant upper-level convergence over northern and central China (Figure 6d). Meanwhile, a large-scale anticyclonic circulation controls southern China, resulting in upper-level divergence here. At 850 hPa, there is an anticyclonic circulation covering eastern China, distributing obvious low-level divergence over northern and central China and convergence over southern China (Figure 6f). Clearly, the configuration of upper and lower circulations leads to the significant updraft and downdraft located in southern China and central and northern China, respectively (Figure 6e), corresponding well with the distribution of the regional SPR trends (Figure 4b). Additionally, the induced abnormal cyclone in northeastern China will deepen the East Asian trough and guide more cold air to move southward along the anticyclone, merging with the warm and wet southwest airflows from the South China Sea and the Bay of Bengal (Figure 6d–f), which can be conducive to the development of the updraft over southern China. In summary, the adjustment of circulations mentioned above is beneficial to the increasing SPR in southern China and the decreasing SPR in central and northern China during this stage.
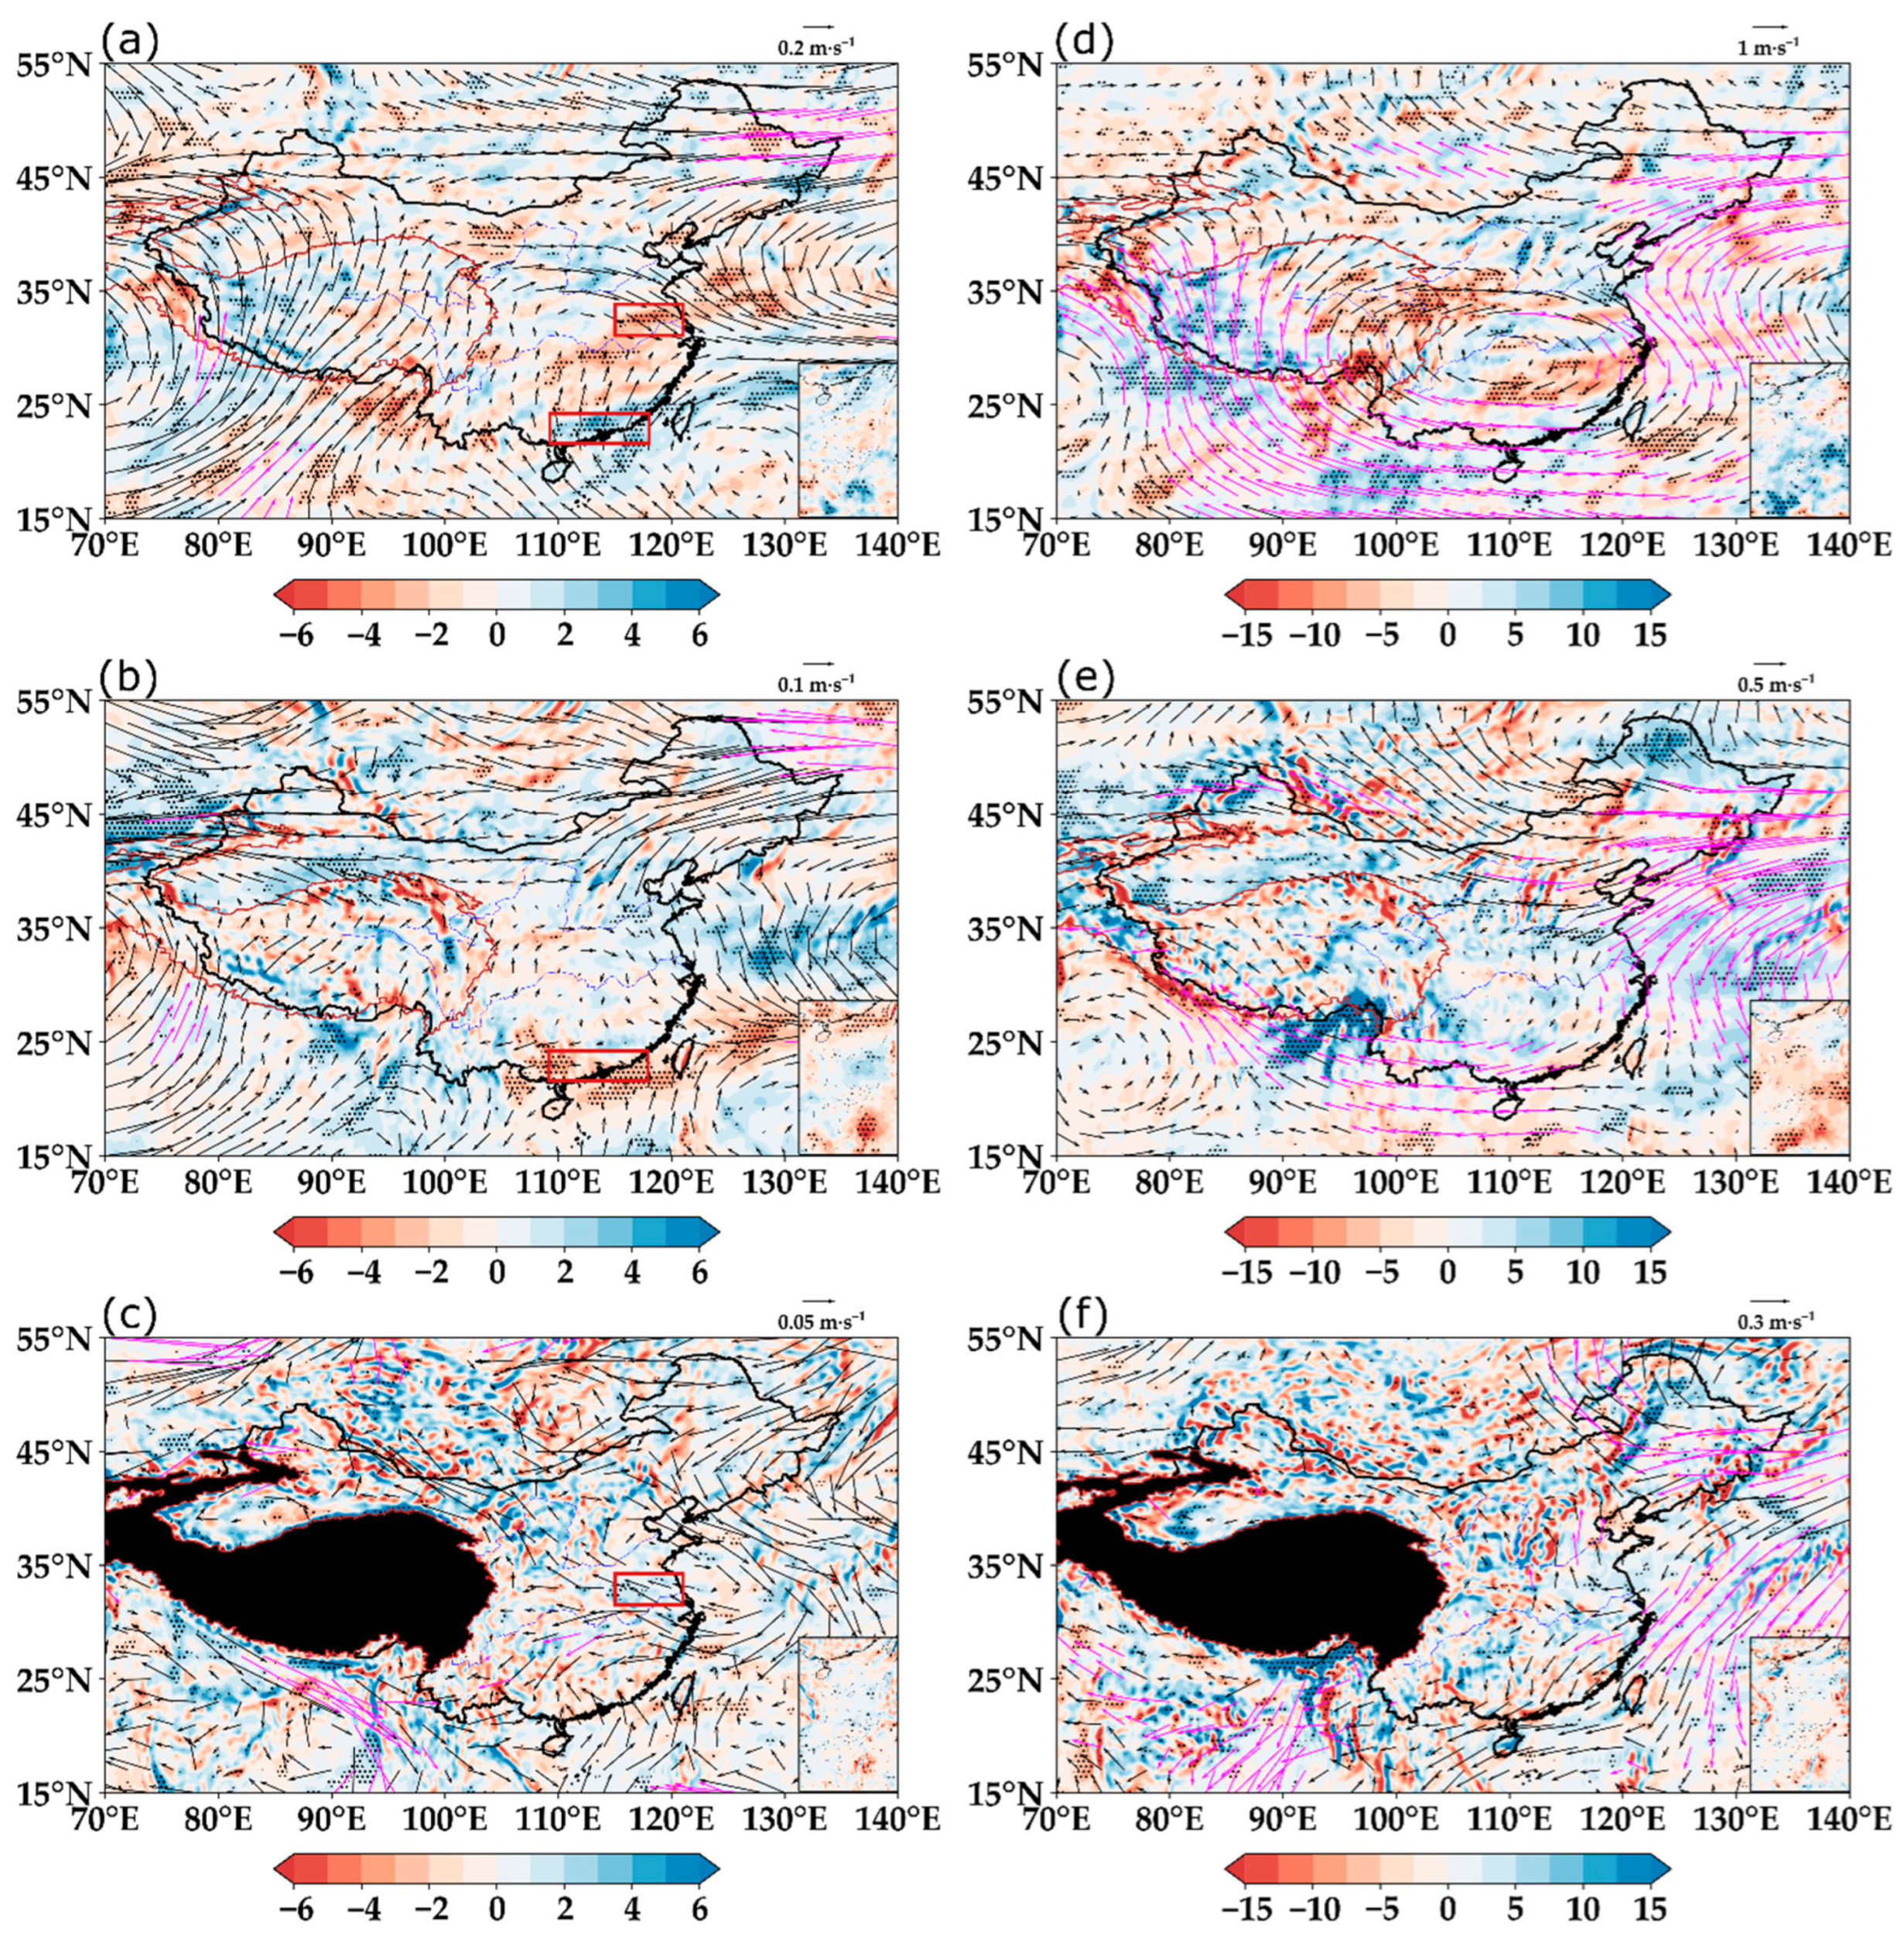
Considering the decreasing SSH in Stage II, the regression coefficients of the large-scale circulation show a roughly coherent pattern with the long-term trend in Figure 7. This indicates that the circulations affecting the SPR at this stage, shown in Figure 7a–c, are largely regulated by the weakening SSH over the TP. Similarly, we only need to focus on the regression fields in Figure 7d–f.
Obviously, an abnormal cyclone with a large range covers the TP, with its center in western TP in the upper troposphere (Figure 7d), and a local cyclonic circulation extending from the southeastern TP to southern China can be forced in the middle and lower layer (Figure 7e,f), which leads to a circulation structure with an anomalous southerly wind at 200 hPa and a northerly wind at the lower troposphere over southwestern China. According to the transient-state geostrophic vorticity equation and the continuity equation, the vertical velocity can be simplified as:
w β v f z
where w , v , and β denote the transient vertical velocity, transient meridional wind, and the meridional gradient of the Coriolis parameter, respectively [44,45]. Thus, a descending motion will be generated (Figure 6e), fitting in with the upper-level convergence and lower-level divergence over southwestern China. It is conductive for the decreasing trend in SPR here, with the upward TP SSH, so the actual downward SSH in this stage can promote the increasing SPR over southwestern China.
At the upper level, the airflows of the cyclonic circulation over the western TP and the subtropical westerlies disperse over southern China, agreeing well with a strong divergence here (Figure 7d). Combining the distinct cyclonic circulation occurring at the lower troposphere with the northwest Pacific anticyclone extending southwest, the strengthening southwesterly airflow from the Bay of Bengal merges with the southwesterly airflow from the South China Sea, which leads to a convergence over southern China at 850 hPa (Figure 7f). The configuration of the upper-lower circulation combined results in a significant updraft in southern China (Figure 7e), corresponding to the increasing trend in SPR with the enhanced TP SSH. However, note that the trend in the TP SSH is essentially weakening at this stage, so the conditions mentioned above are actually not beneficial to the occurrence of SPR over southern China.
In summary, the weakening of the TP SSH affects the SPR in China through the negative effect on the anomalous cyclone over the western TP, the forced cyclone extending from the southeastern TP to southern China, and the southwest extension of the anticyclone in the northwestern Pacific (Figure 7d–f), and the atmospheric response for the circulation adjustment above leads to more SPR over southwestern China and less SPR in South China.
In addition to the regulatory effect of the TP SSH on circulations, previous studies have pointed out that the SST in the North Atlantic [44], the equatorial central eastern Pacific, and the tropical Indian Ocean [46] can together influence the formation and development of the abnormal cyclone over the western TP and the anticyclone in the northwest Pacific, further regulating the trends in SPR in China. However, which of the TP SSH and the SST anomaly is the dominant factor and their relative contributions still need further exploration.
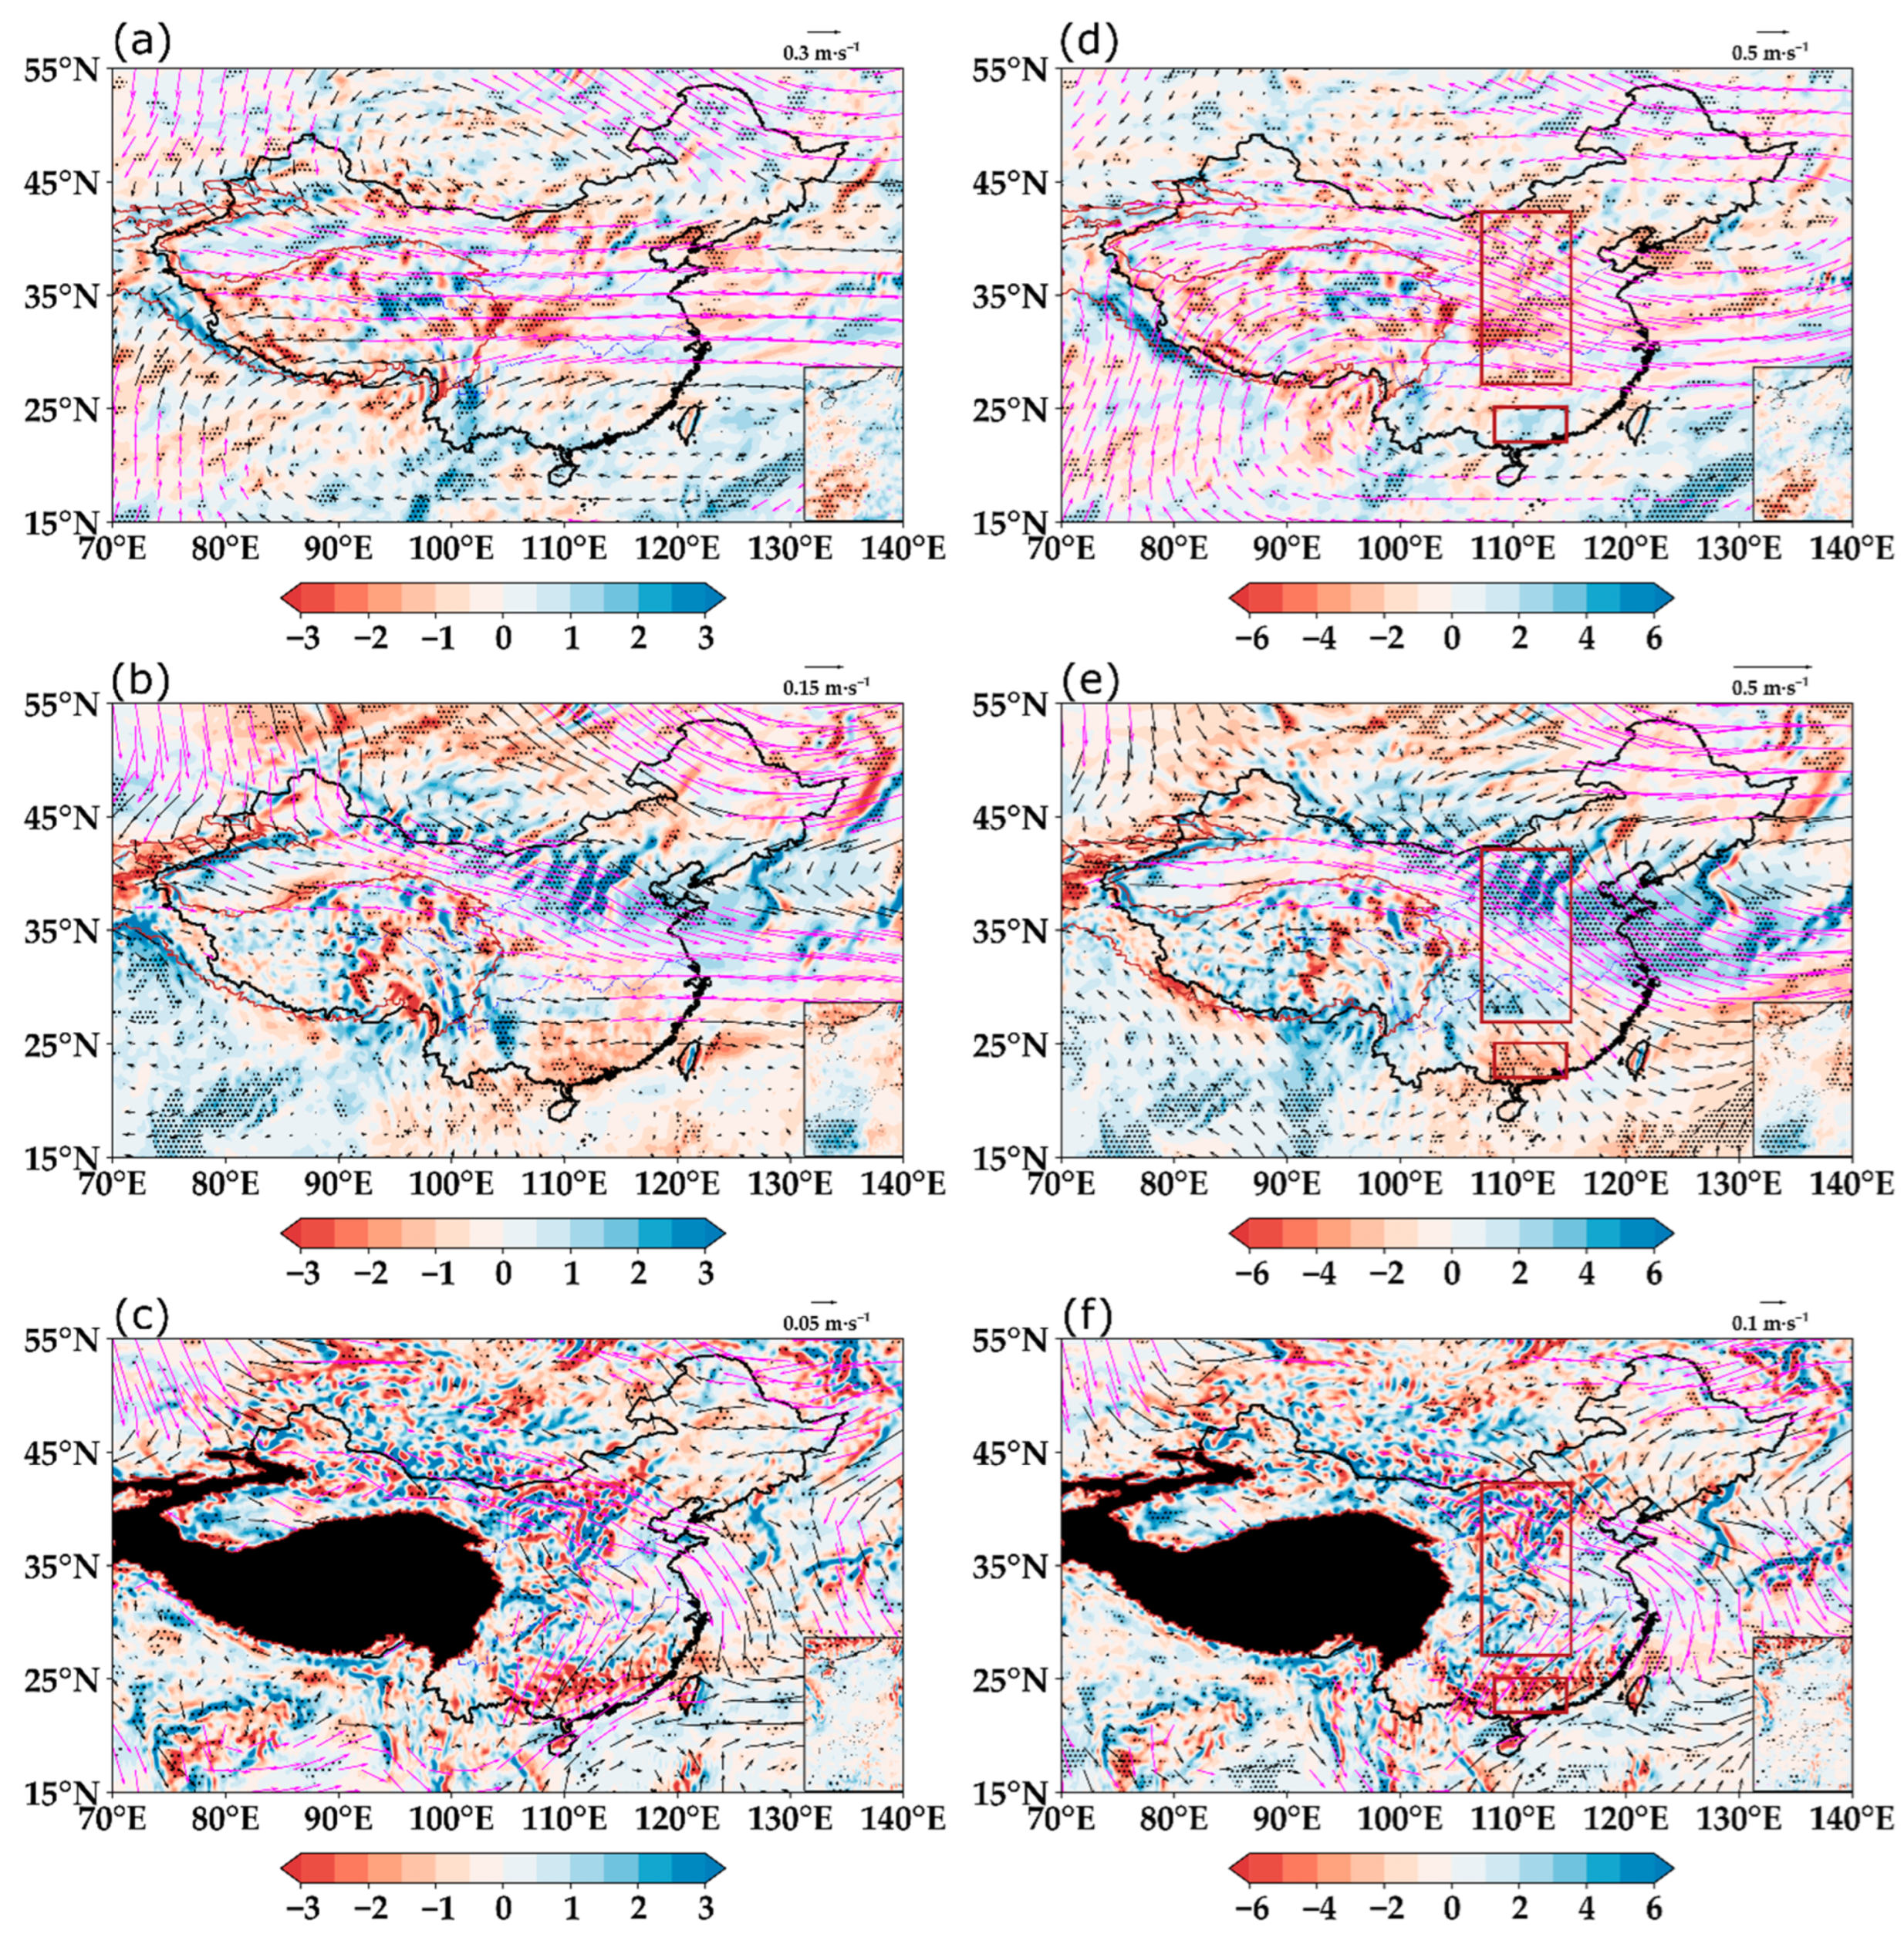
In Stage III, the linear trends (Figure 8a–c) and the regression coefficients (Figure 8d–f) of the circulations are neither coherent nor quite opposite, suggesting that the increasing SSH over the TP is not the key factor affecting the SPR trend in China during the period of 2003–2014, which is consistent with the conclusions in Section 4 and Section 5.
Figure 8a–c displays the long-term trends of the large-scale circulations at 200, 500, and 850 hPa, and there are fewer areas passing the significance test, which may be due to the short duration from 2003 to 2014, but the circulation configurations in the Jianghuai region and southern China are relatively robust. Obviously, a southerly airflow on the side of the anomalous anticyclone in the western Pacific can move northward to 35° N, with a significant divergence in southern China and a convergence in the Jianghuai region in the upper layer (Figure 8a). At 850 hPa, the airflow from the western Pacific diverges in the Jianghuai region and merges with the wet southerly airflow in southern China (Figure 8c). This circulation configuration can force the ascending and descending motions in southern China and the Jianghuai region, respectively. Particularly, the updraft in southern China (Figure 8b) corresponds well to the SPR trend here (Figure 4d), as shown in Section 4.
Overall, the key circulation systems associated with the impacts of the TP SSH on the SPR are different at the first two stages. The increasing TP SSH in StageⅠmainly affects the SPR pattern over China through the strengthening of the westerly jet in the upper layer and the deepening of the East Asian trough, while the decreasing TP SSH in StageⅡpromotes the enhancement of the upper-level anomalous anticyclone over the western TP to affect the SPR pattern. The details are shown in Table 2.

6. Discussion

According to the analyses, the TP SSH during the three stages can remarkably regulate the different spatial patterns of SPR over China. If the trend background of TP SSH is neglected when studying its impacts on the SPR from the entire time period, the research results will reflect significant uncertainties. In addition, although the areas with negative sensitivities between TP SSH and SPR (over central and northern China in Stage I; southwestern China in stage II) are different from stage to stage, and the positive sensitivities over southern China are relatively stable; therefore, according to the trend change of SSH over the TP, the trend of SPR in southern China can be predicted, which is helpful to cope with climate change problems. Overall, the results provided in this study not only examine the importance and necessity of the SSH trend background, but also contribute to a deeper understanding of the climate pattern over China.
However, the trend in TP SSH actually show obvious spatial differences. Yu et al. [20] proposed that the decline of the SH is the most significant over the southern TP from the 1980s to the 2000s, and Wang et al. [36] have also indicated that the change in SSH from weakening to strengthening is the strongest in southern TP. It is still unknown whether the trend in the southern TP plays a key role in the SPR trend in China, and this requires further exploration. Moreover, the TP SSH can influence the SPR over China in multi-time scales. Previous studies have shown that the quasi-biweekly oscillation of the atmospheric heat source over the TP in spring is indicative of the sub-seasonal contemporary precipitation in the downstream of the Jiangnan region [45,47]. Whether the interdecadal variations of the TP SSH will further cause the interdecadal variations of the quasi-biweekly oscillation of atmospheric heat source over the TP in spring is also worthy of further investigation.

7. Conclusions

The spring sensible heating (SSH) over the TP has a notable impact on the spring precipitation (SPR) in China. Since the 1960s, the trend in TP SSH has displayed different stages during the period of 1961–2014. In this study, we use station observations and reanalysis data (ERA5 and CN05.1) to examine the impacts of the trend in TP SSH on the SPR in China during different stages, including the spatial pattern of the affected SPR and the possible mechanisms. The main conclusions are as follows:
  • The trend in SSH over the TP has experienced three stages since 1960, with strengthening from 1961 to 1979 (Stage I), weakening during the period of 1980–2002 (Stage II), and strengthening from 2003 to 2014 (Stage III). Moreover, the wind speed at 10 m (V10) is the dominant factor leading to the upward trend of SSH in Stage I and the downward trend of SSH in Stage II, while the increasing temperature difference between ground and air (Tg-Ta) is mainly responsible for the decreasing trend of SSH in Stage III.
  • During the entire period of 1961–2014, the spatial distribution of the SPR trend shows an east-west tripole pattern, with a significant increasing trend over the TP region and northeastern China and an obvious decreasing trend over central China, which is closely related to the trend in TP SSH.
  • During the different stages of the trend in TP SSH, the spatial pattern of the trend in SPR over China is also different. The SPR associated with TP SSH represents a contrasting north-south pattern in Stage I, with an increasing trend in southern China and a decreasing trend in central and northern China, while the trend in SPR shows a contrasting east-west pattern in Stage II, showing a strengthening trend in the southeastern TP and southwestern China and a weakening trend over southern China with the decreasing TP SSH. Obviously, the SPR over southern China always exhibits a positive sensitivity with the TP SSH during these two stages. In Stage III, it seems that the effect of TP SSH on the SPR trend over China is greatly weakened. Mechanistically, in Stage I, the increasing TP SSH strengthens the subtropical westerly jet at the upper layer with an anomalous cyclonic circulation in northeastern China, which enhances the upper-level convergence to develop the downdraft over central and northern China. The deepened East Asian trough guides more cold air to move southward, encountering the warm and wet southwest airflow in southern China to boost the updraft. In Stage II, an anomalous cyclone circulation in the middle and upper layer appears over the western TP, with the forced cyclone in the lower layer extending from southeastern TP to southern China, and the anticyclone in the northwest Pacific extends southwest. The decreasing TP SSH mainly promotes the descending motion in southern China and the upward motion over southwestern China by the negative effect on the circulation in this stage.

Author Contributions

Conceptualization, M.W.; methodology, M.W. and B.C.; formal analysis, Z.Z.; writing—original draft preparation, Z.Z.; writing—review and editing, M.W., S.Z. (Shu Zhou) and S.Z. (Shunwu Zhou). All authors have read and agreed to the published version of the manuscript.

Funding

This research was funded by Key Program of National Natural Science Foundation of China (Grant 42030602), the National Natural Science Foundation of China (42030611), the Second Tibetan Plateau Scientific Expedition and Research (STEP) Program (2019QZKK0105), the Natural Science Foundation of Jiangsu Province, China (grant no. BK20221449), Meteorological Soft Science of China Meteorological Administration (2022ZDIANXM28), and the open project of Key Laboratory of Meteorological Disaster (KLME), Ministry of Education & Collaborative Innovation Center on Forecast and Evaluation of Meteorological Disasters (CIC-FEMD), Nanjing University of Information Science & Technology (grant no. KLME202203).

Institutional Review Board Statement

Not applicable.

Informed Consent Statement

Not applicable.

Data Availability Statement

Data sources are mentioned in the text, reference number [26,28,29].

Conflicts of Interest

The authors declare no conflict of interest.

References

  1. Wu, G.X. Sensible heat driven air-pump over the Tibetan Plateau and its impacts on the Asian Summer Monsoon. In Collections on the Memory of Zhao Jiuzhang; Ye, D.Z., Ed.; Science Press: Beijing, China, 1997. [Google Scholar]
  2. Li, D.L.; Wei, L.; Li, W.J.; Lv, L.Z.; Zhong, H.L.; Ji, G.L. The effect of surface sensible heat flux of the Qinghai-Xizang Plateau on general circulation over the northern hemisphere and climatic anomaly of China. Clim. Environ. Res. 2003, 8, 60–70. [Google Scholar] [CrossRef]
  3. Lai, X.; Fan, G.Z.; Hua, W.; Ding, X. Progress in the study of influence of the Qinghai-Xizang Plateau land atmosphere interaction on east Asia regional climate. Plateau Meteor. 2021, 40, 1263–1277. [Google Scholar] [CrossRef]
  4. Wu, G.X.; Liu, Y.M.; He, B.; Bao, Q.; Wang, Z.Q. Review of the impact of the Tibetan Plateau sensible heat driven air-pump on the Asian summer monsoon. Chin. J. Atmos. Sci. 2018, 42, 488–504. [Google Scholar] [CrossRef]
  5. Liu, Y.M.; Li, W.P.; Liu, X.; Wang, X.C.; Fu, R.; Liu, P. Physics of the control of the Tibetan Plateau on regional energetic processes and global climate. Trans. Atmos. Sci. 2020, 43, 181–192. [Google Scholar]
  6. Wu, G.X.; Zhuo, H.F.; Wang, Z.Q.; Liu, Y.M. Two types of summertime heating over the Asian large-scale orography and excitation of potential-vorticity forcing I. Over Tibetan Plateau. Sci. China Earth Sci. 2016, 46, 1209–1222. [Google Scholar] [CrossRef]
  7. Duan, A.M.; Wang, M.R.; Lei, Y.H.; Cui, Y.F. Trends in summer rainfall over China associated with the Tibetan Plateau sensible heat source during 1980–2008. J. Clim. 2013, 26, 261–275. [Google Scholar] [CrossRef] [Green Version]
  8. Ye, D.Z.; Wu, G.X. The role of the heat source of the Tibetan Plateau in the general circulation. Meteorl. Atmos. Phys. 1998, 67, 181–198. [Google Scholar] [CrossRef]
  9. Wu, G.X.; Zhang, Y.S. Tibetan Plateau forcing and timing of the monsoon onset over South Asia and South China Sea. Mon. Wea. Rev. 1998, 126, 913–927. [Google Scholar] [CrossRef]
  10. Bai, J.Y.; Xu, X.D.; Zhou, Y.S.; Zhang, X.J. Preliminary research on inhomogeneous distribution of Tibetan Plateau sensible heat fluxes in spring. J. Appl. Meteor. Sci. 2003, 14, 363–368. [Google Scholar]
  11. Duan, A.; Liu, Y.; Wu, G. Heating status of the Tibetan Plateau from April to June and rainfall and atmospheric circulation anomaly over East Asia in midsummer. Sci. China Ser. D-Earth Sci. 2005, 48, 250–257. [Google Scholar] [CrossRef]
  12. Wang, H.; Li, D.L. Impacts of decadal variability in sensible heat over the Tibetan Plateau on decadal transition of summer precipitation over dominant regions of monsoon rainfall band in eastern China since the early 2000s. Chin. J. Geophys. 2020, 63, 412–426. (In Chinese) [Google Scholar] [CrossRef]
  13. Zhao, P.; Chen, L.X. Climatic characteristics of atmospheric heat sources over the Tibetan Plateau and the relationship between it and precipitation in China over the past 35 years. Sci. China Ser. D 2001, 31, 327–332. (In Chinese) [Google Scholar]
  14. Shan, X.; Zhou, S.W.; Wang, M.R.; Zheng, D.; Wang, C.H. Effects of spring sensible heat in the Tibetan Plateau on midsummer precipitation in south China under ENSO. J. Trop. Meteor. 2020, 36, 60–71. [Google Scholar] [CrossRef]
  15. Li, X.; Li, D.L.; Wang, Y. Quasi 3-year period response of the rainy season precipitation over the eastern parts of Northwest China to the spring sensible heat flux over the eastern part of the Tibetan Plateau. Acta. Meteor. Sin. 2015, 73, 737–748. [Google Scholar] [CrossRef]
  16. Ren, Q.; Zhou, C.Y.; Xia, Y.; Cen, S.X.; Yuan, L. Annual relationship between spring surface sensible heat flux over the East Qinghai-Tibet Plateau and air temperature in East China. J. Glaciol. Geocryol. 2019, 41, 783–792. [Google Scholar] [CrossRef]
  17. Li, X.Z.; Tang, X.Z.; Li, S.H.; Jian, M.Q.; Weng, Z.P. Impact of the spring sensible heat flux over the Tibetan Plateau on summer rainfall over East China and its role in rainfall prediction. Acta. Meteor. Sin. 2018, 76, 930–943. [Google Scholar] [CrossRef]
  18. Zhu, Q.G.; Guan, Z.Y. Numerical study of influence of Tibetan sensible heating abnormality on summer Asian monsoon low-frequency oscillation. Trans. Atmos. Sci. 1997, 20, 186–192. [Google Scholar]
  19. Zhang, L.; Wang, H.; Shi, X.D.; Li, D.L. Characteristics and causes of surface sensible heat trend transition in central and eastern Qinghai-Xizang Plateau. Plateau Meteor. 2020, 39, 912–924. [Google Scholar] [CrossRef]
  20. Yu, W.; Liu, L.M.; Yang, X.Q.; Wu, G.X. The Interannual and decadal variation characteristics of the surface sensible heating at different elevations over the Qinghai-Tibetan Plateau and attribution analysis. Plateau Meteor. 2018, 37, 1161–1176. [Google Scholar]
  21. Duan, A.M.; Wu, G.X. Weakening trend in the atmospheric heat source over the Tibetan Plateau during recent decades. Part I: Observations. J. Clim. 2008, 21, 3149–3164. [Google Scholar] [CrossRef] [Green Version]
  22. Yang, K.; Guo, X.F.; Wu, B.Y. Recent trends in surface sensible heat flux on the Tibetan Plateau. Sci. China Earth Sci. 2011, 54, 19–28. [Google Scholar] [CrossRef]
  23. Wu, G.X.; He, B.; Liu, Y.M.; Bao, Q.; Ren, R.C. Location and variation of the summertime upper-troposphere temperature maximum over South Asia. Clim. Dyn. 2015, 45, 2757–2774. [Google Scholar] [CrossRef] [Green Version]
  24. Duan, A.M.; Li, F.; Wang, M.R.; Wu, G.X. Persistent weakening trend in the spring sensible heat source over the Tibetan Plateau and its impact on the Asian summer monsoon. J. Clim. 2011, 24, 5671–5682. [Google Scholar] [CrossRef] [Green Version]
  25. Xu, X.D.; Zhao, T.L.; Shi, X.H.; Lu, C.G. A study of the role of the Tibetan Plateau’s thermal forcing in modulating rainband and moisture transport in eastern China. Acta. Meteor. Sin. 2015, 73, 20–35. [Google Scholar] [CrossRef]
  26. Duan, A.M.; Liu, S.F.; Hu, W.T.; Hu, d.; Peng, Y.Z. Long-term daily dataset of surface sensible heat flux and latent heat release over the Tibetan Plateau based on routine meteorological observations. Big Earth Data 2022, 6, 480–491. [Google Scholar] [CrossRef]
  27. Wu, J.; Gao, X.J. A gridded daily observation dataset over China region and comparison with the other datasets. Chin. J. Geophys. 2013, 56, 1102–1111. (In Chinese) [Google Scholar] [CrossRef]
  28. Hersbach, H.; Bell, B.; Berrisford, P.; Biavati, G.; Horányi, A.; Muñoz Sabater, J.; Nicolas, J.; Peubey, C.; Radu, R.; Rozum, I.; et al. ERA5 Monthly Averaged Data on Pressure Levels from 1940 to Present. Copernicus Climate Change Service (C3S) Climate Data Store (CDS). 2023. Available online: https://cds.climate.copernicus.eu/cdsapp#!/dataset/reanalysis-era5-pressure-levels-monthly-means?tab=overview (accessed on 3 January 2023).
  29. Hersbach, H.; Bell, B.; Berrisford, P.; Biavati, G.; Horányi, A.; Muñoz Sabater, J.; Nicolas, J.; Peubey, C.; Radu, R.; Rozum, I.; et al. ERA5 Monthly Averaged Data on Single Levels from 1940 to Present. Copernicus Climate Change Service (C3S) Climate Data Store (CDS). 2023. Available online: https://cds.climate.copernicus.eu/cdsapp#!/dataset/reanalysis-era5-single-levels-monthly-means?tab=overview (accessed on 3 January 2023).
  30. Yang, K.; Qin, J.; Guo, X.; Zhou, D.; Ma, Y. Method Development for Estimating Sensible Heat Flux over the Tibetan Plateau from CMA Data. J. Appl. Meteor. Clim. 2009, 48, 2474–2486. [Google Scholar] [CrossRef]
  31. Wang, M.R.; Zhou, S.W.; Sun, Y.; Wang, J.; Ma, S.J.; Yu, Z.S. Assessment of the spring sensible heat flux over the central and eastern Tibetan Plateau simulated by CMIP6 multi-models. Chin. J. Atmos. Sci. 2022, 46, 1225–1238. (In Chinese) [Google Scholar] [CrossRef]
  32. Wang, M.R.; Wang, J.; Chen, D.L.; Duan, A.M.; Liu, Y.M.; Zhou, S.W.; Guo, D.; Wang, H.M.; Ju, W.M. Recent recovery of the boreal spring sensible heating over the Tibetan Plateau will continue in CMIP6 future projections. Environ. Res. Lett. 2019, 14, 124066. [Google Scholar] [CrossRef] [Green Version]
  33. Toms, J.D.; Lesperance, M.L. Piecewise regression: A tool for identifying ecological thresholds. Ecology 2003, 84, 2034–2041. [Google Scholar] [CrossRef]
  34. Ryan, S.E.; Porth, L.S. A tutorial on the piecewise regression approach applied to bedload transport data. Gen. Tech. Rep. 2007, 189, 41. [Google Scholar] [CrossRef]
  35. Jekel, C.; Venter, G. pwlf: A Python Library for Fitting 1D Continuous Piecewise Linear Functions, Version: 0.4.1. 2019. Available online: https://www.researchgate.net/profile/Charles-Jekel-2/publication/331231072_pwlf_A_Python_Library_for_Fitting_1D_Continuous_Piecewise_Linear_Functions/links/5c6d607aa6fdcc404ec03c53/pwlf-A-Python-Library-for-Fitting-1D-Continuous-Piecewise-Linear-Functions.pdf (accessed on 26 April 2023).
  36. Wang, H.; Zhang, L.; Shi, X.D.; Li, D.L. Seasonal differences in the trend turning characteristics of surface sensible heat over the central and eastern Tibetan Plateau. Chin. J. Atmos. Sci. 2022, 46, 133–150. (In Chinese) [Google Scholar] [CrossRef]
  37. Yang, K.; Wu, H.; Qin, J.; Lin, C.G.; Tang, W.J.; Chen, Y.Y. Recent climate changes over the Tibetan Plateau and their impacts on energy and water cycle: A review. Global Planet. Chang. 2014, 112, 79–91. [Google Scholar] [CrossRef]
  38. Liu, Y.M.; Wu, G.X.; Hong, J.L.; Dong, B.W.; Duan, A.M.; Bao, Q.; Zhou, L.J. Revisiting Asian monsoon formation and change associated with Tibetan Plateau forcing: II. Change. Clim. Dyn. 2012, 39, 1183–1195. [Google Scholar] [CrossRef]
  39. Chung, P.; Li, T. Interdecadal relationship between the mean state and El Niño types. J. Clim. 2013, 26, 361–379. [Google Scholar] [CrossRef]
  40. Zhu, Y.L.; Wang, H.J.; Ma, J.H.; Wang, T.; Sun, J.Q. Contribution of the phase transition of Pacific Decadal Oscillation to the late 1990s’ shift in East China summer rainfall. J. Geophys. Res. Atmos. 2015, 120, 8817–8827. [Google Scholar] [CrossRef] [Green Version]
  41. Liu, S.F.; Duan, A.M. A statistical forecast model for summer precipitation in eastern China based on spring sensible heat anomaly in the Tibetan Plateau. Acta Meteor. Sin. 2017, 75, 903–916. [Google Scholar] [CrossRef]
  42. Zhao, P.; Zhou, Z.J.; Liu, J.P. Variability of Tibetan spring snow and its associations with the hemispheric extratropical circulation and east Asian summer monsoon rainfall: An Observational Investigation. J. Clim. 2007, 20, 3942–3955. [Google Scholar] [CrossRef]
  43. Zhang, T.S.; You, W.H. The distribution feature of spring rainfall ant its relation to circulation anomaly in China. J. Yunnan Univ. 2010, 32, 553–560. [Google Scholar]
  44. Yu, W.; Liu, Y.M.; Yang, X.Q.; Wu, G.X.; He, B.; Li, J.X.; Bao, Q. Impact of North Atlantic SST and Tibetan Plateau forcing on seasonal transition of springtime South Asian monsoon circulation. Clim. Dyn. 2021, 56, 559–579. [Google Scholar] [CrossRef]
  45. Wu, G.X.; Duan, A.M.; Liu, Y.M.; Mao, J.Y.; Ren, R.C.; Bao, Q.; He, B.; Liu, B.Q.; Hu, W.T. Tibetan Plateau climate dynamics: Recent research progress and outlook. Natl. Sci. Rev. 2015, 2, 100–116. [Google Scholar] [CrossRef] [Green Version]
  46. Yin, X.; Wu, X.F. Influence of Indian Ocean Basin on South China spring rainfall during the decaying phase of ENSO in preceding winter. Plateau Mt. Meteorol. Res. 2022, 42, 49–59. [Google Scholar] [CrossRef]
  47. Liu, B.Q.; Duan, Y.N. Intraseasonal oscillation of atmospheric heat source over the Qinghai- Xizang Plateau in boreal spring and its maintaining mechanism. Plateau Meteor. 2021, 40, 1419–1431. [Google Scholar] [CrossRef]
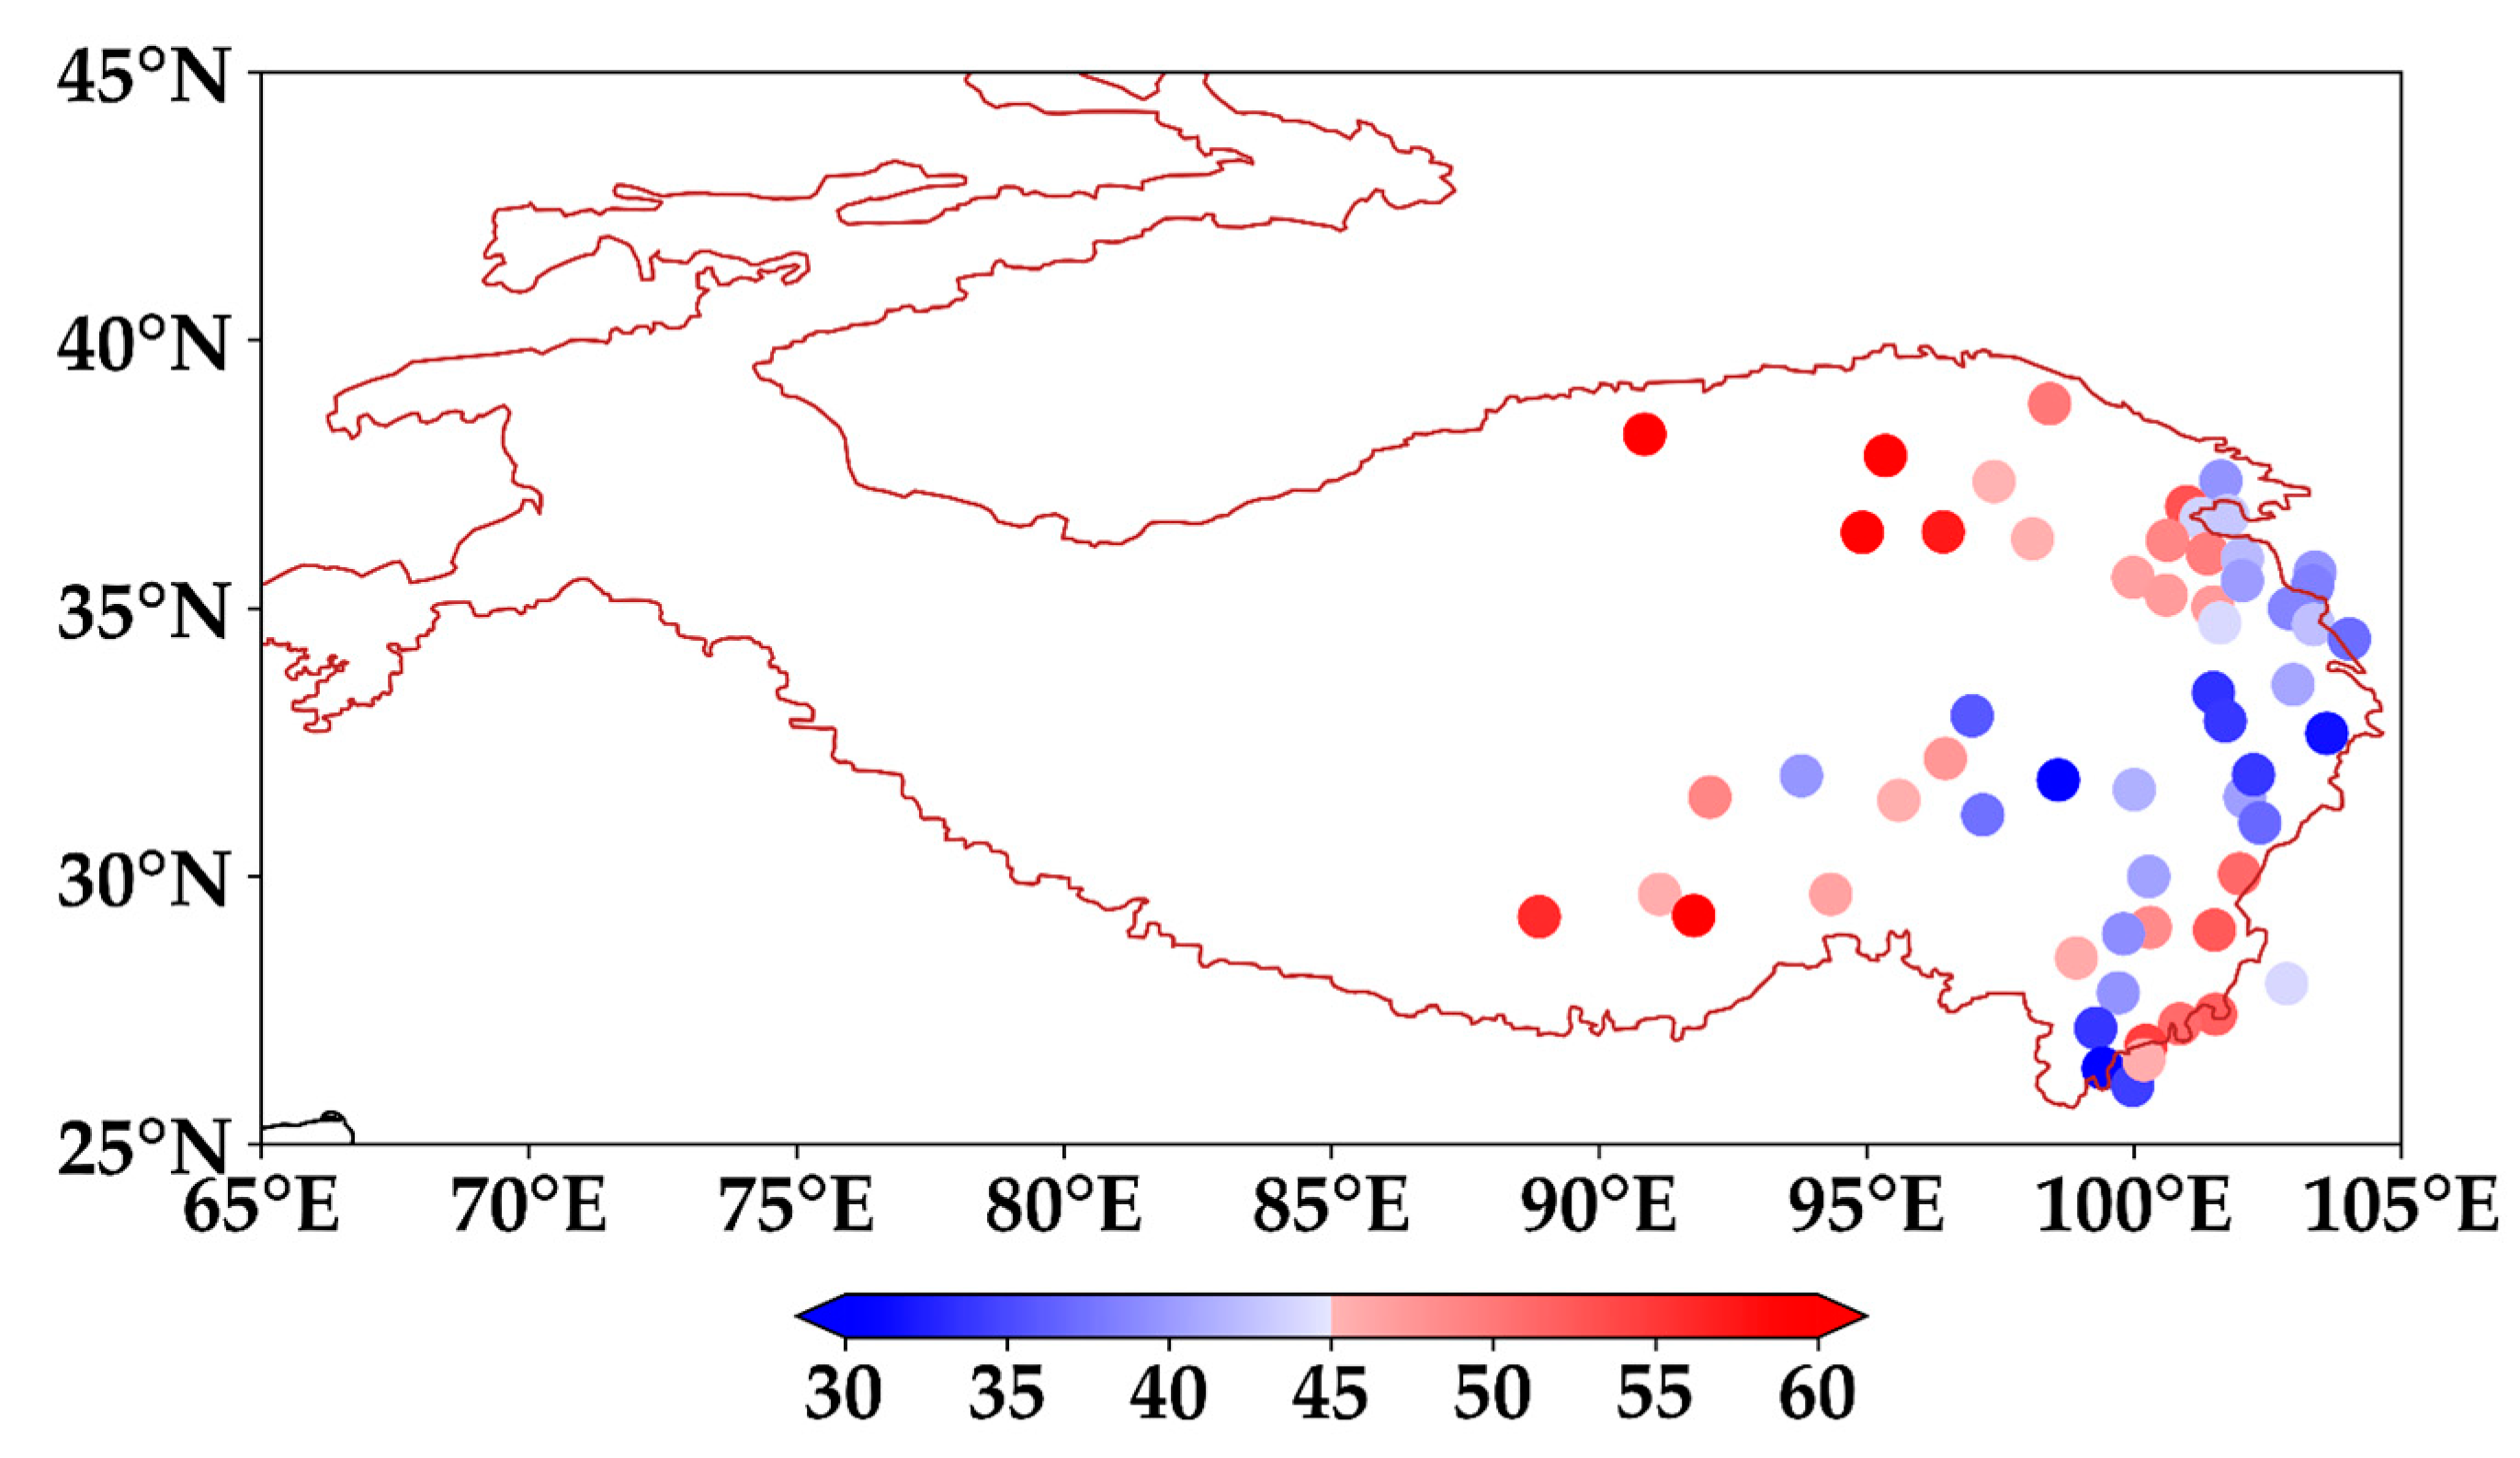
Figure 1. The spatial distribution of climatological SH (W m−2) at 58 stations over the TP from 1961 to 2019; the red outline is the contour, with an altitude of 2000 m.
Atmosphere 14 00812 g001
Figure 2. Annual cycle of the climatological SH (W m−2) over the central and eastern TP from 1961 to 2019.
Atmosphere 14 00812 g002
Figure 3. Time series of the SSH (W m−2), ground-air temperature difference (Tg-Ta, °C), and wind speed at the height of 10 m (V10, m s−1) over the central and eastern TP from 1961 to 2019. Dashed lines indicate the trends in SH during three different stages, respectively.
Atmosphere 14 00812 g003
Figure 4. (ad) Linear trend and (eh) regression coefficients on SSH (W m−2) over the TP of SPR amount (10−2 mm) (a,e) during the entire period of 1961 to 2014; (b,f; c,g; d,h) are similar to (a,e), but for Stage I (1961–1979), Stage Ⅱ (1980–2002), and Stage Ⅲ (2003–2014), respectively. Dark dots indicate trends, and regression coefficients are significant at the 90% confidence level.
Atmosphere 14 00812 g004
Figure 5. (ac) Linear trend and (df) regression coefficients on SSH (W m−2) over the TP of integrated water vapor flux (arrow, 101 kg·m−1·s−1) and vapor flux divergence (shaded, 10−6 kg·m−2·s−1) of the whole layer (a,d) in Stage I (1961–1979), (b,e) Stage II (1980–2002), and (c,f) Stage III (2003–2014). Trends and regression coefficients with statistical significance above the 90% level are plotted as red arrows and dark dots.
Atmosphere 14 00812 g005
Figure 6. (ac) The linear trend and (df) the regression coefficients on SSH (W m−2) over the TP of the wind vectors (arrow, m·s−1) and the divergence (shaded, 10−7 s−1) in spring (a,d) at 200 hPa in Stage I (1961–1979); (b,e) as in (a,d), but for the wind vectors and vertical motion (shaded, 10−3 Pa·s−1) at 500 hPa; (c,f) as in (a,d), but for 850 hPa. Trends and regression coefficients with statistical significance above the 90% level are plotted as purple arrows and dark dots.
Atmosphere 14 00812 g006
Figure 7. As in Figure 6, but for the Stage II (1980–2002).
Atmosphere 14 00812 g007
Figure 8. As in Figure 6, but for the Stage III (2003–2014).
Atmosphere 14 00812 g008
Table 1. Three stages of TP SSH trends, including the specific time periods, durations, and the trend rates. The ** and * represent significance levels above 95% and 90%, respectively.
StageTime PeriodDuration
(yr)
Trend Rates
(W m−2 yr−1)
11961–1979190.43 **
21980–200223−0.12 **
32003–2014120.23 *
Table 2. The effects of the TP SSH on the SPR over China and the key systems of the related circulation mechanisms in three stages, respectively.
StageIIIIII
Trend of SSHIncreasingDecreasingIncreasing
Impacts of the TP SSH on the SPRIncreasing SPR over southern China;
decreasing SPR over central and northern China.
Increasing SPR over southwestern China;
decreasing SPR over southern China.
greatly weakens
Key circulation systemsSubtropical westerly jet in the upper layer of the
East Asian trough.
Anomalous anticyclone over the western TP in the upper layer.
Disclaimer/Publisher’s Note: The statements, opinions and data contained in all publications are solely those of the individual author(s) and contributor(s) and not of MDPI and/or the editor(s). MDPI and/or the editor(s) disclaim responsibility for any injury to people or property resulting from any ideas, methods, instructions or products referred to in the content.