Article

Airborne Air Pollutant Emission Characteristics of Mobile Vehicles in Taiwan

1
Department of Environmental Engineering, National Cheng Kung University, Tainan 701, Taiwan
2
Research Center for Climate Change and Environment Quality, National Cheng Kung University, Tainan 701, Taiwan
3
Department of Safety Health and Environmental Engineering, National Yunlin University of Science and Technology, Yunlin 640301, Taiwan
*
Author to whom correspondence should be addressed.
Atmosphere 2023, 14(6), 916; https://doi.org/10.3390/atmos14060916
Submission received: 11 April 2023 / Revised: 9 May 2023 / Accepted: 19 May 2023 / Published: 24 May 2023

Abstract

:
This study examines the air pollutant emission characteristics, activity intensity, and trends of mobile sources from 2013 to 2021. The target pollutants include criteria pollutants (fine particulate matters, nitrogen oxides, and hydrocarbons) and hazardous air pollutants (benzene, formaldehyde, and BaP). The results indicated that the activity intensity levels of road mobile sources in Taiwan were148 × 109, 156 × 109, 159 × 109, and 155 × 109 km/year in 2013, 2016, 2019, and 2021, respectively, with the largest proportion attributed to gasoline passenger cars (42.6%), followed by four-stroke motorcycles (32.6%). An emission factor of PM2.5 was estimated by EPA’s MOVES (Motor Vehicle Emission Simulator) model, and the results showed that the emission sequence was diesel > gasoline > motorcycle; the NOx emission factor was estimated using the MOBILE6.2 model, and the results showed that the order was diesel > gasoline > motorcycle; the HC emission factor was compiled with the use of gasoline vehicle dynamometer data, and the results showed that motorcycle > gasoline vehicles. Further results showed that the emission sequence for benzene was motorcycle > gasoline ≥ diesel; the formaldehyde emission sequence was diesel > motorcycle ≥ gasoline. The BaP emission factors of different vehicle types were estimated using MOVES, and the emission factors of old heavy-duty diesel vehicles were the highest.

1. Introduction

Airborne pollutants can be an important environmental problem and can impact human health in urban areas. In Europe, road transport represents the highest source of air pollution [1], and motorized transportation and fuel combustion are of concern due to their contribution to the ill health of the population and the consequent social costs [2] before the widespread use of electric vehicles.
In urban environments, VOCs such as benzene, n-pentane, and n-hexane are mainly emitted as a result of incomplete fuel combustion and vaporization, especially in motor vehicles [3]. VOCs can be the precursor of secondary organic aerosols (SOA) through atmospheric photochemical reactions in metropolitan areas [4]. In the United States, benzene, other aromatic hydrocarbons, and chlorinated VOCs identified in the urban air, and traffic, industry, solvents, and waste burning were identified as the major sources of VOCs [5].
A total of 51 light-duty gasoline vehicles were selected to determine their exhaust emission that corresponded to the emission standards of Euro 2–5 from 2000 to 2016 [6]. It was demonstrated that the PM emission factors of the Euro 2 and Euro 3 vehicles were 6.5 times higher than those of the Euro 4 and Euro 5 vehicles, and had higher mileage with relatively higher emission [6].
The PM2.5 emission factors of different diesel vehicle fleets were correlated with the increase in vehicle age [7].
Chiang et al. [8] conducted FTP-75dynamometer tests on six light-duty diesel vehicles in the laboratory of the Automotive Research and Testing Center (ARTC) in Taiwan. A diesel vehicle was equipped with a diesel particle filter that could effectively reduce the PM emission from the exhaust [9]. Generally, the NOx emission of diesel vehicles can be higher than that of gasoline vehicles, and the degradation of the emission control and after-treatment systems under high accumulated mileage is the important reason for the increase in NOx emission from diesel vehicles [10]. Huang et al. [11] used the Portable Emissions Measurement System (PEMS) to measure air and particulate pollutants on Shanghai roads, and NOx was found to be the important airborne pollutant in addition to PM.
Clairotte et al. [12] used a dynamometer to measure two two-stroke motorcycles with Euro 1 and Euro 2; the results showed that the HC emission of the Euro 1 motorcycle was approximately 2.7 times higher than that of the Euro 2 motorcycle. Zhang et al. [13] collected vehicle inspection and maintenance test data from Hangzhou, China. Their results indicated that the vehicles gradually deteriorated with increasing mileage and presented HC, CO, and NOx emissions of 0.76–5.1, 0.068–0.12, and 0.13–0.64 g/km respectively, corresponding to the mileage 79–161 × 103 [13]. In addition, it was found that the tightening of emission standards could decrease the emission levels of vehicles [13].
The higher the cumulative mileage of vehicles was, the higher the emission factor of air pollutants for light-duty and heavy-duty diesel vehicles was [14].
In addition to the criteria pollutants, the US EPA announced 21 Mobile Source Air Toxics (MSATs) in 2001 for the evaluation of mobile source emissions. The European Federation for Transport Environment (EFTE) pointed out that, with regard to motor vehicles, emission limits should be set for potentially carcinogenic substances, such as formaldehyde and acetaldehyde [15]. California classified diesel particulate matter (DPM) as a hazardous air pollutant in 1998, which consists of polycyclic aromatic hydrocarbons, benzene, aldehydes, and other compounds. The International Agency for Research on Cancer (IARC) has also classified common motor vehicle emissions as carcinogenic, with benzene as a known carcinogen, and formaldehyde and BaP in polycyclic aromatic hydrocarbons (PAHs) as probable carcinogens [16]. Among them, benzene is the main hazardous air pollutant in the exhaust of gasoline vehicles, formaldehyde is the main hazardous air pollutant in the exhaust of diesel vehicles, and BaP is the main component of diesel exhaust particulate pollutants.
Benzene is mainly emitted by motorcycles and gasoline vehicles [17,18]. In addition, diesel vehicles could be responsible for the emission of aldehydes, especially formaldehyde, acetaldehyde, acrolein, and other carbonyl compounds [19]; the application of biodiesel fuels is also a source of formaldehyde [20]. BaP mainly comes from the particulate matter emitted by motorcycles [21] and diesel vehicles [22]. In California, MOVES2010a, MOBILE6.2, and EMFAC2007 were conducted to evaluate mobile source emissions such as those from cars, trucks, motorcycles, and buses. The results presented 30% uncertainty for the fuel-based estimation of the CO, NOx, and NMHC emission factors [23,24].
In this study, we determined the air pollutant emission of motor vehicles through MOVES, MOBILES 6.2, and dynamometer testing. The airborne pollutants included criteria pollutants: PM, NOx, and HC; the hazardous air pollutants included benzene, formaldehyde, and Benzo(a)pyrene (BaP). In addition, we identified the mobile emission trends for the years of 2013, 2016, 2019, and 2021, and determined the spatial distribution of air pollutants in Taiwan.

2. Experiment

2.1. Selection of Airborne Pollutants

2.1.1. Criteria Air Pollutants

According to the results of the California Air Resources Board (CARB), World Health Organization (WHO), and the International Agency for Research on Cancer (IARC), the criteria pollutants PM2.5, NOx, and HC were selected to be the target pollutants from mobile emission.

2.1.2. Hazardous Air Pollutants

Based on the results of the U.S. Federal EPA, California’s list of toxic air pollutants (TAC), and the European Federation for Transport and Environment (EFTE), diesel particulate matter (DPM) and polycyclic aromatic hydrocarbons emitted by motor vehicles contain potentially carcinogenic substances such as formaldehyde and acetaldehyde; for this reason, the U.S. limits the amount of benzene in gasoline. In addition, according to the relevant regulations in China for hazardous air pollutants, such as benzene content in gasoline and PAHs in diesel fuel, benzene, formaldehyde, and BaP were identified as the hazardous air pollutants in this study.
For benzene and formaldehyde, dynamometer measurements are designed to follow regulatory standards, and gas samples were collected from the exhaust for the entire cycle. Gas species were preconcentrated in a purge-and-trap system and subsequently analyzed in a GC/MS, and GC was equipped with a fused silica capillary column to determine the benzene content [25]. In addition, the motor vehicle exhaust gas was taken by a Teldar bag and then influent into a precoated 2,4-DNPH (dinitrophenylhydrazine) cartridge. High-performance liquid chromatography (HPLC) associated with the separation column was applied to separate and measure the DNPH derivatives of formaldehyde [25].
For BaP, the diesel PM was taken by a quartz-fiber filter that had previously been heated in air at 900°C for 4 h to lower their carbon blank level. The PM filter was extracted by a dichloromethane–acetonitrile mixed solvent and BaP was analyzed by GC–MS (gas chromatography and mass spectrometry) associated with an HP-5MS capillary column for separation [8].

2.2. Determination of the Annual Running Mileage of Mobile Sources

In this study, mobile source emissions were estimated using the emission factor method. The activity intensity was calculated by referring to the TEDS11.0 (Taiwan emission data system version 11.0) manual for mobile source emission estimation and using the fuel consumption method. The activity intensity is defined as the amount of fuel consumption per unit time, and it is expressed in vehicle kilometers travelled (VKT). In the process of activity intensity estimation, the total annual vehicle kilometers travelled by each motor vehicle and the proportion of activity intensity by vehicle type are required to calculate the total annual activity intensity of each road in the study area. The number of different motor vehicle fleets is shown in Table 1.
In this study, the total vehicle mileage was estimated using the fuel consumption method. Based on the fuel consumption in 2013, 2016, 2019, and 2021, the average annual vehicle mileage, average vehicle fuel efficiency, average annual vehicle fuel consumption calculated from the number of vehicles, and fuel sales at gas stations were used to determine the fuel consumption distribution for different vehicle types in each county and city. The estimation process is shown in Figure 1.

2.3. Determination of Air Pollutant Emission Factor

In this study, the estimated air pollutant emission factors can be divided into two categories: one is the criteria air pollutant and the other is the hazardous air pollutant; the process of emission estimation is shown in Figure 1. For the criteria pollutants, the PM2.5 and brake wear PM2.5 emission factors were obtained by applying the MOVES model and inputting parameters such as vehicle activity intensity and number of vehicles in Taiwan, while tire wear PM2.5 was obtained by referring to TEDS. The HC emissions were divided into gasoline and diesel vehicles. The hydrocarbon (HC) emission factors for gasoline vehicles were calculated by using the data from the previous year’s dynamometer measurements, and the HC vapor emission factors were obtained by using MOBILE6.2. The emissions of benzene and formaldehyde were divided into gasoline and diesel vehicles. The HC emission factors for gasoline vehicles were obtained by multiplying the measured fingerprint ratio with the actual data of the vehicle dynamometer in the past years, while the emission factors for evaporative benzene were estimated using MOBILE6.2. The emission factors for BaP were estimated by inputting the activity intensity and number of vehicles in Taiwan in the same MOVES model as that used for PM2.5, which is mainly concerned with the BaP of particulate matter.

2.4. Spatial Road Traffic Activity and Emission Loading Analysis

Total running mileages of different types of vehicles are investigated by the Ministry of Transportation and Communication (MTOC) and TEPA. The data of traffic volume investigation of MTOC and local government are used to estimate the spatial distribution of different types of traffic volume and running mileages, especially in freeways, highways, and routes in urban areas. In addition, the emission factors of motor vehicles are determined by Taiwan Emission Data system by TEPA. The fuel consumption, running mileage, and traffic volume in different ways and air pollutant emission factors of vehicles were employed to determine air pollutant spatial distribution.

3. Results and Discussion

3.1. Criteria Pollutants from Mobile Sources

The activity intensity and emission factors of road mobile sources were employed to estimate the criteria pollutant emissions for the years 2013, 2016, 2019, and 2021. An examination of the change trends between years and the differences in emissions between different vehicle types was employed to understand the main types of vehicles affected by the criteria air pollutant emissions in different years (shown in Figure 2). These were subsequently compared with the proportion of emissions between different vehicle types in order to determine the change trend for vehicle age composition indifferent years. Finally, we compared the emissions of the criteria air pollutants in different regions of Taiwan in different years to understand the spatial distribution trend for emissions.
In Taiwan, the mobile sources contributed approximately 30% of PM2.5, 50% of NOx, and 19% of hydrocarbon emission [26]; therefore, the mobile sources can be considered the important air pollution sources and they affect the human health, especially in urban areas. In Europe, the relative importance of the transport sector has increased despite the EURO legislation on vehicle exhaust emission controls. Based on the stringent standards, PM, NOx, and VOC emissions from road transport would fall by 70, 86, and 80% in 2030, respectively [27].
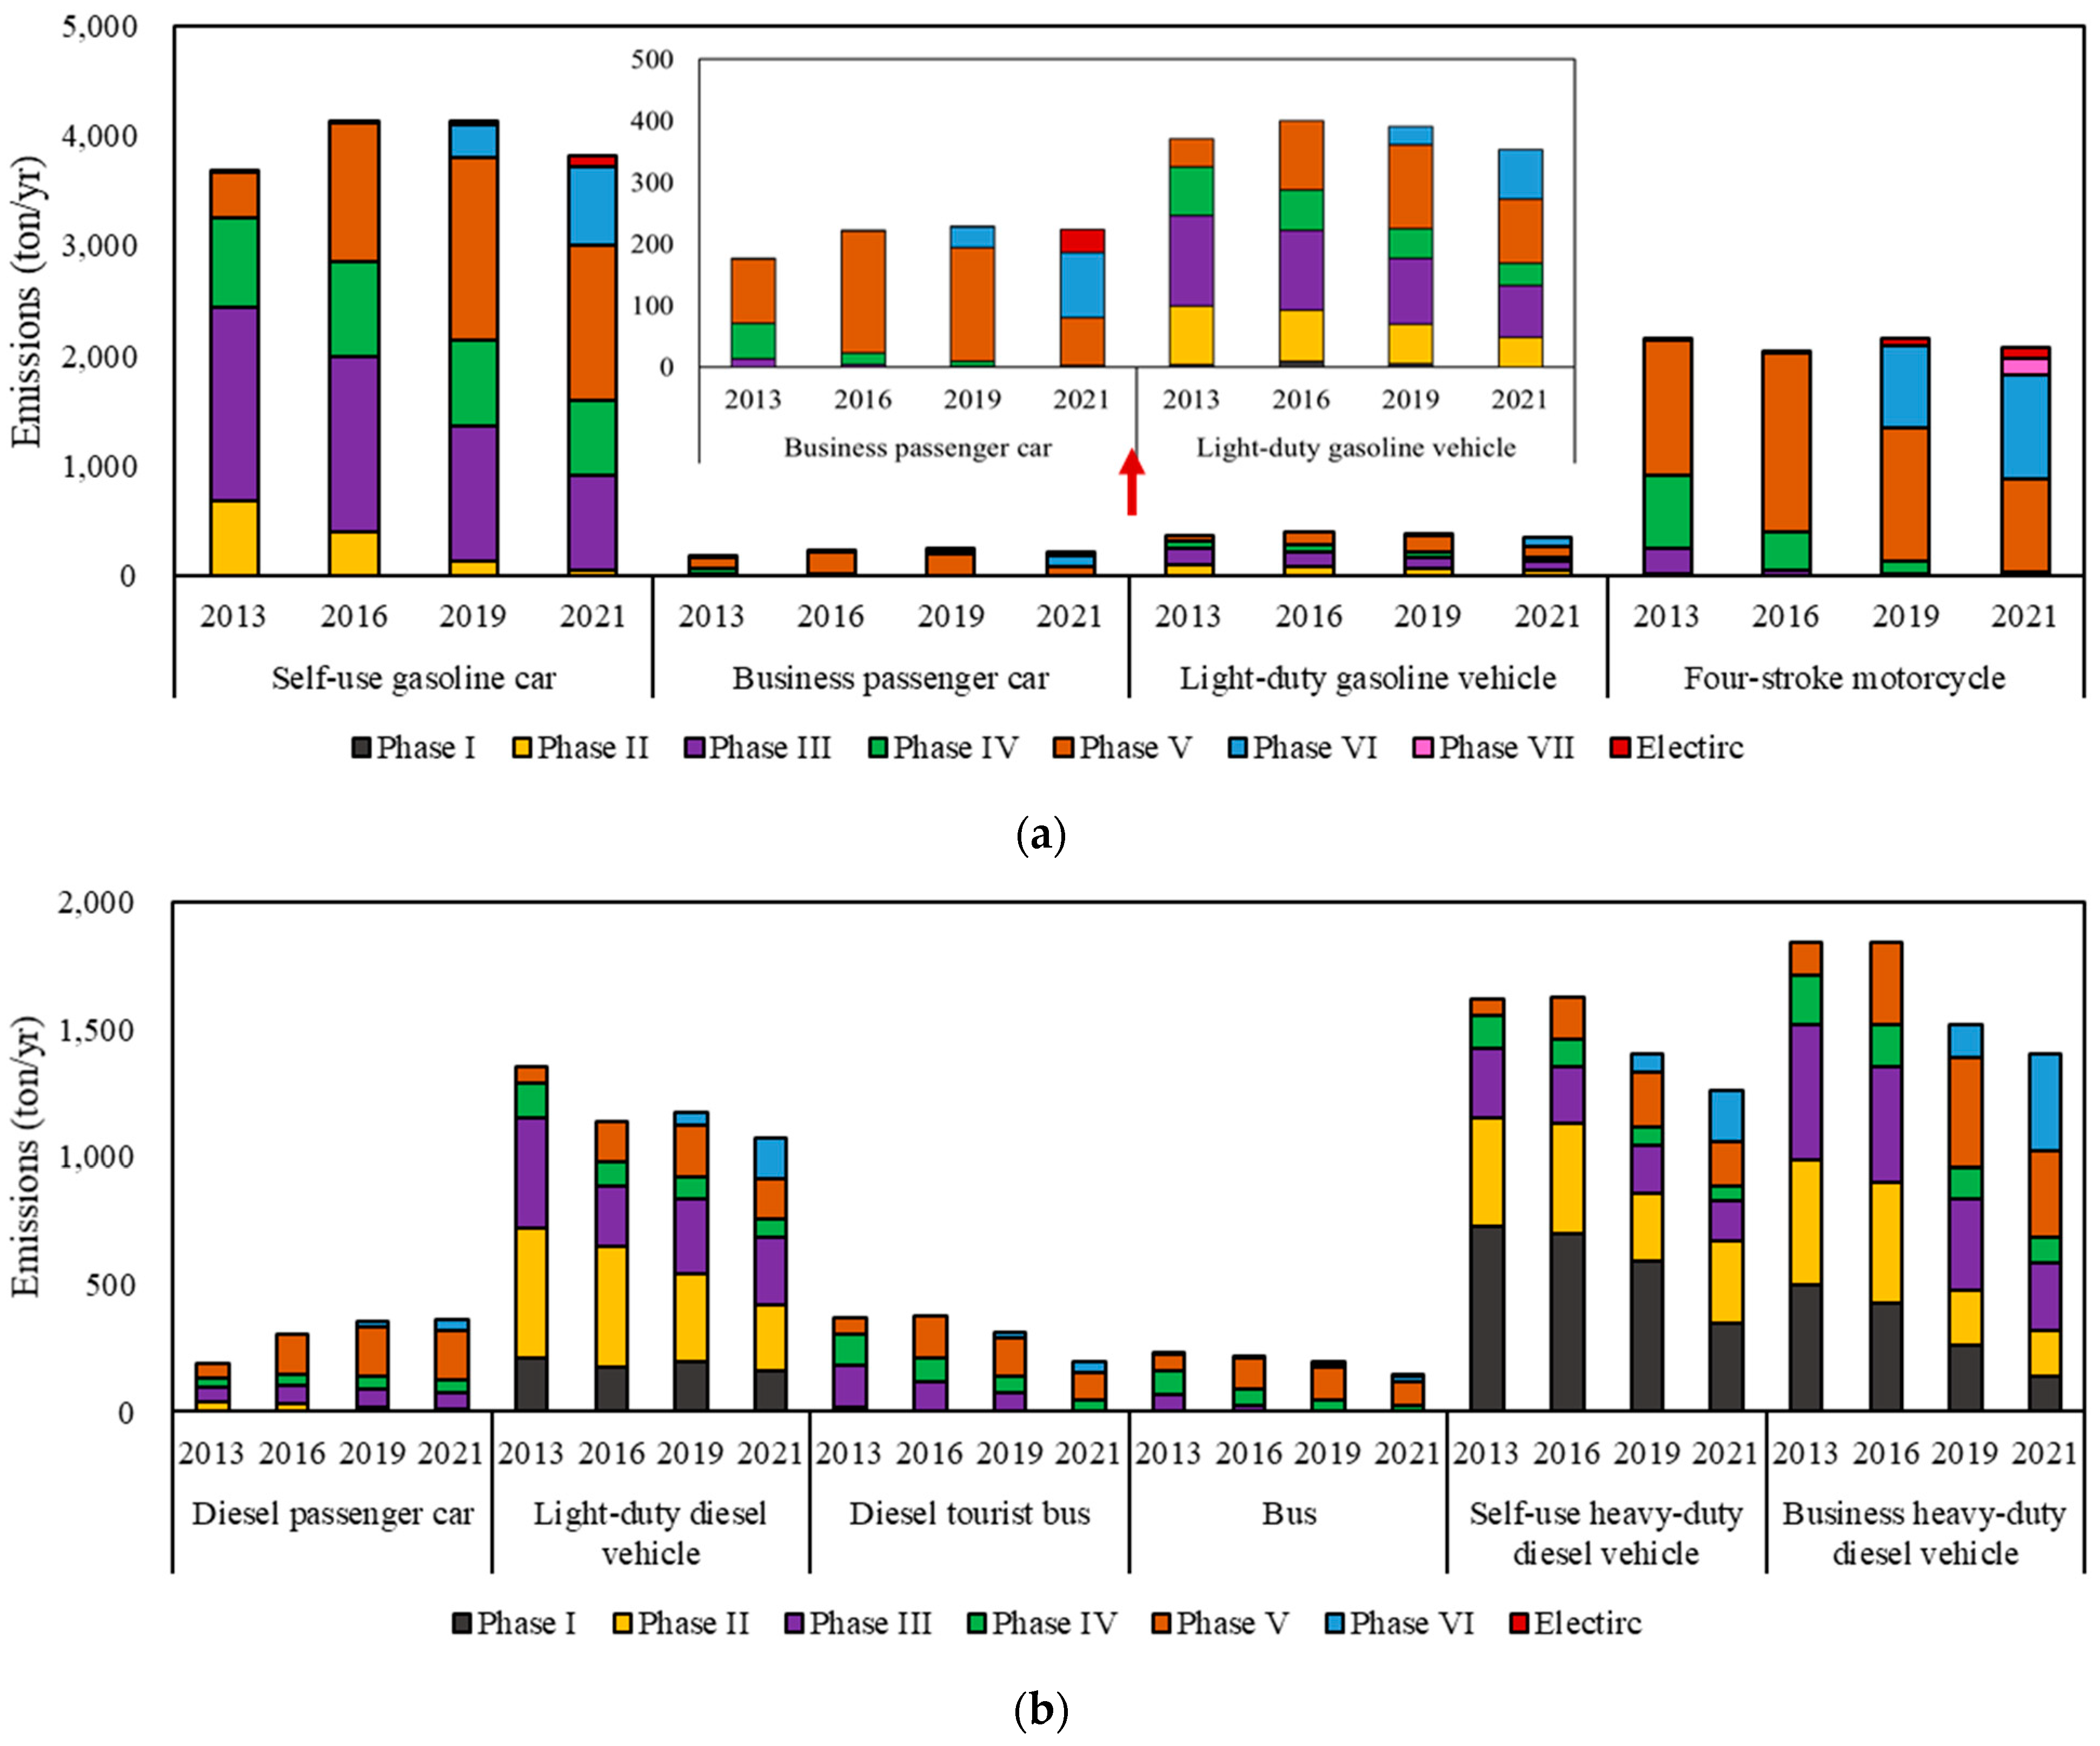
PM2.5 emission includes tire and wear emission. Therefore, the PM2.5 emission factor of gasoline vehicles is significantly lower than that of diesel vehicles. However, the higher activity intensity of gasoline vehicles compared to diesel vehicles led to the total PM2.5 emission of diesel vehicles being slightly higher than that of gasoline vehicles.
The NOx emission factor of gasoline vehicles is much lower than that of diesel vehicles, even if the activity intensity is high for gasoline vehicles. The NOx emission is still significant in diesel vehicles compared to in gasoline vehicles.

3.1.1. Emission Variation in the Period of 2013–2021

(1) PM emission
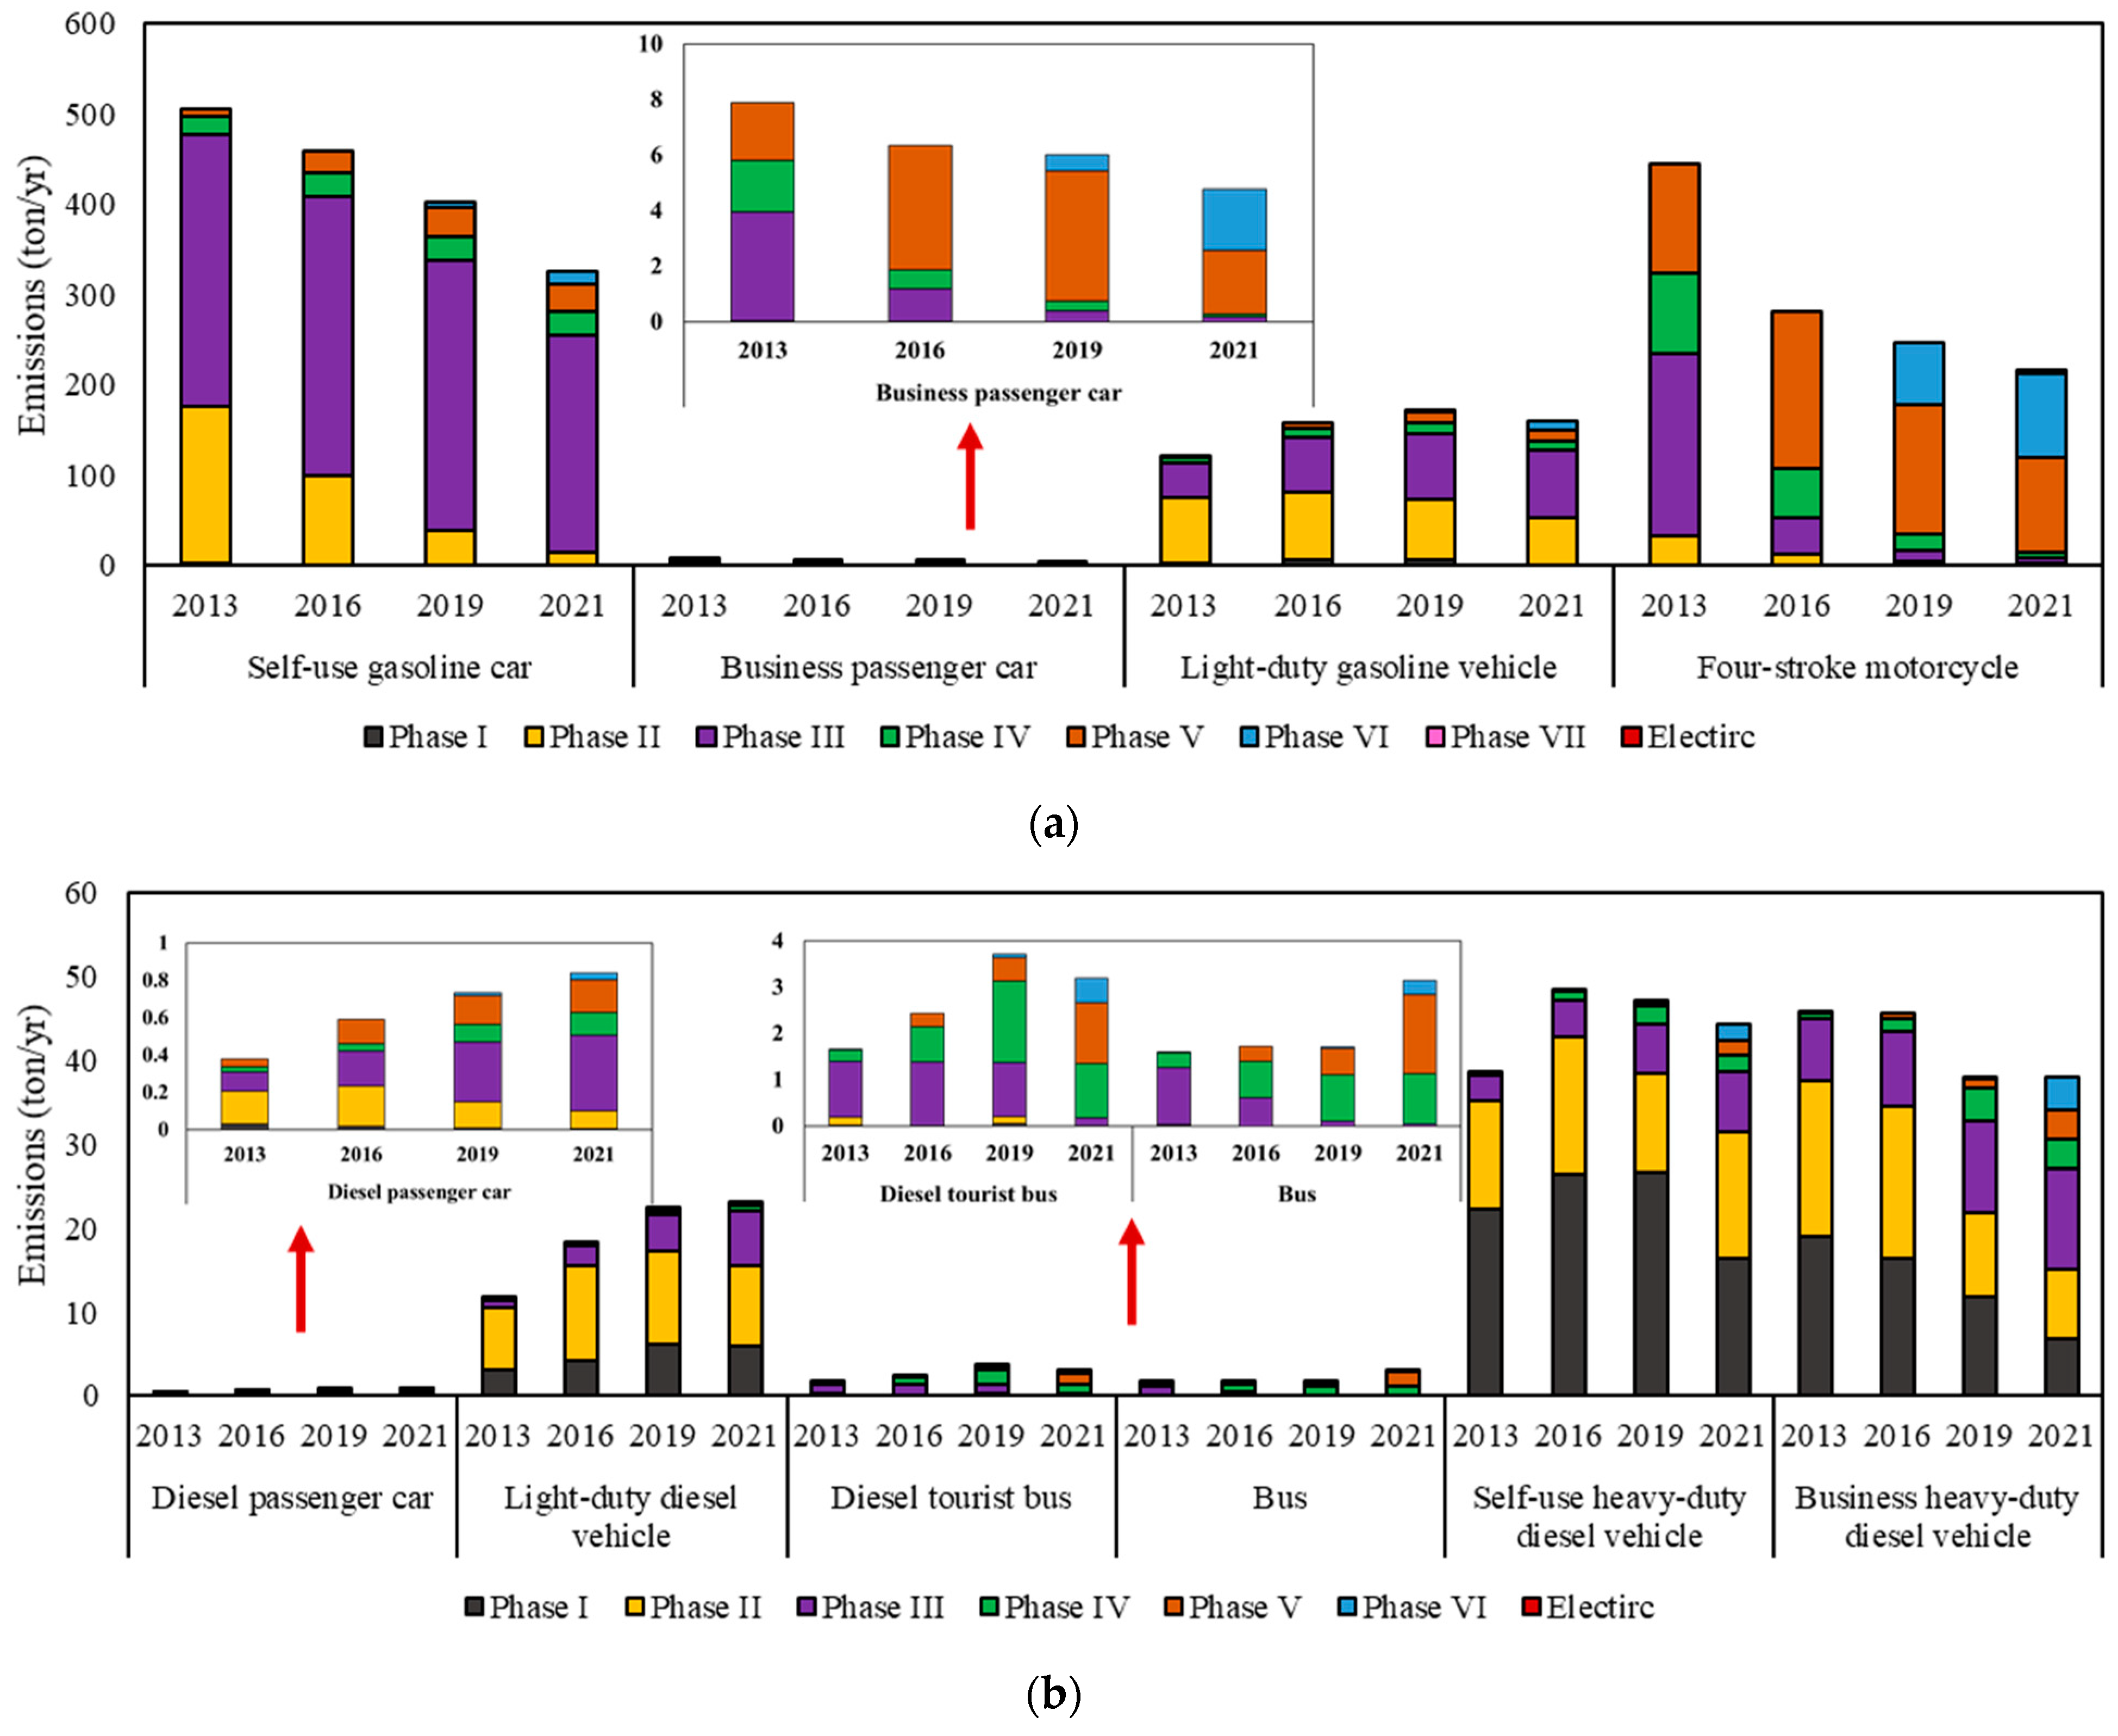
Motorcycles: The total PM2.5 emissions from motorcycles were 2456, 2235, 2223, and 2123 tons in the years of 2013, 2016, 2019, and 2021, respectively. The results indicate an overall decreasing trend. As shown in Figure 3a, four-stroke motorcycles had the largest portion of emissions in the years 2013, 2016, 2019, and 2021, mainly due to their high population portion, compared with two-stroke and electric motorcycles, and most of them were newer vehicles. In addition, two-stroke motorcycles were phased out of their production in 2004 because of their higher pollution. In addition, the lower portion of the two-stroke motorcycle is represented in the total vehicles (the number of two-stroke motorcycles was 453,675, which was approximately 2% of total vehicles in Taiwan in 2021) and contributed to lower airborne pollution emission (less than 0.5% for PM) in the statement.
Gasoline vehicles: The three groups (self-use gasoline car, business passenger car, and light-duty gasoline vehicle) were assembled to summarize gasoline vehicles, except motorcycles. The total PM2.5 emissions from gasoline vehicles were 4295, 4833, 4844, and 4444 tons in the years of 2013, 2016, 2019, and 2021, respectively, showing an overall increasing trend in 2013–2016, followed by a decreasing trend in 2019–2021.
Our results show that the largest portion of emissions from gasoline passenger cars was from the regulation phase III, phase III, phase V, and phase V vehicle fleets in the years 2013, 2016, 2019, and 2021, respectively. The total number of new vehicles continued to increase with the annual renewal, thus allowing the cleaner phase V vehicles to replace the older phase III vehicles, which have higher emissions. The composition of business gasoline passenger vehicles is dominated by newer vehicles. The number of light-duty gasoline vehicles is the same as that of gasoline passenger vehicles, indicating that the total number of new vehicles continues to increase with yearly renewal. After 2019, the most vehicles could follow the phase V emission standards.
Diesel vehicles: The total PM2.5 emissions from diesel vehicles were 5857, 5634, 5088, and 4561 tons in 2013, 2016, 2019, and 2021, respectively. The overall decreasing trend is revealed by comparing the emissions from different diesel vehicles. The main sources of PM2.5 emissions from diesel vehicles are self-owned or business heavy-duty diesel trucks, followed by light-duty diesel vehicles, diesel passenger cars, diesel tourist passenger buses, and public passenger buses (shown in Figure 3b).
Our results show that the largest emissions from diesel vehicles in the years 2013 and 2016 were phase I and II vehicles, indicating that these vehicle types have been in use for a longer period of time. The older diesel vehicles also have higher exhaust emission factors, so even though the activity intensity is lower, they still have a certain contribution to the emissions. The diesel passenger cars, diesel buses, and buses for passenger transportation are mainly newer vehicles. In 2019 and 2021, the largest portion was for phase V vehicles. During 2013–2021, the PM emission of diesel vehicles were major from phase II and III emission standard vehicles.
(2) NOx emission
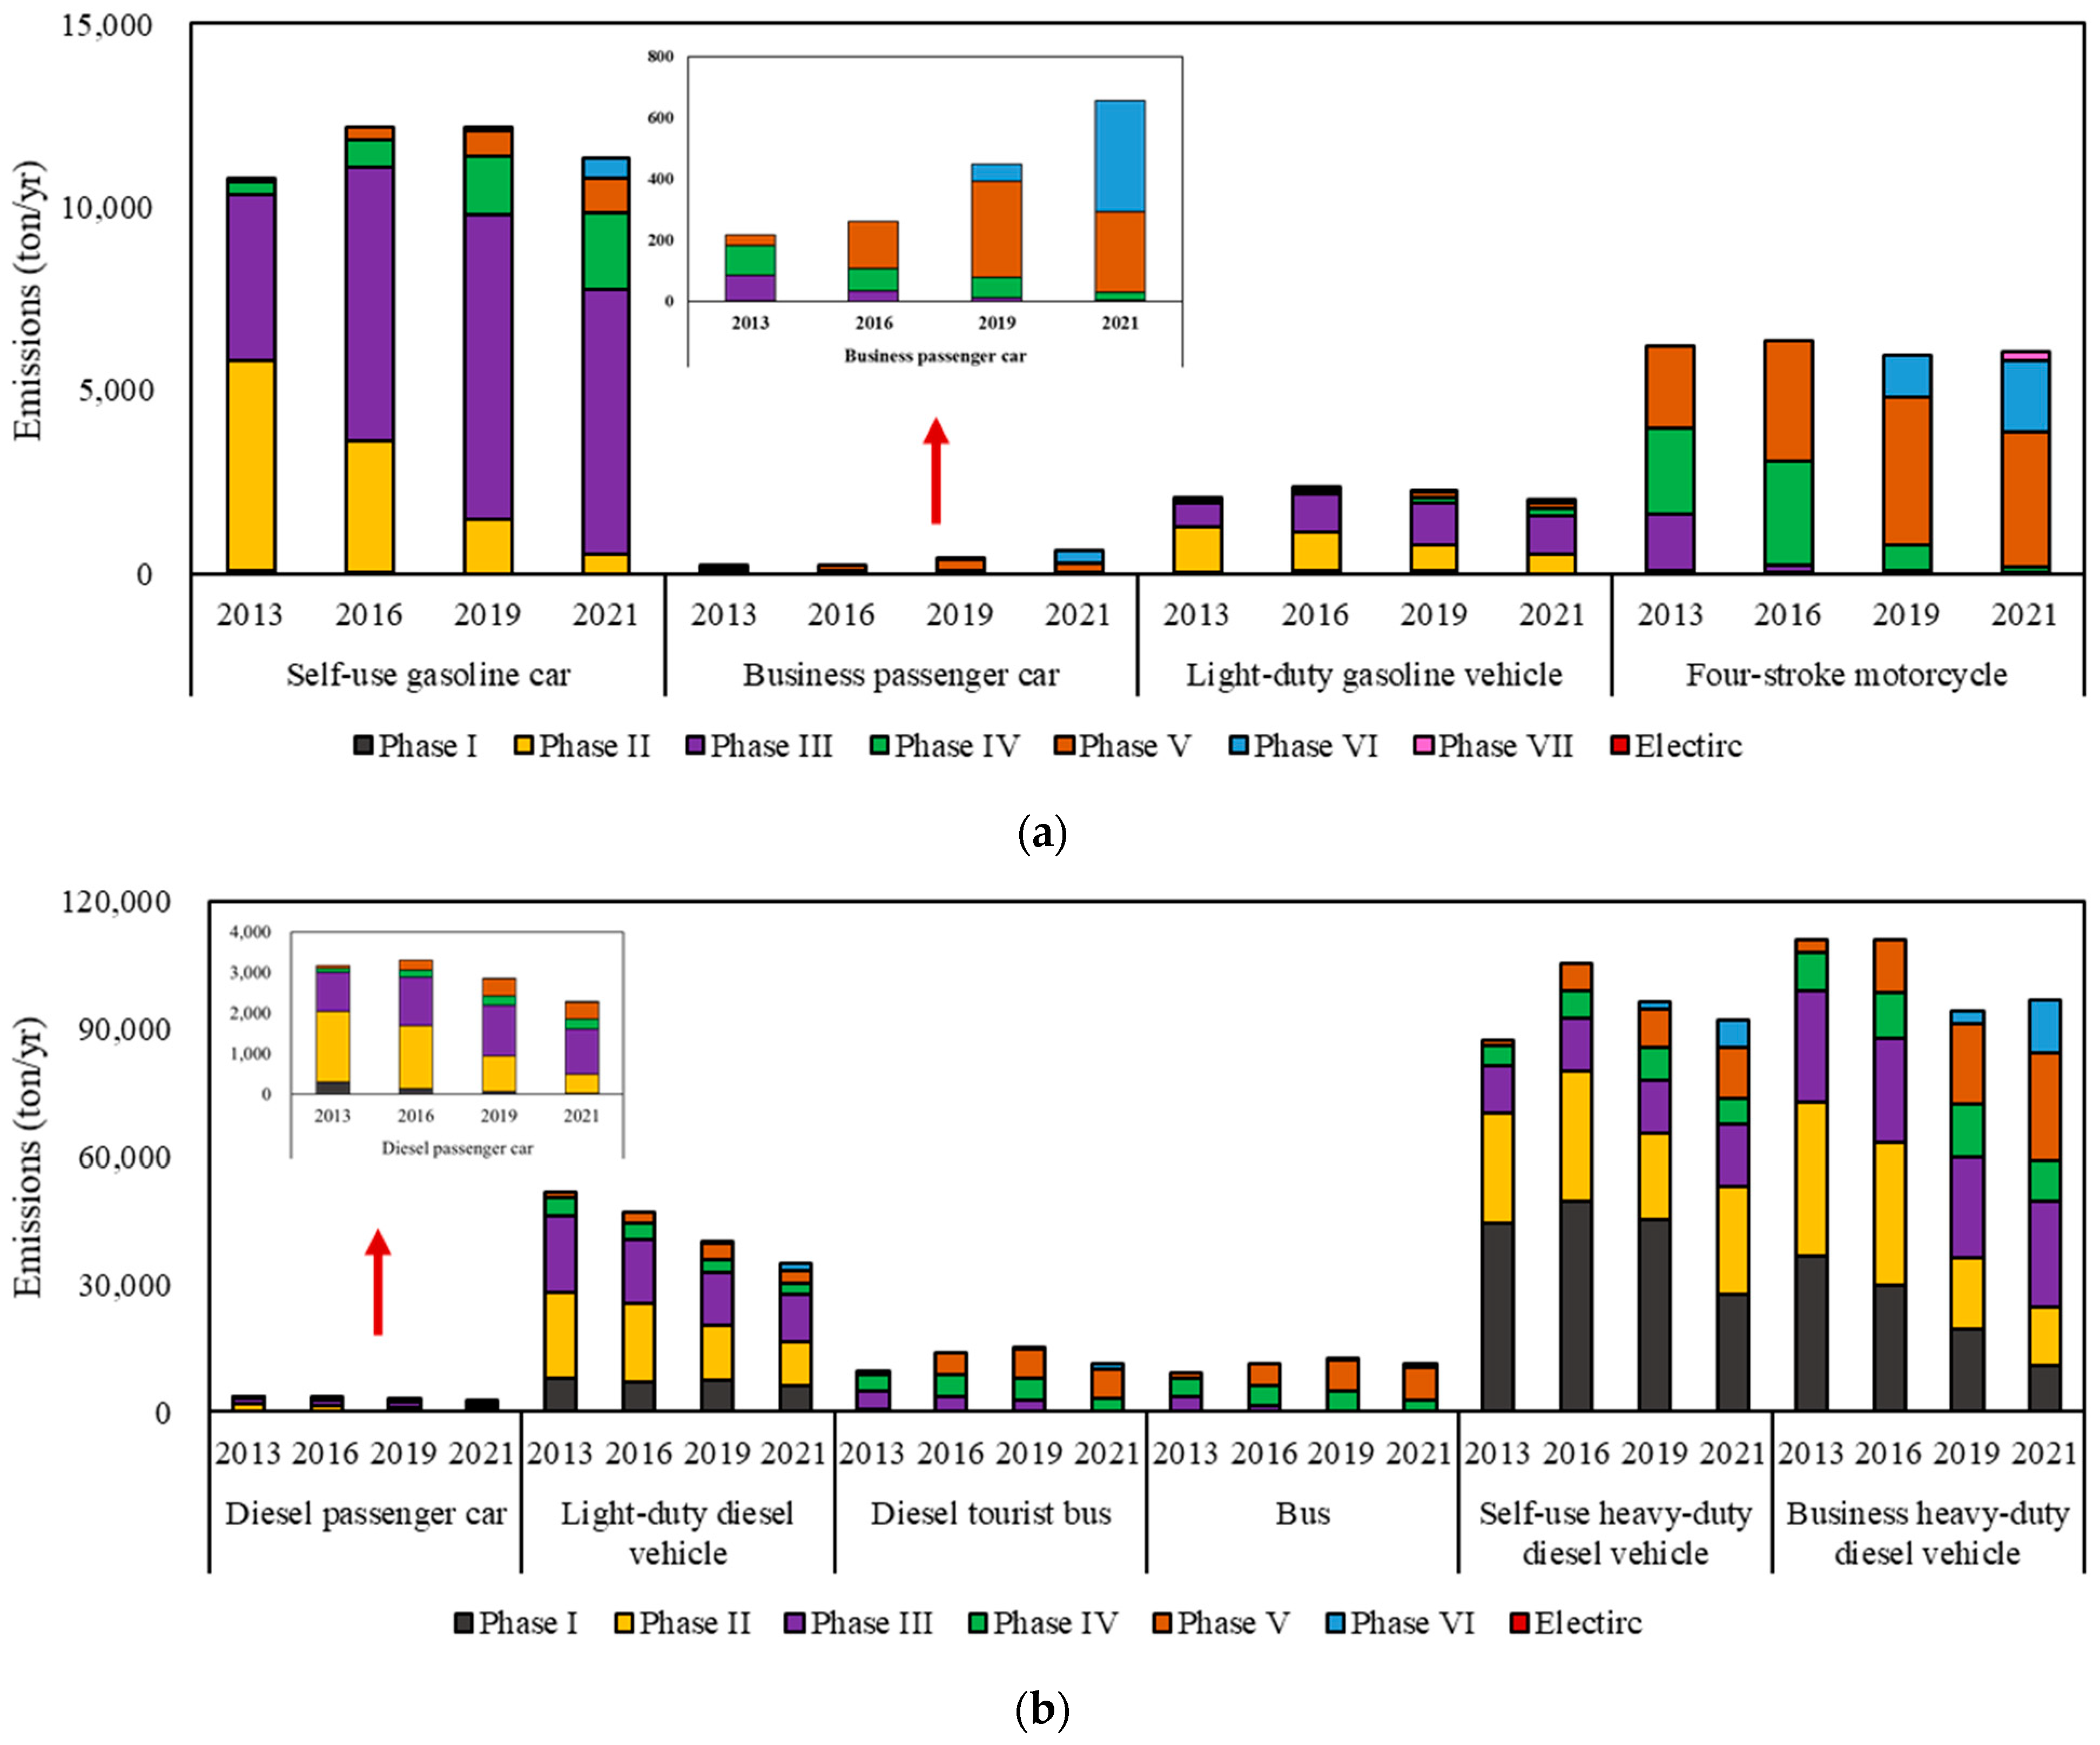
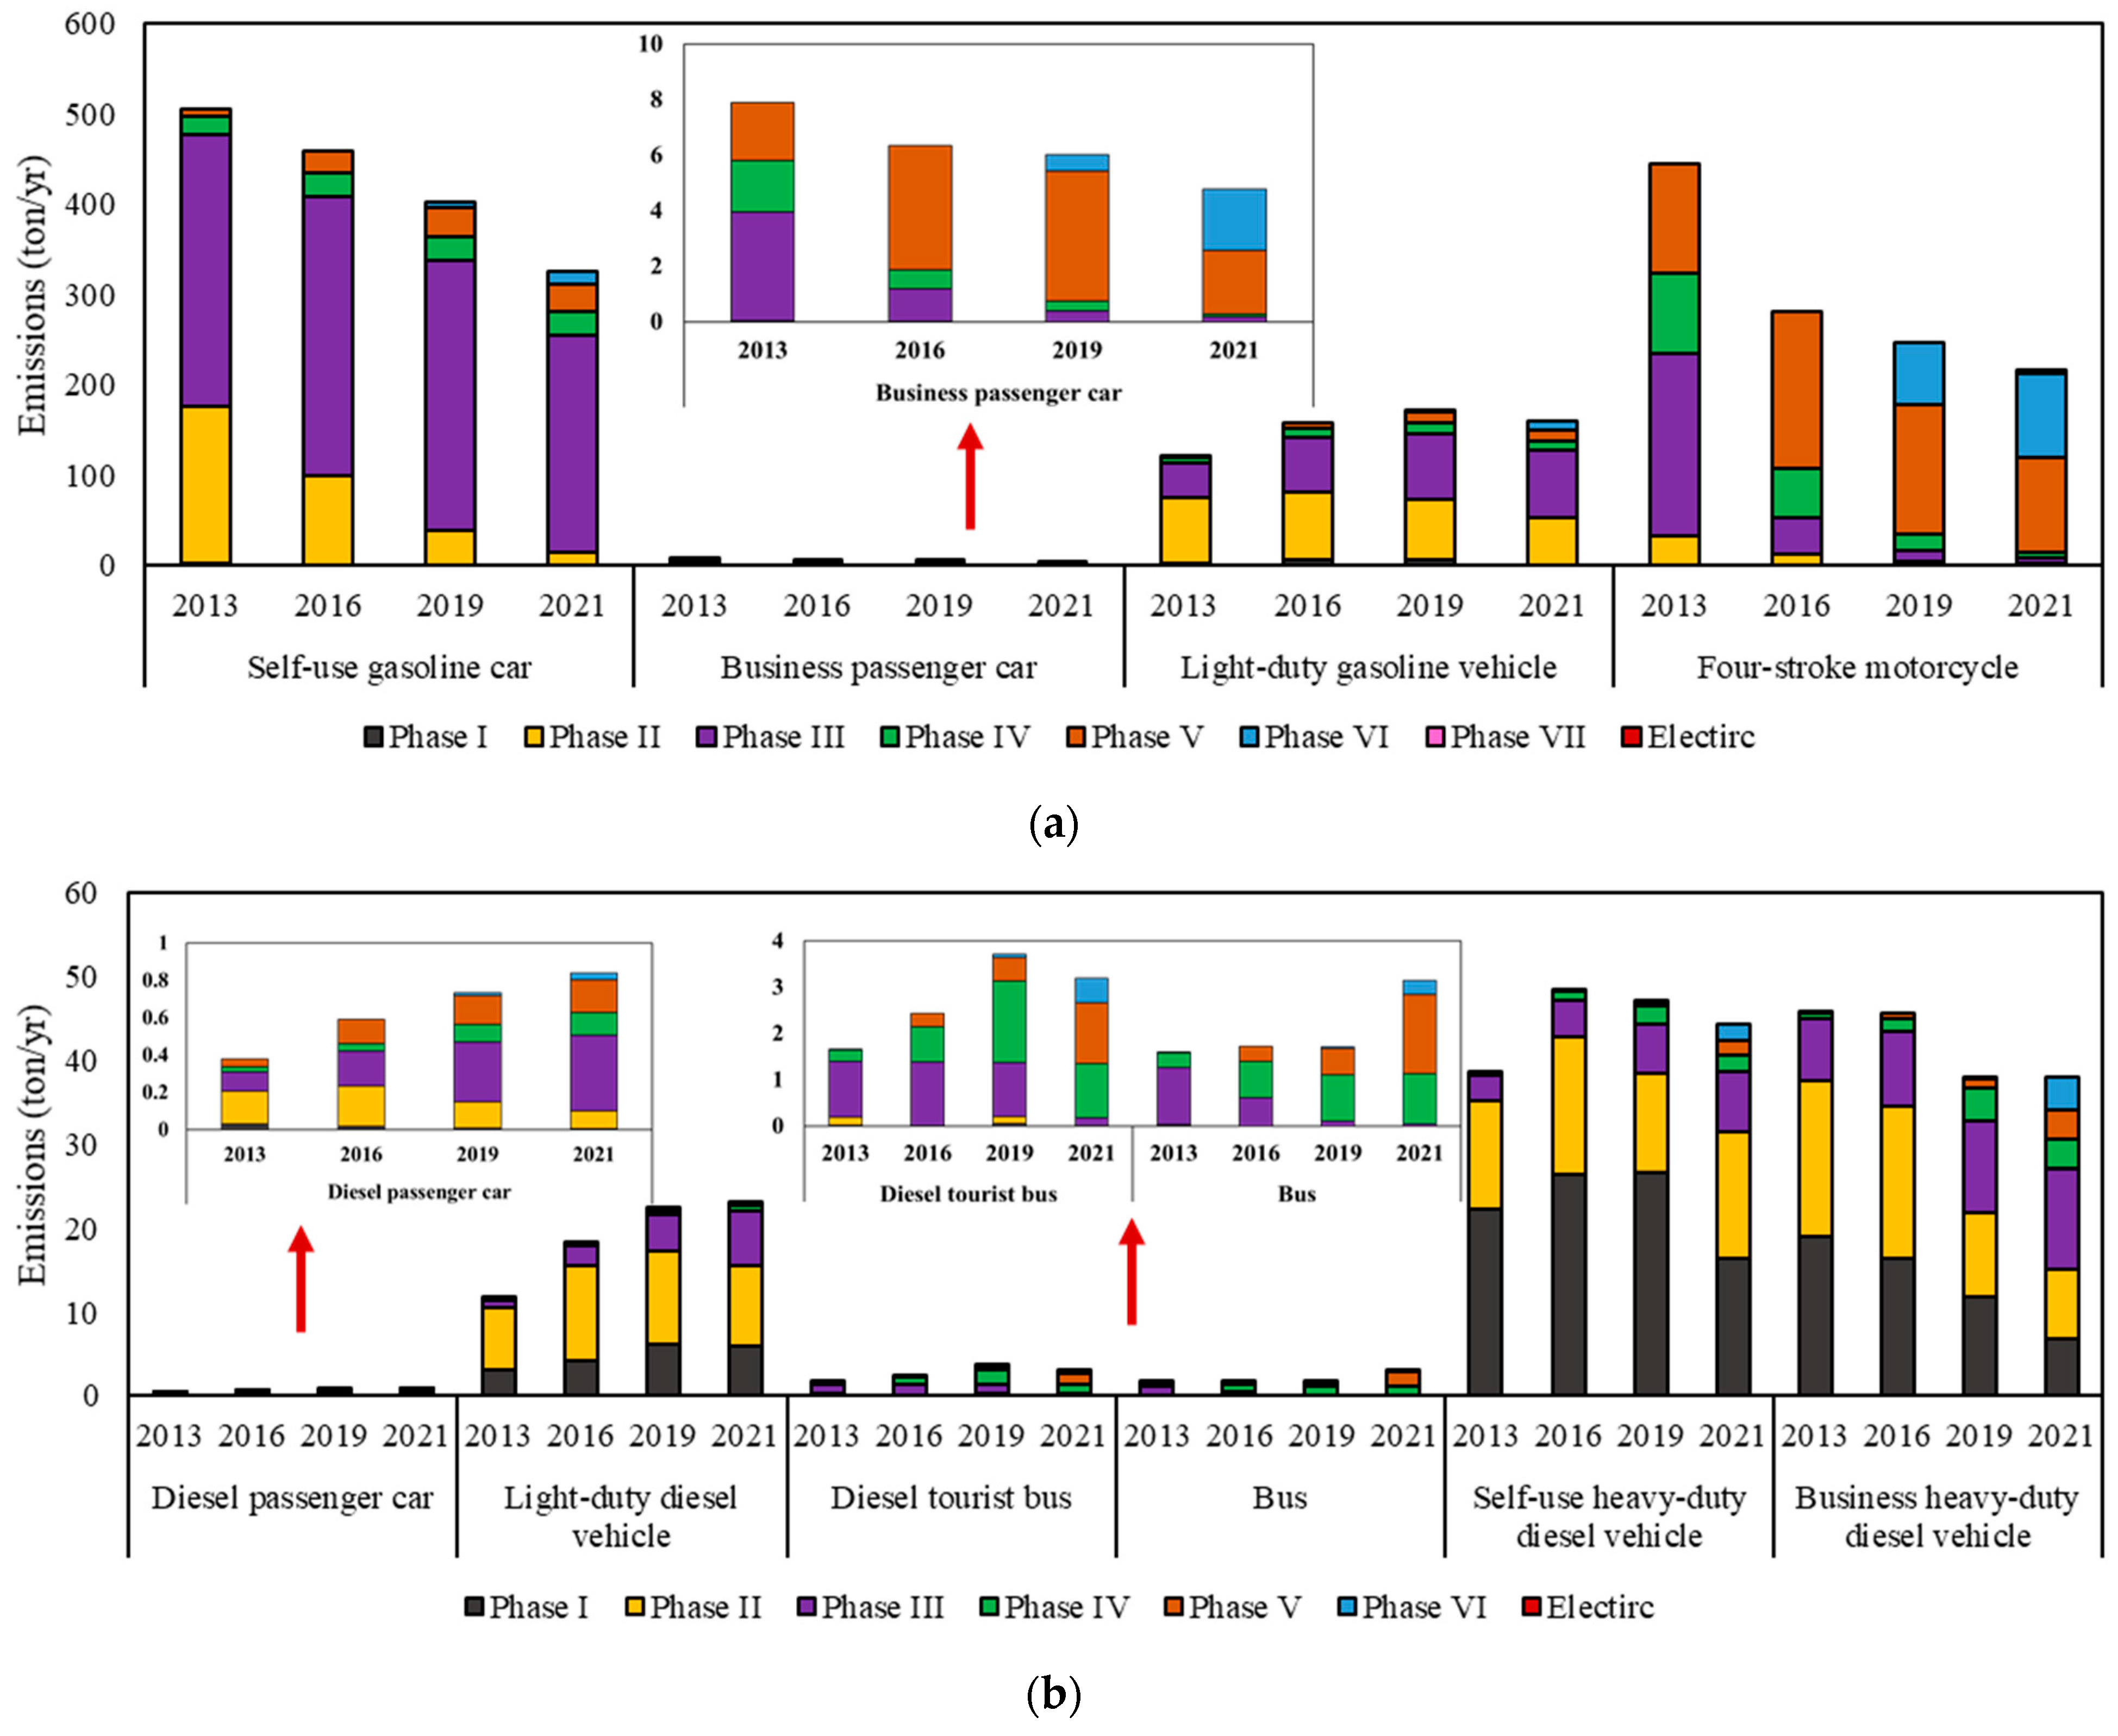
Motorcycles: The total NOx emissions of motorcycles in the years 2013, 2016, 2019, and 2021 were 6398, 6501, 6024, and 6111 tons, respectively. The overall emissions increased and then decreased. The main source of NOx emissions of motorcycles was the four-stroke motorcycles (as shown in Figure 4a). Four-stroke motorcycles had the larger portion of phase IV and V vehicle emissions in 2013 and 2016. After 2019, the phase V and VI motorcycles and electric motorcycles were used to replace the phase III and IV motorcycles that could reduce the NOx emission.
Gasoline vehicles: The total NOx emissions from gasoline vehicles were 13,484, 15,054, 15,116, and 14,110 tons in the years 2013, 2016, 2019, and 2021, respectively, with an overall increasing trend. The results show that the largest emissions from self-use gasoline passenger cars were major from phase II, phase III, phase III, and phase III vehicles in 2013, 2016, 2019, and 2021, respectively. Compared to PM2.5, the source of NOx emissions is tailpipe emissions, and the difference in emission factors between different years is relatively large. The emission of self-use gasoline passenger cars contributed a high portion of NOx emission. Although high running mileage was seen for the business gasoline passenger cars, they had a low number of vehicles and most of the vehicles were still new, which led to the lowest portion of the NOx emissions. The trend for the overall phase portion of light-duty gasoline vehicles is the same as that of gasoline passenger cars, with phase II vehicles gradually becoming phase III vehicles.
Diesel vehicles: The total NOx emissions from diesel vehicles were 260,000, 290,000, 260,000, and 250,000 tons in the years 2013, 2016, 2019, and 2021, respectively. The main reason for this is that trucks are generally older, so a higher proportion of these vehicles are old, while passenger cars are mainly newer vehicles.
As shown in Figure 4b, the largest emissions from diesel trucks were still in phases I and II in the years 2013, 2016, 2019, and 2021, indicating that this vehicle type has a longer service life. The reason is that old diesel trucks still have higher emission factors than the newer phase IV and phase V vehicles, so even though the activity intensity is gradually decreasing, they still have a certain contribution to the emissions. In contrast, diesel passenger cars, diesel buses, and bus passenger transportation are mainly newer vehicles; as for light-duty diesel vehicles, they are between heavy-duty trucks, diesel passenger cars, and buses, and the main emission periods during these four years were for phase II and III vehicles.
(3) HC emission
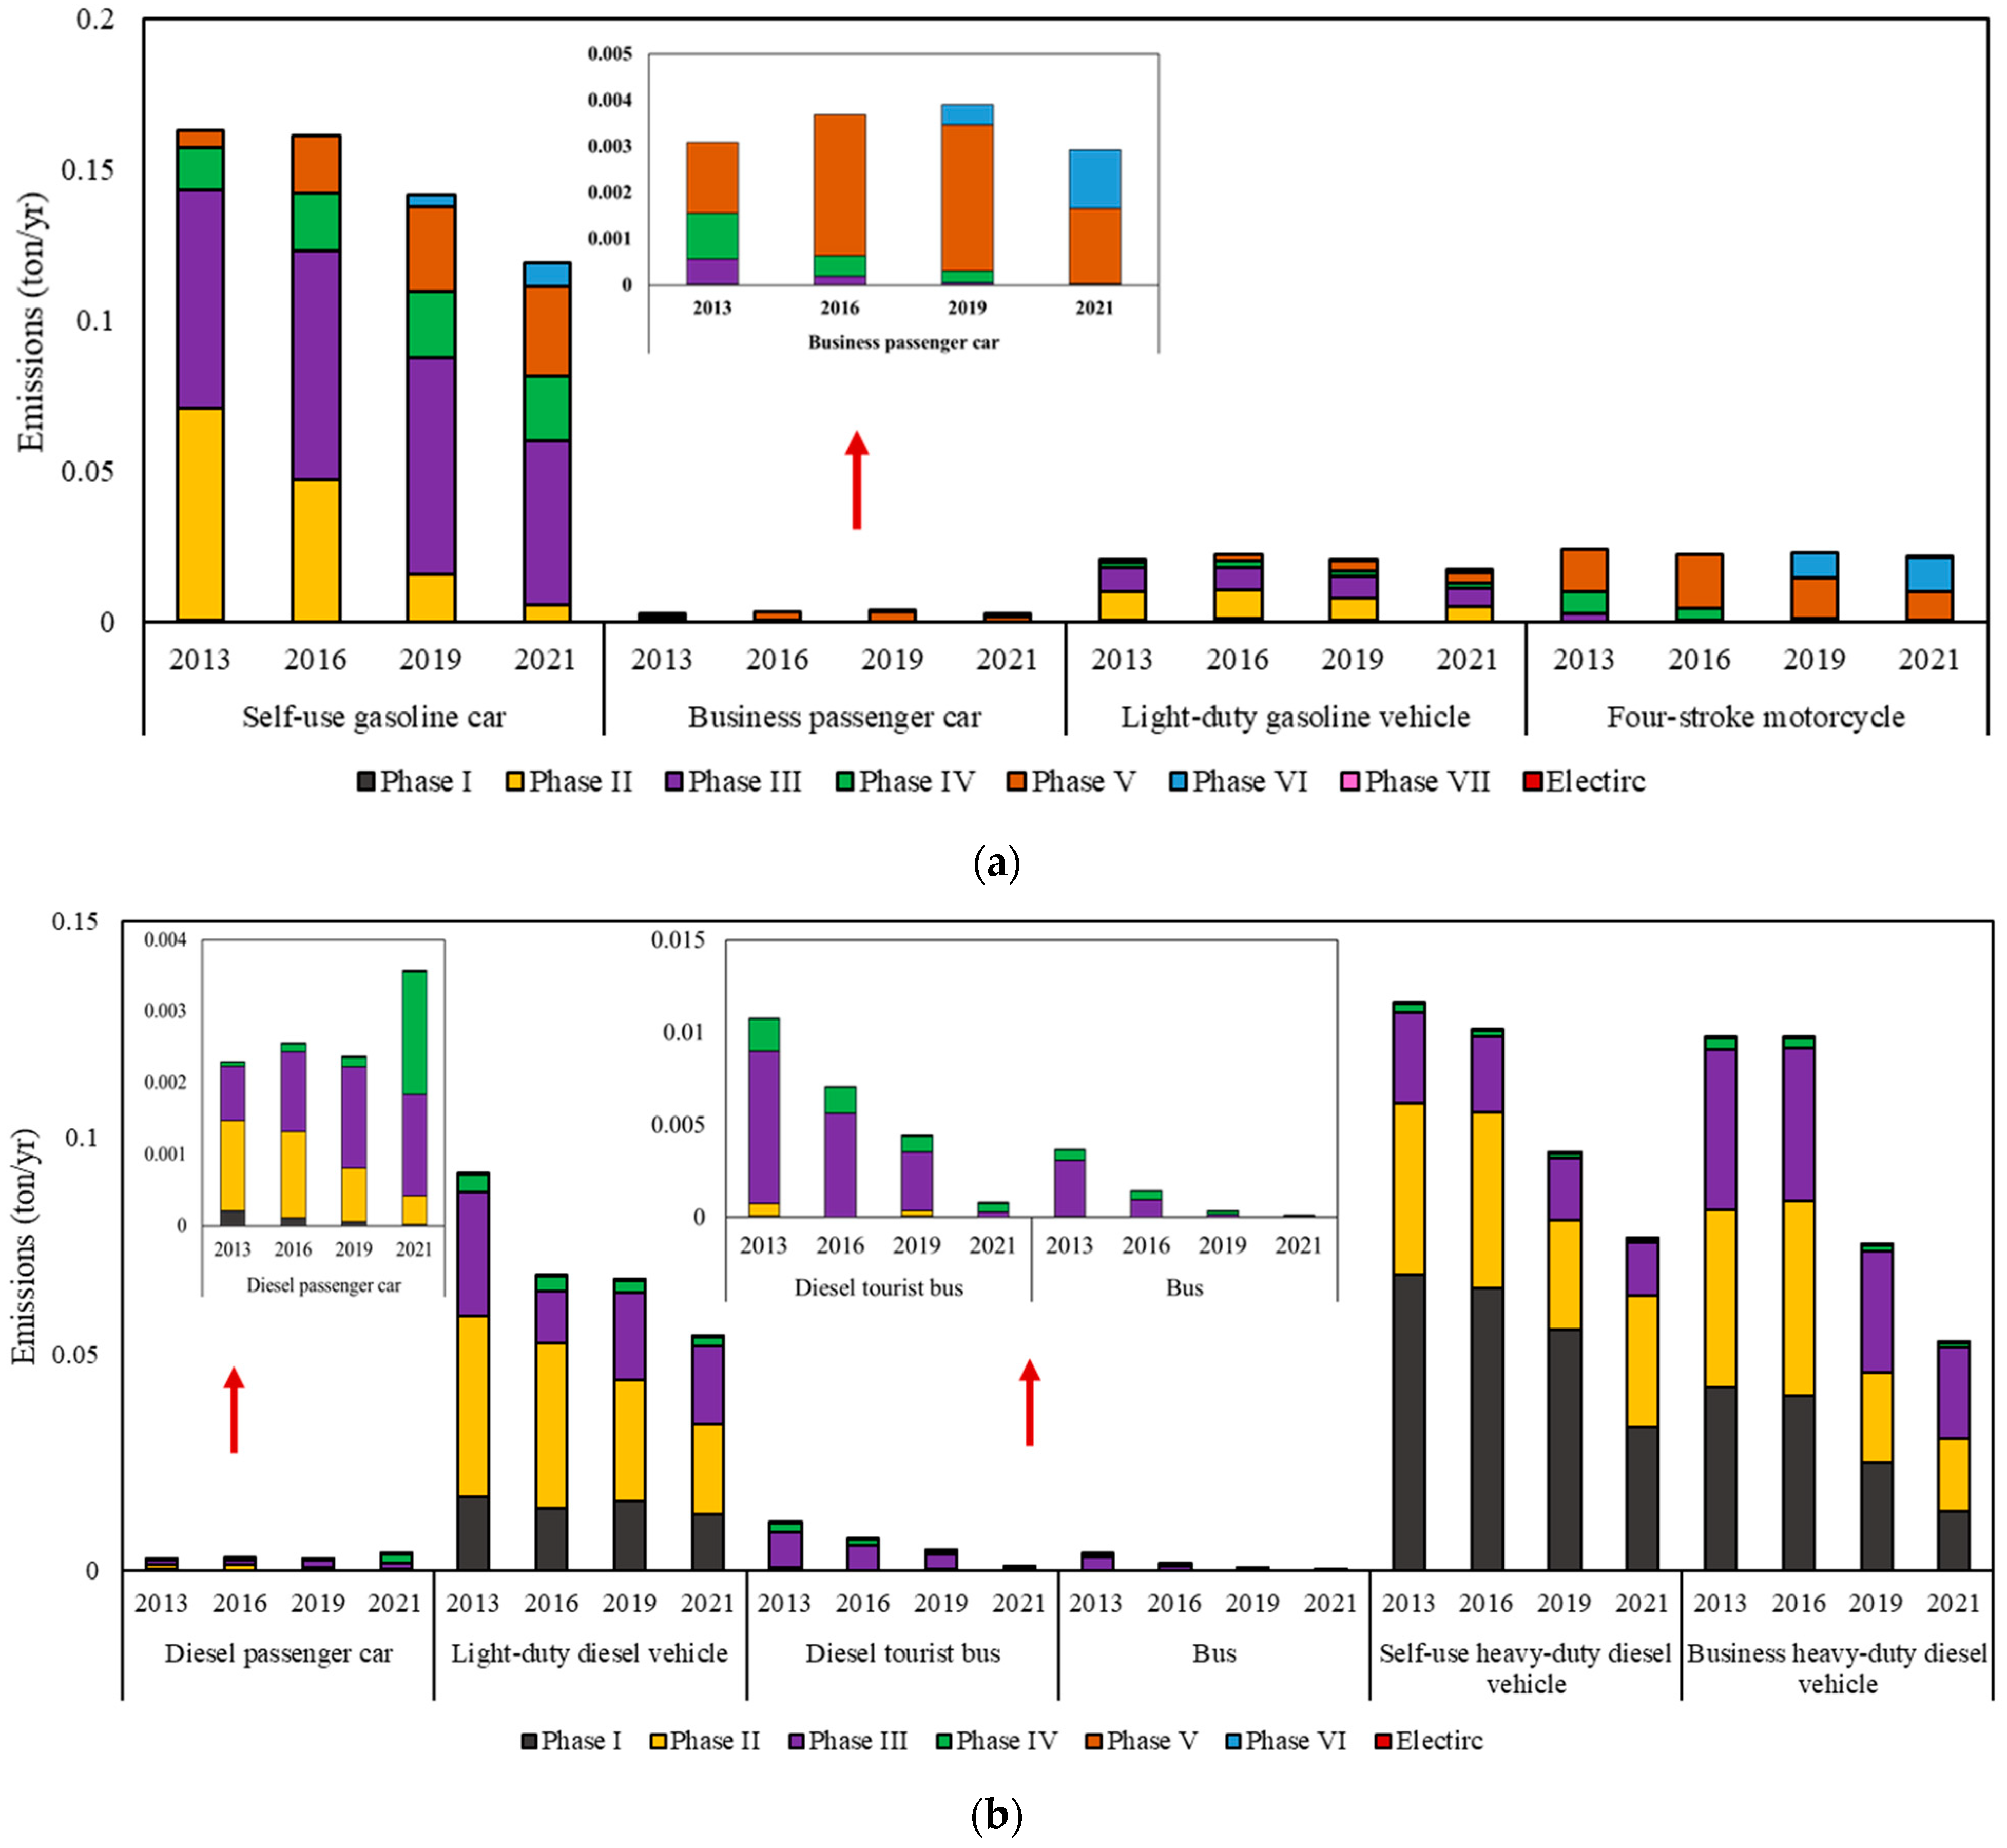
Motorcycles: The total HC emissions from motorcycles were 68,000, 48,000, 38,000, and 37,000 tons in the years 2013, 2016, 2019, and 2021, respectively, with a decreasing trend. The main source of HC emissions came from four-stroke motorcycles in 2008 and 2010 due to the significant phase-out of two-stroke motorcycles. As shown in Figure 5a, four-stroke motorcycles accounted for the largest portion of emissions in the years 2013 and 2016. In addition, although the activity intensity of four-stroke motorcycles did not change much during the four-year period, because the age composition of four-stroke motorcycles and the emission factors decreased with the period, this resulted in a smaller decrease in emissions from four-stroke motorcycles. There was an overall decrease in emissions that resulted from the reduction of two-stroke motorcycles. The reduction of emissions from motorcycles was more obvious as a result of the phase-out of two-stroke motorcycles during the four-year period.
Gasoline vehicles: The total HC emissions from gasoline vehicles were 23,000, 30,000, 40,000, and 39,000 tons in the years 2013, 2016, 2019, and 2021, respectively, showing an overall increasing trend. The total emissions of gasoline vehicles in the four-year period are shown in Figure 5a, which illustrates how the largest portions of emissions from gasoline passenger cars were in the years 2013, 2016, 2019, and 2021, and that, unlike the PM2.5 and NOx emissions, HC emissions from gasoline vehicles are not only from exhaust emissions but also from vaporization emissions. Unlike motorcycles, a larger proportion of the HC emissions come from vapor emissions for gasoline vehicles. In addition, the relatively high exhaust and vaporization emission factors of gasoline vehicles also influenced the emissions of gasoline vehicles to a certain extent. The deterioration of emissions caused by the increase in vehicle mileage and the inefficiency of the exhaust control equipment after the warranty led to the increase in gasoline vehicle emissions in 2016 and 2019.
Diesel vehicles: The total HC emissions from diesel vehicles were 8073, 9881, 9438, and 9211 tons in 2013, 2016, 2019, and 2021, respectively. As shown in Figure 5b, the largest portion of emissions from diesel vehicles is still from phase I and phase II vehicles in the years 2013, 2016, 2019, and 2021, respectively. As shown in Figure 5b, the largest portion of emissions from diesel vehicles is still from phase I and phase II vehicles in the years 2013, 2016, 2019, and 2021. With regard to diesel trucks, they are between the heavy-duty diesel trucks, diesel passenger cars, and large buses, and the main emission period in these four years was for phase II vehicles.
In Europe, fine particulate matter, nitrogen oxides, and ozone were the important ambient air pollutants leading to exposure and causing health effects [28]. In addition, road transport was the principal source of nitrogen oxides, responsible for 37% of emissions in 2020. Furthermore, 23% black carbon was emitted from the road transport [29]. Therefore, the mobile emission can be considered the important source of air pollution in metropolitan areas.

3.1.2. Spatial Distribution of Pollutant Emissions

(1) PM2.5 emissions
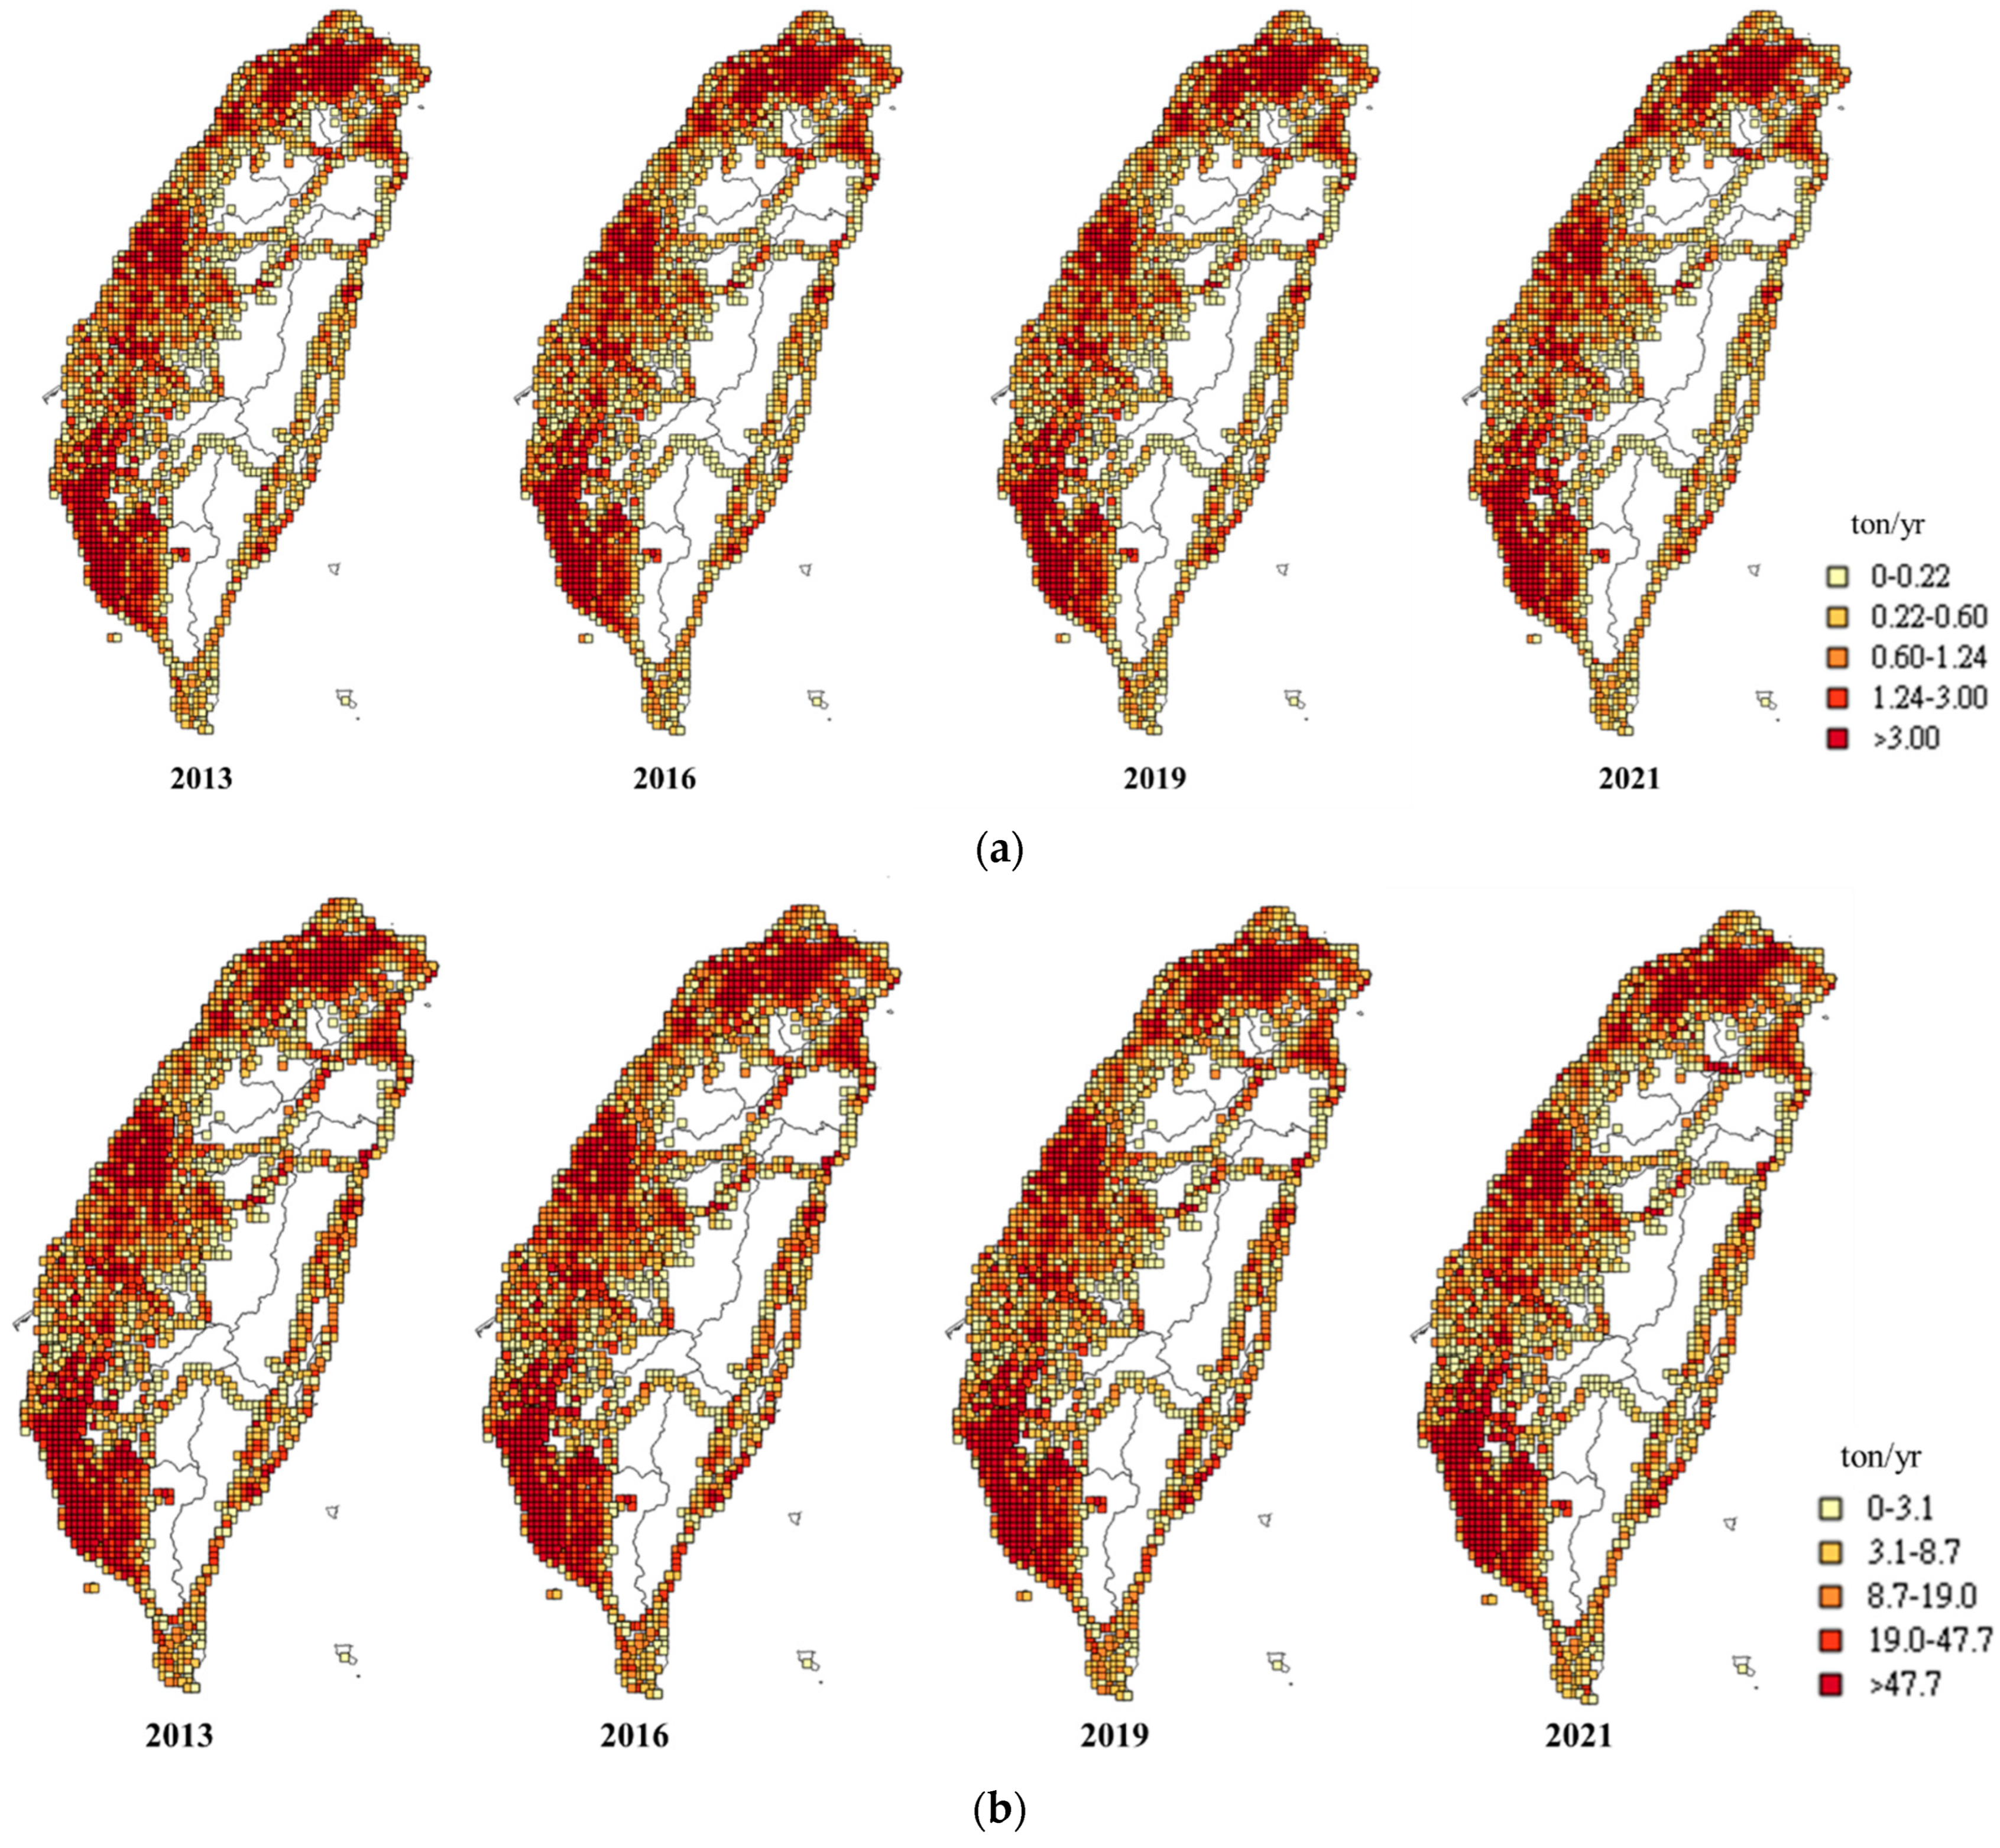
The spatial distribution of PM2.5 emissions for the years 2013, 2016, 2019, and 2021 was compared based on geographic regions in Taiwan, and the results showed that the highest percentage of PM2.5 emissions in the four-year period was in the northern region, followed by the southern and central regions (as shown in Figure 6a). In the four years, the overall emissions in northern Taiwan were 4671, 4749, 4544, and 4172 tons/year, which rose and then fell, but the regional percentages remained at 37.0, 37.4, 37.4, and 37.0%, indicating that the emissions in the northern region were still the highest in the country. The regional portions of the emissions were 28.2, 28.4, 28.7, and 28.9%, which reveal a slight increase in PM emissions in the central region of Taiwan. The portions of the emissions were 31.8, 31.3, 30.8, and 31.2% for the southern region, showing a decreasing trend, which is the opposite trend to that in central Taiwan, while the portion of the emissions from eastern Taiwan was about 3.0%.
(2) NOx emissions
The spatial distribution of NOx emissions in the years 2013, 2016, 2019, and 2021 was compared based on the geographic regions of Taiwan, and the results showed that the highest percentage (33.9–34.7%) of NOx emissions (92,000–110,000 tons per year) in the four-year period was in northern Taiwan (as shown in Figure 6b). The emissions from central Taiwan were 89,000, 99,000, 90,000, 90,000, and 86,000 tons in this four-year period, with the same trend as that in the northern region of Taiwan; the corresponding regional emission rates were 31.8, 31.6, 31.6, and 31.9%. The emission rates in southern Taiwan were 88,000, 97,000, 87,000, and 85,000 tons in this four-year period, following the same trend as that in the northern and central regions. In southern Taiwan, the emission area accounted for 30.8–31.5% of the total area. East Taiwan only accounted for about 2.9%. The above results show that the regional distribution of NOx emissions is relatively even, and the variation between different years is relatively small. The foremost reason is that the main source of NOx emissions is diesel trucks, which travel across all of Taiwan. Additionally, compared to passenger vehicles, there is often long-distance cargo transportation between different cities, so the regional distribution of emissions is relatively even.
(3) HC emissions
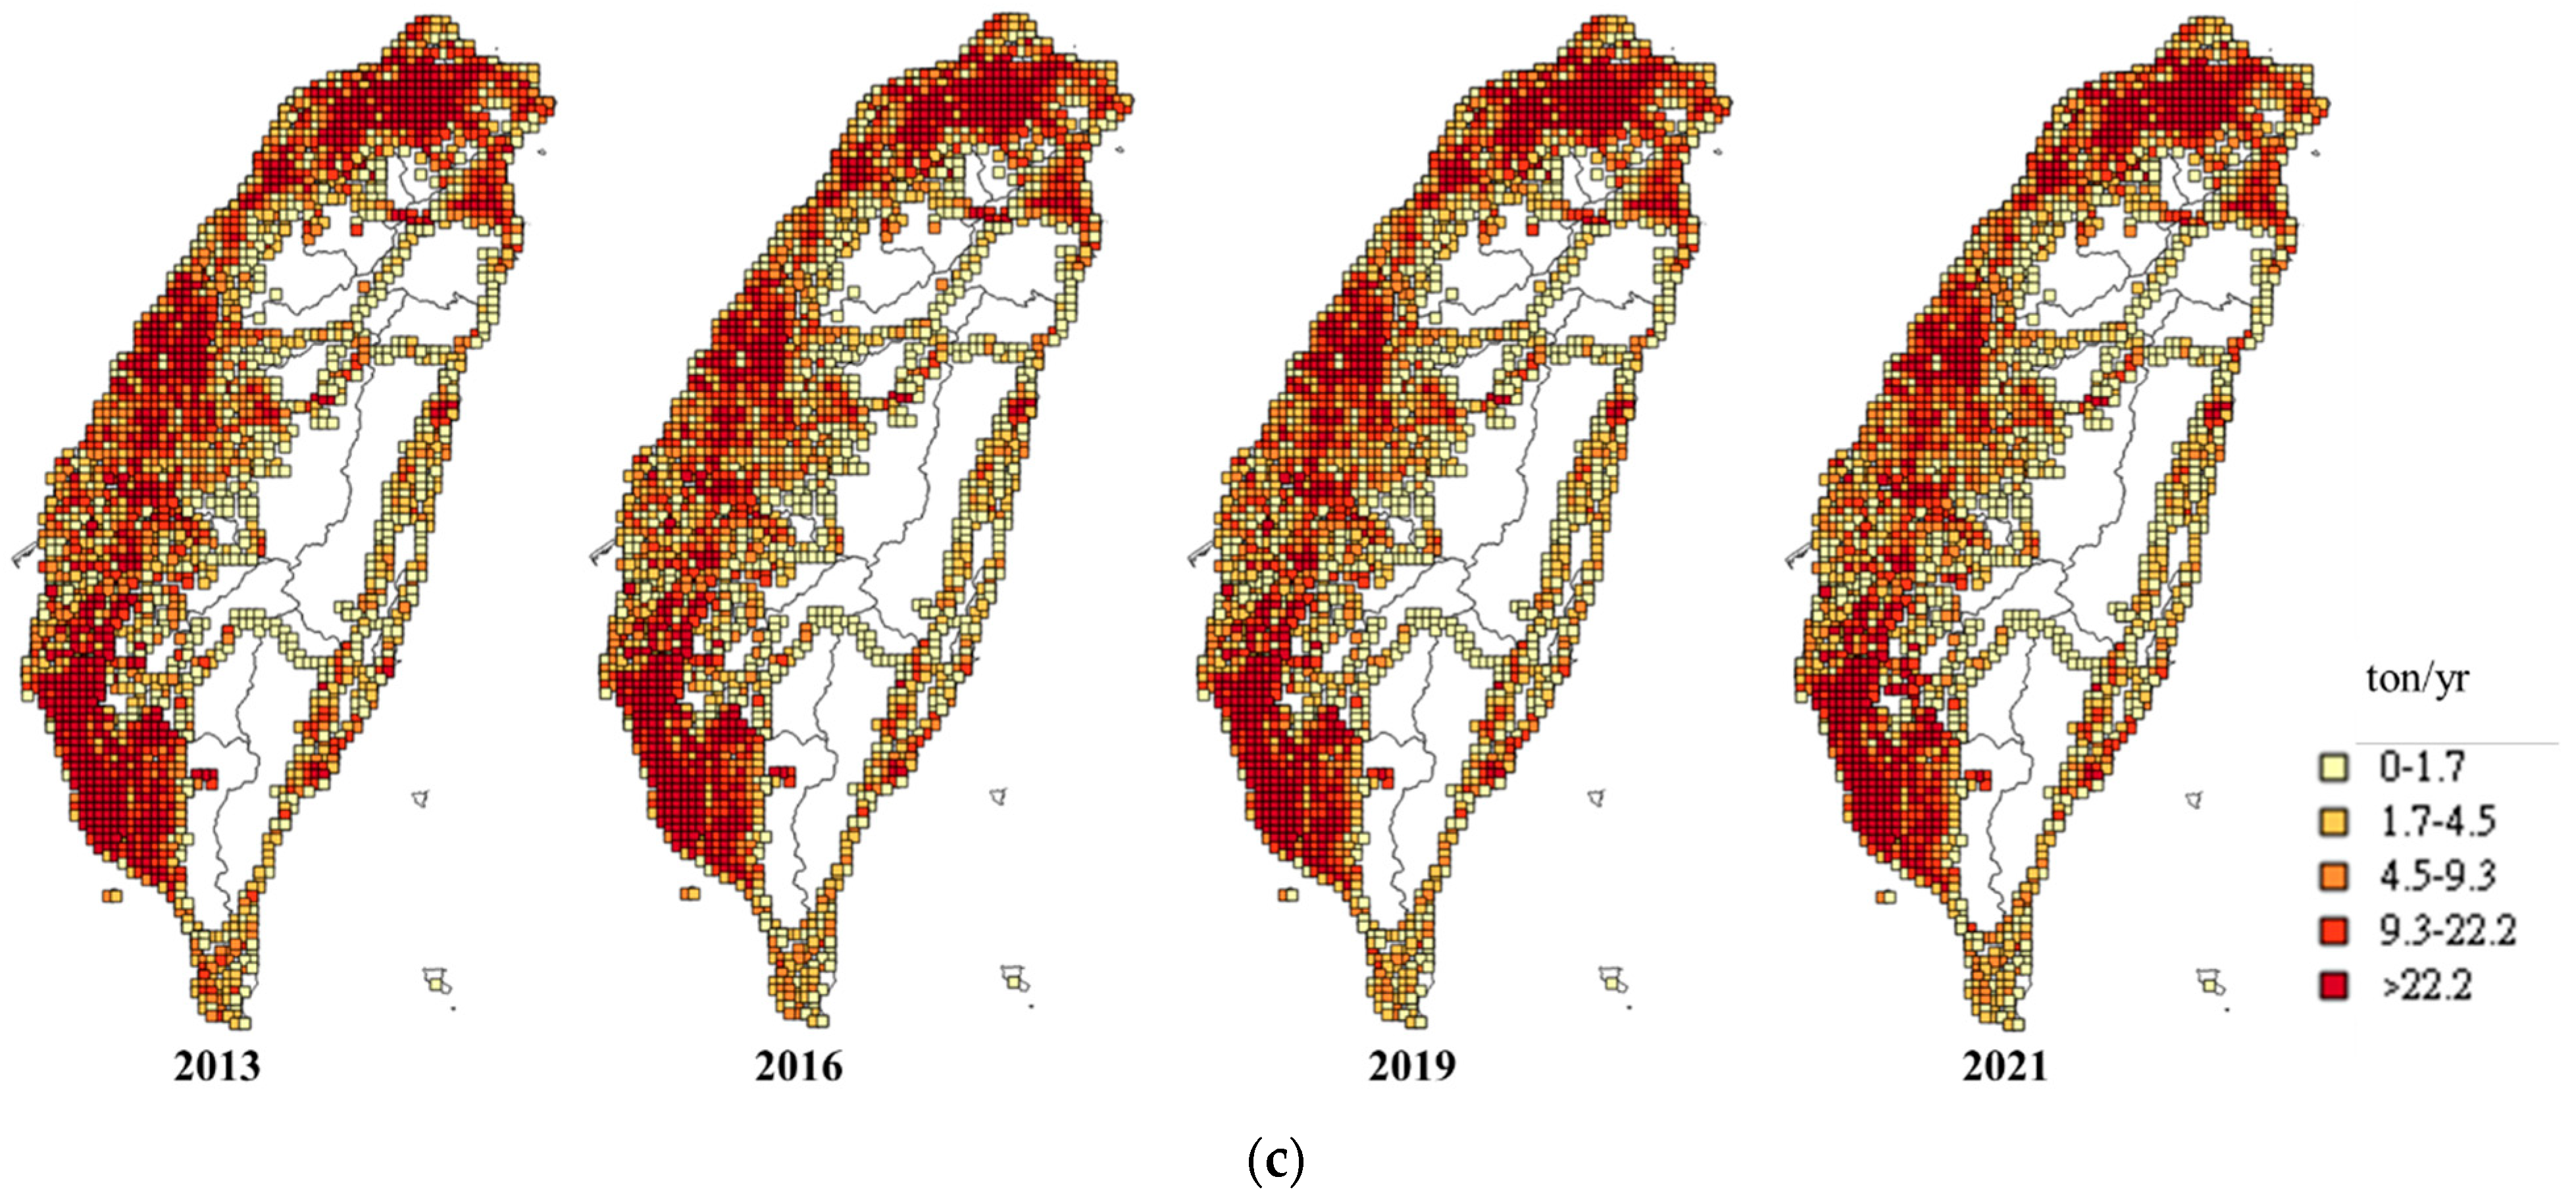
The spatial distribution of HC emissions in the years 2013, 2016, 2019, and 2021 was compared based on geographic regions of Taiwan (as shown in Figure 6c). The following comes from a study of the emissions by region: Northern Taiwan emitted 34,000, 31,000, 32,000, and 31,000 tons during the four-year period, and although the overall amount of emissions decreased and then increased, the regional portions were at 34.5, 35.7, 37.1, and 36.9%, showing an increasing trend. Emissions in the Southern Region were at 37.3, 35.6, 33.4, and 33.0%, and at only 2.6% for eastern Taiwan, with emissions of 37,000, 31,000, 29,000, and 28,000 tons over the four-year period. The above results show that the spatial distribution of HC emissions changed significantly over time, mainly due to the results of the activity intensity estimation. In 2016, and even 2019, motorcycle emissions gradually decreased due to the elimination of two-stroke motorcycles. In contrast, gasoline emissions gradually increased, resulting in a gradual decrease in the portion of emissions in southern Taiwan. However, this was still more than 30% as it was replaced by a gradual increase in the portion of emissions in the northern region. Population distribution and human activity contributed to this increase.

3.2. Hazardous Air Pollutant Emissions

Using the activity intensity and emission factors of road mobile sources calculated in Figure 7, we estimated the emissions of different hazardous air pollutants for the years 2013, 2016, 2019, and 2021. We also explored the year-to-year trends and differences in emissions between vehicle types to understand the main types of vehicles affected by hazardous air pollutant emissions in different years. In order to determine the trends for vehicle age composition in different years, we compared the emission percentages of different vehicle types. Finally, the emission levels of different regions in Taiwan were compared to understand the spatial distribution of the emission trends.
In the Multiple Air Toxics Exposure Study IV (MATES V) carried out by the Southern Coast Air Quality Management District (SCAQMD), results indicated that cancer risk mainly comes from diesel PM, carbonyl species (formaldehyde and acetaldehyde), benzene, and 1.3 butadiene [30]. Therefore, the identification of HAPs and determination of their abundance levels can be considered important work in urban areas.

3.2.1. Emission Estimation in the Period of 2013–2021

(1) Benzene
Motorcycles: The total benzene emissions from motorcycles were 1048, 571, 344, and 286 tons in the years 2013, 2016, 2019, and 2021, respectively, showing a significantly decreasing trend. Benzene emissions of two-stroke motorcycles were lower than those from four-stroke motorcycles by about 150 tons.
As shown in Figure 8a, four-stroke motorcycles with phase III, V, V, and V vehicles had the largest portion of emissions in the years 2013, 2016, 2019, and 2021, which indicates that while the emission factor decreases with the stringent emission standards, the overall intensity of new phase activities increases, resulting in a larger portion of the total benzene emissions.
Gasoline vehicles: The total benzene emissions from gasoline vehicles were 721, 721, 683, and 545 tons in the years 2013, 2016, 2019, and 2021, respectively, showing an overall decreasing trend.
The total benzene emissions from gasoline vehicles for the four-year period are illustrated in Figure 8a, which shows that the largest portion of emissions from gasoline passenger cars was from phase III vehicles in 2013, 2016, 2019, and 2021. This indicates that even though the activity intensity of phase III vehicles decreased in 2019 and 2021, the older phase III vehicles still had a larger emission factor, resulting in the largest portion of emissions in these four years. This shows that the emission factors of phase III vehicles are greater than those of phase V vehicles because the commercial gasoline passenger cars are mainly composed of newer vehicles. The emissions of phase V and VI vehicles were the largest fraction after 2016. The major emission periods for gasoline carsin this four-year period were phase II, phase III, phase III, and phase III for the four selected years.
Diesel vehicles: The total benzene emissions from diesel vehicles were 95, 119, 115, and 113 tons in the years 2013, 2016, 2019, and 2021, with an overall increasing trend followed by a decreasing trend in the four years.
The total emissions of diesel vehicles over the four-year period are shown in Figure 8b. The results show that the largest emissions from diesel passenger cars are mainly from old phase I and II vehicles, and similarly from light-duty diesel vehicles, diesel passenger cars, diesel buses, and buses.
(2) Formaldehyde
Motorcycles: The total amount of formaldehyde emissions from motorcycles was 100, 75, 59, and 51 tons in 2013, 2016, 2019, and 2021, showing an overall decreasing trend. After comparing emissions from different types of motorcycles, four-stroke motorcycles accounted for a higher percentage of emissions in these four years.
As shown in Figure 9a, four-stroke motorcycles had the largest portion of emissions in 2013, 2016, 2019, and 2021. The overall activity of phase V vehicles was sufficiently intense to cause the largest portion of formaldehyde emissions.
Gasoline vehicles: The total formaldehyde emissions from gasoline vehicles were 140, 139, 125, and 98 tons in the years 2013, 2016, 2019, and 2021, showing a decreasing trend.
As shown in Figure 9a, the largest percentage of formaldehyde emissions from gasoline passenger cars was from phase III vehicles in the years 2013, 2016, 2019, and 2021. In contrast, the emissions from phase V vehicles showed an increasing trend during this four-year period because of the increasing activity intensity. However, the emission phase composition of different gasoline vehicles is different. The business gasoline passenger cars were mainly phase III, phase V, phase V, and phase V vehicles, while the gasoline passenger cars were mainly of phase II, phase II, phase III, and phase III, showing the difference between different vehicle types.
Diesel vehicles: The total formaldehyde emissions from diesel vehicles were 645, 780, 729, and 712 tons in 2013, 2016, 2019, and 2021, respectively. The overall trend first wentup and then down; compared to gasoline vehicles, diesel vehicles emitted significantly more formaldehyde, and, similar to other pollutants, the largest emissions were still from diesel trucks used for personal purposes or for business.
As shown in Figure 9b, the older diesel trucks and the high portion of light-duty diesel vehicles had the larger formaldehyde emissions in the four-year period. Except for the older diesel trucks, the formaldehyde emission factors decreased significantly in the newer period, while the diesel passenger cars were mainly composed of older vehicles. The main emission factors for diesel passenger vehicles were mostly for phase III and phase IV vehicles.
(3) BaP
Motorcycles: The total BaP emissions of motorcycles were 33, 28, 25, and 23 kg in the years 2013, 2016, 2019, and 2021, showing an overall decreasing trend (Figure 10a). The results show that four-stroke motorcycles with phase V and VI vehicles had the highest emissions in 2013, 2016, 2019, and 2021. In the year 2021, the number of phase VI vehicles increased, which caused the emission percentage to reach 51%.
Gasoline vehicles: Total BaP emissions from gasoline vehicles were 191, 191, 169, and 140 kg per year in 2013, 2016, 2019, and 2021, respectively. When comparing the emissions from different gasoline vehicles, the main source of BaP emissions was the gasoline passenger car, followed by light-duty gasoline vehicles.
Results show that the largest BaP emissions were from gasoline passenger cars in the years 2013, 2016, 2019, and 2021, mainly because the emission factors of phase III vehicles were higher than those of phase IV to VI vehicles. Although the overall emissions of gasoline light buses and gasoline light trucks are not as high as those of gasoline light buses, the composition of the emission periods differs among different gasoline vehicles.
Diesel vehicles: Total BaP emissions from diesel vehicles were 390, 330, 248, and 189 kg in the years 2013, 2016, 2019, and 2021, showing an overall decreasing trend. Compared with gasoline vehicles, the BaP emissions of diesel vehicles were obviously higher, but the total emissions of diesel vehicles decreased from 63% in the year 2013 to 54% in the year 2021.
As shown in Figure 10b, the older diesel trucks had the larger emissions in the four-year period; the commercial diesel trucks account for 98% of the emissions from phase Ito phase III, and the light-duty diesel vehicles account for the largest emissions in phase II. In addition to the older diesel trucks, the main reason is that the BaP emission factor dropped significantly in the newer phase, while diesel passenger vehicles are mainly phase II and phase III vehicles.

3.2.2. Spatial Distribution Characteristics of Emissions

(1) Benzene
The spatial distribution of benzene emissions in the years 2013, 2016, 2019, and 2021 was compared based on geographic regions of Taiwan (as shown in Figure 11a). The overall emissions of the northern region of Taiwan were 651, 503, 419, and 341 tons in four years, and the regional portion was 34.9, 35.6, 36.7, and 36.1%, showing an increasing trend. The emissions of the central region were 492, 382, 319, and 265 tons in four years, and the trend was the same as that of the northern region. Emissions from southern Taiwan were 671, 485, 368, and 309 tons during the four-year period, with a decreasing trend and an emission area portion of 36.0, 34.4, 32.2, and 32.7%;in contrast, eastern Taiwan accounted for only about 2.9%. The above results show that the spatial distribution of benzene emissions changed significantly with time, similar to the spatial distribution of HC emissions. Motorcycles had the largest portion of benzene emissions in 2002, and the southern region had a larger portion of motorcycle activity intensity, resulting in the larger regional distribution of benzene emissions in that year. The portion of benzene emissions gradually declined after 2016 due to the phase-out of two-stroke motorcycles. Meanwhile, gasoline vehicle emissions gradually increased, resulting in a higher portion of emissions in southern Taiwan, although the portion of emissions in the southern region was still over 30%.
(2) Formaldehyde
The spatial distribution of formaldehyde emissions in the years 2013, 2016, 2019, and 2021 were compared based on the geographic regions of Taiwan (as shown in Figure 11b). The results showed that the highest percentage of formaldehyde emissions in the four-year period was in the southern region. In northern Taiwan, the emissions were 280, 313, 281, and 327 tons during the four-year period, although the overall emissions rose and then fell, with regional percentages of 31.7, 31.4, 30.7, and 30.4%. In central Taiwan, the emissions were 249, 281, 262, and 246 metric tons during the four-year period, showing the same trend as that in the northern region of Taiwan, and with regional percentages of 28.2, 28.3, 28.7, and 28.6%. In southern Taiwan, the emissions were 32.7, 28.3, 28.7, and 28.6%. Emissions in the southern region were 327, 368, 339, and 327 tons in the four-year period, following the same trend as that in the northern and central areas, and the portion of the emission area was at 36.9, 37.0, 37.2, and 38.0%, while the eastern region only accounted for about 3.4%. The above results show that the regional distribution of formaldehyde emissions is higher in the southern region, and the variation between different years is relatively small. This is mainly because the main source of formaldehyde emissions is diesel trucks, whose driving range covers the whole of Taiwan. NOx is slightly larger than the emissions of self-use diesel trucks, formaldehyde is slightly larger in self-use diesel trucks, and the activity intensity of self-use diesel trucks in the southern region is 1.37 times of that in the northern region. The formaldehyde emissions are mainly in the southern region because the activity intensity of the southern region is higher than that of the northern region.
(3) BaP
The spatial distribution of BaP emissions in the years 2013, 2016, 2019, and 2021 was compared based on the geographic regions of Taiwan (as shown in Figure 11c). Results showed that the highest percentage of BaP emissions in the four-year period was in the southern region. In the northern region, the emission rates were 203, 183, 146, 115 kg, with regional percentages of 33.0, 33.3, 32.9, and 32.5%. In central Taiwan, the emission rates were 172, 153, 126, and 102 kg, with regional percentages of 28.0, 27.9, 28.6, and 29.0%. In the southern area, the emission rates were 220, 195, 155, and 126 kg and the regional percentages were 35.8, 35.5, 35.2, and 35.5% in the four years; in contrast, eastern Taiwan only accounted for 3.2%. The above results show a decreasing trend for BaP emissions in different regions, mainly because the main source of BaP emissions is diesel vehicles. Furthermore, with the significant decrease in the emission factors of new vehicles, the emissions in each region gradually decreased.

4. Conclusions

The total annual mileage of gasoline cars was the highest due to the high number of vehicles, followed by four-stroke motorcycles > light-duty diesel vehicles > heavy-duty diesel vehicles > diesel passenger cars >light-duty gasoline vehicles > commercial gasoline passenger cars> two-stroke motorcycles> diesel bus >public passenger transport bus > special vehicles. Our results showed that the stringent emission standards have the effect of reducing the HC exhaust emissions of gasoline and diesel vehicles.
The results also showed that the benzene emission factors had the following sequence: motorcycle > gasoline ≥ diesel; and the formaldehyde emission factors were in the following order: diesel > motorcycle ≥ gasoline. Diesel vehicles had the largest (92.8%) PM2.5 emissions for mobile sources. Most hydrocarbon emissions were from motorcycles, followed by gasoline and diesel vehicles. Benzene was mainly emitted by gasoline vehicles, and formaldehyde emissions were from diesel vehicles. BaP emissions had the following sequence: diesel vehicles, gasoline vehicles, and motorcycles. Vehicle population and emissions are dominant in western Taiwan, and motor vehicles had the highest concentration in the northern, central, and southern regions, which also reflects the human pollution distribution in Taiwan. Based on the emissions of motor vehicles, the stringent emission standards and the retirement of older vehicles can be more effective in the reduction of airborne pollutant emissions. In urban areas, the mobile emission is relatively important; therefore, the cleaner vehicles application can reduce the airborne pollutant emissions and eliminate the exposure and health risk.

Author Contributions

Conceptualization, J.-H.T. and H.-L.C.; methodology, J.-Y.C. and H.-L.C.; formal analysis, J.-Y.C. and H.-L.C.; data curation, J.-Y.C. and J.-H.T.; writing—original draft preparation, J.-H.T. and H.-L.C.; writing—review and editing, H.-L.C., and J.-H.T.; project administration, J.-H.T. and H.-L.C.; funding acquisition, J.-H.T. All authors have read and agreed to the published version of the manuscript.

Funding

The authors express their sincere thanks to the National Science and Technology Council, Taiwan (MOST -107-2221-E-006-005-MY3, 107-2221-E-006-006-MY3 and 104-2221-E-006-020-MY3) for the support.

Institutional Review Board Statement

Not applicable.

Informed Consent Statement

Not applicable.

Data Availability Statement

Not applicable.

Conflicts of Interest

The authors declare no conflict of interest.

References

  1. World Health Organization (WHO). Health Risks of Air Pollution in Europe—HRAPIE Project; World Health Organization (WHO): Copenhagen, Denmark, 2013. [Google Scholar]
  2. WHO Regional Office for Europe; OECD. Economic Cost of the Health Impact of Air Pollution in Europe: Clean Air, Health and Wealth; WHO Regional Office for Europe: Copenhagen, Denmark, 2015. [Google Scholar]
  3. Garcia-Gonzales, D.A.; Shamasunder, B.; Jerrett, M. Distance decay gradients in hazardous air pollution concentrations around oil and natural gas facilities in the city of Los Angeles: A pilot study. Environ. Res. 2019, 173, 232–236. [Google Scholar] [CrossRef] [PubMed]
  4. Shah, R.U.; Coggon, M.M.; Gkatzelis, G.I.; McDonald, B.C.; Tasoglou, A.; Huber, H.; Gilman, J.; Warneke, C.; Robinson, A.L.; Presto, A.A. Urban oxidation flow reactor measurements reveal significant secondary organic aerosol contributions from volatile emissions of emerging importance. Environ. Sci. Technol. 2020, 54, 714–725. [Google Scholar] [CrossRef] [PubMed]
  5. Mohamed, M.F.; Kang, D.; Aneja, V.P. Volatile organic compounds in some urban locations in United States. Chemosphere 2002, 47, 863–882. [Google Scholar] [CrossRef] [PubMed]
  6. Huang, C.; Tao, S.; Lou, S.; Hu, Q.; Wang, H.; Wang, Q.; Li, L.; Wang, H.; Liu, J.; Quan, Y.; et al. Evaluation of emission factors for light-duty gasoline vehicles based on chassis dynamometer and tunnel studies in Shanghai, China. Atmos. Environ. 2017, 169, 193–203. [Google Scholar] [CrossRef]
  7. Oanh, N.T.K.; Thiansathit, W.; Bond, T.C.; Subramanian, R.; Winijkul, E.; Paw-armart, I. Compositional characterization of PM2.5 emitted from in-use diesel vehicles. Atmos. Environ. 2010, 44, 15–22. [Google Scholar] [CrossRef]
  8. Chiang, H.L.; Lai, Y.M.; Chang, S.Y. Pollutant constituents of exhaust emitted from light-duty diesel vehicles. Atmos. Environ. 2012, 47, 399–406. [Google Scholar] [CrossRef]
  9. Kim, J.; Choi, K.; Myung, C.L.; Lee, Y.; Park, S. Comparative investigation of regulated emissions and nano-particle characteristics of light duty vehicles using various fuels for the FTP-75 and the NEDC mode. Fuel 2013, 106, 335–343. [Google Scholar] [CrossRef]
  10. Trinh, H.T.; Imanishi, K.; Morikawa, T.; Hagino, H.; Takenaka, N. Gaseous nitrous acid (HONO) and nitrogen oxides (NOx) emission from gasoline and diesel vehicles under real-world driving test cycles. J. Air Waste Manag. Assoc. 2017, 67, 412–420. [Google Scholar] [CrossRef] [PubMed]
  11. Huang, C.; Lou, D.; Hu, Z.; Feng, Q.; Chen, Y.; Chen, C.; Tan, P.; Yao, D. A PEMS study of the emissions of gaseous pollutants and ultrafine particles from gasoline-and diesel-fueled vehicles. Atmos. Environ. 2013, 77, 703–710. [Google Scholar] [CrossRef]
  12. Clairotte, M.; Adam, T.W.; Chirico, R.; Giechaskiel, B.; Manfredi, U.; Elsasser, M.; Sklorz, M.; DeCarlo, P.F.; Heringa, M.F.; Zimmermann, R.; et al. Online characterization of regulated and unregulated gaseous and particulate exhaust emissions from two-stroke mopeds: A chemometric approach. Anal. Chim. Acta 2012, 717, 28–38. [Google Scholar] [CrossRef] [PubMed]
  13. Zhang, Q.; Fan, J.; Yang, W.; Ying, F.; Bao, Z.; Sheng, Y.; Lin, C.; Chen, X. Influences of accumulated mileage and technological changes on emissions of regulated pollutants from gasoline passenger vehicles. J. Environ. Sci. 2018, 71, 197–206. [Google Scholar] [CrossRef] [PubMed]
  14. Yang, H.H.; Dhital, N.B.; Wang, L.C.; Hsieh, Y.S.; Lee, K.T.; Hsu, Y.T.; Huang, S.C. Chemical characterization of fine particulate matter in gasoline and diesel vehicle exhaust. Aerosol Air Qual. Res. 2019, 19, 1349–1449. [Google Scholar] [CrossRef]
  15. Kimbrough, S.; Palma, T.; Baldauf, R.W. Analysis of Mobile Source Air Toxics (MSATS—Near-Road VOC and CarbonylConcentrations. In Proceedings of the 2015 CRC Mobile Source Air Toxics (MSAT) Workshop, San Diego, CA, USA, 17–19 February 2015. [Google Scholar]
  16. IARC. Some non-heterocyclic polycyclic aromatic hydrocarbons and some related exposures. In IARC Monographs on the Evaluation of Carcinogenic Risks to Humans; IARC: Lyon, France, 2010; Volume 92, pp. 1–853. [Google Scholar]
  17. Heeb, N.V.; Forss, A.M.; Weilenmann, M. Pre-and post-catalyst-, fuel-, velocity-and acceleration-dependent benzene emission data of gasoline-driven EURO-2 passenger cars and light duty vehicles. Atmos. Environ. 2002, 36, 4745–4756. [Google Scholar] [CrossRef]
  18. Tsai, J.H.; Huang, P.H.; Chiang, H.L. Characteristics of volatile organic compounds from motorcycle exhaust emission during real-world driving. Atmos. Environ. 2014, 99, 215–226. [Google Scholar] [CrossRef]
  19. Sawant, A.A.; Shah, S.D.; Zhu, X.; Miller, J.W.; Cocker, D.R. Real-world emissions of carbonyl compounds from in-use heavy-duty diesel trucks and diesel Back-Up Generators (BUGs). Atmos. Environ. 2007, 41, 4535–4547. [Google Scholar] [CrossRef]
  20. Peng, C.Y.; Yang, H.H.; Lan, C.H.; Chien, S.M. Effects of the biodiesel blend fuel on aldehyde emissions from diesel engine exhaust. Atmos. Environ. 2008, 42, 906–915. [Google Scholar] [CrossRef]
  21. Yang, H.H.; Hsieh, L.T.; Liu, H.C.; Mi, H.H. Polycyclic aromatic hydrocarbon emissions from motorcycles. Atmos. Environ. 2005, 39, 17–25. [Google Scholar] [CrossRef]
  22. Zheng, X.; Wu, Y.; Zhang, S.; Hu, J.; Zhang, K.M.; Li, Z.; He, L.; Hao, J. Characterizing particulate polycyclic aromatic hydrocarbon emissions from diesel vehicles using a portable emissions measurement system. Sci. Rep. 2017, 7, 10058. [Google Scholar] [CrossRef]
  23. EPA-420-B-10–036; Motor Vehicle Emissions Simulator (MOVES). User Guide for MOVES2010a. Assessment and Standards Division, Office of Transportation and Air Quality, U.S. Environmental Protection Agency: Washington, DC, USA, 2010.
  24. Fujita, E.M.; Campbell, D.E.; Zielinska, B.; Chow, J.C.; Lindhjem, C.E.; DenBleyker, A.; Bishop, G.A.; Schuchmann, B.G.; Stedman, D.H.; Lawson, D.R. Comparison of the MOVES2010a, MOBILE6.2, and EMFAC2007 mobile source emission models with on-road traffic tunnel and remote sensing measurements. J. Air Waste Manag. Assoc. 2012, 62, 1134–1149. [Google Scholar] [CrossRef]
  25. Tsai, J.H.; Yao, Y.C.; Huang, P.H.; Chiang, H.L. Fuel economy and volatile organic compound exhaust emission for motorcycles with various running mileages. Aerosol Air Qual. Res. 2018, 18, 3056–3067. [Google Scholar] [CrossRef]
  26. Taiwan Environmental Protection Administration (TEPA). Handbook of Taiwan emission data system (in Chinese); TEPA: Taipei, Taiwan.
  27. Borken-Kleefeld, J.; Ntziachristos, L. The Potential for Further Controls of Emissions from Mobile Sources in Europe. Service Contract on Monitoring and Assessment of Sectorial Implementation Actions (ENV.C.3/SER/2011/0009) of DG—Environment of the European Commission. 2012. Available online: http://gains.iiasa.ac.at/TSAP (accessed on 22 December 2022).
  28. European Environmental Agency (EEA). Air Quality in Europe 2022—Health Impacts of Air Pollution in Europe, 2022. 2023. Available online: https://www.eea.europa.eu/publications/air-quality-in-europe-2022/health-impacts-of-air-pollution (accessed on 8 May 2023).
  29. European Environmental Agency (EEA). Air Quality in Europe 2022—Sources and Emissions of Air Pollutants in Europe. 2023. Available online: https://www.eea.europa.eu/publications/air-quality-in-europe-2022/sources-and-emissions-of-air (accessed on 8 May 2023).
  30. Southern Coast Air Quality Management District (SCAQMD). Multiple Air Toxics Exposure Study V (MATES V); Final Report; Southern Coast Air Quality Management District (SCAQMD): Diamond Bar, CA, USA, 2021. [Google Scholar]
Figure 1. Determination of emission factor for mobile sources.
Atmosphere 14 00916 g001
Figure 2. PM2.5, NOx, and HC emissions from mobile sources in the period of 2013–2021.
Atmosphere 14 00916 g002
Figure 3. (a) PM2.5 emissions from gasoline vehicles in the period of 2013–2021. (the arrow is pointed to the figure of partial enlargement). (b) PM2.5 emissions from diesel vehicles in the period of 2013–2021.
Atmosphere 14 00916 g003
Figure 4. (a) NOx emissions from gasoline vehicles in the period of 2013–2021. (the arrow is pointed to the figure of partial enlargement). (b) NOx emissions from diesel vehicles in the period of 2013–2021. (the arrow is pointed to the figure of partial enlargement).
Atmosphere 14 00916 g004
Figure 5. (a) Hydrocarbon (HC) emissions from gasoline vehicles in the period of 2013–2021. (the arrow is pointed to the figure of partial enlargement). (b) Hydrocarbon (HC) emissions from diesel vehicles in the period of 2013–2021. (the arrow is pointed to the figure of partial enlargement).
Atmosphere 14 00916 g005
Figure 6. (a) Spatial distribution of PM2.5 emissions from mobile vehicles in the period of 2013–2021. (b) Spatial distribution of NOx emissions from mobile vehicles in the period of 2013–2021. (c) Spatial distribution of HC emissions from mobile vehicles in the period of 2013–2021.
Atmosphere 14 00916 g006aAtmosphere 14 00916 g006b
Figure 7. BaP, benzene, and formaldehyde emissions from mobile sources in the period of 2013–2021.
Atmosphere 14 00916 g007
Figure 8. (a) Benzene emissions from gasoline vehicles in the period of 2013–2021. (the arrow is pointed to the figure of partial enlargement). (b) Benzene emissions from diesel vehicles in the period of 2013–2021. (the arrow is pointed to the figure of partial enlargement).
Atmosphere 14 00916 g008
Figure 9. (a) Formaldehyde emissions from gasoline vehicles in the period of2013–2021. (the arrow is pointed to the figure of partial enlargement). (b) Formaldehyde emissions from diesel vehicles in the period of 2013–2021. (the arrow is pointed to the figure of partial enlargement).
Atmosphere 14 00916 g009
Figure 10. (a) BaP emissions from gasoline vehicles in the period of 2013–2021. (the arrow is pointed to the figure of partial enlargement). (b) BaP emissions from diesel vehicles in the period of 2013–2021. (the arrow is pointed to the figure of partial enlargement).
Atmosphere 14 00916 g010
Figure 11. (a) Spatial distribution of benzene emissions from mobile vehicles in the period of 2013–2021. (b) Spatial distribution of formaldehyde emissions from mobile vehicles in the period of 2013–2021. (c) Spatial distribution of BaP emissions from mobile vehicles in the period of 2013–2021.
Atmosphere 14 00916 g011
Table 1. Number of different motor vehicle fleets in the period of 2013–2021 in Taiwan.
YearPassenger CarLight-Duty VehicleBusDiesel Heavy-Duty TruckMotorcycleSpecially Constructed Vehicle
Self-UseBusinessDieselElectricalGasolineDieselDieselBusElectricSelf-UseBusinessMotorcycleElectricGasolineDiesel
20135903 *1771560.457829817150.08927014,157383130
201460381841840.458730317150.12947013,694423131
201561711892130.559530918150.13957113,610523132
201662351912390.559831319150.21967113,596723133
201763031972603.560231818160.26977013,6421143134
2018636220327110.460232418160.46966913,6411953134
2019640420227736.660333117150.47967013,6333603135
2020643119528078.560134017150.56977113,6484563136
20216445188282144.460035016150.74977313,6435443137
Note: * numerical value × 103.
Disclaimer/Publisher’s Note: The statements, opinions and data contained in all publications are solely those of the individual author(s) and contributor(s) and not of MDPI and/or the editor(s). MDPI and/or the editor(s) disclaim responsibility for any injury to people or property resulting from any ideas, methods, instructions or products referred to in the content.