Abstract
Excessive accumulation of reactive oxygen species (ROS) in the body can lead to a redox imbalance and result in cellular and tissue damage. Since ROS are highly reactive, traditional offline methods may underestimate their true concentration. In this study, we developed an online monitoring system for particle-bound ROS based on the fluorescent probe 2′,7′-dichlorofluorescin (DCFH), which consists of an Aerosol Collector and a Fluorescence Detector. The performance of the system was evaluated in terms of collection efficiency, instrument calibration, and comparison with offline methods. The results demonstrate that the collection efficiency of the system is over 93%, the calibration correlation coefficient (R2) is 99.75%, and the online system reduces ROS loss due to offline methods by more than 60%. The system has a temporal resolution of 20 min and the limit of detection of the system was 1.9 nmol H2O2/m3. Field observations revealed that particle-bound ROS exhibited similar diurnal variations to O3, and photochemical reactions were the main factors affecting its diurnal variation.
1. Introduction
The World Health Organization (WHO) has identified ambient particulate air pollution as the most severe public health issue [1,2]. Although it is not well understood which particle source and chemical composition are primarily responsible for their adverse health effects, particle-bound ROS contribute to particle oxidation potential (OP), which is regarded as the key to understanding the mechanism underlying adverse health effects of particle exposure [3]. Oxidative stress occurs when the concentration of ROS exceeds the body’s antioxidant capacity [4,5], which may trigger or exacerbate inflammation in the respiratory tract and cardiovascular systems, resulting in cell damage and even genetic changes by oxidizing DNA molecules [6,7].
ROS refer to oxygen-containing species with one or more unpaired electrons, including hydrogen peroxide (H2O2), singlet oxygen (1O2), superoxide anions (O2−), and hydroxyl radical (•OH) [8,9]. Because of the highly complicated composition and multiple sources of atmospheric aerosol, there is no clear conclusion on the generation mechanism of ROS [10]. Polycyclic aromatic hydrocarbons, humus-like substances, metals, and quinoid chemicals have been determined to contribute to the formation of ROS [11,12,13,14,15]. Identifying the source of ROS emissions might help in the development of air quality control strategies. Many studies have demonstrated that vehicle exhaust is a key source of particle-bound ROS, and vehicle abrasion, brake, and tire wear tracers have been linked to higher OP [16,17,18]. The relationship between biomass burning and particle-bound ROS is unclear. Some research suggested that biomass burning did not significantly contribute to ROS, while others reported that biomass burning contributed significantly to ROS [18,19,20]. Road dust, dust storms, and soil dust have been found to contribute to the formation of ROS in PM10 and PM2.5 [21,22,23,24]. Many studies have looked into the correlation between particle size and ROS activity, finding that the OP decreases with increasing particle size [15,25,26].
ROS in the atmosphere can be present in both gas and particulate phases [27]. In general, the majority of gas-phase ROS have high water solubility and can be absorbed by mucus in the upper respiratory system [8,28]. By contrast, particle-bound ROS can penetrate deep into the lung [29]. Thus, particle-bound ROS are generally considered to be more harmful to human health than gas-phase ROS [30,31]. ROS can exist within the particle itself or be generated in vivo conditions by inhaled particle contents chemically reacting with fluids and cells in the body [3]. Measurements of particle-bound ROS, which detect ROS that exist within particles, often report values in units of concentration. OP measuring approaches use time rate-of-change in mass-based concentration to quantify the catalytic production of ROS under simulated biological conditions. Both methods can provide information on the capacity of PM species to induce catalytic redox reactions in the body, which is thought to result in adverse health impacts.
Chemical and biological assays, such as electron spin resonance (ESR), ascorbic acid assay (AA), dithiothreitol assay (DTT), and 2′,7′-dichlorofluorescin (DCFH), have been widely used to determine ROS [32,33,34,35]. The DCFH assay is one of the most popular methods for measuring ROS because it can detect the majority of ROS [36], whereas other probes are only sensitive to specific types of ROS, such as scopoletin to H2O2 and sodium terephthalate to •OH [10,37,38]. Traditional measurement methods for ROS analysis are based on offline techniques by collecting particles on filters, followed by solvent extraction and chemical analysis, and it usually takes hours to days from sample collection to analysis [39,40,41]. Such offline methods have some disadvantages such as a long time for sampling and the analysis procedures being labor-intensive and the resulting poor temporal resolution of the data [42,43,44,45]. ROS are not stable and this time-consuming offline may lead to significant underestimates of ROS concentrations due to the loss of short-living ROS [39].
To address the issues of offline analysis, several studies have developed online instruments for ROS analysis [39,42,46,47]. One of the most commonly used methods for online ROS detection is based on the fluorescent probe DCFH, which is non-specific for ROS [10,42,46,48]. Venkatachari and Hopke developed an automated system based on the DCFH assay in 2008 and several researchers developed new online instruments that adapted this approach [39,42,48]. King and Weber also use the probe DCFH to develop an online, semi-continuous instrument to measure particle-bound ROS by the difference between the total ROS and gas phase ROS [29]. Another online instrument using DCFH assay is the Gas and Aerosol Collector (GAC-ROS) system developed by Huang et al. [10]. Other online instruments for ROS analysis are based on DTT assay [49] and a new probe called BPEAnit [50]. Overall, the online system provides fast and reliable results, reduces labor and hands-on time, and minimizes ROS loss [46].
In this work, we developed an online ROS analyzer system with highly sensitive. The collection efficiency of the instrument was tested and measurement accuracy was evaluated. Field observations were conducted in Shanghai to test the performance of the system and results were compared with off-line measurements.
2. Experimental Section for System Setup
2.1. Primary Materials and Reagent Preparation
The reagents used in this study include DCFH-DA (97%, stored at −20 °C), horseradish peroxidase (HRP) (stored at 2–8 °C), hydrogen peroxide (30%), sodium hydroxide (99.99%), disodium hydrogen phosphate (HPLC-grade), potassium dihydrogen phosphate (HPLC-grade), and ethanol (HPLC-grade). According to a previous study [8], DCFH-DA was dissolved in ethanol and mixed with NaOH solution in a darkroom at room temperature to generate an unstable DCFH solution. After 30 min, dilute the DCFH solution with phosphate buffer (pH = 7.4) and bring the pH of the solution to about 7.2 at 50 µM. The solution needs to be stored at 4 °C in the dark until use. HRP was dissolved in phosphate buffer resulting in 5 units HRP mL−1 and stored at 4 °C until use.
2.2. Online System Development
2.2.1. Aerosol Collector
The schematic diagram of the particle-bound ROS online monitoring system is shown in Figure 1. The Aerosol Collector’s primary parts are an aerosol growth chamber and an aerosol cyclone collector. After passing through a PM2.5 cutter at a flow rate of 16.7 L/min, airflow is fed into a growth chamber that was tightly wound with a condenser pipe to keep the chamber wall temperature at around 20 °C. The particles meet with water vapor at the chamber’s inlet, becoming supersaturated and growing into droplets. These droplets were then pumped into a cyclone collector, where they rapidly flow along the inner wall, producing a circular vortex of approximately 0.1 mL. The cyclone collector was designed by Douglas et al. and tested as an effective aerosol collector, with collection efficiencies exceeding 97% [50,51]. The cyclone collector, as one of the core components of the collection system, offers a relatively inexpensive and efficient sampling method compared to other techniques. Deionized water was added to the top of the cyclone using the peristaltic pump at a flow rate of 1.4 mL/min and the collected aerosol samples solution are transported to the fluorescence detector through the bottom of the cyclone collector by a peristaltic pump. A detailed description of the cyclone collector is shown in Figure S1. There is an electromagnetic three-way valve between the collector and the cutter. By switching the direction of the three-way valve every 10 min, the airflow enters the three-way magnetic valve, which either conveys it one way for total ROS (ROSt) measurement or the other way through a filter for gaseous ROS (ROSg) detection. In some studies, a denuder has been used to remove gaseous ROS and detect particle-bound ROS. However, traditional denuders are often ineffective in removing gaseous ROS with a maximum removal efficiency of 57% [29]. In this study, we detect particle-bound ROS by the difference between ROSt and ROSg which enables a more accurate measurement of particle-bound ROS. The measurement frequency for ROSt and ROSg is once every 10 min, so the time resolution for measurements of particle-bound ROS is 20 min.

Figure 1.
Diagram of the particle-bound ROS online monitoring system structure.
2.2.2. Fluorescence Detector
The Fluorescence Detector is mainly made up of a spectrometer (Ocean Optics), a 480 nm laser (Thorlabs), and a sample chamber. The peristaltic pump transfers the collected aerosol sample in an aqueous solution to the sample chamber at a rate of 0.8 mL/min. The DCFH and HRP are pumped to the flow cell (volume of 0.25 mL) in the sample chamber by the peristaltic pump at a rate of 0.1 mL/min. DCFH reacts with ROS to generate DCF. DCF is excited to release fluorescence under the irradiation of a 480 nm light source, and the generated fluorescence signal can be detected at 530 nm wavelength. The concentration of ROS participating in the reaction is proportional to the intensity of the generated fluorescent signal. As shown in Figure 1, the 480 nm laser is directed vertically into the sample chamber, and a baffle is put between the sample chamber and the laser. According to research [52], continuous light irradiation of the solution can generate ROS, therefore the laser beam must be blocked by a baffle when not detecting fluorescent signal. The results of the impact of light on measurement are shown in Figure S2. A detailed description of the Fluorescence Detector is shown in Figure S3.
To allow the ROS and the probe DCFH to fully react and maximize the analysis efficiency, it is necessary to investigate the optimal reaction time. To investigate the reaction time, a hydrogen peroxide solution with a concentration of 3 × 10⁻⁷ mol/L was used to react with the DCFH-HRP solution. As shown in Figure 2, the fluorescence intensity increases rapidly at the start of the reaction and began to slow down at the sixth minute, which indicated that the reaction was nearly completed. Considering that the aerosol in atmosphere is more complicated than those in the laboratory, and the complex external environment may prolong the reaction time, it is reasonable to control the reaction time to 8 min after comprehensive consideration.
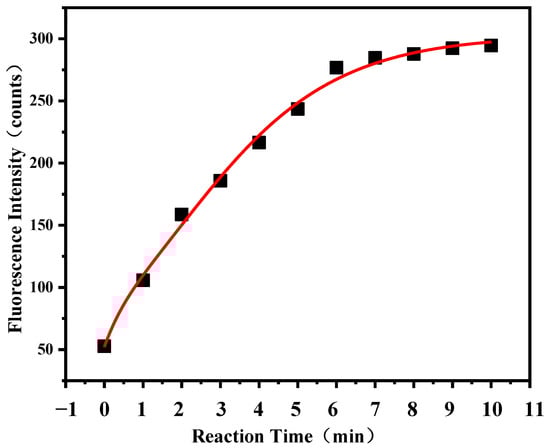
Figure 2.
The relationship between fluorescence intensity and reaction time.
2.2.3. Calculation of Particle-Bound ROS Concentration
The formula for calculating ROS is as follows:
where I is the intensity of the fluorescence signal (counts), Vliquid is the liquid flow rate into the fluorescence detector (mL/min), Vair is the airflow rate through the aerosol growth chamber (L/min), K is the slope of the standard curve, b is the intercept of the standard curve, CROSt is the total reactive oxygen concentration, and CROSg is the gaseous reactive oxygen concentration after removal of the particulate reactive oxygen. The final calculated ROS are expressed in H2O2 in nmol H2O2/m3.
CROSp = CROSt − CROSg
3. Results and Discussion
3.1. Collection Efficiency
To determine the collection efficiency of the system, aerosol particles were generated by using an atomizer (TSI) to atomize the ammonium sulfate solution in concentrations ranging from 0.4 to 0.7 mM. After drying the aerosol particles using a Nafion tube, the particle mass concentration was determined through ion chromatography (IC), while the particle number distribution was obtained by using a scanning mobility particle spectrometer (SMPS) consisting of a Differential Mobility Analyzer (DMA, TSI) and a Condensation Particle Counter (CPC, TSI), and then the two sets of data were compared [53]. The aerosol particles were assumed to be dry and approximately spherical, enabling an estimate of their volume and calculation of their mass [53].
The results of collection efficiency are shown in Table 1. It can be observed that the system has excellent collection efficiency, greater than 93%, regardless of the concentration of ammonium sulfate solutions used. These results indicate that the majority of the aerosol particles entering the system can be collected in solution and the Aerosol Collector used in the online system exhibits excellent performance.

Table 1.
Relationship between Concentration of (NH4)2SO4 Solution and Collection Efficiency.
3.2. Calibration of the Detection System
H2O2 solutions with concentrations ranging from 100 to 700 nM were used to build the calibration curve and quantify ROS concentration. The standard H2O2 solutions were mixed with DCFH and HRP solutions for about 8–10 min before the detector measured the fluorescence intensity of the reaction mixtures. Previous research has shown that colored dissolved organic matter can react with oxygen molecules to generate ROS in the presence of dissolved oxygen [54]. To avoid the effect of DCFH auto-oxidation, blank measurements were carried out using deoxygenated pure water. According to the results shown in Figure 3, the regression coefficient (R2) of the linear curve is 0.9975, suggesting this system could accurately measure the ROS of the solution when the concentration of the ROS is between 100 and 700 nM H2O2.
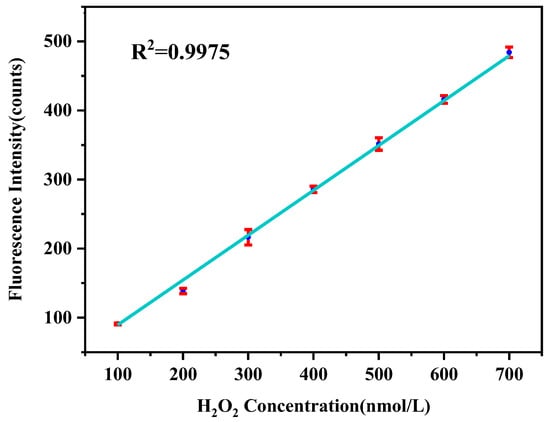
Figure 3.
Calibration of the detection system with standard H2O2 solutions.
The limit of detection (LOD) was determined by assessing the stability of the signal over a prolonged period of continuous exposure. The LOD of the online system was determined as three times the standard deviations of blank measurements using deionized water. The results showed the LOD of the system was 1.9 nmol H2O2/m3.
3.3. Comparison with Offline Method
The offline measurement involves sample collection and solvent extraction, which can take hours to days from sample collection to analysis. To compare the ROS online measurement with immediate offline measurements, the filter was measured with varying intervals after sampling. Following sampling, filters were extracted into the DCFH-HRP working solution, and detect the ROS concentration using the online instrument. For both offline and online measurements, the same fluorescence detection method was employed. The ROS decay percentage is shown in Figure 4. The results show that ROS decays significantly after offline sampling. After around three hours, the ROS concentration decreased by roughly 80%. Previous studies showed that the offline method, on average, underestimates ROS concentration by 60% due to the degradation of the highly reactive ROS fraction, which is some kind of short-lived ROS in secondary organic aerosol (SOA) with a half-life of 1.7 h [46]. Therefore, the online monitoring system developed in the current study can effectively avoid the significant loss of ROS compared with the previous offline method.
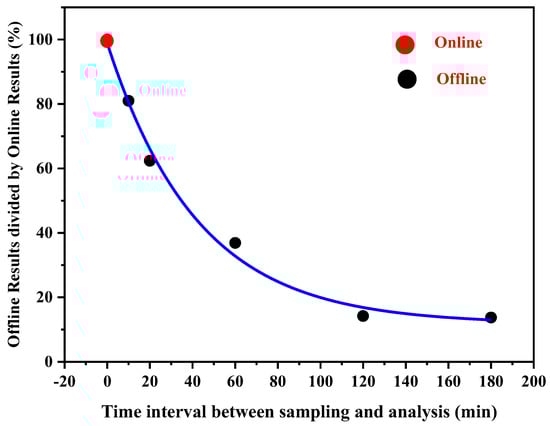
Figure 4.
Comparison of offline and online particle-bound ROS detection results.
3.4. Results of Field Observation
The online system was deployed at the Jiang Wan Campus of Fudan University (31°20′25″ N, 121°30′24″ E) from 2–16 January 2023. The area is surrounded by residential and commercial areas, without large industrial and chemical parks, which is a typical urban environment in Shanghai (shown in Figure S4). The instrument was placed on the 6th floor with a height of about 18 m. During the observation period, the DCFH solution and HRP solution were prepared daily to avoid auto-oxidation of the DCFH solution. Furthermore, the calibration curves were generated once a day to ensure the accuracy of the results, which caused some outages of the data. Other pollutants such as NO2, SO2, O3, and PM2.5 were recorded at the Jiang Wan Station of the Shanghai Environment Monitoring Center (31°19’42.0” N, 121°31’36.3” E), which is 1.9 km from campus. The results of online observation are shown in Figure 5.

Figure 5.
Online Monitoring Results include ROS, NO, NO2, SO2, O3, and PM2.5.
During the observation period, the average particle-bound ROS concentration was 2.56 ± 0.49 nmol H2O2/m3. The diurnal variation of particle-bound ROS concentrations is apparent, but the range of fluctuation is rather limited, with concentrations ranging from 1 to 4 nmol H2O2/m3, suggesting that ROS were not abundant on particles during the winter season. The concentration of PM2.5 increased significantly from January 6th to 8th, with average concentrations of 88.7 ug/m3, indicating high pollution during that period, while the average concentration of particle-bound ROS increased slightly to 2.69 nmol H2O2/m3, suggesting that particle-bound ROS is influenced little by particle concentration.
Table 2.
Comparison of ROS concentrations between this study and other relevant studies.
Table 2.
Comparison of ROS concentrations between this study and other relevant studies.
| Study Location | Date | Method Type | Concentration (nmol H2O2/m3) | Reference |
|---|---|---|---|---|
| Flushing, NY | January–February 2004 | offline | 0.87 ± 0.18 | [55] |
| Taipei | July–December 2000 | offline | 0.54 ± 0.40 | [56] |
| Rubidoux, CA | July 2003 | offline | 5.90 ± 1.70 | [57] |
| Singapore(ambient) | December 2005 | offline | 5.71 ± 2.30 | [43] |
| Singapore (traffic) | December 2005 | offline | 15.10 ± 0.10 | [43] |
| Austin, homes(outdoor) | January–August 2012 | offline | 1.41 ± 1.0 | [44] |
| Austin, institutional building(outdoor) | January–August 2012 | offline | 1.68 ± 1.3 | [44] |
| Austin, retail stores(outdoor) | January–August 2012 | offline | 1.12 ± 1.1 | [44] |
| Rochester, NY | August 2009 | online | 8.30 ± 2.19 | [58] |
| Atlanta, GA | May, July 2012 | online | 0.25 ± 0.01 | [29] |
| Atlanta, GA | July 2012 | offline | 0.15 ± 0.019 | [29] |
| St Louis Mo, USA (gas phase) | August 2018 | online | 2.67 ± 1.11 | [8] |
| St Louis Mo, USA (particle phase) | August 2018 | online | 2.47 ± 0.33 | [8] |
| Beijing (gas phase) | December 2014 | online | 12.95 ± 3.91 | [10] |
| Beijing (particle phase) | December 2014 | online | 13.29 ± 5.09 | [10] |
| Shanghai | January 2023 | online | 2.56 ± 0.49 | This study |
Table 2 shows the concentration values of atmospheric ROS acquired from multiple studies with different approaches. All methods use DCFH fluorescent probes as the detection method. In general, offline observations provide lower ROS values while online observations yield higher values. Using offline methods, the average ROS value observed in Flushing, Taipei, Austin, and Atlanta was less than 2 mol H2O2/m3. The offline observations in Singapore and Rubidoux had relatively high ROS concentrations, which could be attributed to the measurement location being close to the highway. During online observations in Rochester and Beijing, the concentrations of ROS are high. The concentrations of both gaseous and particle-bound ROS in Beijing are particularly high, which may be related to coal combustion in winter [59]. The observed ROS concentration in this study is close to the online result in St. Louis. The difference between online and offline measurements conducted in Atlanta is smaller than that in this study, possibly because the sample collected on the filter was measured immediately in the offline method. In this study, when the concentration of ROS was measured 10 min after sampling, the ROS concentration decreased by roughly 20%, which is similar to the offline results conducted in Atlanta.
The diurnal variation of ROS and O3 during the observation period is shown in Figure 6. The concentration of particle-bound ROS in the atmosphere exhibits a clear diurnal pattern, with the highest concentration of particle-bound ROS observed between 12:00 and 14:00, which is similar to the result of the previous studies [55,60]. Similarly, the ozone concentration in the atmosphere showed a diurnal pattern, with peaks occurring between 13:00 and 15:00. Ozone is a common oxidant in photochemical reactions and is also a precursor to some ROS species. The correlation coefficient R2 between daytime ozone concentration and ROS concentration is higher than that between nighttime ozone concentration and ROS concentration. The correlation between ROS concentration and PM2.5 is poor, suggesting that aerosol pollution is not contributing to the generation of ROS. The difference in the correlation coefficient between ROS and ozone day and night, as well as similar diurnal variation patterns, indicate that the intensity of photochemical reactions is the main factor affecting the generation of ROS, consistent with previous studies [55,56]. Furthermore, despite minor variations in particle-bound ROS concentration, our online monitoring system can identify little differences in concentration, demonstrating its high performance.
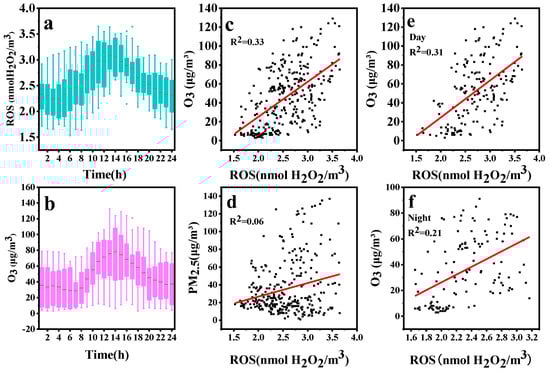
Figure 6.
(a) Diurnal variations of particle-bound ROS concentrations, (b) Diurnal variations of O3 concentrations, (c) The correlation between O3 and ROS, (d) The correlation between PM2.5 and ROS, (e) The correlation between O3 and ROS daytime, (f) The correlation between O3 and ROS at night.
4. Conclusions
An online monitoring system for atmospheric ROS was developed in this work. The system is composed mainly of an Aerosol Collector and a Fluorescence Detector. The instrument’s collection efficiency was greater than 93% and the LOD of the system was 1.9 nmol H2O2/m3. The regression coefficient (R2) of the calibration curve is 0.9975, indicating that the detection system can accurately measure the ROS of the solution. Compared with the offline method, this system can reduce ROS loss by at least 60%. According to field measurements in Shanghai, the average particle-bound ROS concentration was 2.56 ± 0.49 nmol H2O2/m3. The concentration of particle-bound ROS in the atmosphere exhibits a clear diurnal pattern with a peak appearing between 12:00 and 14:00. The atmospheric ozone concentrations showed a similar diurnal pattern, suggesting that the photochemical reaction is the main factor driving the daily variation of particle-bound ROS.
Supplementary Materials
The following supporting information can be downloaded at: https://www.mdpi.com/article/10.3390/atmos14060924/s1, Figure S1: Structure of the cyclone collector: (1) sectional view of the cyclone collector, (2) three-dimensional view of the cyclone collector. Figure S2: Relationship between fluorescence intensity and illumination time. Figure S3: Structure diagram of Fluorescence Detector. Figure S4: Map of the sampling site.
Author Contributions
Y.L.: Writing—original draft, Investigation, Methodology, Data curation, Formal analysis. X.T.: Data curation, Writing—Original draft preparation. Z.Z.: Formal analysis. L.L.: Conceptualization, Methodology, Data curation, Writing—Reviewing, and Editing. J.C.: Supervision, Resources. All authors have read and agreed to the published version of the manuscript.
Funding
This research was funded by the National Key Research and Development Program of China (2022YFC3700500 and 2022YFC3701101).
Data Availability Statement
The data reported in this study will be available on request from the corresponding author.
Conflicts of Interest
The authors declare no conflict of interest.
References
- Craig, L.; Krewski, D.; Shortreed, J.; Samet, J. Special Issue: Strategies for Clean Air and Health. J. Toxicol. Environ. Health-Part A-Curr. Issues 2007, 70, 183–186. [Google Scholar] [CrossRef]
- Filippini, M.; Masieroz, G.; Steinbach, S. The impact of ambient air pollution on hospital admissions. Eur. J. Health Econ. 2019, 20, 919–931. [Google Scholar] [CrossRef] [PubMed]
- Bates, J.T.; Fang, T.; Verma, V.; Zeng, L.; Weber, R.J.; Tolbert, P.E.; Abrams, J.Y.; Sarnat, S.E.; Klein, M.; Mulholland, J.A.; et al. Review of Acellular Assays of Ambient Particulate Matter Oxidative Potential: Methods and Relationships with Composition, Sources, and Health Effects. Environ. Sci. Technol. 2019, 53, 4003–4019. [Google Scholar] [CrossRef]
- Madkour, L. Oxidative stress and oxidative damage-induced cell death. In Reactive Oxygen Species (ROS), Nanoparticles, and Endoplasmic Reticulum (er) Stress-Induced Cell Death Mechanisms; Academic Press: Cambridge, MA, USA, 2020. [Google Scholar]
- Baskaran, S.; Finelli, R.; Agarwal, A.; Henkel, R. Reactive oxygen species in male reproduction: A boon or a bane? Andrologia 2021, 53, e13577. [Google Scholar] [CrossRef]
- Li, N.; Sioutas, C.; Cho, A.; Schmitz, D.; Misra, C.; Sempf, J.; Wang, M.Y.; Oberley, T.; Froines, J.; Nel, A. Ultrafine particulate pollutants induce oxidative stress and mitochondrial damage. Environ. Health Perspect. 2003, 111, 455–460. [Google Scholar] [CrossRef]
- Baulig, A.; Garlatti, M.; Bonvallot, V.; Marchand, A.; Barouki, R.; Marano, F.; Baeza-Squiban, A. Involvement of reactive oxygen species in the metabolic pathways triggered by diesel exhaust particles in human airway epithelial cells. Am. J. Physiol.-Lung Cell. Mol. Physiol. 2003, 285, L671–L679. [Google Scholar] [CrossRef]
- Eftekhari, A.; Fortenberry, C.F.; Williams, B.J.; Walker, M.J.; Dang, A.; Pfaff, A.; Ercal, N.; Morrison, G.C. Continuous measurement of reactive oxygen species inside and outside of a residential house during summer. Indoor Air 2021, 31, 1199–1216. [Google Scholar] [CrossRef] [PubMed]
- Das, A.; Roychoudhury, S. Reactive Oxygen Species in the Reproductive System: Sources and Physiological Roles. Adv. Exp. Med. Biol. 2022, 1358, 9–40. [Google Scholar] [CrossRef]
- Huang, W.; Zhang, Y.; Zhang, Y.; Zeng, L.; Dong, H.; Huo, P.; Fang, D.; Schauer, J.J. Development of an automated sampling-analysis system for simultaneous measurement of reactive oxygen species (ROS) in gas and particle phases: GAC-ROS. Atmos. Environ. 2016, 134, 18–26. [Google Scholar] [CrossRef]
- Cho, A.K.; Sioutas, C.; Miguel, A.H.; Kumagai, Y.; Froines, J.R. Redox activity of airborne particulate matter (PM) at different sites in the Los Angeles Basin. Environ. Res. 2005, 99, 40–47. [Google Scholar] [CrossRef]
- Verma, V.; Fang, T.; Xu, L.; Peltier, R.E.; Russell, A.G.; Ng, N.L.; Weber, R.J. Organic Aerosols Associated with the Generation of Reactive Oxygen Species (ROS) by Water-Soluble PM2.5. Environ. Sci. Technol. 2015, 49, 4646–4656. [Google Scholar] [CrossRef]
- Ma, Y.; Cheng, Y.; Qiu, X.; Cao, G.; Fang, Y.; Wang, J.; Zhu, T.; Yu, J.; Hu, D. Sources and oxidative potential of water-soluble humic-like substances (HULISWS) in fine particulate matter (PM2.5) in Beijing. Atmos. Chem. Phys. 2018, 18, 5607–5617. [Google Scholar] [CrossRef]
- Ma, S.; Ren, K.; Liu, X.; Chen, L.; Li, M.; Li, X.; Yang, J.; Huang, B.; Zheng, M.; Xu, Z. Production of hydroxyl radicals from Fe-containing fine particles in Guangzhou, China. Atmos. Environ. 2015, 123, 72–78. [Google Scholar] [CrossRef]
- Janssen, N.A.H.; Yang, A.; Strak, M.; Steenhof, M.; Hellack, B.; Gerlofs-Nijland, M.E.; Kuhlbusch, T.; Kelly, F.; Harrison, R.M.; Brunekreef, B.; et al. Oxidative potential of particulate matter collected at sites with different source characteristics. Sci. Total Environ. 2014, 472, 572–581. [Google Scholar] [CrossRef] [PubMed]
- Fujitani, Y.; Furuyama, A.; Tanabe, K.; Hirano, S. Comparison of Oxidative Abilities of PM2.5 Collected at Traffic and Residential Sites in Japan. Contribution of Transition Metals and Primary and Secondary Aerosols. Aerosol Air Qual. Res. 2017, 17, 574–587. [Google Scholar] [CrossRef]
- McWhinney, R.D.; Badali, K.; Liggio, J.; Li, S.-M.; Abbatt, J.P.D. Filterable Redox Cycling Activity: A Comparison between Diesel Exhaust Particles and Secondary Organic Aerosol Constituents. Environ. Sci. Technol. 2013, 47, 3362–3369. [Google Scholar] [CrossRef]
- Weber, S.; Uzu, G.; Calas, A.; Chevrier, F.; Besombes, J.-L.; Charron, A.; Salameh, D.; Jezek, I.; Mocnik, G.; Jaffrezo, J.-L. An apportionment method for the oxidative potential of atmospheric particulate matter sources: Application to a one-year study in Chamonix, France. Atmos. Chem. Phys. 2018, 18, 9617–9629. [Google Scholar] [CrossRef]
- Calas, A.; Uzu, G.; Kelly, F.J.; Houdier, S.; Martins, J.M.F.; Thomas, F.; Molton, F.; Charron, A.; Dunster, C.; Oliete, A.; et al. Comparison between five acellular oxidative potential measurement assays performed with detailed chemistry on PM10 samples from the city of Chamonix (France). Atmos. Chem. Phys. 2018, 18, 7863–7875. [Google Scholar] [CrossRef]
- Fang, T.; Verma, V.; Bates, J.T.; Abrams, J.; Klein, M.; Strickland, M.J.; Sarnat, S.E.; Chang, H.H.; Mulholland, J.A.; Tolbert, P.E.; et al. Oxidative potential of ambient water-soluble PM2.5 in the southeastern United States: Contrasts in sources and health associations between ascorbic acid (AA) and dithiothreitol (DTT) assays. Atmos. Chem. Phys. 2016, 16, 3865–3879. [Google Scholar] [CrossRef]
- Liu, Q.; Zhang, Y.; Liu, Y.; Zhang, M. Characterization of springtime airborne particulate matter-bound reactive oxygen species in Beijing. Environ. Sci. Pollut. Res. 2014, 21, 9325–9333. [Google Scholar] [CrossRef]
- Verma, V.; Fang, T.; Guo, H.; King, L.; Bates, J.T.; Peltier, R.E.; Edgerton, E.; Russell, A.G.; Weber, R.J. Reactive oxygen species associated with water-soluble PM2.5 in the southeastern United States: Spatiotemporal trends and source apportionment. Atmos. Chem. Phys. 2014, 14, 12915–12930. [Google Scholar] [CrossRef]
- Liu, Q.; Baumgartner, J.; Zhang, Y.; Liu, Y.; Sun, Y.; Zhang, M. Oxidative Potential and Inflammatory Impacts of Source Apportioned Ambient Air Pollution in Beijing. Environ. Sci. Technol. 2014, 48, 12920–12929. [Google Scholar] [CrossRef]
- Secrest, M.H.; Schauer, J.J.; Carter, E.M.; Lai, A.M.; Wang, Y.; Shan, M.; Yang, X.; Zhang, Y.; Baumgartner, J. The oxidative potential of PM2.5 exposures from indoor and outdoor sources in rural China. Sci. Total Environ. 2016, 571, 1477–1489. [Google Scholar] [CrossRef]
- Chirizzi, D.; Cesari, D.; Guascito, M.R.; Dinoi, A.; Giotta, L.; Donateo, A.; Contini, D. Influence of Saharan dust outbreaks and carbon content on oxidative potential of water-soluble fractions of PM2.5 and PM10. Atmos. Environ. 2017, 163, 1–8. [Google Scholar] [CrossRef]
- Mugica, V.; Ortiz, E.; Molina, L.; De Vizcaya-Ruiz, A.; Nebot, A.; Quintana, R.; Aguilar, J.; Alcantara, E. PM composition and source reconciliation in Mexico City. Atmos. Environ. 2009, 43, 5068–5074. [Google Scholar] [CrossRef]
- Steinfeld, J.I. Atmospheric chemistry and physics: From air pollution to climate change. Environ. Sci. Policy Sustain. Dev. 1998, 40, 26. [Google Scholar] [CrossRef]
- Kao, M.-C.; Wang, C.-S. Reactive oxygen species in incense smoke. Aerosol Air Qual. Res. 2002, 2, 61–69. [Google Scholar] [CrossRef]
- King, L.E.; Weber, R.J. Development and testing of an online method to measure ambient fine particulate reactive oxygen species (ROS) based on the 2′,7′-dichlorofluorescin (DCFH) assay. Atmos. Meas. Tech. 2013, 6, 1647–1658. [Google Scholar] [CrossRef]
- Hopke, P.K. New directions: Reactive particles as a source of human health effects. Atmos. Environ. 2008, 42, 3192–3194. [Google Scholar] [CrossRef]
- Rohr, A.C.; Wyzga, R.E. Attributing health effects to individual particulate matter constituents. Atmos. Environ. 2012, 62, 130–152. [Google Scholar] [CrossRef]
- Piacentini, D.; Falasca, G.; Canepari, S.; Massimi, L. Potential of PM-selected components to induce oxidative stress and root system alteration in a plant model organism. Environ. Int. 2019, 132, 105094. [Google Scholar] [CrossRef]
- Lin, M.; Yu, J.Z. Dithiothreitol (DTT) concentration effect and its implications on the applicability of DTT assay to evaluate the oxidative potential of atmospheric aerosol samples. Environ. Pollut. 2019, 251, 938–944. [Google Scholar] [CrossRef] [PubMed]
- Jiang, H.; Ahmed, C.M.S.; Canchola, A.; Chen, J.Y.; Lin, Y.-H. Use of Dithiothreitol Assay to Evaluate the Oxidative Potential of Atmospheric Aerosols. Atmosphere 2019, 10, 571. [Google Scholar] [CrossRef]
- Zhao, J.; Zhang, Y.; Sisler, J.D.; Shaffer, J.; Leonard, S.S.; Morris, A.M.; Qian, Y.; Bello, D.; Demokritou, P. Assessment of reactive oxygen species generated by electronic cigarettes using acellular and cellular approaches. J. Hazard. Mater. 2018, 344, 549–557. [Google Scholar] [CrossRef]
- Lebel, C.P.; Ischiropoulos, H.; Bondy, S.C. Evaluation of the probe 2′,7′-dichlorofluorescin as an indicator of reactive oxygen species formation and oxidative stress. Chem. Res. Toxicol. 1992, 5, 227–231. [Google Scholar] [CrossRef]
- Corbett, J.T. The scopoletin assay for hydrogen peroxide A review and a better method. J. Biochem. Biophys. Methods 1989, 18, 297–307. [Google Scholar] [CrossRef] [PubMed]
- Tang, B.; Zhang, L.; Geng, Y. Determination of the antioxidant capacity of different food natural products with a new developed flow injection spectrofluorimetry detecting hydroxyl radicals. Talanta 2005, 65, 769–775. [Google Scholar] [CrossRef]
- Fuller, S.J.; Wragg, F.P.H.; Nutter, J.; Kalberer, M. Comparison of on-line and off-line methods to quantify reactive oxygen species (ROS) in atmospheric aerosols. Atmos. Environ. 2014, 92, 97–103. [Google Scholar] [CrossRef]
- Verma, V.; Pakbin, P.; Cheung, K.L.; Cho, A.K.; Schauer, J.J.; Shafer, M.M.; Kleinman, M.T.; Sioutas, C. Physicochemical and oxidative characteristics of semi-volatile components of quasi-ultrafine particles in an urban atmosphere. Atmos. Environ. 2011, 45, 1025–1033. [Google Scholar] [CrossRef]
- Godri, K.J.; Harrison, R.M.; Evans, T.; Baker, T.; Dunster, C.; Mudway, I.S.; Kelly, F.J. Increased Oxidative Burden Associated with Traffic Component of Ambient Particulate Matter at Roadside and Urban Background Schools Sites in London. PLoS ONE 2011, 6, e21961. [Google Scholar] [CrossRef]
- Wragg, F.P.H.; Fuller, S.J.; Freshwater, R.; Green, D.C.; Kelly, F.J.; Kalberer, M. An automated online instrument to quantify aerosol-bound reactive oxygen species (ROS) for ambient measurement and health-relevant aerosol studies. Atmos. Meas. Tech. 2016, 9, 4891–4900. [Google Scholar] [CrossRef]
- See, S.W.; Wang, Y.H.; Balasubramanian, R. Contrasting reactive oxygen species and transition metal concentrations in combustion aerosols. Environ. Res. 2007, 103, 317–324. [Google Scholar] [CrossRef]
- Khurshid, S.S.; Siegel, J.A.; Kinney, K.A. Indoor particulate reactive oxygen species concentrations. Environ. Res. 2014, 132, 46–53. [Google Scholar] [CrossRef]
- Khurshid, S.S.; Siegel, J.A.; Kinney, K.A. Particulate reactive oxygen species on total suspended particles—Measurements in residences in Austin, Texas. Indoor Air 2016, 26, 953–963. [Google Scholar] [CrossRef]
- Zhou, J.; Bruns, E.A.; Zotter, P.; Stefenelli, G.; Prevot, A.S.H.; Baltensperger, U.; El-Haddad, I.; Dommen, J. Development, characterization and first deployment of an improved online reactive oxygen species analyzer. Atmos. Meas. Tech. 2018, 11, 65–80. [Google Scholar] [CrossRef]
- Carlino, A.; Romano, M.P.; Lionetto, M.G.; Contini, D.; Guascito, M.R. An Overview of the Automated and On-Line Systems to Assess the Oxidative Potential of Particulate Matter. Atmosphere 2023, 14, 256. [Google Scholar] [CrossRef]
- Venkatachari, P.; Hopke, P.K. Development and laboratory testing of an automated monitor for the measurement of atmospheric particle-bound reactive oxygen species (ROS). Aerosol Sci. Technol. 2008, 42, 629–635. [Google Scholar] [CrossRef]
- Koehler, K.A.; Shapiro, J.; Sameenoi, Y.; Henry, C.; Volckens, J. Laboratory Evaluation of a Microfluidic Electrochemical Sensor for Aerosol Oxidative Load. Aerosol Sci. Technol. 2014, 48, 489–497. [Google Scholar] [CrossRef]
- Brown, R.A.; Stevanovic, S.; Bottle, S.; Ristovski, Z.D. An instrument for the rapid quantification of PM-bound ROS: The Particle Into Nitroxide Quencher (PINQ). Atmos. Meas. Tech. 2019, 12, 2387–2401. [Google Scholar] [CrossRef]
- Orsini, D.A.; Rhoads, K.; McElhoney, K.; Schick, E.; Koehler, D.; Hogrefe, O. A water cyclone to preserve insoluble aerosols in liquid flow—An interface to flow cytometry to detect airborne nucleic acid. Aerosol Sci. Technol. 2008, 42, 343–356. [Google Scholar] [CrossRef]
- Zhang, Y.; Blough, N.V. Photoproduction of one-electron reducing intermediates by chromophoric dissolved organic matter (CDOM): Relation to O2–and H2O2 photoproduction and CDOM photooxidation. Environ. Sci. Technol. 2016, 50, 11008–11015. [Google Scholar] [CrossRef]
- Weber, R.J.; Orsini, D.; Daun, Y.; Lee, Y.N.; Klotz, P.J.; Brechtel, F. A particle-into-liquid collector for rapid measurement of aerosol bulk chemical composition. Aerosol Sci. Technol. 2001, 35, 718–727. [Google Scholar] [CrossRef]
- Sharpless, C.M.; Blough, N.V. The importance of charge-transfer interactions in determining chromophoric dissolved organic matter (CDOM) optical and photochemical properties. Environ. Sci. Process. Impacts 2014, 16, 654–671. [Google Scholar] [CrossRef]
- Venkatachari, P.; Hopke, P.K.; Brune, W.H.; Ren, X.R.; Lesher, R.; Mao, J.Q.; Mitchel, M. Characterization of wintertime reactive oxygen species concentrations in Flushing, New York. Aerosol Sci. Technol. 2007, 41, 97–111. [Google Scholar] [CrossRef]
- Hung, H.F.; Wang, C.S. Experimental determination of reactive oxygen species in Taipei aerosols. J. Aerosol. Sci. 2001, 32, 1201–1211. [Google Scholar] [CrossRef]
- Venkatachari, P.; Hopke, P.K.; Grover, B.D.; Eatough, D.J. Measurement of Particle-Bound Reactive Oxygen Species in Rubidoux Aerosols. J. Atmos. Chem. 2005, 52, 325–326. [Google Scholar] [CrossRef]
- Yungang, W.; Hopke, P.K.; Liping, S.; Chalupa, D.C.; Utell, M.J. Laboratory and Field Testing of an Automated Atmospheric Particle-Bound Reactive Oxygen Species Sampling-Analysis System. J. Toxicol. 2011, 2011, 419476. [Google Scholar]
- Zikova, N.; Wang, Y.; Yang, F.; Li, X.; Tian, M.; Hopke, P.K. On the source contribution to Beijing PM2.5 concentrations. Atmos. Environ. 2016, 134, 84–95. [Google Scholar] [CrossRef]
- Wu, J.; Yang, C.; Zhang, C.; Cao, F.; Wu, A.; Zhang, Y. Development, characterization, and application of an improved online reactive oxygen species analyzer based on the Monitor for AeRosols and Gases in ambient Air (MARGA). Atmos. Meas. Tech. 2022, 15, 2623–2633. [Google Scholar] [CrossRef]


Disclaimer/Publisher’s Note: The statements, opinions and data contained in all publications are solely those of the individual author(s) and contributor(s) and not of MDPI and/or the editor(s). MDPI and/or the editor(s) disclaim responsibility for any injury to people or property resulting from any ideas, methods, instructions or products referred to in the content. |
© 2023 by the authors. Licensee MDPI, Basel, Switzerland. This article is an open access article distributed under the terms and conditions of the Creative Commons Attribution (CC BY) license (https://creativecommons.org/licenses/by/4.0/).