Abstract
Frequent droughts may have negative influences on the ecosystem (i.e., terrestrial vegetation) under a warming climate condition. In this study, the linear regression method was first used to analyze trends in vegetation change (normalized difference vegetation index (NDVI)) and drought indices (Standardized Precipitation Index (SPI) and Standardized Precipitation Evapotranspiration Index (SPEI)). The Pearson Correlation analysis was then used to quantify drought impacts on terrestrial vegetation in the Weihe River Basin (WRB); in particular, the response time of vegetation to multiple time scales of drought (RTVD) in the WRB was also investigated. The trend analysis results indicated that 89.77% of the area of the basin showed a significant increasing trend in NDVI from 2000 to 2019. There were also significant variations in NDVI during the year, with the highest rate in June (0.01) and the lowest rate in January (0.002). From 2000 to 2019, SPI and SPEI at different time scales in the WRB showed an overall increasing trend, which indicated that the drought was alleviated. The results of correlation analysis showed that the response time of vegetation to drought in the WRB from 2000 to 2019 was significantly spatially heterogeneous. For NDVI to SPEI, the response time of 12 months was widely distributed in the north; however, the response time of 24 months was mainly distributed in the middle basin. The response time of NDVI to SPI was short and was mainly concentrated at 3 and 6 months; in detail, the response time of 3 months was mainly distributed in the east, while a response time of 6 months was widely distributed in the west. In autumn and winter, the response time of NDVI to SPEI was longer (12 and 24 months), while the response time of NDVI to SPI was shorter (3 months). From the maximum correlation coefficient, the response of grassland to drought (SPEI and SPI) at different time scales (i.e., 6, 12, and 24 months) was higher than that of cultivated land, forestland, and artificial surface. The results may help improve our understanding of the impacts of climatic changes on vegetation cover.
1. Introduction
According to the sixth assessment report released by the United Nations Intergovernmental Panel on Climate Change (IPCC) in 2021, the global average surface temperature in 2011–2020 has increased by 1.09 °C compared with pre-industrialization (1850–1900) [1]. The temperature rise rate in the Weihe River Basin (WRB) is 0.35 °C/10a [2]. In the context of global warming, the frequent occurrence of drought has a huge impact on the WRB vegetation ecosystem, leading to changes in the response time of vegetation to drought. The response time can be defined as the characteristic time scale at which the maximum SPEI/SPI-NDVI correlation is acquired; it emphasizes that drought impacts do not occur instantaneously but are the result of moisture deficits accumulated over a period of time [3]. More specifically, the response time measures both how fast vegetation is adversely affected by the drought episode and how fast it recovers from the drought disturbance, thereby is able to, to some extent, quantify the resistance and resilience of vegetation to drought [4,5]. Therefore, it is necessary to analyze the response time of vegetation to drought over the WRB under climate change.
Scholars have conducted a lot of research on NDVI variation characteristics and its correlation with climatic factors (precipitation, temperature) in the WRB. Zhang et al. [6] found that NDVI in the WRB has a strong correlation with precipitation and temperature. Then, Pang et al. found that the correlation between precipitation, temperature, and vegetation coverage in the WRB has obvious regional characteristics, and the impact on vegetation coverage is relatively independent [7]. On the time scale, Wang et al. [8] found that seasonal changes in both temperature and precipitation in the WRB have important effects on vegetation growth, but NDVI responds more strongly to changes in temperature than to changes in precipitation. Zhang et al. [9] found that the correlation and lag between NDVI and temperature and precipitation differed significantly in the WRB in different seasons. Recently, researchers studied the response of vegetation to multi-scale drought in China, especially in the arid and semi-arid regions. For example, in China, Zhang et al. [10] investigated vegetation response to different time scales of drought across different vegetation types and found that annual Rmax showed significant correlation, mainly in arid and semi-arid regions with 3–6 months drought, indicating that vegetation biomass was influenced mainly by seasonal water availabilities. Li et al. [11] also assessed vegetation response to multi-time scale drought across inner Mongolia and found that typical steppe, steppe desert, and desert steppe were more sensitive to shorter time scale droughts, while in the forest, forest steppe, and sand desert, vegetation showed a close relationship with the longer time scale droughts.
The WRB is an important ecological barrier area and an important biodiversity conservation area in China. It has an important strategic position in maintaining ecological balance and socio-economic development in the northwest region [12]. The WRB is located in the northwest inland region of China and is a typical arid and semi-arid region [13]. However, its complex topography has a strong influence on the spatial variability of precipitation [14]. The temperature gradually rises [15]. This leads to frequent droughts. In addition, the basin is ecologically fragile, and the total water resources are scarce [16]. This further exacerbates the vulnerability and instability of surface vegetation, which seriously hinders the sustainable development of local agricultural production and ecological economy. However, most of the studies focused on the temporal and spatial evolution characteristics of NDVI and its correlation with climatic factors (precipitation, temperature), while few studies explored the response of vegetation to drought in the WRB. Therefore, it is necessary to study the response time of vegetation to drought in the WRB. Understanding the relationship between vegetation responses and drought characteristics can help to improve our knowledge of vegetation vulnerability to climate fluctuations [4] and promote the projection precision of ecosystem responses to climate change [10]. The investigation of vegetation response to different time scale droughts across the WRB will help shed light on the impacts of droughts on terrestrial ecosystems and help to make plans and advise management to reduce ecological and economic loss.
In this study, the objective is to analyze the response time of vegetation to drought (hereafter RTVD) over the WRB based on the meteorological drought index (i.e., SPEI and SPI) and the normalized difference vegetation index (NDVI). We intended (1) to study the spatial and temporal evolution characteristics of interannual, seasonal, growing season, and monthly NDVI in the WRB based on the trend analysis method; (2) to compare the trends of SPEI/SPI at different time scales (i.e., 3, 6, 12, and 24 months); (3) to explore the maximum correlation coefficient between NDVI and SPEI/SPI and the corresponding drought time scale in the WRB by correlation analysis, and to determine the response time of vegetation (represented by the NDVI) to drought (represented by the SPEI and SPI); and (4) to determine the RTVD over different land use types. Understanding the RTVD may help to assess the resistance and resilience of vegetation and improve our knowledge of the vulnerability of vegetation to climate change, which is of great significance for taking appropriate actions to alleviate vegetation pressure. The results of this study can also provide a background for vegetation planning and management in the WRB.
2. Materials and Methods
2.1. Study Area
The Weihe River Basin (WRB, 104°00′ E to 110°20′ E and 33°50′ N to 37°18′ N) is located in the southern part of the Yellow River. It covers an area of approximately 13.48 × 10⁴ km2 (Figure 1a). The northwest of the WRB is higher and which belongs to the Loess Plateau; the southeast is lower and belongs to the plain region. Climatically, the region belongs to the arid and semi-arid regions. It is located in the continental monsoon climate zone. The mean annual precipitation is approximately 572 mm. The precipitation within the basin is spatially uneven and exhibits a declining trend from south to north [17]. The mean annual temperature is between 5 and 14 °C across the basin. The average annual temperature tends to decrease from east to west and from south to north [8]. The four main types of land use in the Wei River Basin are cultivated land, grassland, forestland, and artificial surface (Figure 1b). The northern part is mainly grassland, while the western and southwestern parts are mainly cultivated land. The southern, eastern, and central parts are mainly forestland, and the southeastern plain area is mainly artificial surface, which is more active in human activities.
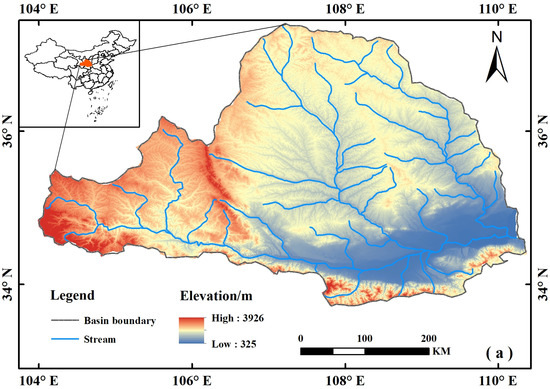
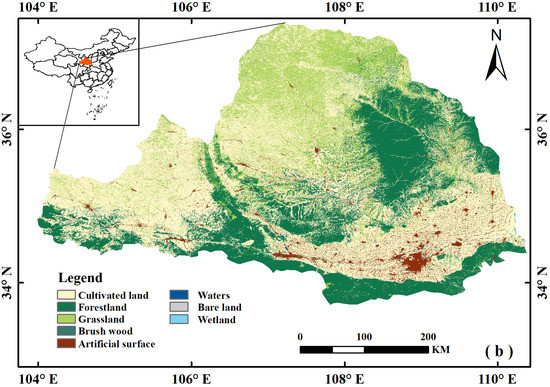
Figure 1.
The location and land use of the WRB. (a) Geographical location of the WRB; (b) land use of the WRB.
2.2. Data Collection
The NDVI datasets are calculated by taking the 16-day maximum value based on the MODSI-NDVI (MODND1D) series. The spatial resolution is approximately 1 km × 1 km, with a total of 240 images. The maximum value composite (MVC) method is used to process the NDVI data across a year, which can diminish the adverse influence of cloud cover and the errors from large solar zenith angles [18].
The temperature and precipitation raster data used in this paper are obtained from the Loess Plateau SubCenter, National Earth System Science Data Center, and National Science & Technology Infrastructure of China (http://loess.geodata.cn (accessed on 16 April 2022)). This product has been validated with observations from 496 independent meteorological stations, and the results have been verified to be credible. The spatial resolution of the raster data is the same as the NDVI data.
2.3. Research Method
Based on the three types of datasets listed above, the flowchart of this study is shown in Figure S1.
2.3.1. Pearson Correlation Analysis
Given that vegetation usually responds to water variation accumulated over a period of time but not instantaneously, the response time investigated here can be defined as the characteristic time scale at which the maximum SPEI/SPI-NDVI correlation is acquired. The maximum correlation coefficient can clearly show the correlation between NDVI and SPEI/SPI at different time scales. That is, the time scale of the SPEI/SPI corresponding to the maximum correlation coefficient is the RTVD. The calculation steps are as follows: (1) Each pixel was analyzed spatially to obtain the coefficient of correlation R between the monthly NDVI and SPEI/SPI (i.e., 3, 6, 12, and 24 months). (2) Based on the Maximum Value Composites (MVC), the maximum value of the correlation coefficient is taken on the pixel.
where is the correlation coefficient between the NDVI of the ith month and the SPEI/SPI of the jth time scale, and is the maximum correlation coefficient on a pixel.
2.3.2. Standardized Precipitation Evapotranspiration Index (SPEI)
The occurrence of drought events depends not only on the precipitation but also on evaporation. Therefore, the SPEI index was proposed by Vicente-Serrano, with the consideration of precipitation and temperature [19]. Different researchers have found that SPEI has a better applicability in China for semi-arid and semi-humid regions [20]. SPEI is calculated as follows:
(1) Calculation of Potential Evapotranspiration (PET). The Thornthwaite method is easier to calculate than the Penman–Monteith method. Therefore, Potential Evapotranspiration (PET) is estimated by using the Thornthwaite method [21]. It only considers the effect of temperature. (2) Calculation of water surplus or deficit (D). This is the difference between precipitation (P) and potential evaporation (PET). (3) Then, D is normalized with a log-logistic probability distribution to obtain SPEI.
2.3.3. Standardized Precipitation Index (SPI)
SPI is one of the commonly used multiscale standardized meteorological drought indices based on the probabilistic behaviors of meteorological variables. SPI considers the deficit of precipitation only. It is determined by normalizing the long-term precipitation record for the desired period after it is fitted to a probability density function [22]. The gamma distribution is the preferred fitting function [23].
2.3.4. Trend Analysis
This paper uses one-dimensional linear regression analysis to describe trends in NDVI. This method allows for a representation of the spatiotemporal changes in a region by calculating the variation of each grid and reflecting the trend at a specific duration in each grid [24]. In this paper, the MODSI-NDVI datasets from 2000 to 2019 are chosen, and each grid has a corresponding value. The least squares method is applied to estimate the slope of the trendline to dynamically analyze the changes in vegetation of each grid.
3. Results
3.1. Spatial and Temporal Evolution Characteristics of NDVI in the Weihe River Basin
3.1.1. Time Variation Characteristics of NDVI
The annual average value of the WRB is calculated using a 1 km × 1 km grid, and the annual maximum sequence is calculated by the maximum value composite. The average values of seasons and the growing season of the WRB are analyzed separately. This paper defines March to May as spring, June to August as summer, September to November as autumn, December to February of the next year as winter, and April to October as growing season.
From 2000 to 2019, the annual average NDVI in the WRB shows an increasing trend (Figure 2). The multi-year average is 0.42, fluctuating in the range of 0.35 to 0.50 and increasing at a rate of 0.049 per decade. The multi-year average of annual maximum NDVI is 0.68, which is 1.6 times the multi-year average and concentrates in the range of 0.55 to 0.8. The trend is the same as the annual average, increasing at a rate of 0.087 per 10 years, which is 1.8 times the rate of increase in the annual average. As seen from the trends of annual average and annual maximum of NDVI turning green, the overall vegetation coverage in the WRB has been significantly improved.
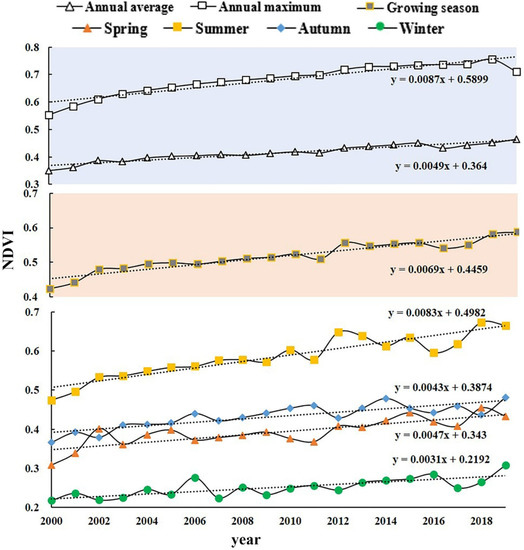
Figure 2.
Change trend of NDVI in the WRB from 2000 to 2019.
From 2000 to 2019, there is a significant seasonal variation of NDVI in the WRB. The highest NDVI is 0.59 in summer, followed by autumn (0.43), spring (0.39), and winter (0.25). The trend is towards green in all four seasons, with the highest increase rate of 0.083 per decade in summer and a minimum increase of 0.031 per decade in winter. From 2000 to 2019, NDVI in spring and autumn increases at the rates of 0.047 per decade and 0.043 per decade, respectively. NDVI in the basin tends to increase during the growing season, with the multi-year mean (0.52) falling between autumn and summer. NDVI in the growing season fluctuates in the range of 0.4 to 0.6. The monthly NDVI in the basin shows an upward trend (Figure 3), with the highest value in August (0.61) and the lowest in February (0.23). The rate of increase is the fastest in June, at a rate of 0.01 per year, and the smallest is in January, at a rate of 0.002 per year.
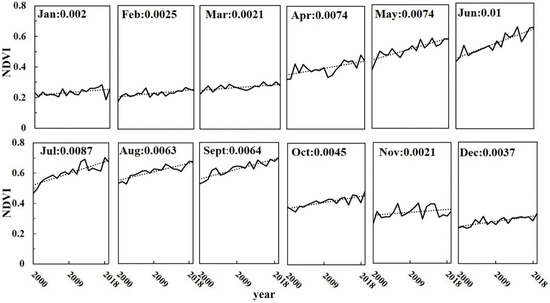
Figure 3.
Change trend of NDVI in months over time.
3.1.2. Spatial Evolution Characteristics of NDVI
The multi-year mean of NDVI in the WRB shows an obvious spatial heterogeneity (Figure 4a), while the mean value for the basin is 0.415. High values are mainly concentrated in woodlands with large trees, such as the Qinling, Ziwuling, and Liupan Mountains. NDVI decreases from southeast to northwest, which is associated with the increasing elevation. Figure 4b shows the spatial variation of NDVI in the WRB. The results indicate that 96.6% of the regions present an increasing trend, of which 89.77% pass the significance test at the significance level of α = 0.05 (Figure 4c). The areas with a large increase in NDVI are mainly concentrated in the upper reaches of the WRB, especially in the upper reaches of the tributaries. This is related to the large-scale vegetation construction in the WRB in recent years. A 3.4% area of the WRB shows a decreasing trend, which is mainly concentrated in the loess hilly and gully areas in the west and north as well as densely populated and economically developed areas with high population and GDP.
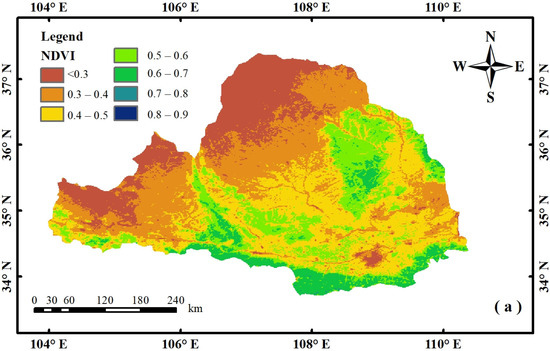
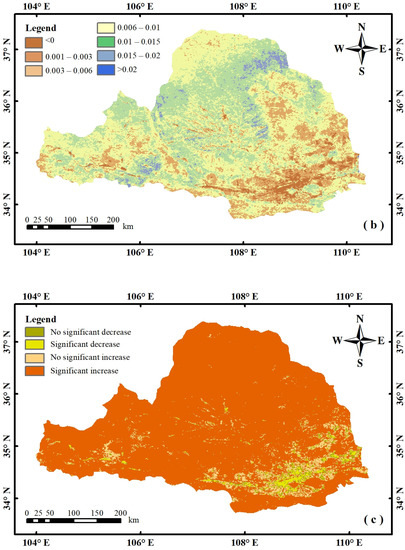
Figure 4.
Spatial characteristics of NDVI in the WRB from 2000 to 2019. (a) Multi-year average spatial distribution of NDVI; (b) change trends; (c) significance tests.
There are significant seasonal differences in NDVI in the WRB (Figure 5). NDVI is significantly higher in summer than in other seasons. The most significant differences are located in the eastern and southern parts of the basin. The NDVI in the eastern part of the WRB decreases significantly in spring and winter, while it decreases in autumn and summer in the rest of the region. The area with NDVI decreases in spring is the largest of the four seasons, accounting for 11.11% of the total area; 3.22% of the area shows a significant decreasing trend (significance level α = 0.05), mainly in the western and southeastern regions. The area with NDVI increases in summer is the largest, accounting for 94.98% of the total area of the basin, of which 87.07% is a significant growth area. In winter, approximately 64.05% of the basin shows a significant increase. The decreasing area accounts for 11.02% of the total area, second only to the spring. Approximately 96.56% of the WRB shows an increasing trend during the growing season (Figure S2).
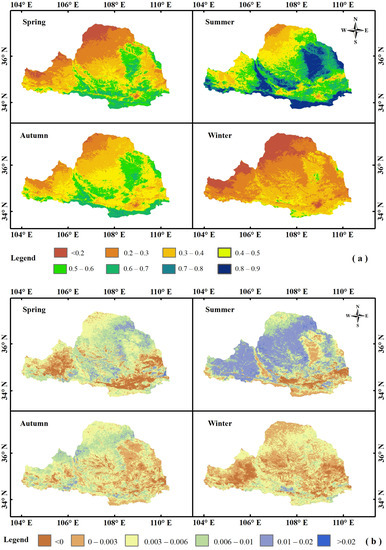
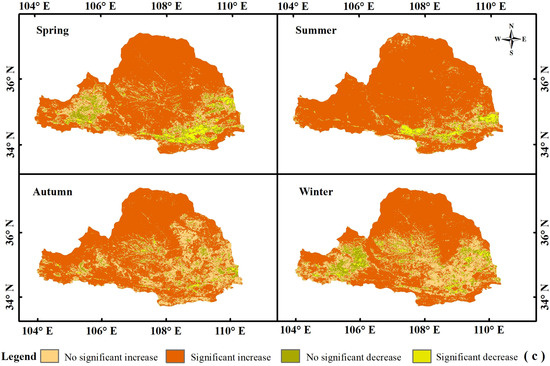
Figure 5.
Spatial characteristics of NDVI over four seasons in the WRB, 2000–2019. (a) Multi-year average spatial distribution of NDVI; (b) change trends; (c) significance tests.
Monthly NDVI in the WRB has a large spatial difference (Figure S3). The spatial distribution of NDVI values varies less from January to March and from November to December. The larger NDVI values from April to October correspond to the growing season in the WRB [25]. Affected by the warming and precipitation increase in April and the agricultural farming system, the NDVI value in the basin gradually increases. Forestland and cultivated land turn green obviously. Among them, forestland is the fastest. The mean value reaches its maximum in August and by the end of the growing season in November. As temperature and precipitation decrease, NDVI begins to decline again across the region. The NDVI has an obvious periodicity, which is related to the growing season of vegetation. It also has a certain relationship with temperature and precipitation.
3.2. Variation Characteristics of SPEI/SPI at Different Time Scales in the WRB
The SPEI/SPI index at different time scales (i.e., 3, 6, 12, and 24 months) are calculated. SPEI at 3 months (SPEI3) is sensitive to the short-term precipitation and temperature changes, and its trend fluctuates significantly. SPEI at 6 months (SPEI6) fluctuates greatly and is affected by the rainy season and non-rainy season. SPEI at 12 months (SPEI12) and SPEI at 24 months (SPEI24) include the complete annual rainfall and runoff process, so as to better reflect the soil internal water surplus and deficit, as well as runoff. Therefore, SPEI12 and SPEI24 can more clearly reflect the overall drought changes since 2000.
Over the last 20 years, the overall trend of the SPEI index in the WRB increases (Figure 6), with a trend towards weakening drought. Specifically, SPEI at all scales shows a decreasing trend from 2000 to 2009. After 2009, SPEI at all scales shows a wetting trend, and drought weakens. For the time scales of 12 and 24 months, droughts are exacerbated in 2003, 2006–2007, and 2009–2010. After 2009, drought weakens in 2016–2017 and intensifies in 2017–2018. From 2000 to 2019, the overall trend of SPI in the WRB at different time scales is upward, and the intensity of drought weakens (Table S1). From 2000 to 2009, the SPI3 shows an increasing trend. The rest of the scales show a decreasing trend, and the longer the time scale, the greater the rate of SPI decline. From 2010 to 2019, the SPI values on all scales except for the 12-month time scale show an increasing trend.
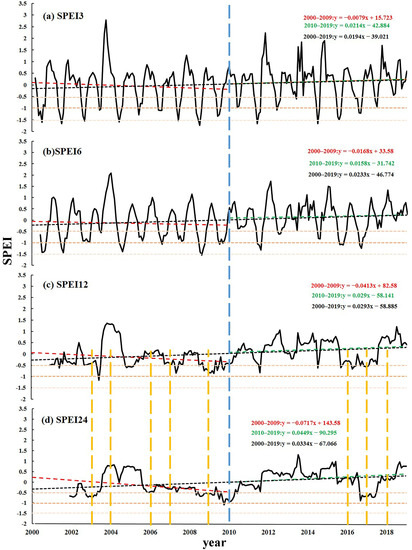
Figure 6.
Interannual variability of SPEI at various scales in the WRB.
3.3. RTVD in the WRB
The maximum correlation coefficient between SPEI/SPI and NDVI implies the impact of drought on vegetation, and the maximum correlation coefficient can reflect the sensitivity of vegetation to drought at different time scales [4]. The response time can be defined as the characteristic time scale at which the maximum SPEI/SPI–NDVI correlation is acquired. The greater the correlation between vegetation growth and short-term SPEI/SPI, the faster the response of vegetation to drought. The greater the correlation with the long time scale SPEI/SPI, the slower the response, that is, the stronger the resistance of the ecosystem to drought [26].
The response time of NDVI to SPEI in the WRB has obvious spatial heterogeneity in the annual scale (Figure 7). Figure 7a shows that NDVI is positively correlated with SPEI in most areas of the WRB. The high correlation coefficients are concentrated in the northern and western parts of the basin, where the maximum correlation coefficients are mostly above 0.5. Figure 7b shows that the response time of NDVI to SPEI is mainly concentrated at 12 and 24 months, accounting for 86.54% of the basin (Table 1). The response times of NDVI to SPEI in the Jinghe River basin and Beiluo River basin are mainly concentrated at 12 months. The upper WRB and along the main stem are then concentrated at 24 months. The main vegetation types of the Qinling, Ziwuling, and Liupan Mountains are temperate meadows and grasses. Alpine meadows are also found at higher altitudes. The northwestern part of the basin is dominated by temperate grasslands. The response time of NDVI to SPEI over different land use types is different. Grassland in the northern part of the WRB has the highest correlation with SPEI12. However, forestland in the central part has the highest correlation with SPEI24, while cultivated land has the strongest correlation with SPEI6. Overall, NDVI has a significant positive correlation with SPEI at different time scales and is closely related to different land use types.
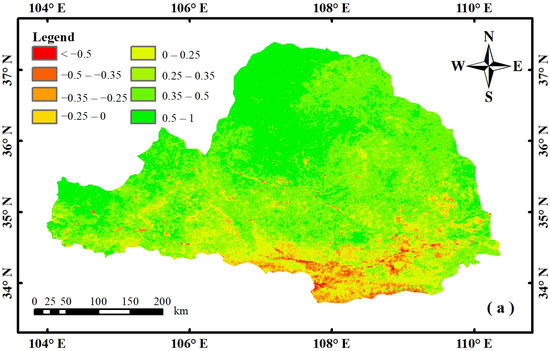
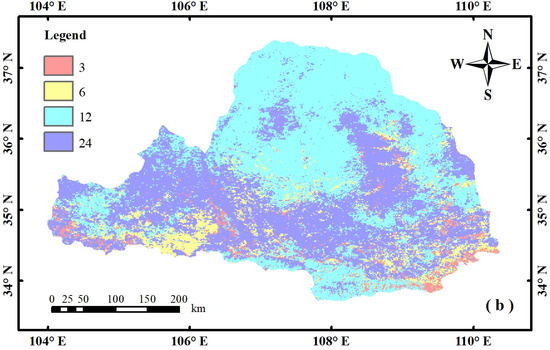
Figure 7.
The maximum correlation coefficient and the response time of NDVI to SPEI (a) The maximum correlation coefficient between NDVI and SPEI; (b) spatial distribution of the response time.

Table 1.
The average of the maximum correlation coefficient between NDVI and SPEI/SPI and the area proportion of RTVD.
As shown in Figure S4, 82.55% of the WRB has a positive correlation between NDVI and SPI, and the negative correlation is mainly distributed in the south. The response time of NDVI to SPI is mainly 3 months, accounting for 63.57% of the basin area (Table 1), followed by 6 months (27.11%), and a response time of 12 months has the smallest area (3.37%). On the annual scale, the response time of NDVI to SPI is shorter, mainly 3 and 6 months. In contrast, the response time of NDVI to SPEI is longer, mainly 12 and 24 months.
Figure 8 shows the maximum correlation coefficient between NDVI and SPEI in four seasons in the WRB. The area of positive correlation is greatest in summer (95.26%), followed by spring (89.22%), autumn (84.29%), and winter (47.99%). The negative correlation between NDVI and SPEI in winter is mainly distributed in the western part of the basin. This is because the higher altitude makes the temperature lower, which leads to the closure of pores on the surface of vegetation leaves and inhibits vegetation growth. As shown in Table 2, the response time of NDVI to SPEI in spring is mainly 3 months (40.08%) in most areas of the central WRB. In summer, the response time of NDVI to SPEI is mainly concentrated at 6 months (43.45%), which is widely distributed in the western WRB. In autumn, the response time of NDVI to SPEI is mainly 24 months (42.29%) in the northern part of the WRB. In winter, the proportion of vegetation response to drought at different scales is not greatly different, between 20.76 and 26.88 %. On the seasonal scale, the response time of NDVI to SPEI gradually becomes longer, and vegetation is more sensitive to long-term SPEI.
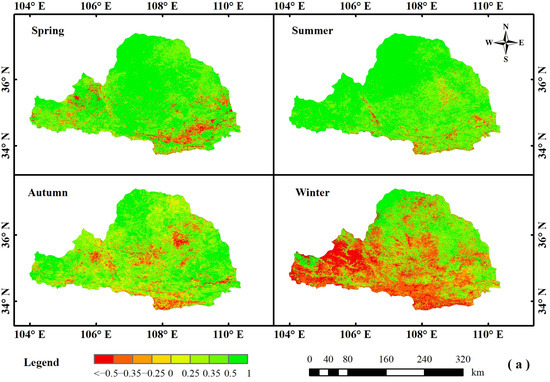
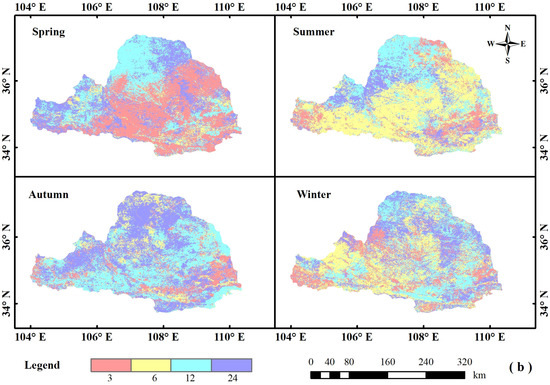
Figure 8.
The maximum correlation coefficient and the response time of NDVI to SPEI. (a) The maximum correlation coefficient between NDVI and SPEI in four seasons; (b) spatial distribution of the response time.

Table 2.
Area proportion of the response time of NDVI to SPEI/SPI.
Figure S5 shows the maximum correlation coefficients between NDVI and SPI for all seasons in the WRB. Except for winter, the area of positive correlation is higher than the area of negative correlation in all three seasons. The largest area of positive correlation is found in summer (91.16%), followed by spring (88.26%), and the smallest area of positive correlation is found in autumn (76.66%). The percentage of negatively correlated area in winter is 66.86%. In spring, the response time of NDVI to SPI is mainly concentrated at 3 months (64.97%) and widely distributed in the northern part of the WRB. In summer, the response time of NDVI to SPI is mainly concentrated at 6 months (58.04%), followed by 3 months (28.95%). In autumn, the response time of NDVI to SPI is mainly concentrated at 3 months (44.39%), and the percentage of regions with a response time of 6 months is 22.85%. In winter, the response time of NDVI to SPI is mainly 3 months with an area share of 58.38%, followed by 24 months (24.24%), while the area share of response times of 6 and 12 months is relatively small.
In summary, the area where NDVI and SPEI are positively correlated is greater than NDVI and SPI in all seasons in the WRB. The response time of vegetation to drought (SPI and SPEI) is shorter in spring and summer and is mostly concentrated at 3 and 6 months. The response time of NDVI to SPEI is longer in autumn and winter, while the response time of NDVI to SPI is shorter.
The area of positive correlation between NDVI and SPEI in growing season is slightly lower than that in summer (95.22%), and 4.78% of the negative correlation area is mainly concentrated in densely populated areas in the southeast of the basin (Figure S6). During the growing season, the percentage of area with a positive correlation between NDVI and SPI is 93.36% (Figure S7), which is higher than that in summer. The response time of NDVI to SPI is mainly concentrated at 3 and 6 months, accounting for 59.91% and 33.41% of the basin area, respectively. Response time of 6 months is widely distributed in the western part of the WRB, while the eastern part is dominated by response times of 3 months. The response time of vegetation to drought (SPI and SPEI) is dominated by 3 months, but the area of NDVI to SPI with a response time of 3 months is larger than the area of NDVI to SPEI.
The maximum correlation coefficients between NDVI and SPEI at different scales show large spatial differences across months (Figure 9). The negative correlation is more pronounced in January, February, and March than in other months. In February, the WRB, except for the northern and eastern parts, shows a negative correlation, accounting for about 75.52% of the total area of the basin. Most of the WRB shows a positive correlation from April to December. The area of positive correlation is 94.17%, which is the highest in June. Figure 9b shows the response time of NDVI to SPEI on a monthly scale. In most areas of the western WRB, the response time of NDVI to SPEI starts to decrease at the beginning of the growing season (April), and the decreasing trend of vegetation response time continues until August. In most parts of the eastern WRB, the response time of NDVI to SPEI increases from October to December. Except for July and August, the response time of NDVI to SPEI is longer in other months and is mainly concentrated at 12 and 24 months.
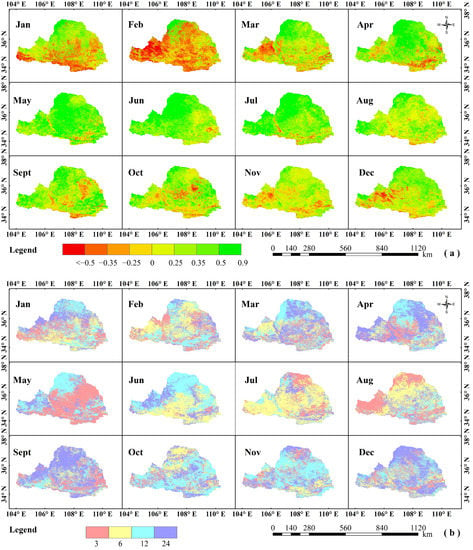
Figure 9.
The maximum correlation coefficient and the response time of NDVI to SPEI. (a) The maximum correlation coefficient between NDVI and SPEI by month; (b) spatial distribution of the response time.
Overall, the area with a negative maximum correlation coefficient from January to March is larger in the WRB (Figure S8). In January, NDVI is negatively correlated with SPI, accounting for 97.52% of the basin. The remaining months are positively correlated in more than 69.21% of the basin. The response time of NDVI to SPI in January, May, June, September, and November is mainly concentrated at 3 months. The response time of NDVI to SPI in April, July, August, and October is mainly concentrated at 6 months. The response of NDVI to SPI is more rapid in the above months. The response time of NDVI to SPI in February is mainly concentrated at 12 months and widely distributed in the central region of the WRB. The response time of NDVI to SPI in March and December is mainly concentrated at 24 months (36.93% and 49.43%).
3.4. RTVD over Different Land Use Types
The mean value of NDVI for each land use in the WRB (Figure S9) is the highest for forestland (0.54), followed by artificial surface (0.39), cultivated land (0.38), and grassland (0.33). The pattern of change in the mean value of NDVI for each land use during the four seasons and the growing season is the same as the multi-year average. The NDVI values for different types of land use are the highest in summer and the lowest in winter. The NDVI value of forestland in summer is significantly higher than that of cultivated land, grassland, and artificial surface, while the difference among these types in winter is the smallest.
The WRB is the main grain-yielding area in Northwestern China. Approximately 61% of the basin is used for agricultural cultivation, leading to changes in NDVI in the WRB influenced by agricultural systems [27]. Unlike natural vegetation, the variation in crop growth is closely linked to agricultural farming systems, which has influences on the NDVI. Guanzhong Plain, Jinghe River, and Beiluo River basin are important grain producing areas in Northwestern China. In the production area, dry grain crops are mainly cultivated for one harvest a year and three harvests every two years, along with commercial crops such as cotton and fruit trees. During the growing season, humans take actions, such as water irrigation and pesticide spraying, to ensure crop growth, which is the reason for the stable increase in NDVI in the region. On the other hand, the WRB is located in the Loess Plateau region of Northwest China. It has long faced ecological problems such as soil erosion, water scarcity, and land desertification. Since 1999, the state has stepped up ecological construction projects (e.g., closing hillsides to facilitate afforestation, phasing out cultivation of sloping farmland, large-scale afforestation and grass planting, and a series of comprehensive management of small watersheds) to improve soil erosion in the Loess Plateau, which has played a vital role in vegetation restoration in the watershed [28,29,30,31].
Figure S10 shows that the response time area of cultivated land to SPEI at different time scales in the WRB is the largest, while the artificial surface is the smallest. The response time of NDVI to SPEI over grassland is mainly 12 months, while the response time of NDVI to SPEI over other the three land use types is mainly 24 months. For the four land use types, the response time of NDVI to SPI is mainly concentrated at 3 months. The area proportion of NDVI response time to SPI is as follows: 3 months > 6 months > 24 months > 12 months (Table S2).
The maximum correlation coefficients between NDVI and SPEI at different time scales of the four land use types (cultivated land, forestland, grassland, and artificial surface) in the study area are further counted (Table 3). From the maximum correlation coefficient, the response of grassland NDVI to SPEI at different time scales (i.e., 6, 12, and 24 months) is higher than that of cultivated land, forestland, and artificial surface. The maximum correlation coefficient between NDVI and SPEI of artificial surface is the smallest. Cultivated land and grassland are more sensitive to SPEI12, while forestland and artificial surface are more sensitive to long-term drought. The response of grassland NDVI to SPI at different time scales (i.e., 3, 6, 12, and 24 months) is higher than that of cultivated land, forestland, and artificial surface. The maximum correlation coefficient between NDVI and SPI of the forestland is the smallest in the 3-month time scale.

Table 3.
The mean value of the annual maximum correlation coefficient between NDVI and SPEI/SPI at different time scales.
4. Discussion
Given that vegetation usually responds to water variation accumulated over a period of time but not instantaneously, the response time can be defined as the characteristic time scale at which the maximum SPEI/SPI–NDVI correlation is acquired [3]. The drought time scale at which the highest correlation is recorded has been receiving much attention. The greater the correlation between NDVI and short time scale SPEI/SPI, the faster the response of vegetation to drought. Correspondingly, the greater the correlation of long-term SPEI/SPI, the slower the response of vegetation to drought and the stronger the resistance of the ecosystem to drought [32]. The response time can be regarded as a useful indicator for assessing the vegetation’s resistance to drought and the resilience after the drought episode has terminated, with its large value indicating a strong ability to withstand drought with a slow recovery rate from drought and vice versa [3].
In the correlation analysis, annual-scale NDVI and SPEI/SPI are mostly positively correlated, indicating that vegetation growth is susceptible to water changes. Negative correlations are mainly concentrated in the plains of the southeastern part of the basin. This region is densely populated and well supplied with water, and its vegetation cover is heavily influenced by urbanization. Temperature and precipitation are no longer restrictive factors on growth in autumn and winter; consequently, there is a negative correlation. On the seasonal scale, the correlation between summer NDVI and SPEI/SPI is the strongest, and the maximum correlation coefficient is positive in 95.26%/91.16% of the region. The degree of drought weakens, and the vegetation grows. There is a high correlation between NDVI and SPEI in summer, which is in line with previous studies by Fang et al. [33]. In summer, the temperature rises [34], and the accumulated temperature required for most plant growth is satisfied. Temperature is no longer the main factor limiting plant growth. Moreover, the increase in temperature aggravates the potential evaporation and improves the demand for vegetation water, which makes vegetation more sensitive to water [35]. Therefore, the response time of vegetation to drought (SPEI and SPI) in summer is short, which is mainly concentrated at 6 months, and the response area of NDVI to SPI6 is larger than that of NDVI to SPEI6.
From the maximum correlation coefficient, the response of grassland NDVI to SPEI/SPI at different time scales (i.e., 6, 12, and 24 months) is higher than that of cultivated land, forestland, and artificial surface. Grassland is more sensitive to SPI on short time scales. Grassland belongs to shallow root plants, and its water storage capacity is weak during rainfall. Therefore, grassland has a strong response to drought [36]. The WRB is dominated by cultivated land and is subject to human interference. Cultivated land management measures such as irrigation and fertilization provide better growth conditions for crops. Therefore, the average value of the maximum correlation coefficient between cultivated land NDVI and SPEI/SPI is smaller than that of grassland [37]. The roots of forests are developed. When the forest is short of water, the roots will develop deeper into the soil, so the drought tolerance is better and the response to 3-month time scale drought is not sensitive [38]. The government should actively promote ecological protection measures such as returning farmland to forest and afforestation to solve the drought problem. The response time of NDVI to SPI over cultivated land, grassland, forestland, and artificial surface is mainly concentrated at 3 months. The possible reason for this is that SPI only considers precipitation, and evapotranspiration is also an important part of the eco-environmental water cycle. The large potential evapotranspiration in the WRB is a factor that cannot be ignored in the water balance and vegetation change [39]. Therefore, it is difficult to reflect the response of vegetation to water in different land use types only considering precipitation. Grassland in the northern part of the WRB has the highest correlation with SPEI12. However, forestland in the central part has the highest correlation with SPEI24, while cultivated land has the strongest correlation with SPEI6. The results are in line with previous studies by Yang et al. [40], who concluded that the response of different vegetation types to the drought disaster is different. Compared with the forestland, the response of grassland to drought is earlier. The forestland could be insensitive to short droughts. The results are in line with previous studies by Li et al. and Wang et al. [38,41]. The SPEI/SPI of different time scales show an overall upward trend, the degree of drought weakens, and the increase in soil moisture is conducive to vegetation growth. In 20 years, NDVI decreased in 2018, which is consistent with the time of drought aggravation shown by SPEI24, indicating that vegetation growth is affected by drought. The overall trend of NDVI in the WRB is increasing and shows obvious seasonal characteristics, which is in line with previous studies by Wei et al. [42]. A study by Liu et al. shows the overall vegetation coverage in China has improved significantly [43].
The meteorological drought index (i.e., SPEI) used in this paper has become the more commonly used drought index in China. The large-scale SPEI index provides a reasonable representation of the wet and dry conditions in the WRB. Previous studies have shown that the magnitude of evapotranspiration is not entirely determined by the level of temperature [44]. The “evaporation paradox” occurs in the Loess Plateau region, where evapotranspiration decreases due to increased temperature [45,46]. With global climate anomalies, previous studies have also found that ENSO events have a greater impact on precipitation and temperature [47]. In addition, factors such as underlying surface conditions and wind speed can have an impact on SPEI. Therefore, further research is needed on how to develop a drought index that is more suitable for the characteristics of the basin and consistent with the drought causal mechanism.
5. Conclusions
In this study, we have analyzed the response time of vegetation to drought over the WRB based on the meteorological drought index (i.e., SPEI and SPI) and the normalized difference vegetation index (NDVI). We have studied the trends of NDVI, SPEI, and SPI. We have explored the maximum correlation coefficient between NDVI and SPEI/SPI and the RTVD. This study has determined the RTVD over different land use types.
The trend analysis results indicated that 89.77% of the area of the basin showed a significant increasing trend in NDVI from 2000 to 2019. From 2000 to 2019, SPI and SPEI at different time scales in the WRB showed an overall increasing trend, which indicated that the drought was alleviated. The results of correlation analysis showed that NDVI and SPEI/SPI at the annual scale had the highest correlation coefficients in the northern part of the basin, with mostly positive correlations. At the annual scale, the response time of NDVI to SPEI was mainly concentrated at 12 and 24 months, while the response time of NDVI to SPI was mainly concentrated at 3 and 6 months. The response time of NDVI to drought (SPI and SPEI) was shorter in spring and summer, with the main response time of 3 and 6 months. The response time of NDVI to SPEI over different land use types was inconsistent. However, the response time of NDVI to SPI over different land uses was consistent and was mainly concentrated at 3 months. The response of grassland to SPI/SPEI at different time scales (i.e., 6, 12, and 24 months) was higher than that of cultivated land, forestland, and artificial surfaces.
The WRB is an important ecological barrier area and an important biodiversity conservation area in China. It has an important strategic position in maintaining ecological balance and socio-economic development in the northwest region [12]. We have studied the response time of vegetation to drought in the WRB. Understanding the relationship between vegetation responses and drought characteristics has improved our knowledge of vegetation vulnerability to climate fluctuations [4] and promoted the projection precision of ecosystem responses to climate change [10].
Supplementary Materials
The following supporting information can be downloaded at https://www.mdpi.com/article/10.3390/atmos14060938/s1, Figure S1: Flowchart of studying RTVD over the WRB; Figure S2: Spatial characteristics of NDVI during the growing season. (a) Multi-year average spatial distribution of NDVI; (b) change trends; (c) significance tests; Figure S3: Spatial distribution of NDVI by month in the WRB; Figure S4: The maximum correlation coefficient and the response time of NDVI to SPI. (a) The maximum correlation coefficient between NDVI and SPI; (b) spatial distribution of the response time; Figure S5: The maximum correlation coefficient and the response time of NDVI to SPI. (a) The maximum correlation coefficient between NDVI and SPI in four seasons; (b) spatial distribution of the response time; Figure S6: The maximum correlation coefficient and the response time of NDVI to SPEI. (a)The maximum correlation coefficient between NDVI and SPEI in growing season; (b) spatial distribution of the response time; Figure S7: The maximum correlation coefficient and the response time of NDVI to SPI. (a) The maximum correlation coefficient between NDVI and SPI in growing season; (b) spatial distribution of the response time; Figure S8: The maximum correlation coefficient and the response time of NDVI to SPI. (a) The maximum correlation coefficient between NDVI and SPI in month; (b) spatial distribution of the response time; Figure S9: The multi-year average NDVI of different land use types in the WRB; Figure S10: Proportion of the response time of NDVI to SPEI over different land use types in the WRB; Table S1: Interannual variability of SPI at various scales in the WRB; Table S1: Proportion of the response time of NDVI to SPI over different land use types in the WRB.
Author Contributions
J.F.: investigation, formal analysis, and writing—original draft. S.W.: conceptualization and methodology. G.L.: investigation and formal analysis. X.Z., C.W. and F.X.: validation. Y.L.: methodology and supervision. All authors have read and agreed to the published version of the manuscript.
Funding
This research was funded by the National Natural Science Foundation of China (grant number 52209013), Department of Education of Hebei Province (grant number ZD2022085), State Key Laboratory of Eco-hydraulics in Northwest Arid Region (grant number 2019KFKT-4), and National Natural Science Foundation of China (grant number 52009053).
Institutional Review Board Statement
Not applicable.
Informed Consent Statement
Not applicable.
Data Availability Statement
The datasets analyzed during the current study are available from the corresponding author on reasonable request.
Conflicts of Interest
The authors declare no conflict of interest.
References
- Tollefson, J. IPCC climate report: Earth is warmer than it’s been in 125,000 years. Nature 2021, 596, 171–172. [Google Scholar] [CrossRef]
- Wu, B.; Quan, Q.; Huang, X.; Deng, J. Response of extreme precipitation to climatic warming in the Weihe river basin, China and its mechanism. Open Geosci 2022, 14, 853–862. [Google Scholar] [CrossRef]
- Fang, W.; Huang, S.; Huang, Q.; Huang, G.; Wang, H.; Leng, G.; Ma, L. Bivariate probabilistic quantification of drought impacts on terrestrial vegetation dynamics in mainland China. J. Hydrol. 2019, 577, 123980. [Google Scholar] [CrossRef]
- Vicente-Serrano, S.M.; Gouveia, C.; Camarero, J.J.; Begueria, S.; Trigo, R. Response of vegetation to drought time-scales across global land biomes. Proc. Natl. Acad. Sci. USA 2013, 110, 52–57. [Google Scholar] [CrossRef] [PubMed]
- Van Hoek, M.; Jia, L.; Zhou, J.; Zheng, C.; Menenti, M. Early drought detection by spectral analysis of satellite time series of precipitation and normalized difference vegetation index (NDVI). Remote Sens. 2016, 8, 422. [Google Scholar] [CrossRef]
- Zhang, H.; Chang, J.; Zhang, L.; Wang, Y.; Li, Y.; Wang, X. NDVI dynamic changes and their relationship with meteorological factors and soil moisture. Environ. Earth Sci. 2018, 77, 582. [Google Scholar] [CrossRef]
- Pang, J.T.; Duang, J.L.; Zhang, R.; Lv, J.C. Characteristics of Spatiotemporal Evolution and Climate Response of Vegetation Cover in the Wei River Basin from 2000 to 2019. J. Soil Water Conserv. 2021, 28, 230–237. [Google Scholar] [CrossRef]
- Wang, L.X.; Yu, D.Y.; Liu, Z.; Zhang, S.C.; Yang, Y. Study on Tempo-spatial Variations of NDVI and Climatic Factors and Their Correlation in the Weihe Watershed. J. Soil Water Conserv. 2019, 26, 249–254. [Google Scholar]
- Zhang, L.Q.; Ren, L.L.; Jiang, S.H.; Liu, S.Y.; Dai, F.J.; Wang, Y.Q. Vegetation Change Characteristics in Weihe River Basin during 1982-2015 and lts Related Climatic Factors. J. China Hydrol. 2018, 38, 66–72. [Google Scholar]
- Zhang, Q.; Kong, D.; Singh, V.P.; Shi, P. Response of vegetation to different time-scales drought across China: Spatiotemporal patterns, causes and implications. Glob. Planet. Chang. 2017, 152, 1–11. [Google Scholar] [CrossRef]
- Li, C.; Leal Filho, W.; Yin, J.; Hu, R.; Wang, J.; Yang, C.; Yin, S.; Bao, Y.; Ayal, D.Y. Assessing vegetation response to multi-time-scale drought across inner Mongolia plateau. J. Clean Prod. 2018, 179, 210–216. [Google Scholar] [CrossRef]
- Xu, X.C.; Zhao, X.Y.; Song, X.Y. Impacts of the returning farmland to forest (grassland) project on ecosystem services in the Weihe River Basin, China. Chin. J. Appl. Ecol. 2021, 32, 3893–3904. [Google Scholar]
- Wang, S.; Lei, X.H.; Zhang, F. Analysis on variation characteristics of precipitation time series in Weihe River Basin during the past 55 years. Adv. Mater. Res. 2013, 684, 246–252. [Google Scholar] [CrossRef]
- Liu, Y.G.; Bao, J.C.; Yang, Y.X.; Huang, X. Temporal and Spatial Characteristics of Precipitation and Evaporation in the Weihe River Basin from 1850 to 2005. Res. Soil Water Conserv. 2022, 29, 224–232. [Google Scholar]
- Gou, F.Z.; Qiang, W.B.; Cheng, Y.T. Analysis of multi-scale drought characteristics in Wei River Basin based on SPI. J. Xi’an Univ. Technol. 2019, 35, 443–451. [Google Scholar]
- Wang, X.J.; Jiang, R.G.; Xie, J.C.; Zhu, J.W.; Wang, Y.M. Analysis of variation trend and abrupt point of runoff in the mainstream of Weihe River Basin. J. Hydro-Sci. Eng. 2019, 2, 33–40. (In Chinese) [Google Scholar]
- Li, J.; Mo, S.H.; Shen, B.; Si, H.S.; Wang, Y.M. Analysis of drought characteristics of the Weine river basin based on SPEI. J. Xi’an Univ. Technol. 2016, 32, 70–76. (In Chinese) [Google Scholar]
- Chen, D.K.; Ma, C.; Wang, X.B.; Liu, C. Variation of NDVl and its response to climate change in Hoh Xil during the period of 1982–2015. Arid. Zone Res. 2018, 35, 1410–1417. [Google Scholar]
- Vicente-Serrano, S.M.; Beguería, S.; López-Moreno, J.I. A Multiscalar Drought Index Sensitive to Global Warming: The Standardized Precipitation Evapotranspiration Index. J. Climate. 2010, 23, 1696–1718. [Google Scholar] [CrossRef]
- Tang, M.; Zhang, B.; Zhang, Y.Z.; Wang, G.Q.; Ma, B.; Jia, Y.Q. Assessment of spring and summer meteorological droughts based on SPEl and SPl in eastern agricultural region of Qinghai province. J. Nat. Resour. 2017, 32, 1029–1042. [Google Scholar]
- Thornthwaite, C.W. An approach toward a rational classification of climate. Geogr. Rev. 1948, 55–94. [Google Scholar] [CrossRef]
- Prajapati, V.K.; Khanna, M.; Singh, M.; Kaur, R.; Sahoo, R.N.; Singh, D.K. Evaluation of time scale of meteorological, hydrological and agricultural drought indices. Nat. Hazards 2021, 109, 89–109. [Google Scholar] [CrossRef]
- Zuo, D.; Hou, W.; Wu, H.; Yan, P.; Zhang, Q. Feasibility of calculating standardized precipitation index with short-term precipitation data in China. Atmosphere 2021, 12, 603. [Google Scholar] [CrossRef]
- Zhang, B.; Zhang, Y.Z.; Ren, P.G.; Wang, D.; Zhao, Y.F.; Yang, S.W. Analysis of drought spatial-temporal characteristics based on SPEl in eastern region of Gansu in recent 50 years. Sci. Geogra. Sinica. 2015, 35, 999–1006. [Google Scholar]
- Zhao, A.Z.; Zhang, A.B.; Liu, H.X.; Liu, Y.X.; Wang, H.F.; Wang, D.L. Spatiotemporal variation of vegetation coverage be-fore and after implementation of grain for green project in the Loess Plateau. J. Nat. Resour. 2017, 32, 449–460. [Google Scholar]
- Lv, Z.T.; Li, S.Y.; Peng, Z.M.; Fan, J.L.; Liu, G.J.; Wang, H.F.; Meng, X.Y. Sensitivity of vegetation responses to drought in Mongolia. Geogr. Res. 2021, 40, 3016–3028. [Google Scholar]
- Ding, L.; Maa, R.F.; Guo, X.; Yang, X.; Zhang, Q.; Yang, C. Microplastics in surface waters and sediments of the wei River, in the northwest of China. Sci. Total Environ. 2019, 667, 427–434. [Google Scholar] [CrossRef]
- He, Y.; Fan, G.F.; Zhang, X.W.; Liu, M.; Gao, D.W. Variation of vegetation NDVI and is response to climate change in Zhejiang Province. Acta Ecol. Sinica. 2012, 32, 4352–4362. [Google Scholar] [CrossRef]
- Jiang, C.; Wang, F.; Mu, X.M.; Li, R. Analysis of spatial and temporal variation of vegetation cover in Wei River Basin under background of converting farmland into forest or grassland. Res. Agr. Mod. 2012, 33, 470–474. [Google Scholar]
- Chang, J.; Zhang, H.; Wang, Y.; Zhu, Y. Assessing the impact of climate variability and human activities on streamflow variation. Hydrol. Earth Syst. Sci. 2016, 20, 1547–1560. [Google Scholar] [CrossRef]
- Deng, W.; Song, J.; Sun, H.; Cheng, D.; Zhang, X.; Liu, J.; Kong, F.; Wang, H.; Khan, A.J. Isolating of climate and land surface contribution to basin runoff variability: A case studyfrom the Weihe River basin. China. Ecol. Eng. 2020, 153, 105904. [Google Scholar] [CrossRef]
- Kong, D.D.; Zhang, Q.; Gu, X.H.; Wang, Y.; Li, H.Z. Vegetation responses to drought at different time scales in china. Acta. Ecol. Sinica. 2016, 36, 7908–7918. [Google Scholar]
- Fang, W.; Huang, S.; Huang, Q.; Huang, G.; Wang, H.; Leng, G.; Wang, L.; Guo, Y. Probabilistic assessment of remote sensing-based terrestrial vegetation vulnerability to drought stress of the Loess Plateau in China. Remote Sens. Environ. 2019, 232, 111290. [Google Scholar] [CrossRef]
- Wang, S.; Li, Y.S.; Zhang, F. Analysis on Spatio-Temporal Variation of Temperature in Weihe River Basin in Recent 55 Years. Chin. J. Agrometeorol. 2013, 34, 512–518. [Google Scholar]
- Qi, X.W.; Miao, C.; Wang, H.S. Detecting Response of Vegetation Photosynthesis to Meteorological Drought Based on Solar-Induced Chlorophyll Fluorescence. Chin. J. Agrometeorol. 2023, 44, 133–143. [Google Scholar]
- Sa, R.L.; Ding, Y.; Hou, X.Y. Impact of climate change and adaptation in northern grassland of China. Chin. J. Grassl. 2018, 40, 109–115. [Google Scholar]
- Chen, F.; Shi, X.L.; Ding, H.; Li, Y.; Shi, M.Q. Differences in response of vegetation NDVI/EVI to SPEl in the upper reaches of Luanhe River. J. Water Resour. Water Eng. 2021, 32, 71–77+86. [Google Scholar]
- Li, Z.; Zhou, T.; Zhao, X.; Huang, K.; Gao, S.; Wu, H.; Luo, H. Assessments of drought impacts on vegetation in China with the optimal time scales of the climatic drought index. Int. J. Env. Res. Pub. He 2015, 12, 7615–7634. [Google Scholar] [CrossRef]
- Guo, W.W.; Huang, S.Z.; Zhao, J.; Li, Z.Y.; Huang, Q.; Deng, M.J. Spatio-temporal dynamics and driving forces of potential evapotranspiration in the Wei River Basin. Trans. CSAE 2021, 37, 81–89. [Google Scholar]
- Yang, J.; Wu, J.; Zhou, H.; Han, X. The impacts of typical drought events on terrestrial vegetation in China. International Archives of the Photogrammetry. Remote Sens. Spat. Inf. Sci. 2018, 42, 3. [Google Scholar] [CrossRef]
- Wang, H.; Li, Z.; Cao, L.; Feng, R.; Pan, Y. Response of NDVI of natural vegetation to climate changes and drought in China. Land 2021, 10, 966. [Google Scholar] [CrossRef]
- Wei, Z.; Wan, X. Spatial and Temporal Characteristics of NDVI in the Weihe River Basin and Its Correlation with Terrestrial Water Storage. Remote Sens. 2022, 14, 5532. [Google Scholar] [CrossRef]
- Liu, Y.; Tian, J.; Liu, R.; Ding, L. Influences of Climate Change and Human Activities on NDVI Changes in China. Remote Sens. 2021, 13, 4326. [Google Scholar] [CrossRef]
- Kang, T.; Li, Z.; Gao, Y. Spatiotemporal Variations of Reference Evapotranspiration and Its Determining Climatic Factors in the Taihang Mountains, China. Water 2021, 13, 3145. [Google Scholar] [CrossRef]
- Li, Z.M.; Zheng, F.L.; Liu, W.Z. Spatiotemporal characteristics of reference evapotranspiration during 1961-2009 and its projected changes during 2011-2099 on the Loess Plateau of China. Agr. Forest Meteorol. 2012, 154, 147–155. [Google Scholar] [CrossRef]
- Shi, S.Y.; Wang, F.; Jin, K.; Ding, W.B. Response of vegetation index to meteorological drought over Loess Plateau. J. Arid. Meteorol. 2020, 38, 1–13. [Google Scholar]
- Zou, L.; Yu, J.Y.; Xia, J.; Wang, F.Y. Temporal-spatial variation characteristics of drought in the Weihe River Basin based on SPEI. Arid Land Geogra. 2020, 43, 329–338. [Google Scholar]
Disclaimer/Publisher’s Note: The statements, opinions and data contained in all publications are solely those of the individual author(s) and contributor(s) and not of MDPI and/or the editor(s). MDPI and/or the editor(s) disclaim responsibility for any injury to people or property resulting from any ideas, methods, instructions or products referred to in the content. |
© 2023 by the authors. Licensee MDPI, Basel, Switzerland. This article is an open access article distributed under the terms and conditions of the Creative Commons Attribution (CC BY) license (https://creativecommons.org/licenses/by/4.0/).