1. Introduction
Environmental pollution constitutes a health emergency affecting the populations of both low and high-income countries, as exposure to different environmental risk factors increases the occurrence of disease [
1]. The Global Burden of Disease Study 2019 estimated that air pollution was responsible for 6.7 million deaths on a global level [
1]. Due to the different nature of emission sources, atmospheric pollutants vary greatly in size, morphology, and chemical composition, and, depending on size and toxicity, some present adverse effects on human health. Therefore, air quality at a given site can be affected by diverse factors such as vehicular and industrial emissions, urban mobility, and the kind of fuels used. In addition, the presence of pollutants in the atmosphere, in either the short or long term, affects human health [
2,
3]. It has been reported that air pollution is the main risk factor for circulatory and respiratory diseases [
4] and is, therefore, one of the main causes of death and disease in the world.
There is evidence that short-term exposure to air pollution is associated with respiratory and circulatory diseases and increased numbers of hospital admissions (morbidity) [
5,
6]. Among atmospheric pollutants, criteria air pollutants demand special attention, as they are present in ambient air at high concentrations from a great variety of sources, constituting a high risk to public health. The criteria air pollutants comprise sulfur dioxide (SO
2), nitrogen dioxide (NO
2), carbon monoxide (CO), particulate matter (PM), and ozone (O
3). The health effects associated with these pollutants are mainly acute and non-carcinogenic. In terms of acute effects, it has been documented that increased PM
10 and O
3 levels in the atmosphere correlate well with early mortality [
7,
8,
9,
10,
11].
In recent years, epidemiological studies have determined the association between exposure to environmental risk factors and health effects, considering daily mortality by all causes and specific cause (circulatory and respiratory), as well as by gender and age group. In this regard, some epidemiological studies have reported that respiratory diseases that develop in adult populations have their origin in early stages of life [
12,
13,
14]. In addition, the association between exposure to air pollutants and respiratory diseases (pneumonia, asthma, and acute respiratory infections) in vulnerable populations (children) has been documented by many authors [
15,
16,
17,
18,
19]. These studies report that, the exposure of children to environmental pollutants leads to an increased risk of chronic respiratory diseases, such as chronic obstructive pulmonary disease, asthma, accelerated or premature lung aging, and, therefore, reduced life expectancy [
20,
21,
22]. Short-term exposure to air pollutants such as PM
10 (particulate matter with a diameter <10 μm) and nitrogen dioxide (NO
2) has also been associated with mortality, and respiratory, circulatory, and metabolic diseases [
2,
3,
23,
24]. Yung [
25] reported that CO, SO
2, O
3, and PM
10 exposure are highly associated with mortality, while it has also been documented that short-term SO
2, NO
2, and O
3 exposure are associated with certain effects on the indicators of metabolic health in patients with metabolic syndrome [
26].
In Mexico, some epidemiological studies have assessed the association between atmospheric pollutants and mortality; however, there are not enough data or available information to describe the current prevailing situation in most metropolitan areas of the country. Therefore, the present study aimed to estimate the association between criteria air pollutants and daily mortality from 2012 to 2015 in 11 municipalities within the MAMC, considering an analysis by gender, age group, and specific cause of death (respiratory and circulatory diseases). In addition, to estimate the association between air pollutants and mortality, the present study assessed the effects of a hypothetical scenario in which the daily mean concentrations of atmospheric pollutants increases by 10%. This hypothetical scenario enabled the quantification of the number of concentration values above the limit of the regulations for each pollutant in each municipality, and, finally, the identification of the municipalities in which the relative risk was higher and the population sub-group of interest more vulnerable.
2. Materials and Methods
2.1. Study Area
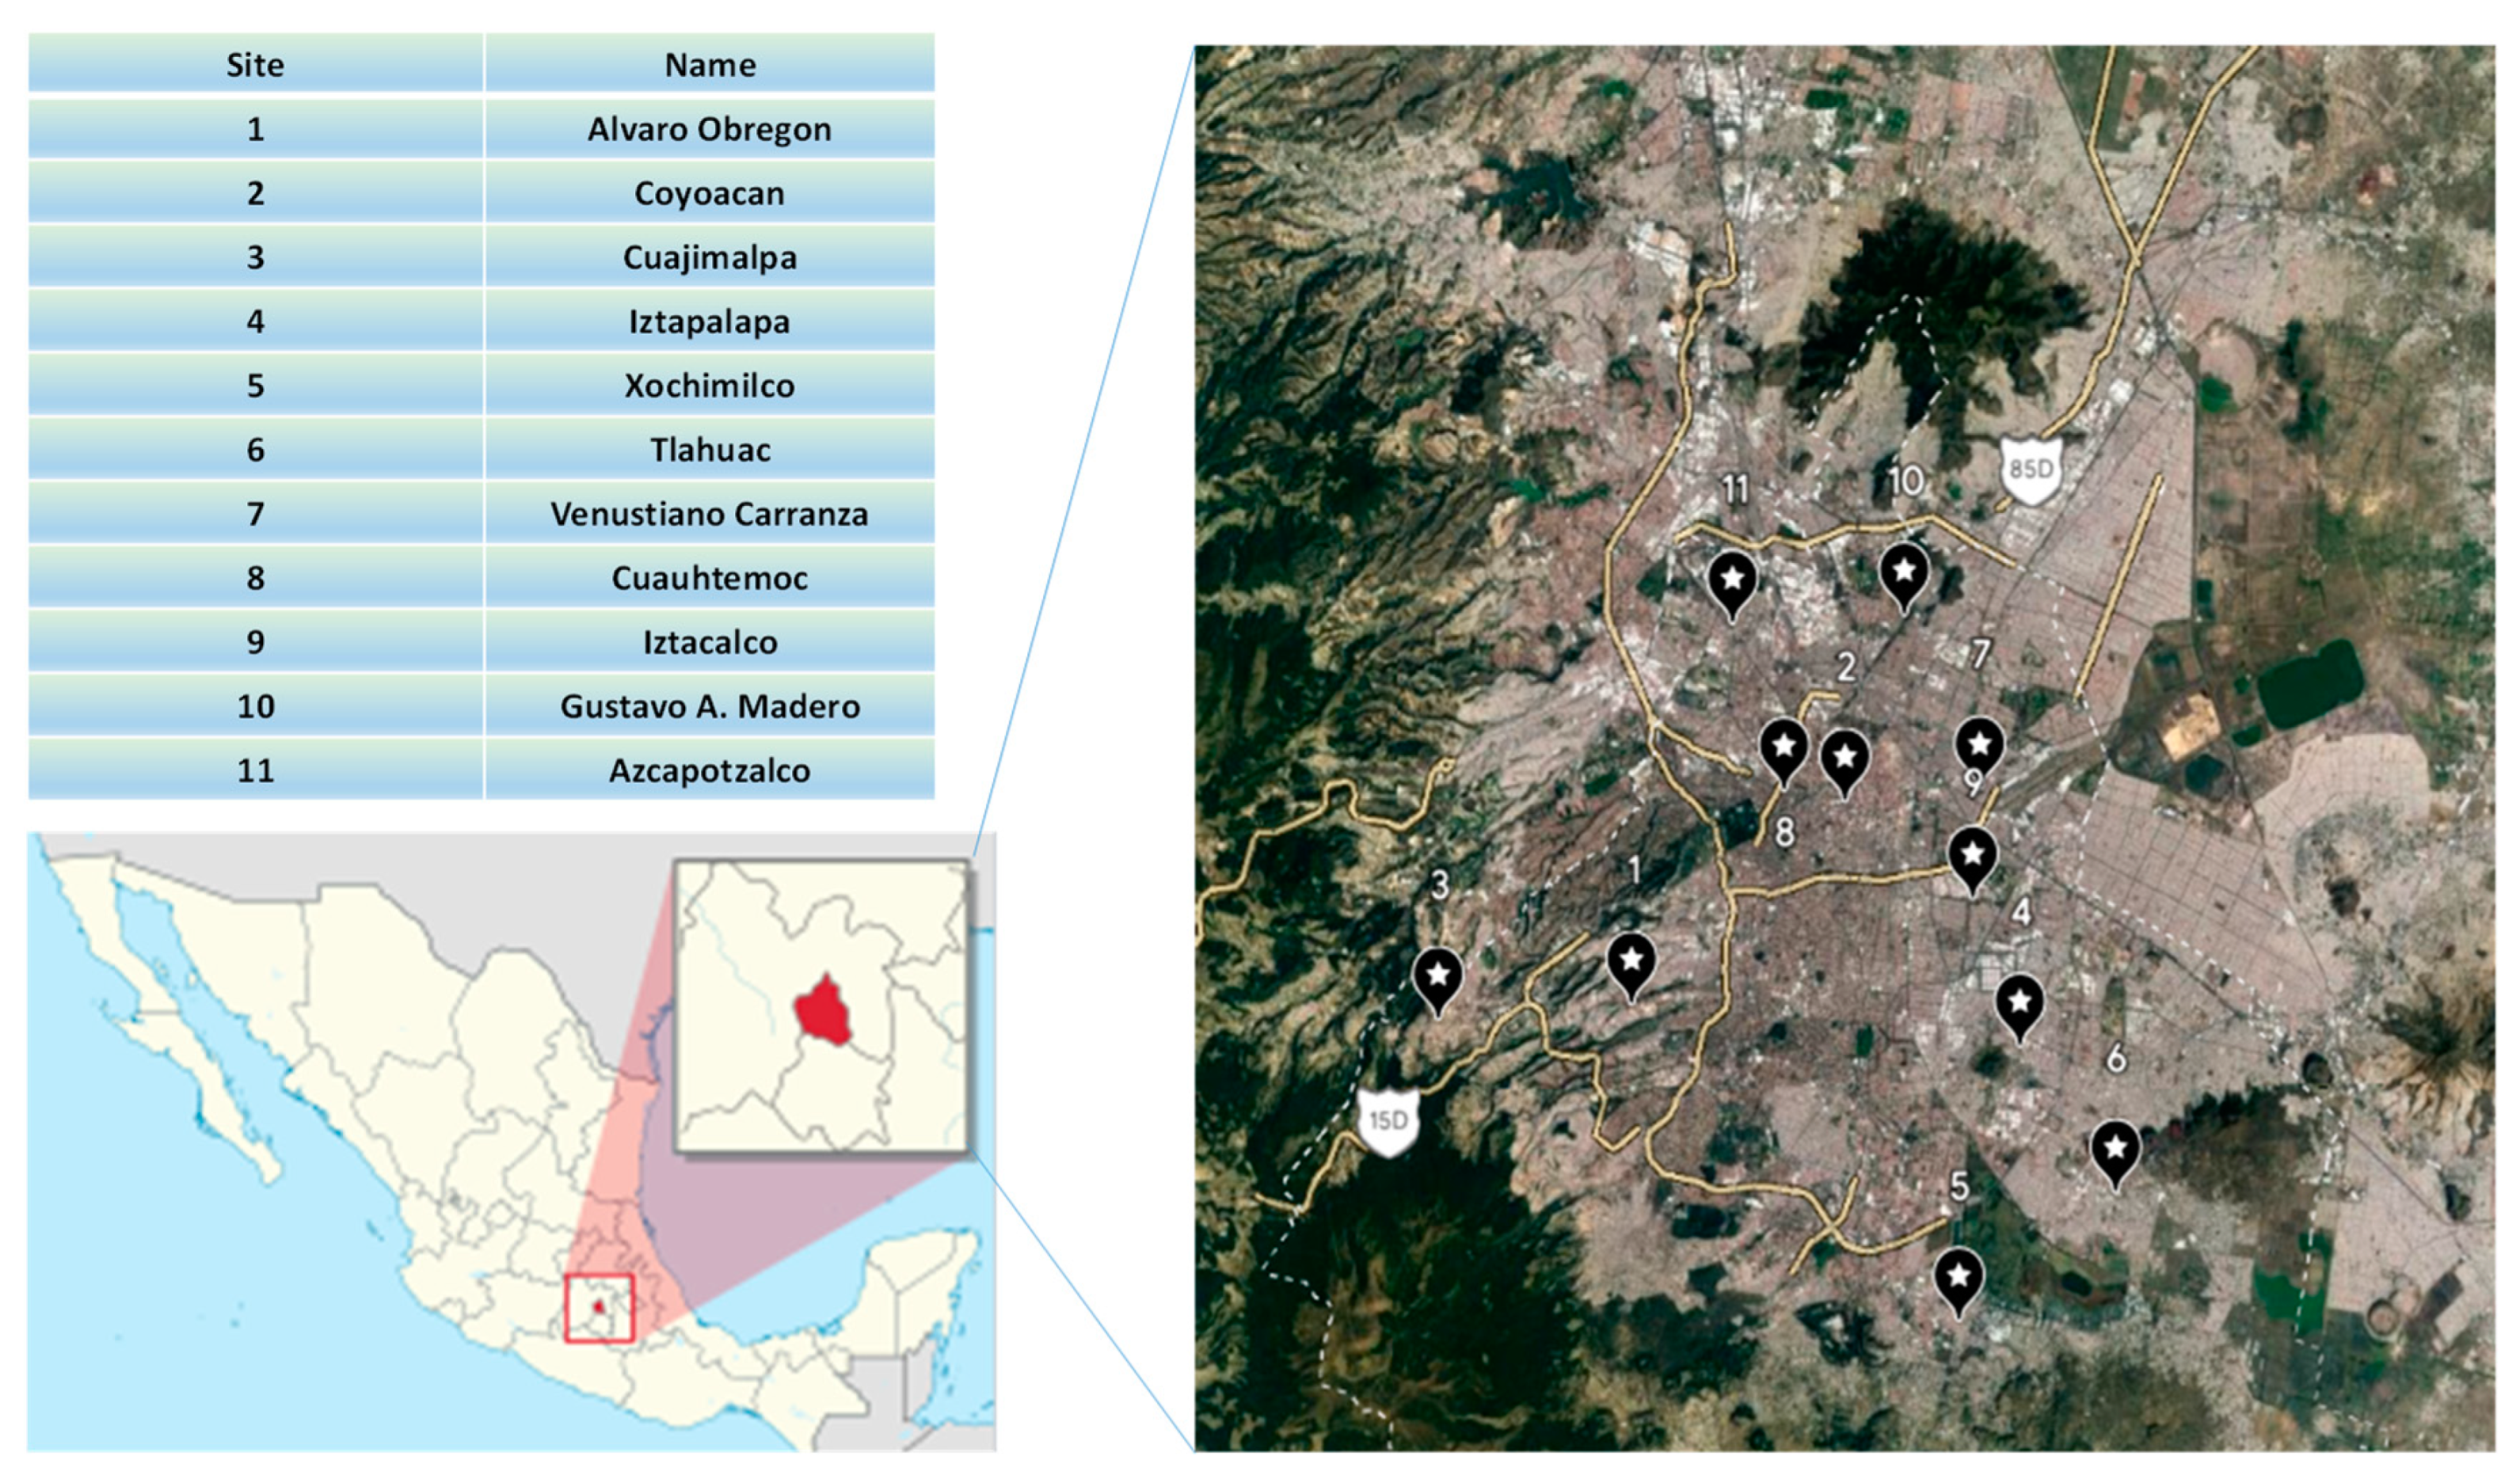
The MAMC is one of the world’s largest metropolitan areas and is the largest city in North America, with a population of approximately nine million inhabitants. Because Mexico City is located in a valley, its topography and meteorological conditions are complex and do not promote the effective dispersion of air pollutants. Therefore, both a notably large population and poor air quality coexist in this area. Although Mexico City is divided into 16 municipalities, solely the 11 municipalities for which validated air quality data were available were included in the present study. The location of the municipalities is shown in
Figure 1.
2.2. Air Quality and Meteorological Data
Air quality pollutants levels (CO, NO
2, SO
2, O
3, and PM
10) and meteorological data (temperature and relative humidity) for 11 municipalities in the MAMC were obtained from the National Air Quality Information System (SINAICA: Sistema Nacional de Información de la Calidad del Aire) from 2012 to 2015. Criteria air pollutants were measured via an automatic monitoring network using standardized methods (
Table 1).
Meteorological parameters related to health impact were included in the analysis as they are explicative variables for the association between atmospheric pollutants and daily mortality. Air pollution increases during extremely cold and extremely warm periods due to the intensive use of heating and air conditioning equipment, which results in higher emissions of atmospheric pollutants. In addition, during the winter season, thermal inversions that inhibit the dispersion of pollutants are frequent in Mexico City [
28]. Moreover, the probability of deaths in the vulnerable population (children under five years old and adults older than 60 years) increases with extreme temperatures during the warm and cold months, while relative humidity has a negative impact on health by changing the conditions in which some diseases develop.
2.3. Applicable Regulatory Framework
The Mexican Federal Government is the responsible for establishing reference values in order to protect public health. These values are published as the Official Mexican Standards (NOMs) and are obligatory at a national level. The maximum permissible levels established in the NOMs are as follows:
For O
3: 0.090 ppm (1 h average data) and 0.065 ppm (8 h moving average data) [
29];
For CO: 26.0 ppm (1 h average data) and 9.0 ppm (8 h moving average data) [
30];
For NO
2: 0.106 ppm (1 h average data) and 0.021 ppm (annual average) [
31];
For PM
10: 70 µg m
−3 (24 h daily average data) and 36 µg m
−3 (annual average) [
32]; and,
For SO
2: 0.075 ppm (1 h average data) and 0.040 ppm (24 h daily average data) [
33].
The present study estimated the values above the reference values established for each criteria air pollutant, while the time series for each pollutant and each meteorological variable were compiled considering average daily and maximum daily values. In some cases, data obtained from automatic monitoring stations do not always enable continuous registering, while, in other cases, data for a specific pollutant are missing. Therefore, to complete the database for the 2012–2015 period for each station, it was necessary to establish some inclusion criteria, firstly, to decide which stations would be included and, secondly, to establish whether data were missing from one or more of the stations. Therefore, it was necessary to define how missing data would be imputed to complete the database. The following criteria were applied:
Valid data percentage: The estimation of mean concentrations for each pollutant solely considered values from monitoring stations that presented a >75% valid data percentage. In addition, it was necessary to apply an imputation method for stations consistently presenting missing data despite providing valid data percentages.
Imputation of missing data: Isolated or intermittently missing data from a database corresponding to a monitoring station were completed using the NIPALS approach to imputing missing data.
2.4. Epidemiological Data
Studies on air pollution exposure and its effects on health are scarce in developing countries. The main challenge in this field is to collect reliable data in the fields of both health and air quality, mainly because the collection, storage, and validation procedures are neither continuous nor uniform in these countries. While SINAICA makes great efforts to collect air quality information for several cities in Mexico, there is no national system for collecting health data (mortality and morbidity). For this reason, the present study obtained mortality data for each municipality in Mexico City on a monthly and annual basis from the database maintained by the National Institute of Statistics and Geography (INEGI). The INEGI mortality database uses the international classification of diseases established by the World Health Organization (WHO) review CIE-10/2 for respiratory system (J00–J99) and circulatory system diseases (I00–I99). Therefore, the mortality data were assessed by cause of death (all causes, respiratory, and circulatory), gender (male and female), and age group (<1 year, 1–4 years, 5–59 years, 60–74 years, and >75 years).
2.5. Design of the Epidemiological Analysis
The design of the epidemiological analysis adhered to the following stages:
Description and assessment of temporal variations in mortality rate on a monthly basis for all populations and all population sub-groups, by age, gender, and specific cause of death from 1 January 2012 to 31 December 2015.
Description and assessment of temporal variations in criteria air pollutants concentrations on a monthly basis from 1 January 2012 to 31 December 2015.
Diagnosis of air quality: Values above the reference values established as maximum permissible limits in the NOMs for each criteria air pollutant and each municipality were obtained.
Estimation of the magnitude of the association between mortality (by all causes of death and by specific cause of death) and air pollutants concentrations for each municipality and population sub-group. During this stage, the meteorological variables (temperature and relative humidity) were included.
Study Subject:
Number of deaths occurring in the study area from 1 January 2012 to 31 December 2015.
Variables:
- (A)
Response variables: Number of monthly and daily deaths for each municipality during the study period, considering different causes of death: respiratory, circulatory, and all causes.
- (B)
Explanatory variables: Criteria air pollutants (quantitative explanatory variable), monthly and daily mean concentration values for O3, SO2, CO, NO2, and PM10 for each municipality during the study period. Meteorological variables (quantitative explanatory variable): monthly and daily mean values for temperature and relative humidity for each municipality during the study period. Gender (qualitative explanatory variable): number of deaths by gender. Age (qualitative explanatory variable): number of deaths by age group.
- (C)
Control variables (seasonality): Seasons were classified as cold months (from November to February) and warm months (from May to August).
- (D)
Confusion variables: Temperature and relative humidity
- (E)
The delay in the effect of the confusion variables was considered: the time series were pretreated, wherein the time delay from cross correlations of the series (mortality vs. temperature and mortality vs. relative humidity) was estimated by using Infostat software v. 2008 [
34], with time delays selected according to their significance level. The epidemiological data series were smoothed, as they mostly presented collinearity and non-linear relationships with some variables (for example, temperature and relative humidity); therefore, a non-parametric method (LOWESS: locally weighted regression scatterplot smoothing) was applied. The air quality data series were pretreated (smoothed) using the ARIMA method (autoregressive integrate moving average) (Box–Jenkins model) [
35].
2.6. Estimation of the Magnitude of the Association between Mortality, by All Causes of Death and by Specific Cause of Death, and Atmospheric Pollution Concentrations for Each Municipality and Population Sub-Group
Once the time series had been treated and smoothed, it was possible to apply a Poisson model, thus reducing Pearson residuals. The time series were smoothed using XLSTAT statistical software v. 2017 “
https://www.xlstat.com/es/ (accessed on 17 September 2022)”.
2.6.1. Multivariate Analysis
A principal component analysis (PCA) and a linear regression analysis (LRA) were applied to the data series for mortality, criteria air pollutants, and meteorological variables. The PCA was used to obtain the principal components contributing to the highest percentage of data variability (F
1 and F
2 axes) [
36,
37]. The PCA and LRA were carried out using XLSTAT software v. 2017. To confirm whether a group of variables were strongly correlated, the cosine squared table was assessed. Each factor included a set of variables, which represented the degree of association among them, taking into account those presenting the highest factor loadings and greatest statistical significance. The criterion used to ascertain whether or not to include a variable in the basal model was a
p < 0.10 deviance. A first approach was attempted with the basal model including all variables by cause of death and pollutant. Based on the PCA and LRA analysis, the variables that contributed largely to explaining the variability of the data of the dependent variable (daily mortality) were identified and then they were included in the Poisson model. The foregoing was carried out considering different causes of death: respiratory, circulatory, and all causes of death, different age groups, and stratified analysis (warm and cold months).
2.6.2. Relative Risk Index for Daily Mortality Associated with Atmospheric Pollution
For each mortality series, a Poisson regression model was built to explain the fluctuations in daily mortality relative to explanatory and confusion variables. The same methodology as APHEA [
38] and EMECAN [
39] was used for the application of the Poisson model. First, a basal model was identified for each cause of death from the possible confusion variables. Once the basal model had been established, the model was extended for each pollutant and its time delays. The construction of the auto-regressive Poisson model allowed determining if the response variable depends, or not, on other variables. If independent variables have a significant effect on the response variable (for a confidence interval of 95% and
p < 0.05), these effects can be assessed by means of the beta coefficient of each independent variable in the Poisson regression model. The general model to relate the response variable with different independent variables was obtained as follows:
where
Ey is the expected number of cases,
,
are the model constants, and
are the explanatory variables. Once the Poisson regression had been carried out using the basal model, the beta coefficients were obtained and used to estimate the
RRI as follows:
where,
RRIi is the relative risk index associated to the explanatory variable
i by increment unit of this variable, and
is the regression coefficient associated to the explanatory variable
i in the model. Subsequently, the concentration of each pollutant and meteorological variable considered by the model was increased by 10% separately. From this assumption, the regression parameters were obtained again and the Poisson distribution was then applied (taking this increase into account and keeping the remaining variables unchanged). With the obtained
values from the fitted model, the relative risk index was estimated for mortality considering an increase of 10% in the magnitude of each explanatory variable in order to determine the derived effect from an increase in concentration for a given criteria air pollutant. This procedure was applied for each municipality and for each criteria air pollutant. The Poisson regression analysis was carried out using XLSTAT statistical software v. 2017 “
https://www.xlstat.com/es/ (accessed 17 September 2022)”.
2.7. Mapping the Relative Risk Index for Each Municipality
Mapping of relative risk indexes (RRI) of daily mortality by all causes associated to each pollutant was carried out by using QGIS v. 2.14.7, a geographic information system, from spatial data of vector type including the geographically referenced municipalities. The information was obtained from the National Institute of Statistic, Geography and Informatics (INEGI).
4. Conclusions
The SO2 concentrations obtained by the present study were uniform, except for sites 7, 8, 9, and 11, with site 11 (Azcapotzalco) corresponding to the municipality presenting the highest concentrations of this pollutant. The CO concentrations obtained were highly variable, with sites 4, 7, 9, and 11 corresponding to the municipalities presenting the highest levels. A high level of variability was observed for NO2 concentrations, an expected finding as these depend on the peak hours of vehicular traffic, with the highest concentrations found at sites 7, 8, 9, 10, and 11. The variability observed in O3 levels was lower than that observed for CO and NO2, with the highest levels found at sites 1, 3, 5, and 6. Finally, the highest PM10 levels were observed at sites 4, 7, 8, and 11.
Except for ozone, all criteria air pollutants tested presented their highest levels at sites 7, 9, and 11, which correspond to Venustiano Carranza, in the north of the city, Iztacalco, in the center of the city, and Azcapotzalco, located in the north of the city. Therefore, it can be concluded that the areas of Mexico City in which air quality can be considered unacceptable in terms of the official standards are located in the center and north. The concentrations of O3 presented a different spatial distribution, with the highest levels found in the municipalities of Alvaro Obregon (located in the center area), Cuajimalpa (located in the southwest area), Xochimilco (located in the south of the city), and Tlahuac (located in the southeast of the city). Therefore, it can be concluded that the areas of Mexico City in which the air quality was unacceptable in terms of ozone concentrations were located in the center and the south.
Mortality during the study period presented a seasonal pattern, with the highest number of deaths occurring during the cold months and the winter season. While site 11 (Azcapotzalco) and site 7 (Venustiano Carranza) presented the highest mortality rates, site 4 (Iztapalapa) and site 10 (Gustavo A. Madero) contributed in great proportion to total mortality in Mexico City. By age group, the daily mortality values were higher in the population aged over 60 years, suggesting that this group was the most vulnerable. Women presented a higher number of deaths than men, while, by specific cause of death, women presented a higher level of mortality by circulatory causes of death than men, who presented a higher number of deaths due to respiratory causes.
Most of the sites studied exceeded the maximum permissible limit established by the Mexican standards [
33] for SO
2, with site 11 (Azcapotzalco) presenting the highest number of values above the limit. All sites exceeded the values established by the international air quality standards (WHO and U.K. regulations). No municipality exceeded the maximum permissible limit established by the Mexican regulations [
30] for CO, although the CO limit established by the WHO was exceeded in all municipalities. Except for sites 1 and 6, all municipalities exceeded both the established limit for NO
2 by the Mexican [
31] and the international standards; an expected finding as the values established by the international standards are very close to those established in the Mexican regulations [
31]. No municipality exceeded the maximum permissible limit established in Mexico for ozone [
29], which coincides with the U.S. EPA air quality standard value. Finally, except for site 3, all sites studied exceeded the maximum permissible limit for PM
10 [
32] with values that also exceeded the limits established in both the U.K. regulations and the WHO standards.
The PCA and RLM results showed that sites 4, 7, 9, and 11 presented the highest R2 values. The estimation of the RRI values revealed that site 11 (Azcapotzalco) presented a high-level association between daily mortality and NO2, O3, and PM10 concentrations for people aged over 60 years. Site 7 (Venustiano Carranza) presented a significant association between daily mortality and SO2, CO, O3, and PM10 concentrations for respiratory diseases. The NO2 concentrations showed a significant association with mortality, by all causes of death, at site 9 (Iztacalco) for people aged over 60 years.
In terms of the hypothetical 10% increase in SO
2 levels, an increase of 0.22% was projected for site 10 (Gustavo A. Madero) and an increase of 0.18% for site 11 (Azcapotzalco). The highest projected increases in daily mortality for this hypothetical scenario for CO concentrations were at site 7 (Venustiano Carranza), site 8 (Cuauhtemoc), site 10 (Gustavo A. Madero), site 11 (Azcapotzalco), site 9 (Iztacalco), and site 4 (Iztapalapa). Although no municipality was projected to exceed the maximum permissible limit established in Mexico for CO [
30], the projections for all municipalities exceeded the international air quality standards, suggesting that the Mexican regulations for CO should be reviewed, as all sites also presented significant RRI values. The hypothetical 10% increase in NO
2 levels resulted in a significant increase in daily mortality at site 9 (Iztacalco), site 2 (Coyoacan), site 10 (Gustavo A. Madero), and site 4 (Iztapalapa). However, the hypothetical scenario for ozone levels did not correspond to a significantly increased risk in mortality in Mexico City. This finding coincides with the air quality results obtained in the present study, as no municipality exceeded the maximum permissible limit established for ozone [
29]. Finally, a hypothetical 10% increase in the daily mean concentrations of PM
10 presented a significant projected increase in the risk of mortality for site 11 (Azcapotzalco), site 4 (Iztapalapa), site 1 (Alvaro Obregon), site 7 (Venustiano Carranza), and site 3 (Cuajimalpa).
It should be noted that the RRI values for PM10 were the highest found for the hypothetical scenario considered by the present study, suggesting that the Mexican government should take action to reduce this risk. In this regard, during the 2019–2021 period, all regulations in Mexico were updated with stricter maximum permissible limits, although these levels remain below those recommended by the WHO. Therefore, the present study should be repeated in Mexico City, in order to take into account the limits established by the updated regulations. Finally, decision makers will be able to use the data reported in the present study to propose or improve the current regulations, programs, or actions focused on protecting the population aged >60 years against the effects of atmospheric pollution in Mexico City.


 ,
, 


