Article

Lightning-Ignited Wildfires beyond the Polar Circle

by
Viacheslav I. Kharuk
1,2,3,*,
Maria L. Dvinskaya
1,3,
Alexey S. Golyukov
1,2,3,
Sergei T. Im
1,2,3,4,5 and
Anastasia V. Stalmak
1,2
1
Sukachev Institute of Forests, Federal Scientific Center, Russian Academy of Science, Siberian Branch, Academgorodok 50/28, Krasnoyarsk 660036, Russia
2
Institute of Space and Information Technologies, Institute of Ecology and Geography, Siberian Federal University, Svobodny Str. 79, Krasnoyarsk 660041, Russia
3
Laboratory of Biodiversity and Ecology, Tomsk State University, Lenina Str. 36, Tomsk 634050, Russia
4
Institute of Space Research and High Technologies, Reshetnev Siberian State University of Science and Technology, Krasnoyarsky Rabochy Str. 31, Krasnoyarsk 660014, Russia
5
Institute of Natural Sciences and Mathematics, Katanov Khakassian State University, Lenina Str. 90, Abakan 655000, Russia
*
Author to whom correspondence should be addressed.
Atmosphere 2023, 14(6), 957; https://doi.org/10.3390/atmos14060957
Submission received: 10 April 2023 / Revised: 25 May 2023 / Accepted: 27 May 2023 / Published: 30 May 2023
(This article belongs to the Special Issue Atmospheric Electricity and Fire in a Changing Climate)

Abstract

:
Warming-driven lightning frequency increases may influence the burning rate within the circumpolar Arctic and influence vegetation productivity (GPP). We considered wildfire occurrence within the different Arctic sectors (Russian, North American, and Scandinavian). We used satellite-derived (MODIS) data to document changes in the occurrence and geographic extent of wildfires and vegetation productivity. Correlation analysis was used to determine environmental variables (lightning occurrence, air temperature, precipitation, soil and terrestrial moisture content) associated with a change in wildfires. Within the Arctic, the majority (>75%) of wildfires occurred in Russia (and ca. 65% in Eastern Siberia). We found that lightning occurrence increase and moisture are primary factors that meditate the fire frequency in the Arctic. Throughout the Arctic, warming-driven lightning influences fire occurrence observed mainly in Eastern Siberia (>40% of explained variance). Similar values (ca. 40%) at the scale of Eurasia and the entire Arctic are attributed to Eastern Siberia input. Driving by increased lightning and warming, the fires’ occurrence boundary is shifting northward and already reached the Arctic Ocean coast in Eastern Siberia. The boundary’s extreme shifts synchronized with air temperature extremes (heat waves). Despite the increased burning rate, vegetation productivity rapidly (5–10 y) recovered to pre-fire levels within burns. Together with increasing GPP trends throughout the Arctic, that may offset fires-caused carbon release and maintain the status of the Arctic as a carbon sink.

1. Introduction

Throughout Holocene, wildfire is a major natural factor that shapes boreal forest communities’ structure and successions [1,2,3]. Fire has long been the primary disturbance agent for vast taiga landscapes. However, wildfires are a recent driver for tundra ecosystem dynamics. Since the onset of the current warming, the burning rate has increased throughout the boreal biome, including, alongside forested areas, the Arctic tundra [4,5]. It has been known that the fire regime is determined by fuel availability, fuel flammability, and a fire ignition source. Fuel in the Arctic tundra and forest-tundra is available as open forests, woody shrubs, moss, lichens and herbaceous species, and peat deposits. Current warming may increase fuel flammability by moisture decrease.
The dominant source of fire ignition (>90%) at high latitudes is lightning strikes [6].
Meanwhile, lightning activity is non-linearly dependent on temperature [7]. Krause et al. [8] showed that global cloud-to-ground lightning activity would increase by up to 21.3% for the RCP85 projection at the end of the century. Although the international burned area will be slightly affected by these changes, significant burned area increases (over 100%) are expected in high-latitude regions. Recent studies [9] showed that warming will lead to a global decrease in lightning. However, that decrease will be observed geographically at low latitudes, whereas lightning activity will increase in the Arctic. Data obtained by World Wide Lightning Location Network (WWLLN) indicated an increase in lightning frequency during the recent decade [10]. Atmospheric warming leads to an increase in lightning frequency in the Arctic [11].
Consequently, it has the potential to further increase the burning rate throughout the Arctic, including the Greenland tundra [3,12,13,14]. The fire return interval in the northern areas has shortened from that reported earlier [15,16]. Arctic fires coupled with warming tend to transform tundra into shrublands [17] and potentially accelerate the northward expansion of trees [18,19,20]. However, our knowledge of the warming-driven lightning influence on the fire in the Arctic is still poor [5].
Throughout the Arctic, especially West Siberia and Canada, forest-tundra and tundra ecoregion largely consists of lowland taiga forests and wetlands that have accumulated carbon (C) throughout the Holocene. Increased frequency and extent of fire have released long-stored carbon into the atmosphere and threaten to transform the high latitude territory from a C sink to a source of C [21,22]. Increased C in the atmosphere can fuel a positive feedback loop, increasing warming and fire frequency [23]. Meanwhile, increased CO2 provides a C-fertilization with consequent increasing C fixation and primary productivity at high latitudes [24,25,26,27,28]. Thus, analysis of tree ring chronologies linked increased radial growth for subarctic forests in Canada and Siberia with atmospheric warming [29,30,31]. CO2 fertilization and warming may potentially offset C loss from increased wildfire.
Due to the geographic scale and remoteness of Arctic regions, wildfire analysis is primarily based on satellite data with a resolution of 250–1000 m (e.g., MODIS, Vegetation, or VIIRS instruments) [32,33,34]. Detailed fire influence and post-fire vegetation succession analysis is based on medium (10–30 m) and high (1–2 m) resolution instruments (Landsat, Sentinel, or QuickBird [35,36,37,38]. MODIS data also provide coordinates of fire ignitions (“thermal points” or “hotspots”) [39].
Here, we report on the fire occurrence dynamics in the 21st century within the circumpolar Arctic. We test the hypotheses that (1) warming-driven lightning frequency increase has caused a frequency increase in fires, and (2) the northern limit of fire occurrence has migrated northward to the Arctic Ocean.
We seek to answer the following questions:
(i) What are the dynamics of fire occurrence, fire season duration, and the position of the northern boundary of fire occurrence in different Arctic sectors (i.e., European and Siberian Russia, Scandinavia, and Northern America)?
(ii) What is the relationship between the fire parameters and environmental variables (lightning strikes, air temperature, drought index SPEI, precipitation, soil moisture, and terrestrial water content)?
(iii) What are the patterns of post-fire recovery of Gross Primary Productivity (GPP)?

2. Materials and Methods

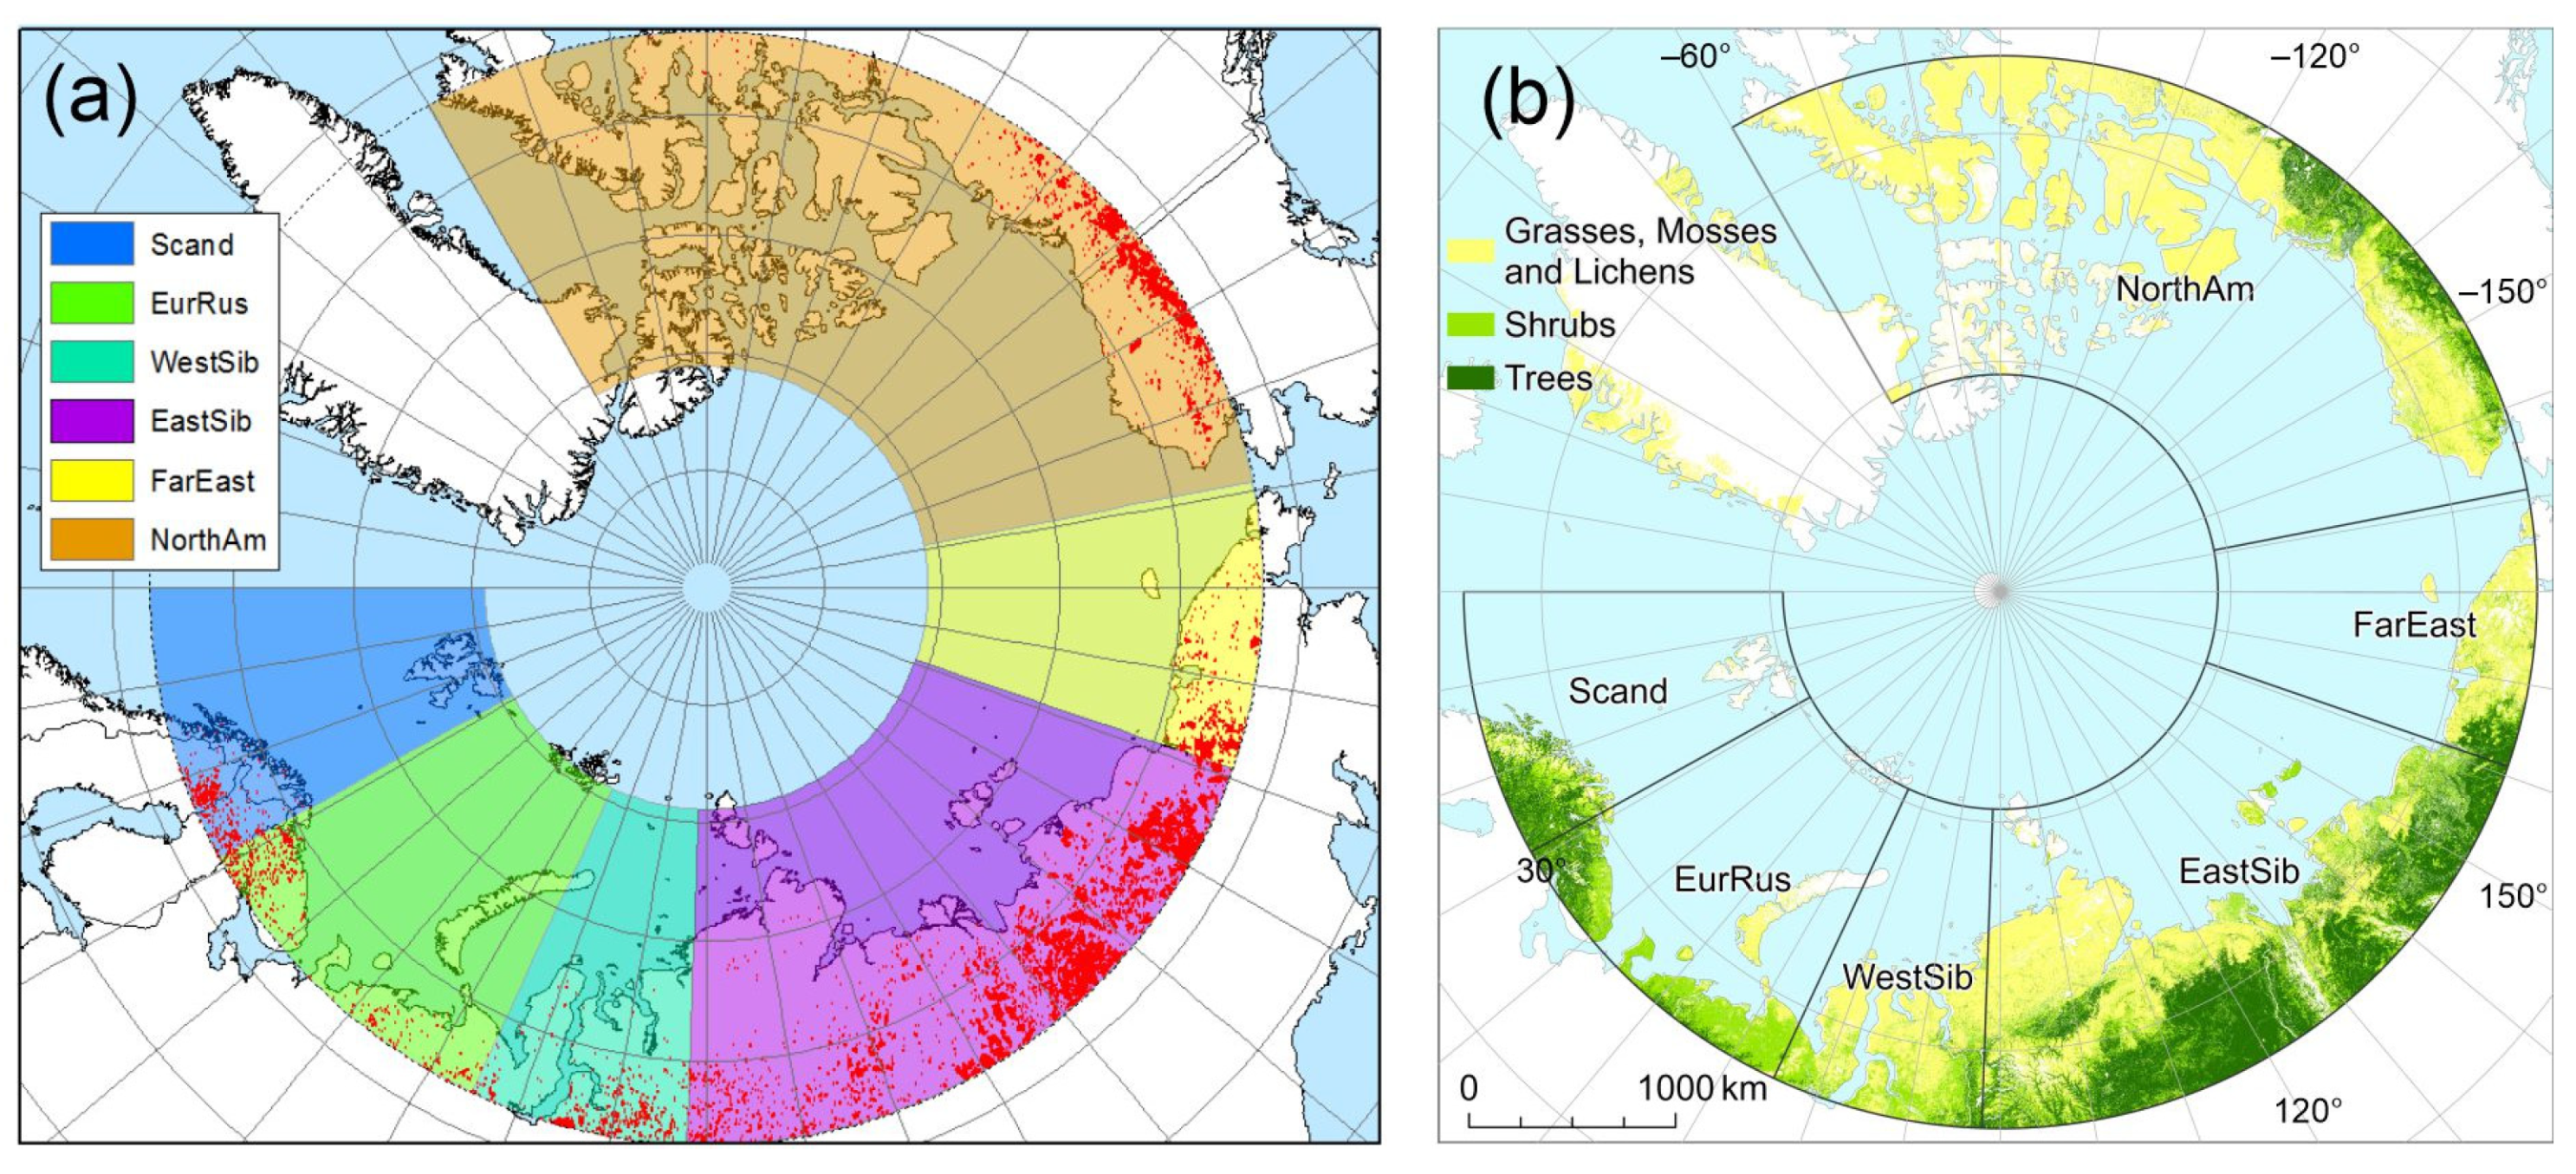
2.1. Geography and Vegetation of the Study Area

The study area includes Eurasian and American continental territories beyond the Arctic Circle (i.e., north of 66°32′ N). The huge Greenland island was not included since the number of fires for the whole period of observations was low (ca. 300+). The Arctic territory was divided into six sectors: (1) European Russia, (2) Western and (3) Eastern Siberia, (4) Far East, (5) Scandinavia, and (6) Northern America (Figure 1). The sector of European Russia included territories from the Kola Peninsula to the Ural Mountains. In that sector, the landscape is mostly a plane. Western Siberia spreads from the Ural to the Yenisei River and includes the northern part of the West Siberian Plain. Eastern Siberia spreads from the Yenisei River to Chukotka Peninsula and includes Mid Siberian Plateau, East Siberian Mountains, and northern plains with adjusted plateaus and mountains. The Far East sector is mainly influenced by the Arctic and Pacific oceans and includes the Chukotka Peninsula.
The main vegetation types presented within the Arctic are presented in Table 1 (based on the MODIS Land Cover Type (MCD12Q1) [40].
The generalized vegetation types (i.e., (i) trees, (ii) shrubs, (iii) grasses, mosses, and lichens) are presented in Figure 1b.

2.2. Fire Occurrence Determination

We calculated the fire occurrence dynamics, fire season duration, and the northern limit of fire occurrence. The dynamics of the northern limit of fire occurrence were calculated based on the mean of three maximum values for each year within the 2001–2022 period. I.e., we computed the mean of the three maximum values for each year, and then this mean value was assigned to each year. Fire occurrence was calculated based on the analysis of thermal points (“hotspots”) acquired by Terra/Aqua/MODIS. The data (N = 375,083 hotspots with spatial resolution 1 × 1 km) were obtained from the MODIS Collection 6 database package MCD14DL [41]. The false hotspots were filtered by following procedures.
(1) Within package MCD14DL, hotspots from an active volcano, other static land sources, and offshore were removed. That package contained hotspots that presumed vegetation fire.
(2) We additionally removed hotspots located out of vegetation cover based on the MODIS Land Cover Type (MCD12Q1) [40].
(3) Finally, we excluded hotspots caused by settlements and industrial infrastructures located within vegetation cover. For this purpose, we used expert-based analysis of (a) topographic maps and (b) high-resolution satellite scenes from Google Earth (https://earth.google.com/web (accessed on 27 March 2023)), Bing Maps (https://www.bing.com/maps (accessed on 27 March 2023)), and Yandex Maps (https://yandex.ru/maps (accessed on 27 March 2023)). On-ground resolution of these satellite scenes enabled the detection of those objects. After that filtering, the final number of hotspots was N = 325,352.

2.3. Environmental Data

We analyzed fire occurrence rate versus the following variables: lightning strikes’ occurrence, air temperature, drought index SPEI, precipitation, soil moisture, and terrestrial water content. The World Wide Lightning Location Network (WWLLN) provided the lightning strikes occurrence data for the entire Arctic for 2010–2020 [10,11]. We assume that the detection efficiency of the WWLLN lightning is uniform throughout the Arctic. We generate the lightning strikes index (LSI), which is a normalized unitless metric that varies between 0.0 (no lightning) and 1.0 (maximal number of strikes for the entire period [5].
Monthly air temperature, precipitation, and soil moisture content (0–7 cm depth) were obtained at a spatial resolution of 0.1° × 0.1° from the ERA5-Land dataset [42]. In the statistical analysis, we used temperature, precipitation, and moisture data obtained within the location of each given hotspot. The drought index SPEI (the Standardized Precipitation Evapotranspiration Index) monthly values were obtained from the Global Drought Monitor (https://spei.csic.es/map/maps.html (accessed 27 March 2023)). The SPEI is a measure of air moisture content, and it is defined as the difference between total precipitation and potential evapotranspiration [43]. The terrestrial water content (or EWTA, Equivalent of Water Thickness Anomalies; hereafter TW) is the product of gravimetric measurements (in cm−1) by the GRACE/GRACE-FO satellites with on-ground resolution 1° × 1° [44], which is characteristic of the moisture regime and represents total terrestrial water storage. Monthly EWTA data were obtained from the GFZ database (https://podaac-opendap.jpl.nasa.gov/opendap/hyrax/allData/tellus/L3 accessed on 15 October 2022). Temporal dynamics of air temperature, precipitation, soil moisture, terrestrial water content, and SPEI drought index in Arctic sectors are presented in Figure S1 (from Supplementary Material) for the analyzed period 2001–2022.
To estimate vegetation recovery after fire, we analyzed the temporal dynamics of the gross primary productivity (GPP) for the 325,352 distinct fire locations within the Arctic Circle. GPP values were obtained from the Terra/MODIS product MOD17A3HGF at temporal and spatial resolutions of 8 days and 500 m2, respectively (https://search.earthdata.nasa.gov (accessed on 27 March 2023)) [45].
To ensure statistically significant results for the calculations of trends, the minimal time interval used was equal to five years since the year of the fire. Consequently, trends data covered the period from 2001 until 2018. Trends were calculated based on the Theil–Sen non-parametric estimator [46,47]. This estimator is more accurate than linear regression [48]. We obtained the Theil–Sen estimator in Python programming language from the library pymannkendall 1.4.2 (https://pypi.org/project/pymannkendall (accessed on 5 February 2023)). We applied the estimator in ESRI ArcGIS software to analyze the spatial distribution of GPP for 2001–2022.

2.4. Statistical Analysis

The correlations of wildfire variables with eco-climatic variables were tested by Pearson’s correlation coefficients (r) and Spearman’s rank correlation coefficients (rho) in the cases of Gaussian or non-Gaussian distribution, respectively. We applied a multiple linear and hierarchical regression analysis realized in the R-project for statistical computing (R version 4.1.3; https://www.r-project.org (accessed on 5 February 2023)) and RStudio (version 2023.03.0, https://www.rstudio.com (accessed on 5 February 2023)). R libraries gvlma v.1.0.0.3, AICcmodavg v.2.3.2, trafo v.1.0.1, readxl v1.4.2, and writexl v.1.4.2 were used. Variables to use in regression equations were preliminary selected based on the results of the correlation analysis. Best regression equations were determined using the corrected Akaike information criterion (AICc; second-order AIC) [49]. We analyzed only regression equations with statistically significant (p < 0.05) coefficients of determination (R2) and variables’ coefficients. We used equations only the linear model assumptions passed (p < 0.05) based on tests of GlobalStat, skewness, kurtosis, link function, and heteroscedasticity using the gvlma R library [50]. By hierarchical analysis, we tested the improvement of model relationships between wildfire variables and individually added environmental variables [51]. We used Statsoft Statistica software (https://www.statistica.com (accessed on 5 February 2023)) to realize these analyses. The hierarchical regression analysis allowed us to determine the dispersions intercepted by each variable.

3. Results

Within the Arctic, the majority (>75%) of wildfires occurred in Russia. The fire occurrence in Northern America and Scandinavia were estimated as ca. 24% and <1%, respectively. Within Russia, fires mainly (>85%) occurred in Eastern Siberia.

3.1. Fire Dynamics and Seasonality

For Eurasia and the entire Arctic, annual fire occurrence has been increasing since 2007, whereas for North America and Scandinavia, trends are non-significant (Figure 2a). In the second decade (2012–2022 vs. 2001–2011), the mean fire number increased ca. 3.3 times in Eurasia, 3.7 times in East Siberia, and about doubled in the entire Arctic (Figure 2b).
The majority of fires (ca. 76%) occurred in Russia (including ca. 65% in Eastern Siberia). The highest fire density (ca. 0. 1 for km2) was also observed in Eastern Siberia, which is about four times exceeds that in North America (Figure 3).
The typical seasonal pattern of fire occurrence distribution in the entire Arctic is unimodal. However, for the severe fire years (e.g., 2019), the seasonal distribution turned to a bimodal shape (Figure 4a). The fire season duration is increasing in West Siberia and decreasing in the Far East sector (Figure 4b). In the second decade (2012–2022 vs. 2001–2011), the fire season increased (ca. 43 days; p < 0.1) in West Siberia, whereas in the Far East, it decreased by ca. 19 days (p < 0.05). For the other Arctic sectors, changes were non-significant. Fire season in West Siberia positively correlated to summer air temperatures (rho = 0.40 at p < 0.1), while the decrease for the Far East was related to soil moisture (rho = −0.38 at p < 0.1) and SPEI (rho = −0.47 at p < 0.05).

3.2. Fires Occurrence Relationship with Lightning

Annual lightning strike index increase leads to increasing trends in annual wildfires number in West and East Siberia and the entire Arctic—notable is an exponential dependence of fire numbers on the lightning (Figure 5). Trends in the Far East, European Russia, North America and Scandinavian sectors are non-significant. Thus, an increasing trend for the entire Arctic is attributed to Eastern Siberia input.

3.3. Wildfire Occurrence vs. Climate Variables

Within all Arctic sectors, correlations of fire occurrence with climate variables are similar. Wildfire occurrence increases with air temperature increase and decreases with the increase in moisture variables (precipitation, soil moisture, terrestrial water content, and drought index SPEI) (Figure 6, Figure 7 and Figure 8; in Scandinavia, trends are similar (not shown)). Fire occurrence was mostly influenced by soil moisture (upper 0–7 cm level, which also included the on-ground layer) and terrestrial water content (which indicated the total water storage) (Figure 6c,d, Figure 7c,d and Figure 8c,d).
Fire occurrence dependence on the precipitation is lower, especially in such over-moisture sectors as West Siberia (marshland plain with innumerous lakes) and Far East (the monsoon area) (Figure 6b and Figure 7b). Drought index SPEI relatively lower influenced fire occurrence in comparison with other moisture parameters (Figure 6e, Figure 7e and Figure 8e). Note that a decrease in SPEI indicated an air drought increase by definition.
Air temperature is a driver of fire occurrence in all Arctic sectors (Figure 6a, Figure 7a and Figure 8a) by the indirect influence of fuel on-ground cover flammability.
In the major Arctic sectors, Eurasia and North America, the fire occurrence–climate variables relationship are similar (Figure 8). Meanwhile, fire occurrence in North America is stronger dependent on soil moisture and terrestrial water storage (Figure 8c,d), which may be attributed to the relatively higher moisturizing of the on-ground fuel in that part of the Arctic.
The temporal dynamics of the major fire drivers, terrestrial water (TW) and soil moisture (SM) content, are presented in Figure 9. A decrease in moisture parameters was observed in East Siberia, North America and West Siberia alongside precipitation stagnation or decrease (Figure S1b). Decreasing trends in moisture will lead to an increase in fuel flammability in North America and Siberia.

3.4. Northward Migration of the Wildfire Boundary

In East and West Siberia, the northernmost fire boundary moved further northward and has already reached the Arctic Ocean coast in the part of East Siberia (Figure 1a). The migration of the wildfires’ boundary correlated with the lightning occurrence and mean May–July air temperature (Figure 10).
In West and East Siberia, extreme fire shifts synchronized with May–July air temperature extremes (or “heat waves”, which are indicated by arrows for 2004–2006, 2010, 2012–2014, and 2020) (Figure 11a,b). Similar changes (which were driven mostly by changes in Siberia) were observed in Eurasia and the entire Arctic (Figure 11c,d).

3.5. Relationship of Fire to Lightning Occurrence and Climate Variables: Multiple Regression Analysis

The effect of lightning strikes and climate variables on wildfire occurrence was tested by hierarchical regression analysis. The equations obtained are presented in Table 2.
Estimated lightning input in the wildfire occurrence for the circumpolar Arctic, Eurasia, entire Russia and East Siberia varied within the 40–43% range. Alongside lightning, moisture parameter (terrestrial water content) is also a primary variable that influences wildfire occurrence in the Arctic (Table 2). Partial correlations indicated that soil moisture (0–7 cm upper layer) similarly influenced fire occurrence (Figure 6c, Figure 7c and Figure 8c). Significant correlations were also observed between air temperature and fires (Figure 6a, Figure 7a and Figure 8a). Meanwhile, air temperature indirectly influences fire occurrence, i.e., by drying fuel formed by moss, lichens, woody debris, etc. Precipitation also indirectly influenced fires by decreasing fuel flammability (Figure 6b, Figure 7b and Figure 8b).

3.6. Wildfire Influence on the GPP

Fires had a strong impact on the vegetation GPP, significantly (Figure 12c,e,f,h) or strongly decreasing its value (up to ca. zero level; Figure 12b,d,g). The difference in that pattern should be referred to as the fire severity within different Arctic sectors. However, the generalized pattern throughout the entire Arctic indicated a severe fire impact on the GPP vegetation (Figure 12a). Meanwhile, after a fire, vegetation GPP rapidly (within 5–10 y) recovered to pre-fire levels within all Arctic sectors (Figure 12).
Moreover, positive post-fire GPP trends are observed within about 100% of the fire locations throughout the Arctic (Figure 13a). The latter should be attributed to the positive influence of current warming on Arctic vegetation productivity. This is also supported by prevailing GPP-increasing trends within the entire terrestrial Arctic (i.e., fire-affected and intact; Figure 13b). Within the entire Arctic, the proportions of positive, negative, and non-significant GPP trends are 23.5%, 0.6%, and 75.9%, respectively.

4. Discussion

4.1. Lightning vs. Wildfires in the Arctic

Lightning is the primary source of wildfire ignition at high latitudes which is especially efficient during so-called dry thunderstorms that yield no precipitation [6,52]. The results obtained indicate that lightning strikes influence wildfire ignition significantly varied throughout different Arctic sectors. The highest lightning-explained variation in fire occurrence (>40%) was observed in the East Siberian Arctic sector, whereas in the other Eurasian sectors as well as in North America, lightning input is non-significant. For East Siberia, those values exceed the previous estimates, which are attributed to the use in the analysis of environmental variables taken within the location of a given wildfire [5]. A rather strong influence of lightning at the scale of Russia, Eurasia and the entire Arctic (ca. 40%, Table 2) was explained by the input of Eastern Siberia. The rest variance of wildfires is determined mostly by moisture parameters (Table 2). Soil moisture and terrestrial water content are the primary determinants of wildfire occurrence. Thus, in West Siberia, wildfire occurrence is mostly determined by moisture since that territory is over-moistened. Air temperature, as well as precipitation, influence fire occurrence indirectly by affecting fuel flammability. Meanwhile, the warming-driven moisture decreases in North America and East Siberia on the background precipitation stagnation (Figure 8c,d and Figure S1b) are potentially increasing the likelihood that a given lightning strike will result in a wildfire.
Moreover, warming itself is increasing lightning frequency within the circumboreal Arctic [8,9,14]. Research on lightning strikes projects that an increase in air temperature by 1 °C leads to an increase in lightning by about 12% [12]. For the Northern American Arctic, lightning ignition was estimated to increase by 90–230% by the end of this century [14]. Increased lightning-caused wildfires were also reported for forests in North America [13]. In addition to the combustion of aboveground vegetation, wildfires may smolder and overwinter in the carbon-rich wetlands soils and emerge in the spring as described for the Northern American and Siberian Arctic [53,54].
With continued warming, the role of lightning as a source of wildfire ignition is likely to increase both because of a direct increase in lightning frequency and because of the increased availability of dry fuel. Data published by World Wide Lightning Location Network (WWLLN) showed an increase in lightning frequency during the last decade [11]. The exponential dependence of fire number on the lightning frequency is worth noting (Figure 5). In addition, recent modeling [9] predicted that warming would lead to a global decrease in lightning, geographically that will be observed at low latitudes, whereas in the Arctic, lightning activity will increase. Together with lightning increases, negative trends of the significant fire drivers, terrestrial water, and soil moisture content are currently observed (Figure 9). In combination with increased lightning frequency, it could generate a synergy influence on the burning rate in the Arctic.

4.2. Changes in Wildfire Dynamics for the Arctic

In the second decade of the 21st century, wildfire occurrence strongly (>3.0 times) increased in Eurasia and twofold in the entire Arctic, which is mostly attributed to the wildfires in East Siberia (Figure 2b). This data is consistent with the pattern of increased fire in the entire Siberia since the 1990s [55] and in Alaska and Canada [23,56,57]. The highest density of wildfires (i.e., fires number per km2) was observed in East Siberia (0.10/km2), with low values in European Russia, West Siberia, and Scandinavia (ca. 0.01/km2) with moderate values (ca. 0.03/km2) in North America (Figure 3). Meanwhile, for North America, fire Arctic trends are non-significant (Figure 2a), which should be attributed to the differences in the “fuel load” in East Siberia, e.g., the proportion of tundra, shrubs, and trees vegetation (Figure 2b) as well as the differences in the fuel readiness for lightning-caused ignitions. Additionally, relatively short time series may be responsible for the low coefficients of determination and the non-significant trends in North America. Low fire density in Scandinavia, European Russia, West Siberia, and Far East Arctic referred to the Atlantic and Pacific Oceans’ influence and a higher level of firefighting in Scandinavia and, partly, in European Russia. Low fire activity in the West Siberia plain is also explained by the presence of numerous lakes, rivers, and as well as marshlands. On the contrary, East Siberian Arctic included vast territories of plateaus, hills, and mountains.
The seasonal distribution of wildfires in the extreme years changes from typical for the Arctic unimodal pattern to the bimodal pattern, which is typical for lower latitudes [55]. Thus, in extremely dry years, the longer fire season is accompanied by burning peaks both at the beginning and at the end of the fire season.
The increased fire season in West Siberia (plus ca. 40 days) correlated to the air temperature, which, in turn, increased the flammability of fuel. The decreased duration of the fire season in the Far East sector (minus ca. 20 days) was correlated to increased soil moisture, resulting in a decrease in fuel flammability. This suggests that the increase in wildfire frequency is likely due to the combination of a greater land area potentially subjected to wildfire due to dryer ground cover, a longer fire season, and increased lightning frequency as a source of ignition.
In the Arctic, the wildfire boundary is migrating northward; it is also determined mostly by migration in East Siberia, where that boundary reaches the Arctic Ocean coast. The mean boundary shift correlated with air temperature, whereas extreme shifts synchronized with air temperature anomalies (heat waves). Earlier fire boundary advance was noted on the Yamal Peninsula of Western Siberia [15]. This result shows that the relationship of fire to climate is based not just on continuous climate trends but also on heat waves, the spikes in air temperature. The northward migration of the fires’ northern boundary in Siberia is expected to result in an increased number of fires and, consequently, it subjects a greater proportion of Arctic tundra and forest-tundra to wildfire.
The northward migration of the fires’ northern boundary in Siberia is expected to result in an increased number of fires and, consequently, it subjects a greater proportion of Arctic tundra and forest-tundra to wildfires. Consequently, that migration increases the contribution of greenhouse gases from Arctic soils that have accumulated carbon throughout the Holocene, particularly in turf deposits in the wetlands of Western Siberia and Northern America, which has been described as a threat to shifting the status of the Arctic from a sink to a source of carbon [56,57,58].
The increased frequency of fires will likely accelerate the northward migration of the taiga–tundra boundary [18]. Burnt tundra provides “starting places” for shrub and pioneer tree species settlement (e.g., larch, birch, and alder) by reducing competition from fire-sensitive grass, moss, and lichen communities [9]. The migration of shrubs and larch trees into the former tundra has been described for the Yamal Peninsula (Western Siberia) and the Anabar Plateau (Eastern Siberia) [15,17,59,60].

4.3. Potential Influence of Wildfires on the Carbon Balance in the Arctic

The pattern of post-fire recovery is varied within different sectors. Thus, in East Siberia, wildfires sharply decreased productivity almost to zero, whereas in West Siberia and Scandinavia, changes in productivity smooth (Figure 12g,c,h). These differences are likely caused by the different fuel deposits and moisture and, consequently, by the level of fire severity. However, the recovery pattern for the entire Arctic indicated a severe fire impact on the GPP vegetation (Figure 12a). Nevertheless, within all sectors, productivity recovered to the pre-fire level within 5–10 years (Figure 12).
Moreover, positive post-fire GPP trends are observed within ca. 100% of burns in the Arctic (Figure 13a), which should be attributed to the positive influence of current warming on Arctic vegetation productivity. That is supported by countervailing GPP trends within burns throughout the entire Arctic (Figure 13a,b), coincided with the earlier described phenomenon of “tundra greening” (e.g., [25,58,61]) and indicated increased carbon fixation throughout the Arctic. On-ground observations in the Siberian Arctic also indicated increased growth of dominant woody species (larch, spruce, and birch), leading to an increase in woody biomass [30,31,62]. A tall woody shrub (Alnus fruticosa) was reported to replace low-growing moss and lichen vegetation after tundra fires in Western Siberia [17,60]. Although quantitative analysis of the balance between fire-driven carbon loss and carbon accumulation is still poor, these observations support the status of the Siberian Arctic as a carbon sink [62].
Similar findings were reported for the Arctic forests of North America, where net ecosystem biomass production and black spruce growth increased [26,29]. In Alaskan forests, Mack et al. [63] found that severe burning of organic soils shifted tree dominance from slow-growing black spruce to fast-growing broadleaf trees, resulting in a net increase in carbon storage by a factor of five. Increased dominance of deciduous species in the Arctic could increase the carbon residence time and mitigate the release of stored soil carbon into the atmosphere.
Although the circumpolar Arctic is a remote area, it is increasingly the focus for resource extraction. The implications of increased fire, particularly in Western Siberia and Alaska, will pose additional challenges for gas and petroleum exploration.

5. Conclusions

Within the Arctic, the majority (>75%) of wildfires occurred in Russia. The fire occurrences in Northern America and Scandinavia were ca. 24% and <1%, respectively. Within Russia, the fires mainly (>85%) occurred in Eastern Siberia. Wildfire occurrence increased doubled in the Arctic and tripled in Eastern Siberia in the second decade of the 21st century. These fires were caused by a warming-driven increase in lightning together with elevated air temperature, which led to a decrease in soil moisture content and, consequently, fuel flammability. The influence of warming-driven lightning on fires was mostly observed in Eastern Siberia (>40% of explained variance). Similar values at a continental scale (Eurasia) and in the entire Arctic are caused by Eastern Siberia’s input. Driven by increased lightning occurrence and warming, the fires’ occurrence boundary is shifting northward and has already reached the Arctic Ocean coast in Eastern Siberia. Extreme shifts in boundaries synchronize with air temperature extremes (heat waves). Together with the lightning increases, negative trends of moisture parameters may cause a synergy impact on the burning rate in the Arctic. However, rapid GPP recovery, in combination with countervailing positive GPP trends throughout the Arctic, suggests that the circumpolar Arctic continues to serve as a sink for atmospheric carbon.

Supplementary Materials

The following supporting information can be downloaded at: https://www.mdpi.com/article/10.3390/atmos14060957/s1, Figure S1: Dynamics of summer (JJA) (a) air temperature, (b) precipitation, (c) soil moisture, (d) terrestrial water content, and (e) SPEI drought index. Trends are significant at p < 0.05 except for (a) EastSib, (b) FarEast, and (c) WestSib (p < 0.1).

Author Contributions

Conceptualization, V.I.K.; methodology, V.I.K. and S.T.I.; validation, V.I.K., S.T.I. and M.L.D.; formal analysis, S.T.I., M.L.D., A.S.G. and A.V.S.; investigation, V.I.K.; S.T.I. and M.L.D.; resources, S.T.I., M.L.D., A.S.G. and A.V.S.; data curation, S.T.I., M.L.D., A.S.G. and A.V.S.; writing—original draft preparation, V.I.K.; writing—review and editing, V.I.K.; visualization, S.T.I., M.L.D., A.S.G. and A.V.S.; supervision, V.I.K.; project administration, V.I.K.; funding acquisition, V.I.K. All authors have read and agreed to the published version of the manuscript.

Funding

This research was funded by the Tomsk State University Development Program («Priority-2030»).

Institutional Review Board Statement

Not applicable.

Informed Consent Statement

Not applicable.

Data Availability Statement

Publicly available datasets were analyzed in this study. Hotspots’ data MCD14DL available online: https://www.earthdata.nasa.gov/learn/find-data/near-real-time/firms/active-fire-data (accessed on 15 October 2022); MODIS Land Cover Maps MCD12Q1 available online: https://search.earthdata.nasa.gov/search?q=MCD12Q1 (accessed on 15 October 2022); ERA5-Land dataset available online: https://cds.climate.copernicus.eu/cdsapp#!/dataset/reanalysis-era5-land-monthly-means?tab=overview (accessed on 15 October 2022); SPEI (Standardized Precipitation Evaporation Index) available online: https://spei.csic.es/map/maps.html (accessed on 15 October 2022); GFZ GRACE/GRACE-FO EWTA data available online: https://podaac-opendap.jpl.nasa.gov/opendap/hyrax/allData/tellus/L3 (accessed on 15 October 2022); MODIS product MOD17A3HGF available online: https://search.earthdata.nasa.gov/search?q=MOD17A3HGF (accessed on 15 October 2022).

Conflicts of Interest

The authors declare no conflict of interest. The funders had no role in the design of the study; in the collection, analyses, or interpretation of data; in the writing of the manuscript; or in the decision to publish the results.

References

  1. Bowman, D.M.J.S.; Kolden, C.A.; Abatzoglou, J.T.; Johnston, F.H.; Van der Werf, G.R.; Flannigan, M. Vegetation fires in the Anthropocene. Nat. Rev. Earth Environ. 2020, 1, 500–515. [Google Scholar] [CrossRef]
  2. Tymstra, C.; Stocks, B.J.; Cai, X.; Flannigan, M.D. Wildfire management in Canada: Review, challenges and opportunities. Prog. Disaster Sci. 2020, 5, 10004. [Google Scholar] [CrossRef]
  3. Evangeliou, N.; Kylling, A.; Eckhardt, S.; Myroniuk, V.; Stebel, K.; Paugam, R.; Zibtsev, S.; Stohl, A. Open fires in Greenland in summer 2017: Transport, deposition and radiative effects of BC, OC and BrC emissions. Atmos. Chem. Phys. 2019, 19, 1393–1411. [Google Scholar] [CrossRef]
  4. Flannigan, M.; Stocks, B.; Turetsky, M.; Wotton, M. Impacts of climate change on fire activity and fire management in the circumboreal forest. Glob. Chang. Biol. 2009, 15, 549–560. [Google Scholar] [CrossRef]
  5. Kharuk, V.I.; Dvinskaya, M.L.; Im, S.T.; Golyukov, A.S.; Smith, K.T. Wildfires in the Siberian Arctic. Fire 2022, 5, 106. [Google Scholar] [CrossRef]
  6. Ivanova, G.A.; Ivanov, V.A. The fire regime in the forests of the central Siberia. In Forest Fire Management at Regional Level; Furyaev, V.V., Ed.; Alex: Moscow, Russia, 2004; pp. 147–150. [Google Scholar]
  7. Williams, E.; Guha, A.; Boldi, R.; Christian, H.; Buechler, D. Global lightning activity and the hiatus in global warming. J. Atmos. Sol. Terr. Phys. 2019, 189, 27–34. [Google Scholar] [CrossRef]
  8. Krause, A.; Kloster, S.; Wilkenskjeld, S.; Paeth, H. The sensitivity of global wildfires to simulated past, present, and future lightning frequency. J. Geophys. Res. Biogeosci. 2014, 119, 312–322. [Google Scholar] [CrossRef]
  9. Finney, D.L.; Doherty, R.M.; Wild, O.; Stevenson, D.S.; MacKenzie, I.A.; Blyth, A.M. A projected decrease in lightning under climate change. Nat. Clim. Chang. 2018, 8, 210–213. [Google Scholar] [CrossRef]
  10. Kaplan, J.O.; Lau, K.H.-K. World Wide Lightning Location Network (WWLLN) Global Lightning Climatology (WGLC) and time series, 2022 update. Earth Syst. Sci. Data 2022, 14, 5665–5670. [Google Scholar] [CrossRef]
  11. Holzworth, R.H.; Brundell, J.B.; McCarthy, M.P.; Jacobson, A.R.; Rodger, C.J.; Anderson, T.S. Lightning in the Arctic. Geophys. Res. Lett. 2021, 48, e2020GL091366. [Google Scholar] [CrossRef]
  12. Romps, D.M.; Seeley, J.T.; Vollaro, D.; Molinari, J. Projected increase in lightning strikes in the United States due to global warming. Science 2014, 346, 851–854. [Google Scholar] [CrossRef] [PubMed]
  13. Veraverbeke, S.; Rogers, B.M.; Goulden, M.L.; Jandt, R.R.; Miller, C.E.; Wiggins, E.B.; Randerson, J.T. Lightning as a major driver of recent large fire years in North American boreal forests. Nat. Clim. Chang. 2017, 7, 529–534. [Google Scholar] [CrossRef]
  14. Hessilt, T.D.; van der Werf, G.; Abatzoglou, J.T.; Scholten, R.C.; Veraverbeke, S. Future increases in lightning-ignited boreal fires from conjunct increases in dry fuels and lightning. In Proceedings of the 23rd EGU General Assembly, Online, 19–30 April 2021; EGU21-2218. Available online: https://meetingorganizer.copernicus.org/EGU21/EGU21-2218.html (accessed on 19 July 2021).
  15. Moskovchenko, D.V.; Aref’ev, S.P.; Moskovchenko, M.D.; Yurtaev, A.A. Spatiotemporal Analysis of Wildfires in the Forest Tundra of Western Siberia. Contemp. Probl. Ecol. 2020, 13, 193–203. [Google Scholar] [CrossRef]
  16. Kharuk, V.I.; Ponomarev, E.I.; Ivanova, G.A.; Dvinskaya, M.L.; Coogan, S.C.P.; Flannigan, M.D. Wildfires in the Siberian taiga. AMBIO 2021, 50, 1953–1974. [Google Scholar] [CrossRef]
  17. Frost, G.V.; Epstein, H.E. Tall shrub and tree expansion in Siberian tundra ecotones since the 1960s. Glob. Chang. Biol. 2014, 20, 1264–1277. [Google Scholar] [CrossRef]
  18. Kharuk, V.I.; Dvinskaya, M.L.; Ranson, K.J.; Im, S.T. Expansion of Evergreen Conifers to the Larch-Dominated Zone and Climatic Trends. Russ. J. Ecol. 2005, 36, 164–170. [Google Scholar] [CrossRef]
  19. Shuman, J.K.; Foster, A.C.; Shugart, H.H.; Hoffman-Hall, A.; Krylov, A.; Loboda, T.; Ershov, D.; Sochilova, E. Fire disturbance and climate change: Implications for Russian forests. Environ. Res. Lett. 2017, 12, 035003. [Google Scholar] [CrossRef]
  20. Sizov, O.; Ezhova, E.; Tsymbarovich, P.; Soromotin, A.; Prihod’ko, N.; Petäjä, T.; Zilitinkevich, S.; Kulmala, M.; Bäck, J.; Köster, K. Fire and vegetation dynamics in northwest Siberia during the last 60 years based on high-resolution remote sensing. Biogeosciences 2021, 18, 207–228. [Google Scholar] [CrossRef]
  21. Anderegg, W.R.L.; Trugman, A.T.; Badgley, G.; Anderson, C.M.; Bartuska, A.; Ciais, P.; Cullenward, D.; Field, C.B.; Freeman, J.; Goetz, S.J.; et al. Climate-driven risks to the climate mitigation potential of forests. Science 2020, 368, eaaz7005. [Google Scholar] [CrossRef]
  22. Hanes, C.; Wang, X.; Jain, P.; Parisien, M.-A.; Little, J.M.; Flannigan, M.D. Fire-regime changes in Canada over the last half century. Can. J. For. Res. 2019, 49, 256–269. [Google Scholar] [CrossRef]
  23. Coogan, S.C.; Robinne, F.-N.; Jain, P.; Flannigan, M.D. Scientists’ warning on wildfire—A Canadian perspective. Can. J. For. Res. 2019, 49, 1015–1023. [Google Scholar] [CrossRef]
  24. Zhu, Z.; Piao, S.; Myneni, R.B.; Huang, M.; Zeng, Z.; Canadell, J.G.; Ciais, P.; Sitch, S.; Friedlingstein, P.; Arneth, A.; et al. Greening of the Earth and its drivers. Nat. Clim. Chang. 2016, 6, 791–795. [Google Scholar] [CrossRef]
  25. Vickers, H.; Høgda, K.A.; Solbø, S.; Karlsen, S.R.; Tømmervik, H.; Aanes, R.; Hansen, B.B. Changes in greening in the high Arctic: Insights from a 30 year AVHRR max NDVI dataset for Svalbard. Environ. Res. Lett. 2016, 11, 105004. [Google Scholar] [CrossRef]
  26. Hember, R.A.; Kurz, W.A.; Coops, N.C. Increasing net ecosystem biomass production of Canada’s boreal and temperate forests despite decline in dry climates. Glob. Biogeochem. Cycles 2017, 31, 134–158. [Google Scholar] [CrossRef]
  27. Luo, Y.; Niu, S. The fertilization effect of CO2 on a mature forest. Nature 2020, 580, 191–192. [Google Scholar] [CrossRef]
  28. Giguère-Croteau, C.; Boucher, É.; Bergeron, Y.; Girardin, M.P.; Drobyshev, I.; Silva, L.C.R.; Hélie, J.-F.; Garneau, M. North America’s oldest boreal trees are more efficient water users due to increased [CO2], but do not grow faster. Proc. Natl. Acad. Sci. USA 2019, 116, 2749–2754. [Google Scholar] [CrossRef]
  29. Hember, R.A.; Kurz, W.A.; Girardin, M.P. Tree Ring Reconstructions of Stemwood Biomass Indicate Increases in the Growth Rate of Black Spruce Trees Across Boreal Forests of Canada. J. Geophys. Res. Biogeosci. 2019, 124, 2460–2480. [Google Scholar] [CrossRef]
  30. Kharuk, V.I.; Ranson, K.J.; Im, S.T.; Petrov, I.A. Climate-induced larch growth response within the central Siberian permafrost zone. Environ. Res. Lett. 2015, 10, 125009. [Google Scholar] [CrossRef]
  31. Kharuk, V.I.; Ranson, K.J.; Petrov, I.A.; Dvinskaya, M.L.; Im, S.T.; Golyukov, A.S. Larch (Larix dahurica Turcz) growth response to climate change in the Siberian permafrost zone. Reg. Environ. Chang. 2018, 19, 233–243. [Google Scholar] [CrossRef]
  32. Sterckx, S.; Benhadj, I.; Duhoux, G.; Livens, S.; Dierckx, W.; Goor, E.; Adriaensen, S.; Heyns, W.; Van Hoof, K.; Strackx, G.; et al. The PROBA-V mission: Image processing and calibration. Int. J. Remote Sens. 2014, 35, 2565–2588. [Google Scholar] [CrossRef]
  33. Schroeder, W.; Giglio, L. NASA VIIRS Land Science Investigator Processing System (SIPS)/Visible Infrared Imaging Radi-ometer Suite (VIIRS)/375 m and 750 m Active Fire Products (Users Guide Version 1.4). 2018. Available online: https://viirsland.gsfc.nasa.gov/PDF/VIIRS_activefire_User_Guide.pdf (accessed on 9 May 2021).
  34. Zhang, N.; Sun, L.; Sun, Z.; Qu, Y. Detecting Low-Intensity Fires in East Asia Using VIIRS Data: An Improved Contextual Algorithm. Remote Sens. 2021, 13, 4226. [Google Scholar] [CrossRef]
  35. Krylov, A.; McCarty, J.L.; Potapov, P.; Loboda, T.; Tyukavina, A.; Turubanova, S.; Hansen, M.C. Remote sensing estimates of stand-replacement fires in Russia, 2002–2011. Environ. Res. Lett. 2014, 9, 105007. [Google Scholar] [CrossRef]
  36. Hawbaker, T.J.; Vanderhoof, M.K.; Beal, Y.-J.; Takacs, J.D.; Schmidt, G.L.; Falgout, J.T.; Williams, B.; Fairaux, N.M.; Caldwell, M.K.; Picotte, J.J.; et al. Mapping burned areas using dense time-series of Landsat data. Remote Sens. Environ. 2017, 198, 504–522. [Google Scholar] [CrossRef]
  37. Zhang, Q.; Ge, L.; Zhang, R.; Metternicht, G.I.; Du, Z.; Kuang, J.; Xu, M. Deep-learning-based burned area mapping using the synergy of Sentinel-1&2 data. Remote Sens. Environ. 2021, 264, 112575. [Google Scholar] [CrossRef]
  38. Jung, M.; Tautenhahn, S.; Wirth, C.; Kattge, J. Estimating Basal Area of Spruce and Fir in Post-fire Residual Stands in Central Siberia Using Quickbird, Feature Selection, and Random Forests. Procedia Comput. Sci. 2013, 18, 2386–2395. [Google Scholar] [CrossRef]
  39. Giglio, L.; Boschetti, L.; Roy, D.P.; Humber, M.L.; Justice, C.O. The Collection 6 MODIS burned area mapping algorithm and product. Remote Sens. Environ. 2018, 217, 72–85. [Google Scholar] [CrossRef]
  40. Sulla-Menashe, D.; Friedl, M.A. User Guide to Collection 6 MODIS Land Cover (MCD12Q1 and MCD12C1) Product; USGS: Reston, VA, USA, 2018; pp. 1–18.
  41. Giglio, L.; Schroeder, W.; Hall, J.V.; Justice, C.O. MODIS Collection 6 and Collection 6.1 Active Fire Product User’s Guide; National Aeronautical and Space Administration—NASA: Washington, DC, USA, 2021; p. 64.
  42. Hersbach, H.; Rosnay, P.; Bell, B.; Schepers, D.; Simmons, A.; Soci, C.; Abdalla, S.; Alonso-Balmaseda, M.; Balsamo, G.; Bechtold, P.; et al. Operational Global Reanalysis: Progress, Future Directions and Synergies with NWP. ECMWF ERA Report Series. 2018. Available online: https://www.ecmwf.int/en/elibrary/18765-operational-global-reanalysis-progress-future-directions-and-synergies-nwp (accessed on 19 July 2021).
  43. Vicente-Serrano, S.M.; Beguería, S.; López-Moreno, J.I. A Multiscalar Drought Index Sensitive to Global Warming: The Standardized Precipitation Evapotranspiration Index. J. Clim. 2010, 23, 1696–1718. [Google Scholar] [CrossRef]
  44. Landerer, F.W.; Flechtner, F.M.; Save, H.; Webb, F.H.; Bandikova, T.; Bertiger, W.I.; Bettadpur, S.V.; Byun, S.H.; Dahle, C.; Dobslaw, H.; et al. Extending the Global Mass Change Data Record: GRACE Follow-On Instrument and Science Data Performance. Geophys. Res. Lett. 2020, 47, e2020GL088306. [Google Scholar] [CrossRef]
  45. Running, S.; Mu, Q.; Zhao, M. MODIS/Terra Net Primary Production Gap-Filled Yearly L4 Global 500m SIN Grid V061; NASA EOSDIS Land Processes DAAC: Washington, DC, USA, 2021. [CrossRef]
  46. Sen, P.K. Estimates of the regression coefficient based on Kendall’s tau. J. Am. Stat. Assoc. 1968, 63, 1379–1389. [Google Scholar] [CrossRef]
  47. Conover, W.J. Practical Nonparametric Statistics; Wiley Series in Probability and Mathematical Statistics: Applied Probability and Statistics; Wiley: Hoboken, NJ, USA, 1999; Volume 350, p. 336. [Google Scholar]
  48. Fernandes, R.; Leblanc, S.G. Parametric (modified least squares) and non-parametric (Theil–Sen) linear regressions for predicting biophysical parameters in the presence of measurement errors. Remote Sens. Environ. 2005, 95, 303–316. [Google Scholar] [CrossRef]
  49. Hurvich, C.M.; Tsai, C.-L. Regression and time series model selection in small samples. Biometrika 1989, 76, 297–307. [Google Scholar] [CrossRef]
  50. Peña, E.A.; Slate, E.H. Global Validation of Linear Model Assumptions. J. Am. Stat. Assoc. 2006, 101, 341–354. [Google Scholar] [CrossRef] [PubMed]
  51. Tabachnick, B.G.; Fidell, L.S. Using Multivariate Statistics, 6th ed.; Pearson: Boston, MA, USA, 2013. [Google Scholar]
  52. Sapozhnikov, V.M.; Krechetov, A.A. Meteorological and geophysical aspects of underground cables lightning damage. In Atmospheric Electricity; Evteeva, A., Ed.; Gidrometheoizdat: Leningrad, Russia, 1982; pp. 256–258. [Google Scholar]
  53. Scholten, R.C.; Jandt, R.; Miller, E.A.; Rogers, B.M.; Veraverbeke, S. Overwintering fires in boreal forests. Nature 2021, 593, 399–404. [Google Scholar] [CrossRef] [PubMed]
  54. McCarty, J.L.; Smith, T.E.L.; Turetsky, M.R. Arctic fires re-emerging. Nat. Geosci. 2020, 13, 658–660. [Google Scholar] [CrossRef]
  55. Ponomarev, E.I.; Kharuk, V.I.; Ranson, K.J. Wildfires Dynamics in Siberian Larch Forests. Forests 2016, 7, 125. [Google Scholar] [CrossRef]
  56. Mack, M.C.; Bret-Harte, M.S.; Hollingsworth, T.N.; Jandt, R.R.; Schuur, E.A.G.; Shaver, G.R.; Verbyla, D.L. Carbon loss from an unprecedented Arctic tundra wildfire. Nature 2011, 475, 489–492. [Google Scholar] [CrossRef]
  57. French, N.H.F.; Jenkins, L.K.; Loboda, T.V.; Flannigan, M.; Jandt, R.; Bourgeau-Chavez, L.L.; Whitley, M. Fire in arctic tundra of Alaska: Past fire activity, future fire potential, and significance for land management and ecology. Int. J. Wildland Fire 2015, 24, 1045–1061. [Google Scholar] [CrossRef]
  58. Myers-Smith, I.H.; Grabowski, M.M.; Thomas, H.J.D.; Angers-Blondin, S.; Daskalova, G.N.; Bjorkman, A.D.; Cunliffe, A.M.; Assmann, J.J.; Boyle, J.S.; McLeod, E.; et al. Eighteen years of ecological monitoring reveals multiple lines of evidence for tundra vegetation change. Ecol. Monogr. 2019, 89, e01351. [Google Scholar] [CrossRef]
  59. Kharuk, V.I.; Ranson, K.J.; Im, S.T.; Oskorbin, P.A.; Dvinskaya, M.L.; Ovchinnikov, D.V. Tree-Line Structure and Dynamics at the Northern Limit of the Larch Forest: Anabar Plateau, Siberia, Russia. Arct. Antarct. Alp. Res. 2013, 45, 526–537. [Google Scholar] [CrossRef]
  60. Bhatt, U.S.; Walker, D.A.; Raynolds, M.K.; Bieniek, P.A.; Epstein, H.E.; Comiso, J.C.; Pinzon, J.E.; Tucker, C.J.; Steele, M.; Ermold, W.; et al. Changing seasonality of panarctic tundra vegetation in relationship to climatic variables. Environ. Res. Lett. 2017, 12, 055003. [Google Scholar] [CrossRef]
  61. Kharuk, V.I.; Petrov, I.A.; Im, S.T.; Golyukov, A.S.; Dvinskaya, M.L.; Shushpanov, A.S.; Savchenko, A.P.; Temerova, V.L. Subarctic Vegetation under the Mixed Warming and Air Pollution Influence. Forests 2023, 14, 615. [Google Scholar] [CrossRef]
  62. Xu, L.; Saatchi, S.S.; Yang, Y.; Yu, Y.; Pongratz, J.; Bloom, A.A.; Bowman, K.; Worden, J.; Liu, J.; Yin, Y.; et al. Changes in global terrestrial live biomass over the 21st century. Sci. Adv. 2021, 7, eabe9829. [Google Scholar] [CrossRef] [PubMed]
  63. Mack, M.C.; Walker, X.J.; Johnstone, J.F.; Alexander, H.D.; Melvin, A.M.; Jean, M.; Miller, S.N. Carbon loss from boreal forest wildfires offset by increased dominance of deciduous trees. Science 2021, 372, 280–283. [Google Scholar] [CrossRef] [PubMed]
Figure 1. Geography (a) and vegetation (b) of the Arctic sectors. (a) Fire sites are indicated by red dots. Abbreviations: Scand—Scandinavia, EurRus—European Russia, WestSib—Western Siberia, EastSib—Eastern Siberia, FarEast—Far East, NorthAm—North America. (b) A generalized vegetation map of the Arctic.
Atmosphere 14 00957 g001
Figure 2. (a) Since ca. 2007, the annual fire occurrence has been increasing for Eurasia and the entire Arctic. Trends are significant at p < 0.1. (b) The mean fire number increased in 2012–2022 (vs. 2001–2011) about 3.3 times in Eurasia. A twofold increase (19,717 vs. 9860) was observed in the Arctic.
Atmosphere 14 00957 g002
Figure 3. The highest fire numbers, as well as fire density, occurred in the Eastern Siberian Arctic sector and the whole Russian and Eurasian Arctic. Fire density was calculated versus continental areas of the Arctic’s sectors.
Atmosphere 14 00957 g003
Figure 4. (a) The average fire occurrence values for the period 2001–2022. The typical seasonal occurrence of fires for all Arctic sectors is unimodal. However, in the extreme years, seasonal distribution turned bimodal (e.g., 2019 in Russia; left ordinate). (b) The fire season duration increased in West Siberia (plus 43 days in 2012–2022 vs. 2001–2011), whereas it decreased in the Far East (minus 19 days). Trends are significant at p < 0.05. Within other Arctic sectors, changes were non-significant.
Atmosphere 14 00957 g004
Figure 5. Annual wildfire occurrence is increasing with the lightning strike index increase for West and East Siberia and the entire Arctic. Trends are significant at p < 0.02) with the exception of WestSib (p < 0.3). Within other Arctic sectors, the trends are non-significant.
Atmosphere 14 00957 g005
Figure 6. European Russia and West Siberia sectors. Dependence of the annual wildfire occurrence on the (a) air temperature, (b) precipitation, (c) soil moisture, (d) terrestrial water content, and (e) SPEI drought index for the period 2002–2022. The considered period is JJA in all cases with except for (c) (WestSib, July) and (d) (WestSib, MJ). Trends are significant at p < 0.05 except for WestSib (d); (p < 0.1).
Atmosphere 14 00957 g006
Figure 7. East Siberia and Far East sectors. Dependence of the annual wildfire occurrence on the (a) air temperature, (b) precipitation, (c) soil moisture, (d) terrestrial water content, and (e) SPEI drought index for the period 2002–2022. The considered period is JJA in all cases except for (b,c) EastSib and FarEast (MIIA) and (e) FarEast (July). Trends are significant at p < 0.05 except for (e) FarEast (non-significant).
Atmosphere 14 00957 g007
Figure 8. Eurasia and North America sectors. Dependence of the annual wildfire occurrence on the (a) air temperature, (b) precipitation, (c) soil moisture, (d) terrestrial water content, and (e) SPEI drought index for the period 2002–2022. The considered period is JJA in all cases except for (c) and (d) NorthAm (MJJA). Trends are significant at p < 0.05 except for (d) NorthAm (non-significant).
Atmosphere 14 00957 g008aAtmosphere 14 00957 g008b
Figure 9. (a) Terrestrial water content is decreasing in North America and East Siberia (p < 0.02 and p < 0.01, respectively). For the other sectors, trends are non-significant. (b) Soil moisture content (JJA) is decreasing in North America, East and West Siberia during the second decade of the 21st century (p < 0.01…p < 0.08).
Atmosphere 14 00957 g009
Figure 10. Northward wildfire migration is increasing with lightning (a) and summer air temperature (b) increase. The northernmost fire latitude is given in the y-axis. Trends are significant p < 0.05.
Atmosphere 14 00957 g010
Figure 11. Norward fire migration in (a) West and (b) East Siberia, (c) Eurasia, and (d) the entire Arctic (p < 0.05). Fire extreme shifts synchronized with May–June air temperature extremes (or “heat waves”) indicated by arrows for 2004–2006, 2010, 2012–2014, and 2020.
Atmosphere 14 00957 g011
Figure 12. Post-fire GPP recovery patterns for the entire Arctic (a), North America (b), Scandinavia (c), Russia (d), European Russia (e), West (f) and East (g) Siberia, and for Far East (h). Year of wildfire indicated by zero (0). Shaded areas indicate a 95% confidence interval.
Atmosphere 14 00957 g012
Figure 13. (a) Post-fire GPP trends within fire locations (N = 81,342). GPP trends are increasing within ca. 100% of fire locations (p < 0.05). (b) For the entire continental Arctic, the proportions of positive, negative, and non-significant GPP trends are 23.5%, 0.6%, and 75.9%, respectively (p < 0.05).
Atmosphere 14 00957 g013
Table 1. Vegetation cover types included in the analysis (according to the MCD12Q1 Land Cover Type).
ValueNameDescription
1Evergreen Needleleaf ForestsDominated by evergreen conifer trees
(canopy > 2 m). Tree cover > 60%
3Deciduous Needleleaf ForestsDominated by deciduous needle leaf (larch) trees
(canopy > 2 m). Tree cover > 60%
4Deciduous
Broadleaf Forests
Dominated by deciduous broadleaf trees
(canopy > 2 m). Tree cover > 60%
5Mixed ForestsDominated by neither deciduous nor evergreen (40–60% of each) tree types (canopy > 2 m). Tree cover 60%
6Closed ShrublandsDominated by woody perennials (1–2 m height) > 60% cover
7Open ShrublandsDominated by woody perennials (1–2 m height)
10–60% cover
8Woody SavannasTree cover 30–60% (canopy > 2 m)
9SavannasTree cover 10–30% (canopy > 2 m)
10GrasslandsDominated by herbaceous annuals (<2 m)
11Permanent
Wetlands
Permanently inundated lands with 30–60% water cover and >10% vegetated cover
Table 2. Dependence of wildfire occurrence on the environmental variables. Abbreviations: F—number of fires; TM(MJJA)—terrestrial water content storage in May—August; L—lightning index. The equation’s coefficients are significant at p < 0.05. All equations passed (p > 0.05) Shapiro–Wilk’s, Kolmogorov–Smirnov’s, and Gauss–Markov’s tests, except for the Entire Arctic (Link Function test only, i.e., the dependent variable is continuous or categorical). The analyzed period is 2010–2020.
SectorEquationAdjusted R2Explained VarianceFraction of Variance
Entire ArcticF = −0.68 × TW(MJJA) + 0.67 × L + 0.120.7883%TW(MJJA) = 42%,
L = 41%
EurasiaF = −0.85 × TW(Jun)
+ 0.72 × L + 0.01
0.8992%TW(Jun) = 50%,
L = 42%
RussiaF = −0.85 × TW(Jun)
+ 0.73 × L + 0.01
0.8992%TW(Jun) = 49%,
L = 43%
Eastern SiberiaF = −0.87 × TW(Jun)
+ 0.73 × L
0.8790%TW(Jun) = 48%,
L = 42%.
Disclaimer/Publisher’s Note: The statements, opinions and data contained in all publications are solely those of the individual author(s) and contributor(s) and not of MDPI and/or the editor(s). MDPI and/or the editor(s) disclaim responsibility for any injury to people or property resulting from any ideas, methods, instructions or products referred to in the content.

