Evaluation of the Impact of COVID-19 Restrictions on Air Pollution in Russia’s Largest Cities
Abstract
:1. Introduction
2. Materials and Methods
- -
- Downloading data and filtering them by date and other conditions;
- -
- Property aggregation in collection and calculation of the average, minimum, and maximum values for the specified property;
- -
- Statistics by area (within the city limits);
- -
- Merging of multi-temporal images;
- -
- Addition, subtraction, multiplication, and division;
- -
- Auxiliary operations;
- -
- Reporting.
3. Results
- -
- The average column-integrated results for each pollutant for the entire sample dataset (78 cities) for every 7 days;
- -
- The average column-integrated results for each pollutant and each city for the entire period (March 29 to June 13 of each year).
3.1. Weekly Concentrations Trends
3.2. Concentrations by City
4. Discussion
5. Conclusions
- With the TROPOMI (Sentinel-5P satellite) datasets integrated into the Google Earth Engine cloud platform, it was possible to monitor air pollution of urban areas by such substances as carbon monoxide (CO), formaldehyde (HCHO), nitrogen dioxide (NO2), and sulfur dioxide (SO2). The TROPOMI data indicated a decrease in the atmospheric content of these air pollutants in the largest Russian cities during the lockdown compared to the levels in the pre-pandemic and post-pandemic periods. This was the first time that such a study was conducted on the scale of Russia.
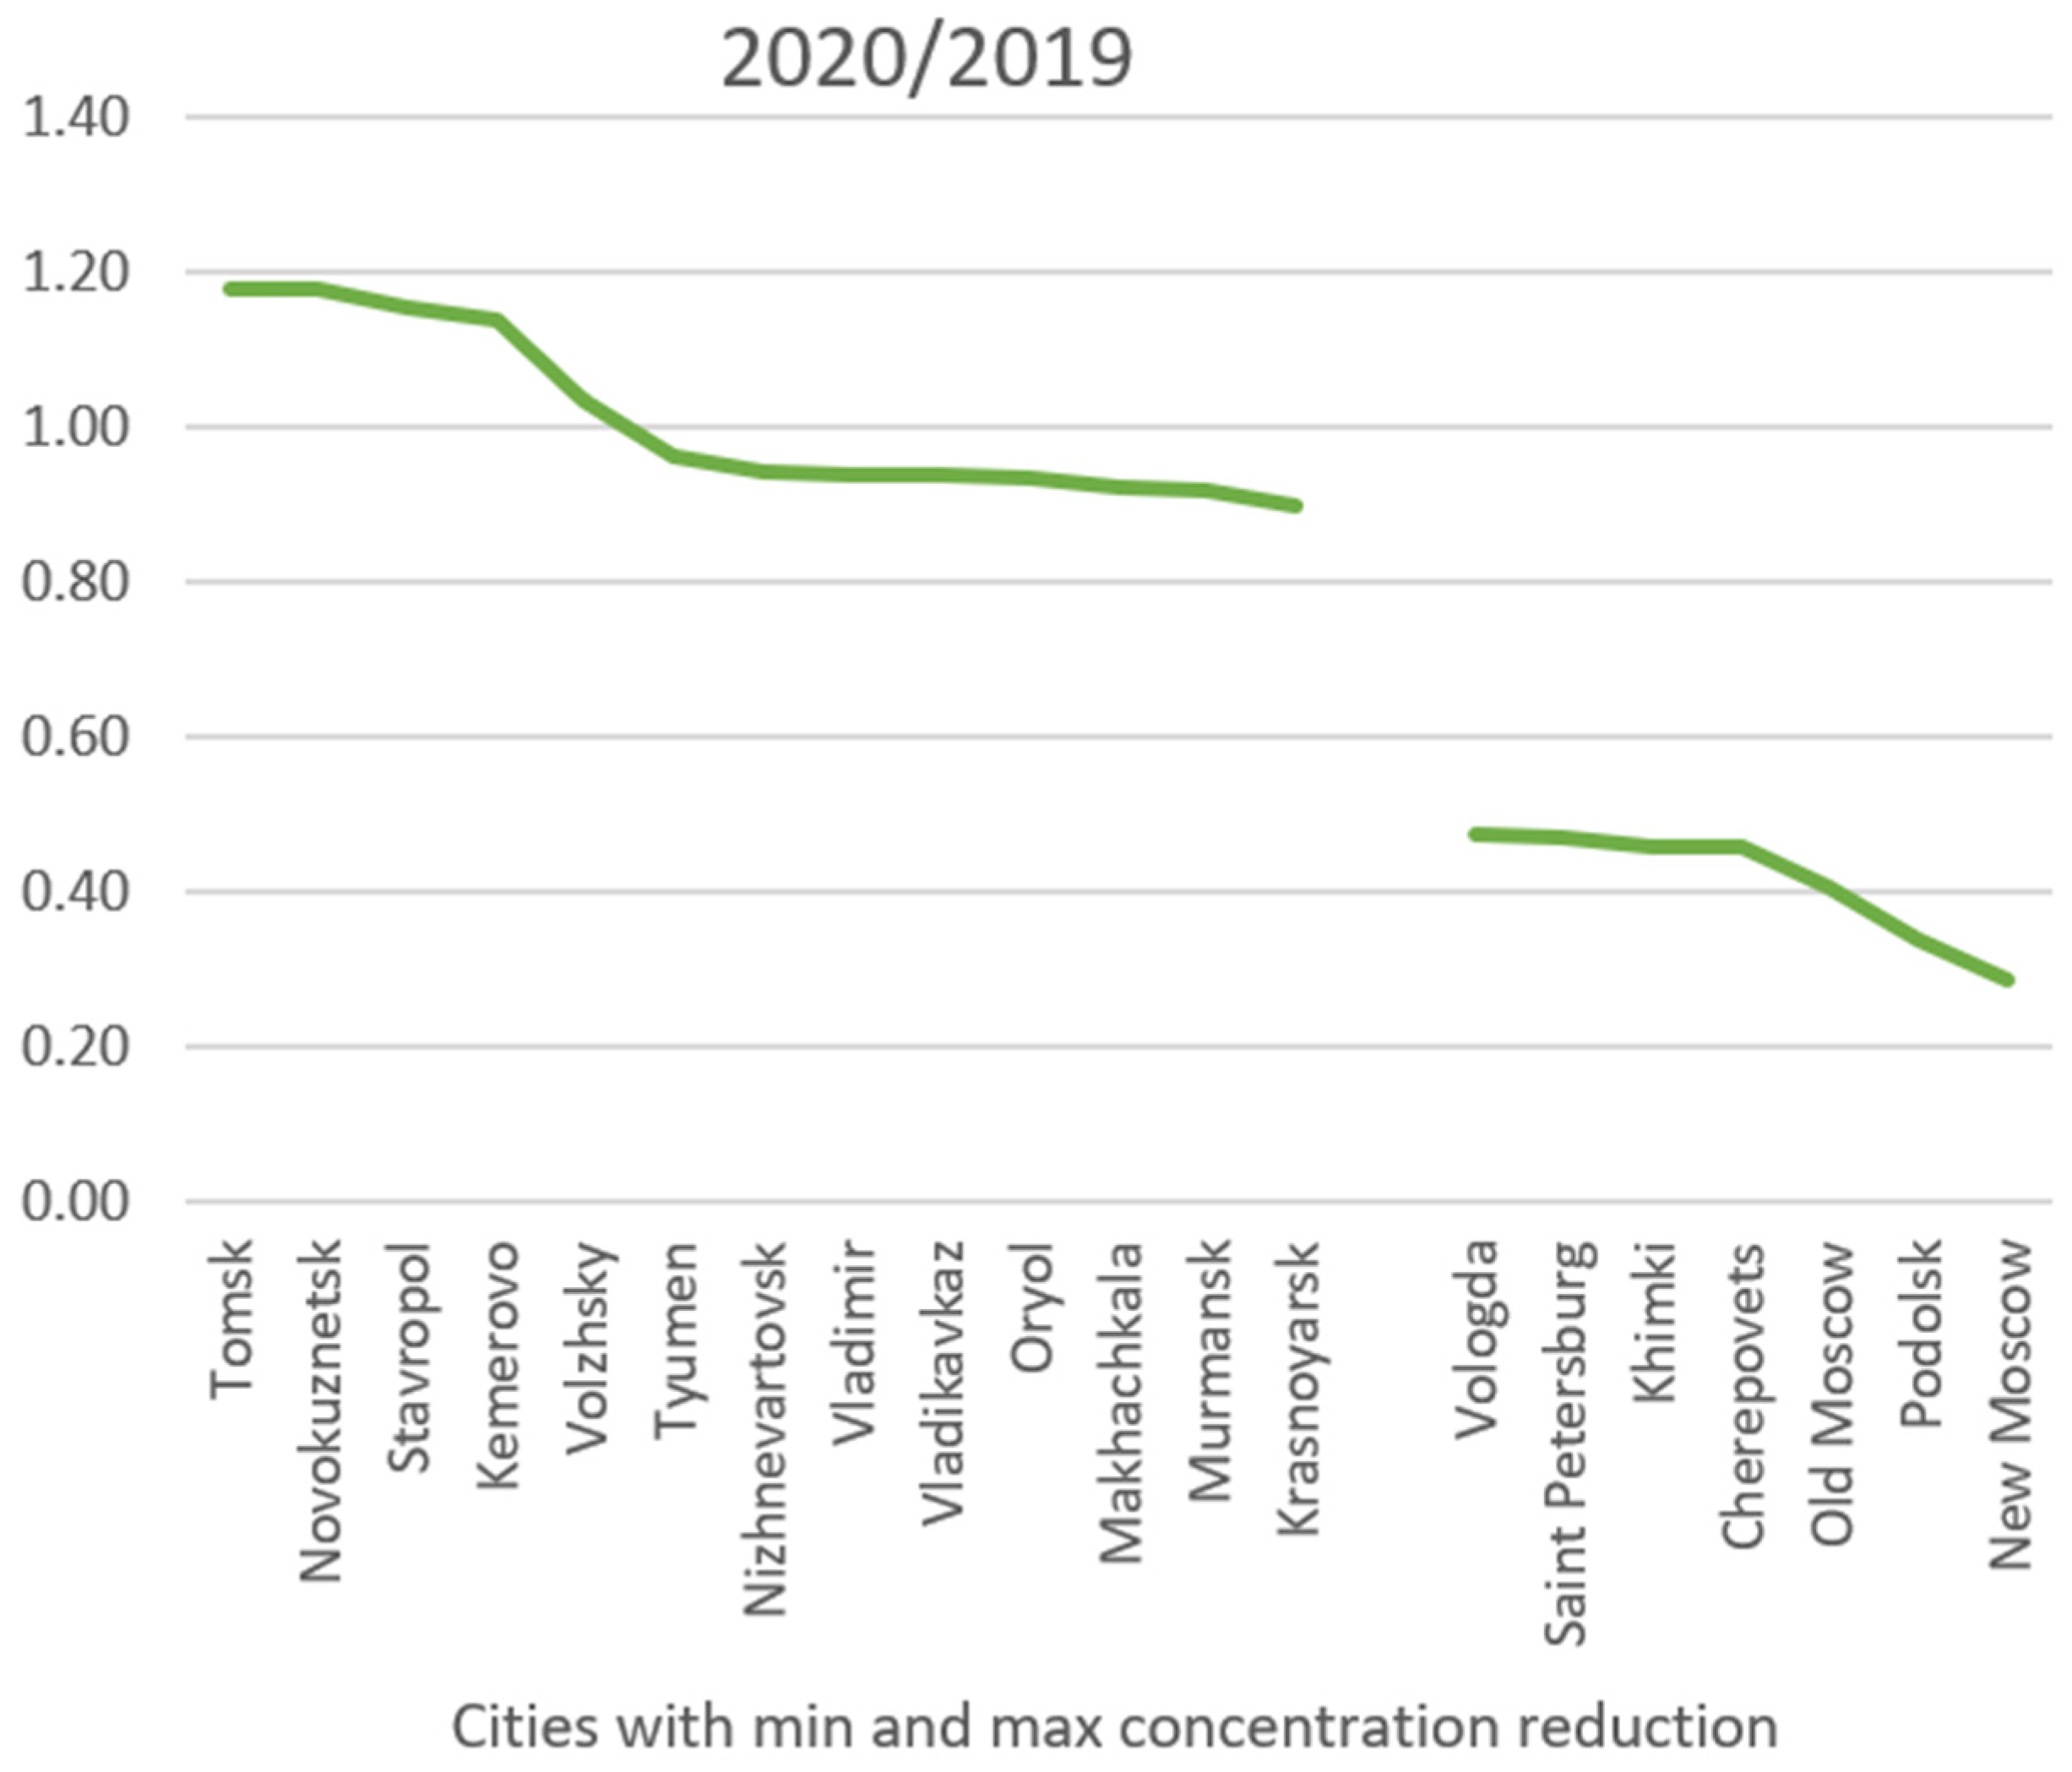
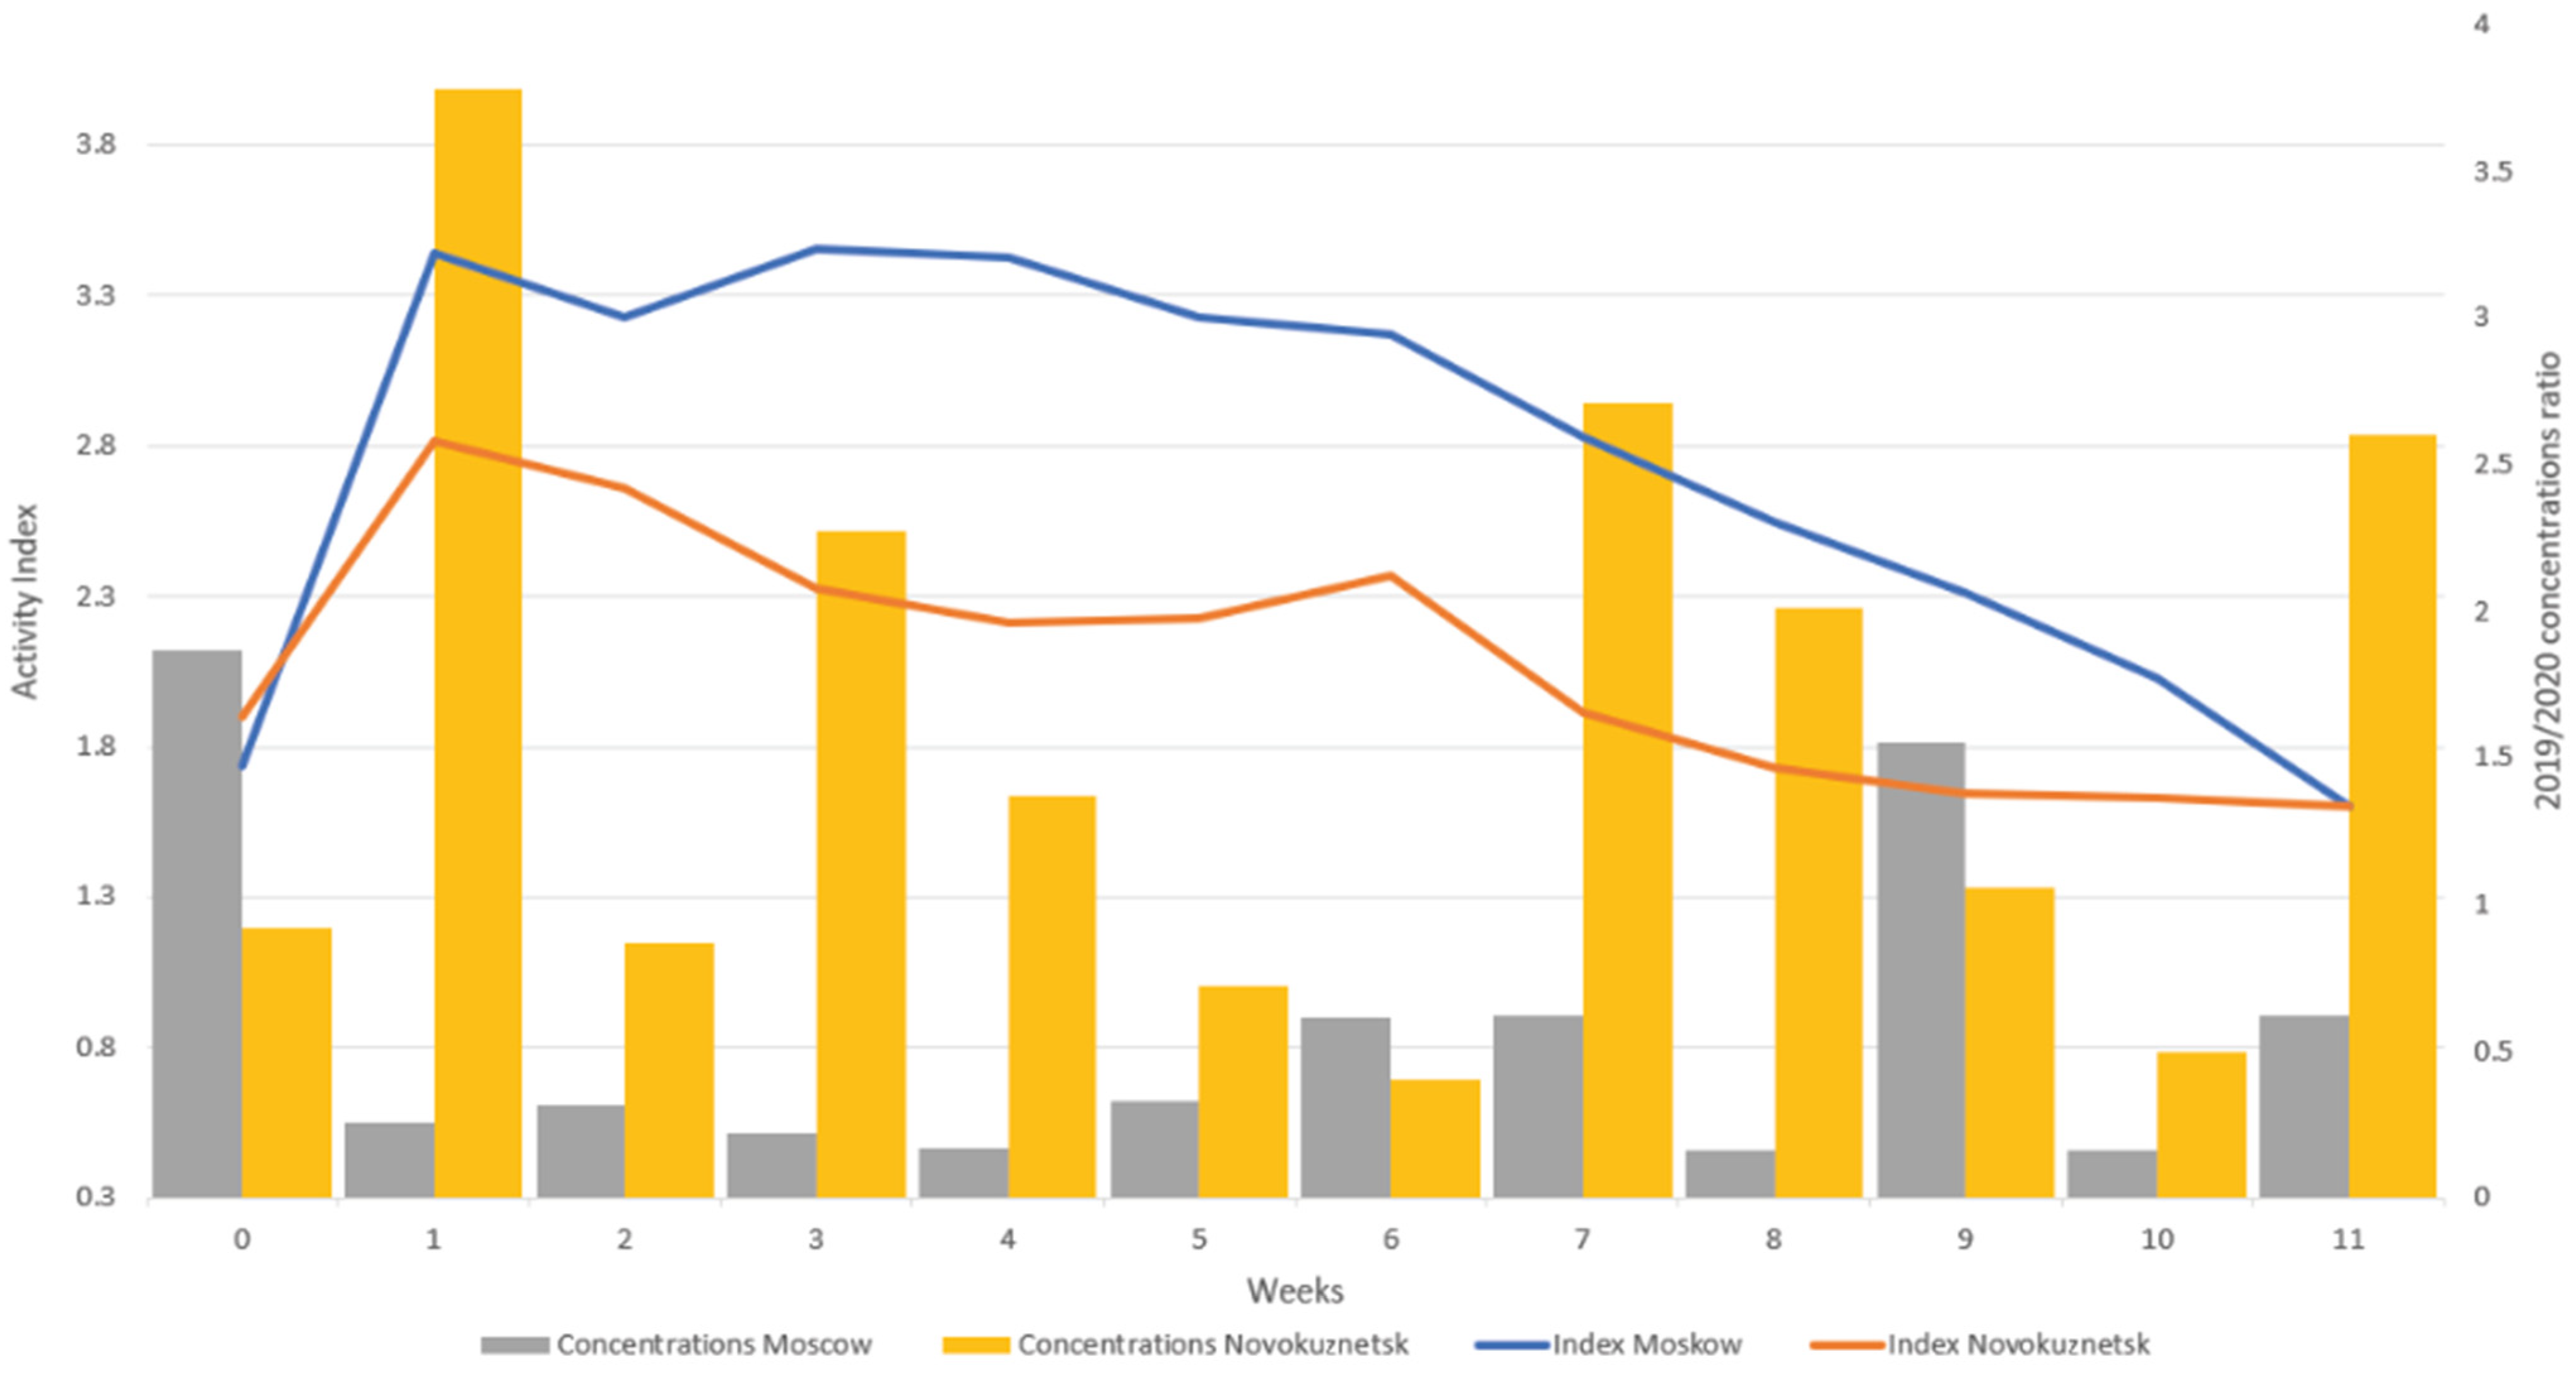
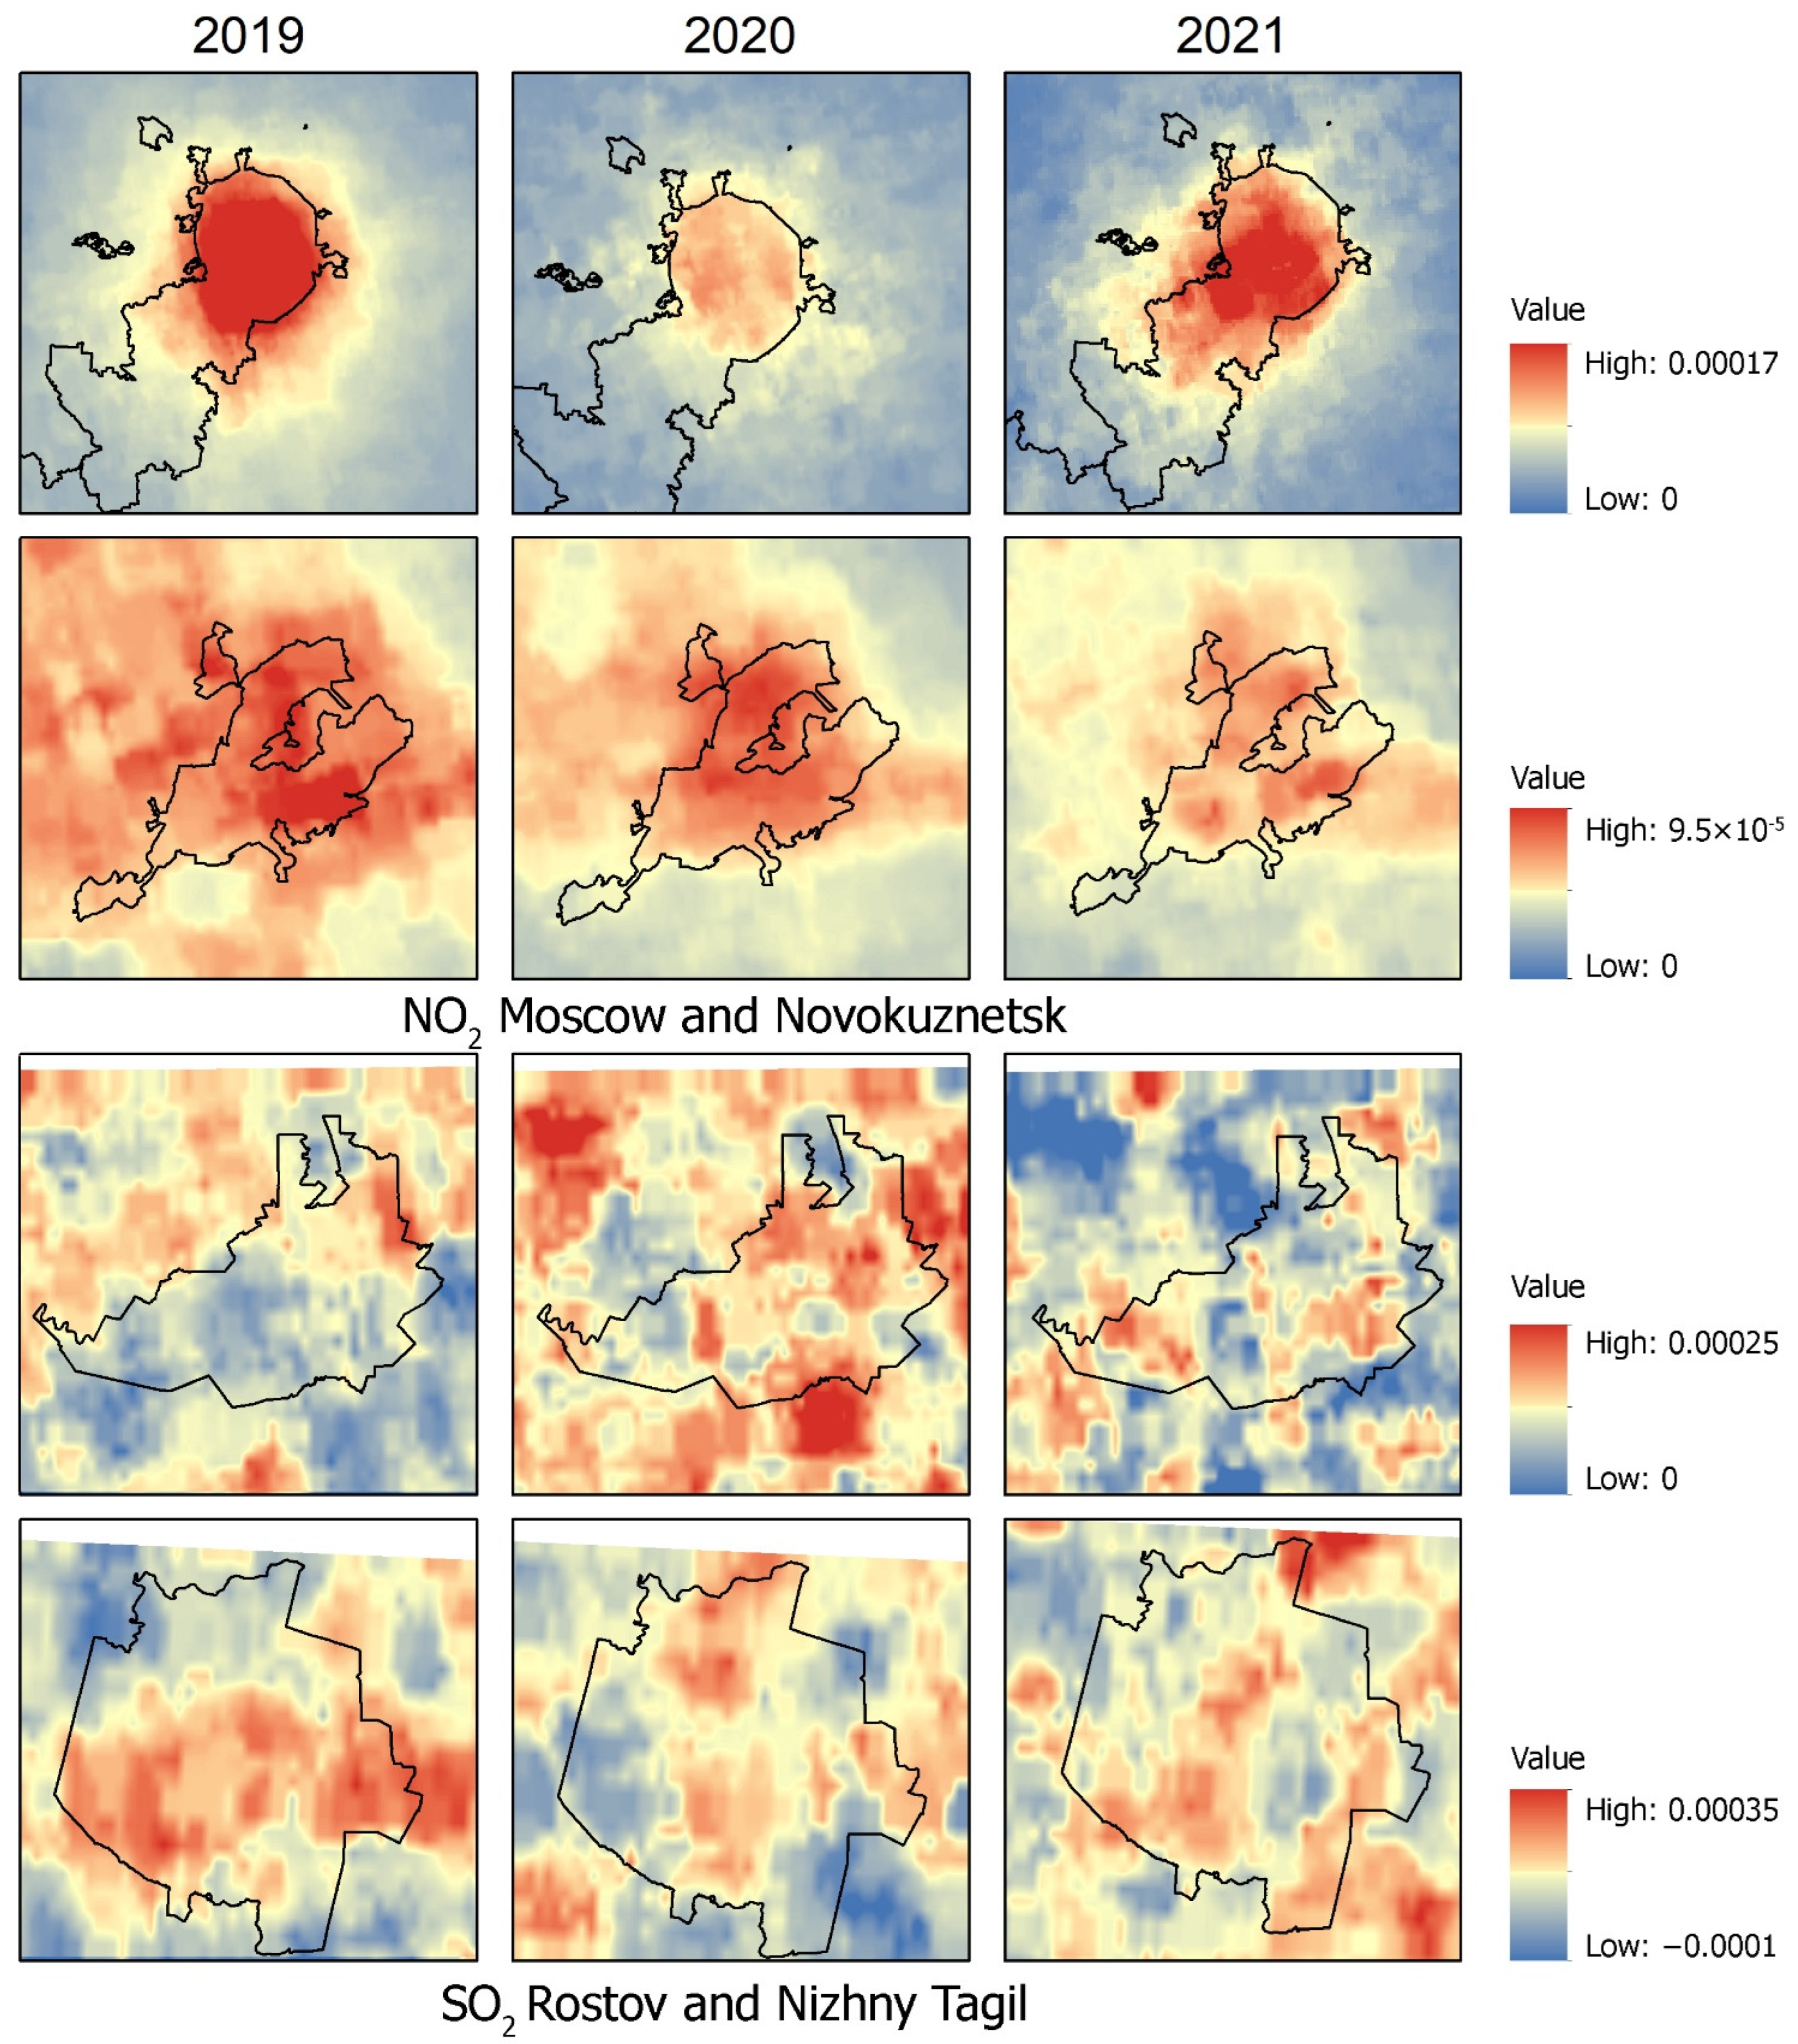
- The reduced economic activity due to COVID-19 had the greatest impact on reducing NO2 concentrations. The average concentration reduction in 2020 relative to 2019 was 30.7%. The maximum reductions in 2020 were found in Moscow (within the former city limits) (41% of the 2019 level), Podolsk, and New Moscow (34% and 29% of the 2019 levels, respectively). Five cities had pollution levels higher than in 2019 (Tomsk, Novokuznetsk, Stavropol, Kemerovo, and Volzhsky).
- For sulfur dioxide, the decrease was only 7%. More noteworthy was the further drop in concentrations in 2021 (almost 20% relative to 2019). This can be attributed to the decline in industrial production and electricity generation. The largest reductions occurred in Orel, Tula, and Sterlitamak (48%, 52%, and 53% of 2019 levels, respectively). The leaders in pollution growth were Sevastopol, Simferopol, and Novorossiysk (up to 160%, 157%, and 140% of 2019 levels, respectively).
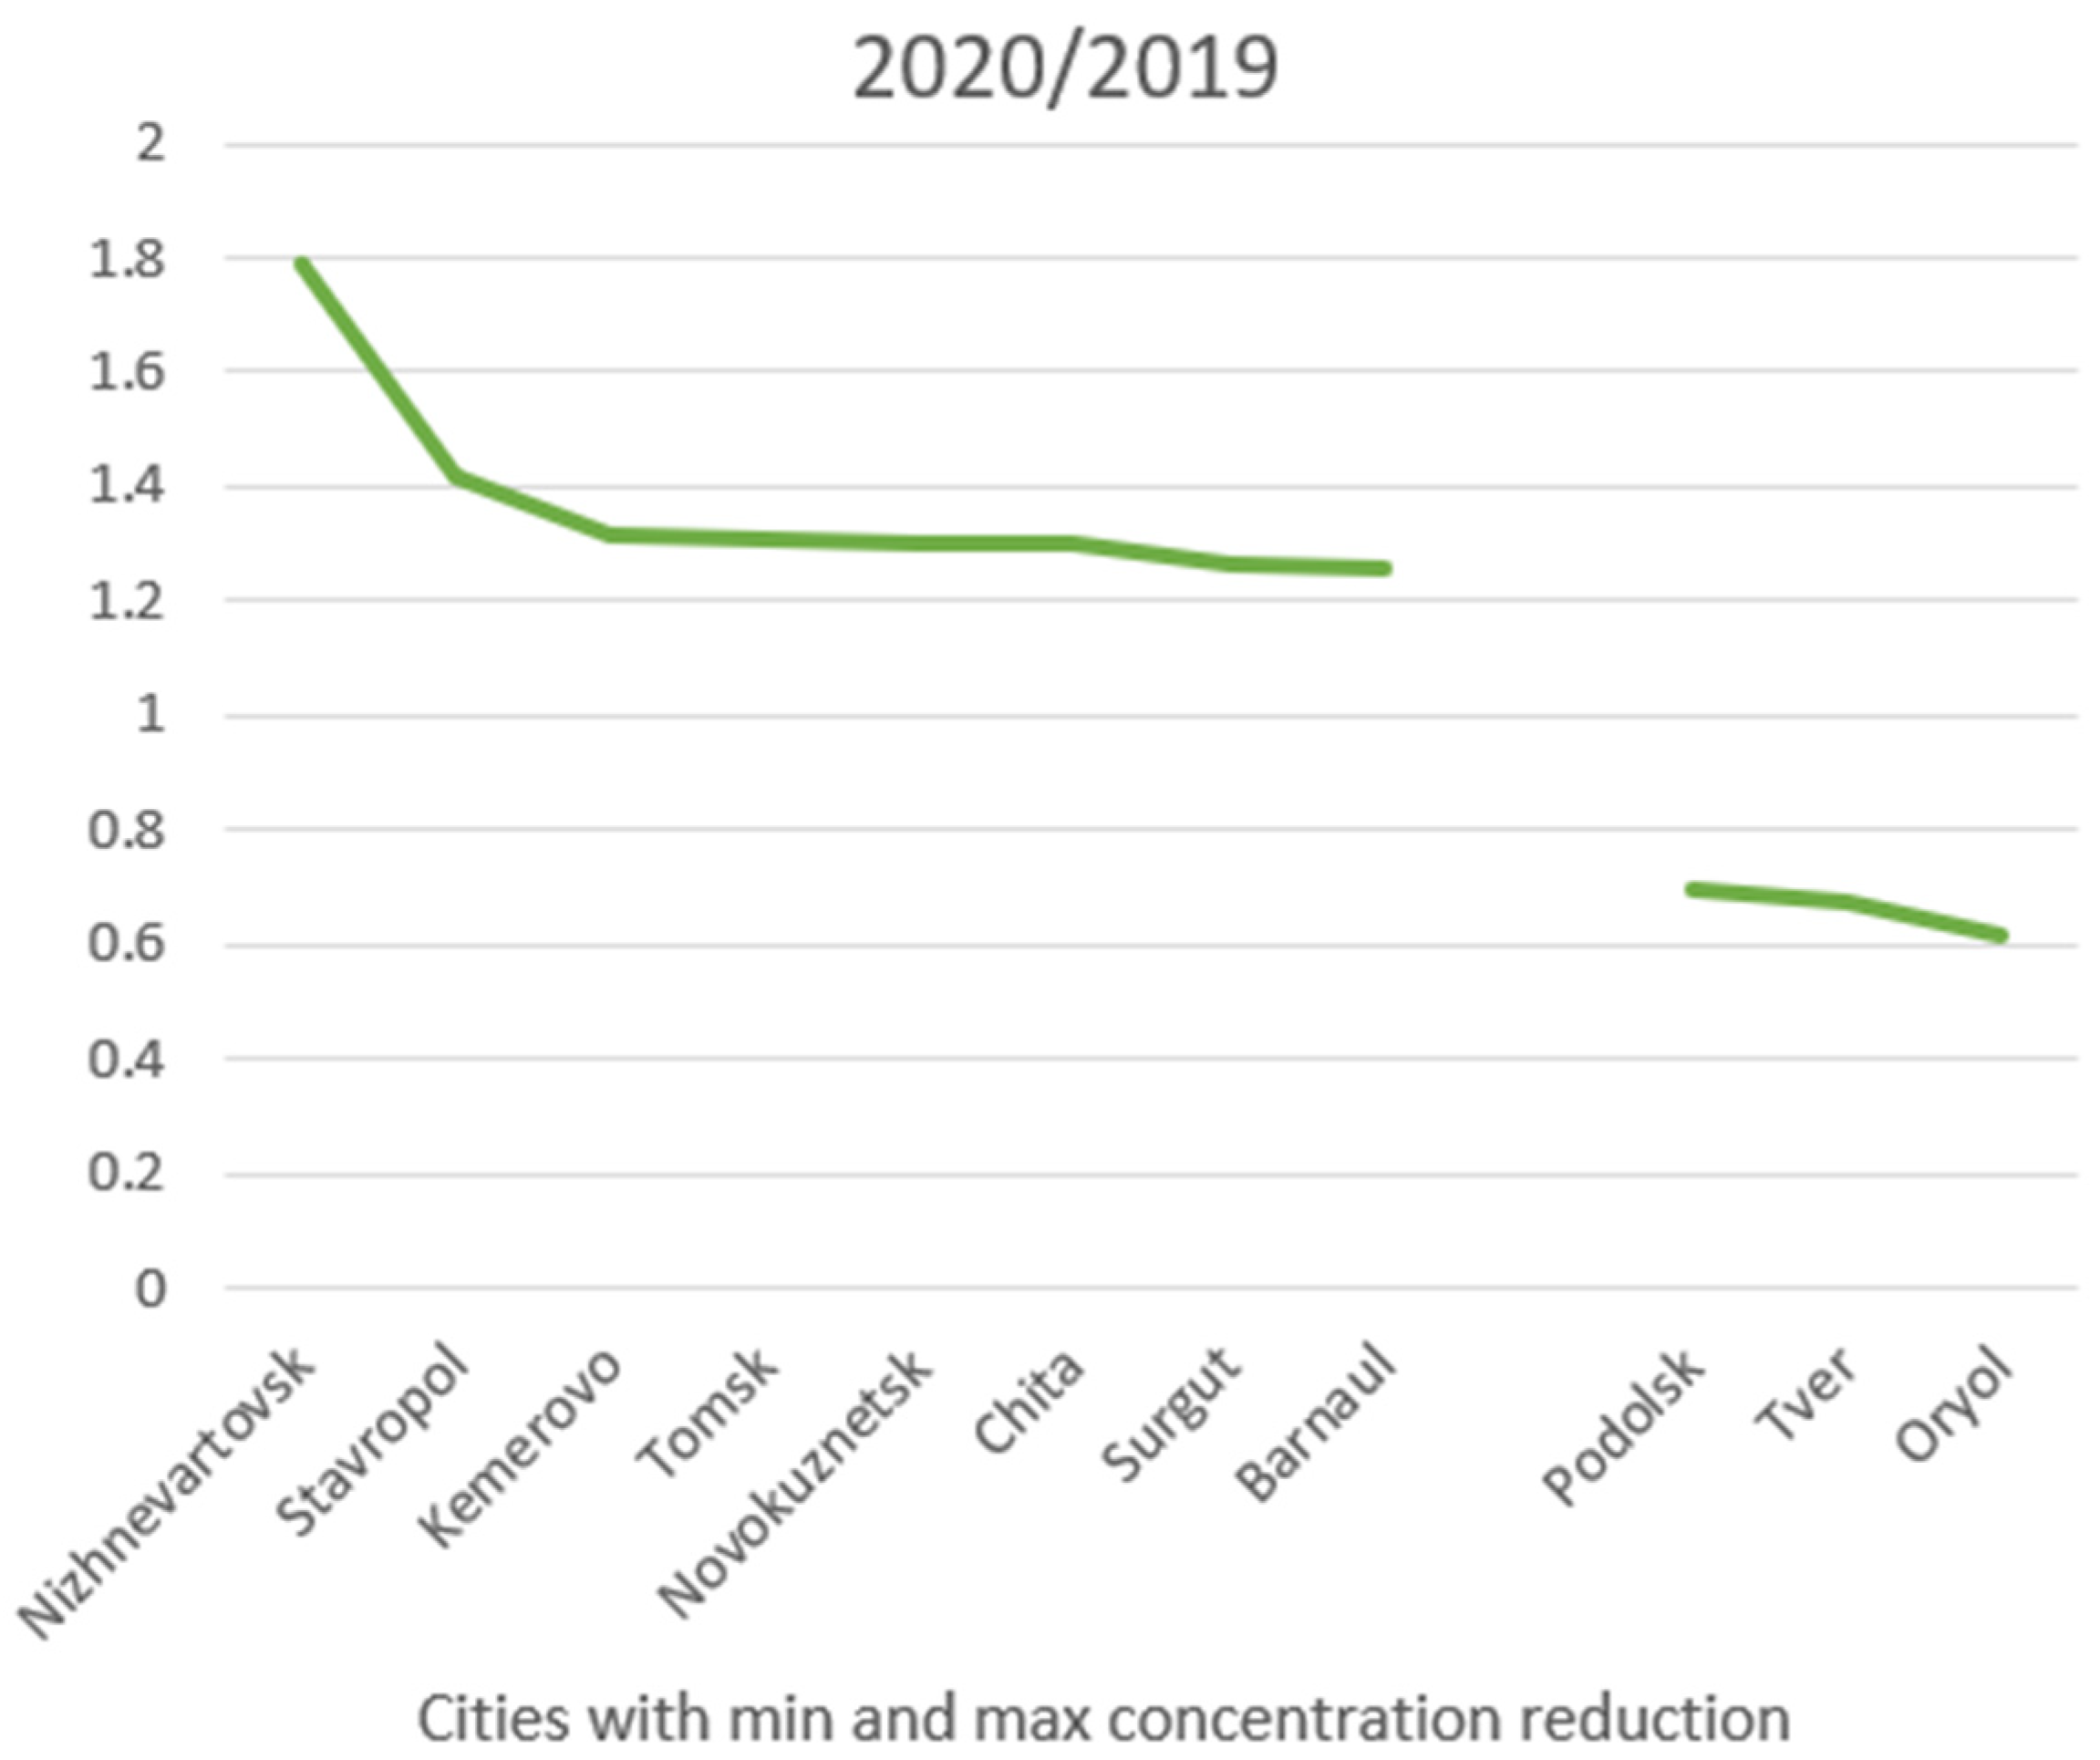
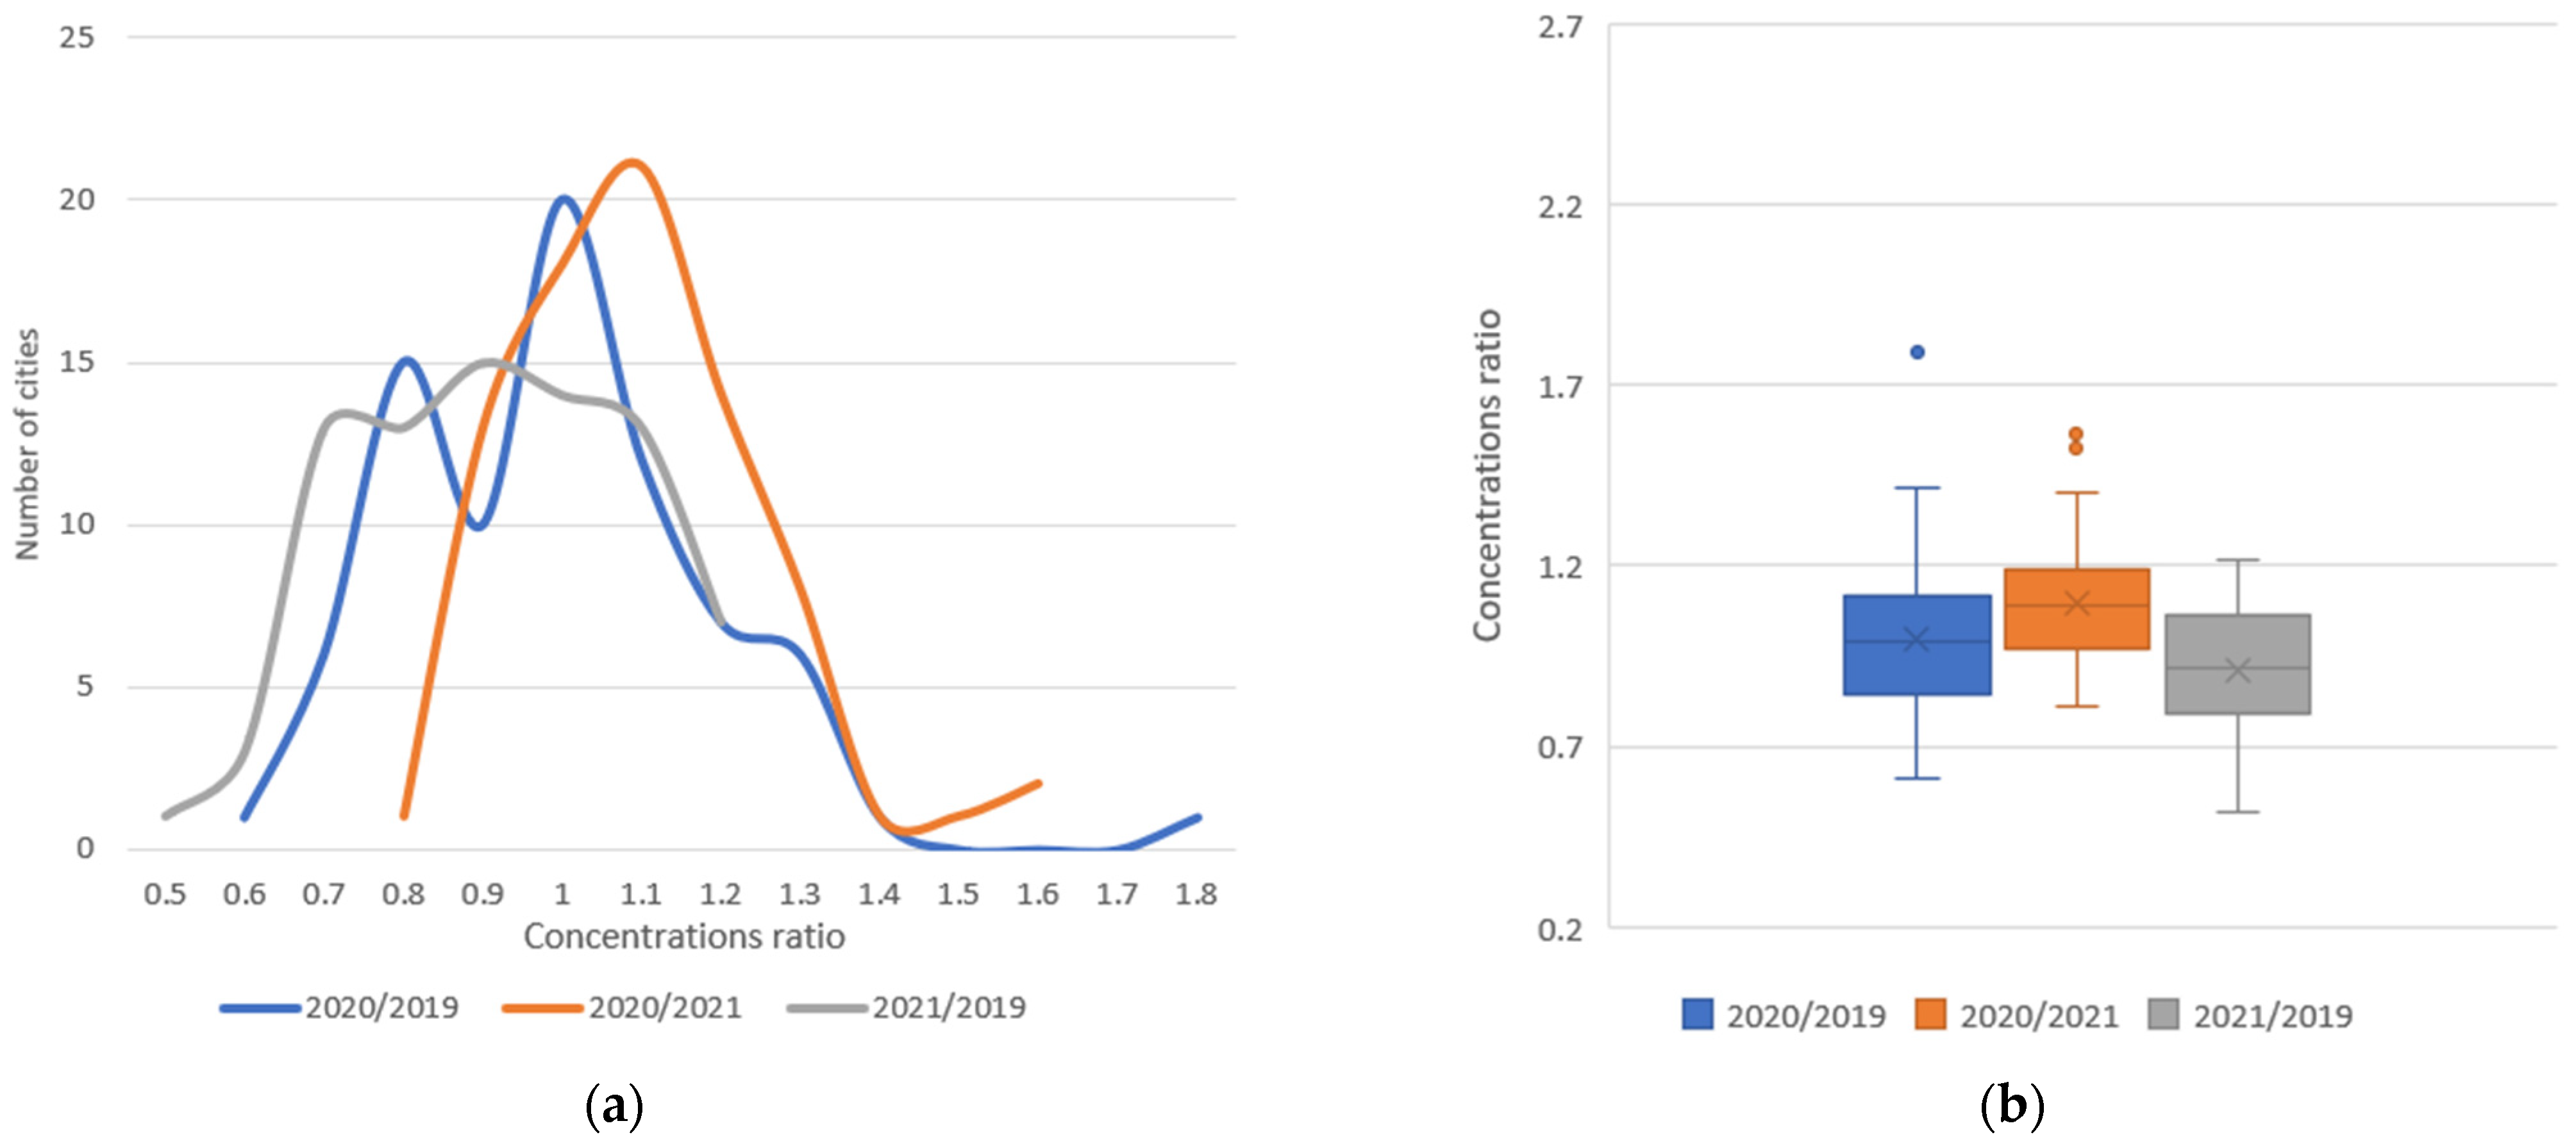
- For formaldehyde, there were no reductions for any of the cities in 2020 (99.4% relative to 2019). The leaders in pollution growth were Nizhnevartovsk, Stavropol, and Kemerovo (up to 179%, 142%, and 132% of 2019 levels, respectively). The leaders in pollution decline were Orel, Tver, and Podolsk (up to 61%, 68%, and 70% of 2019 levels, respectively).
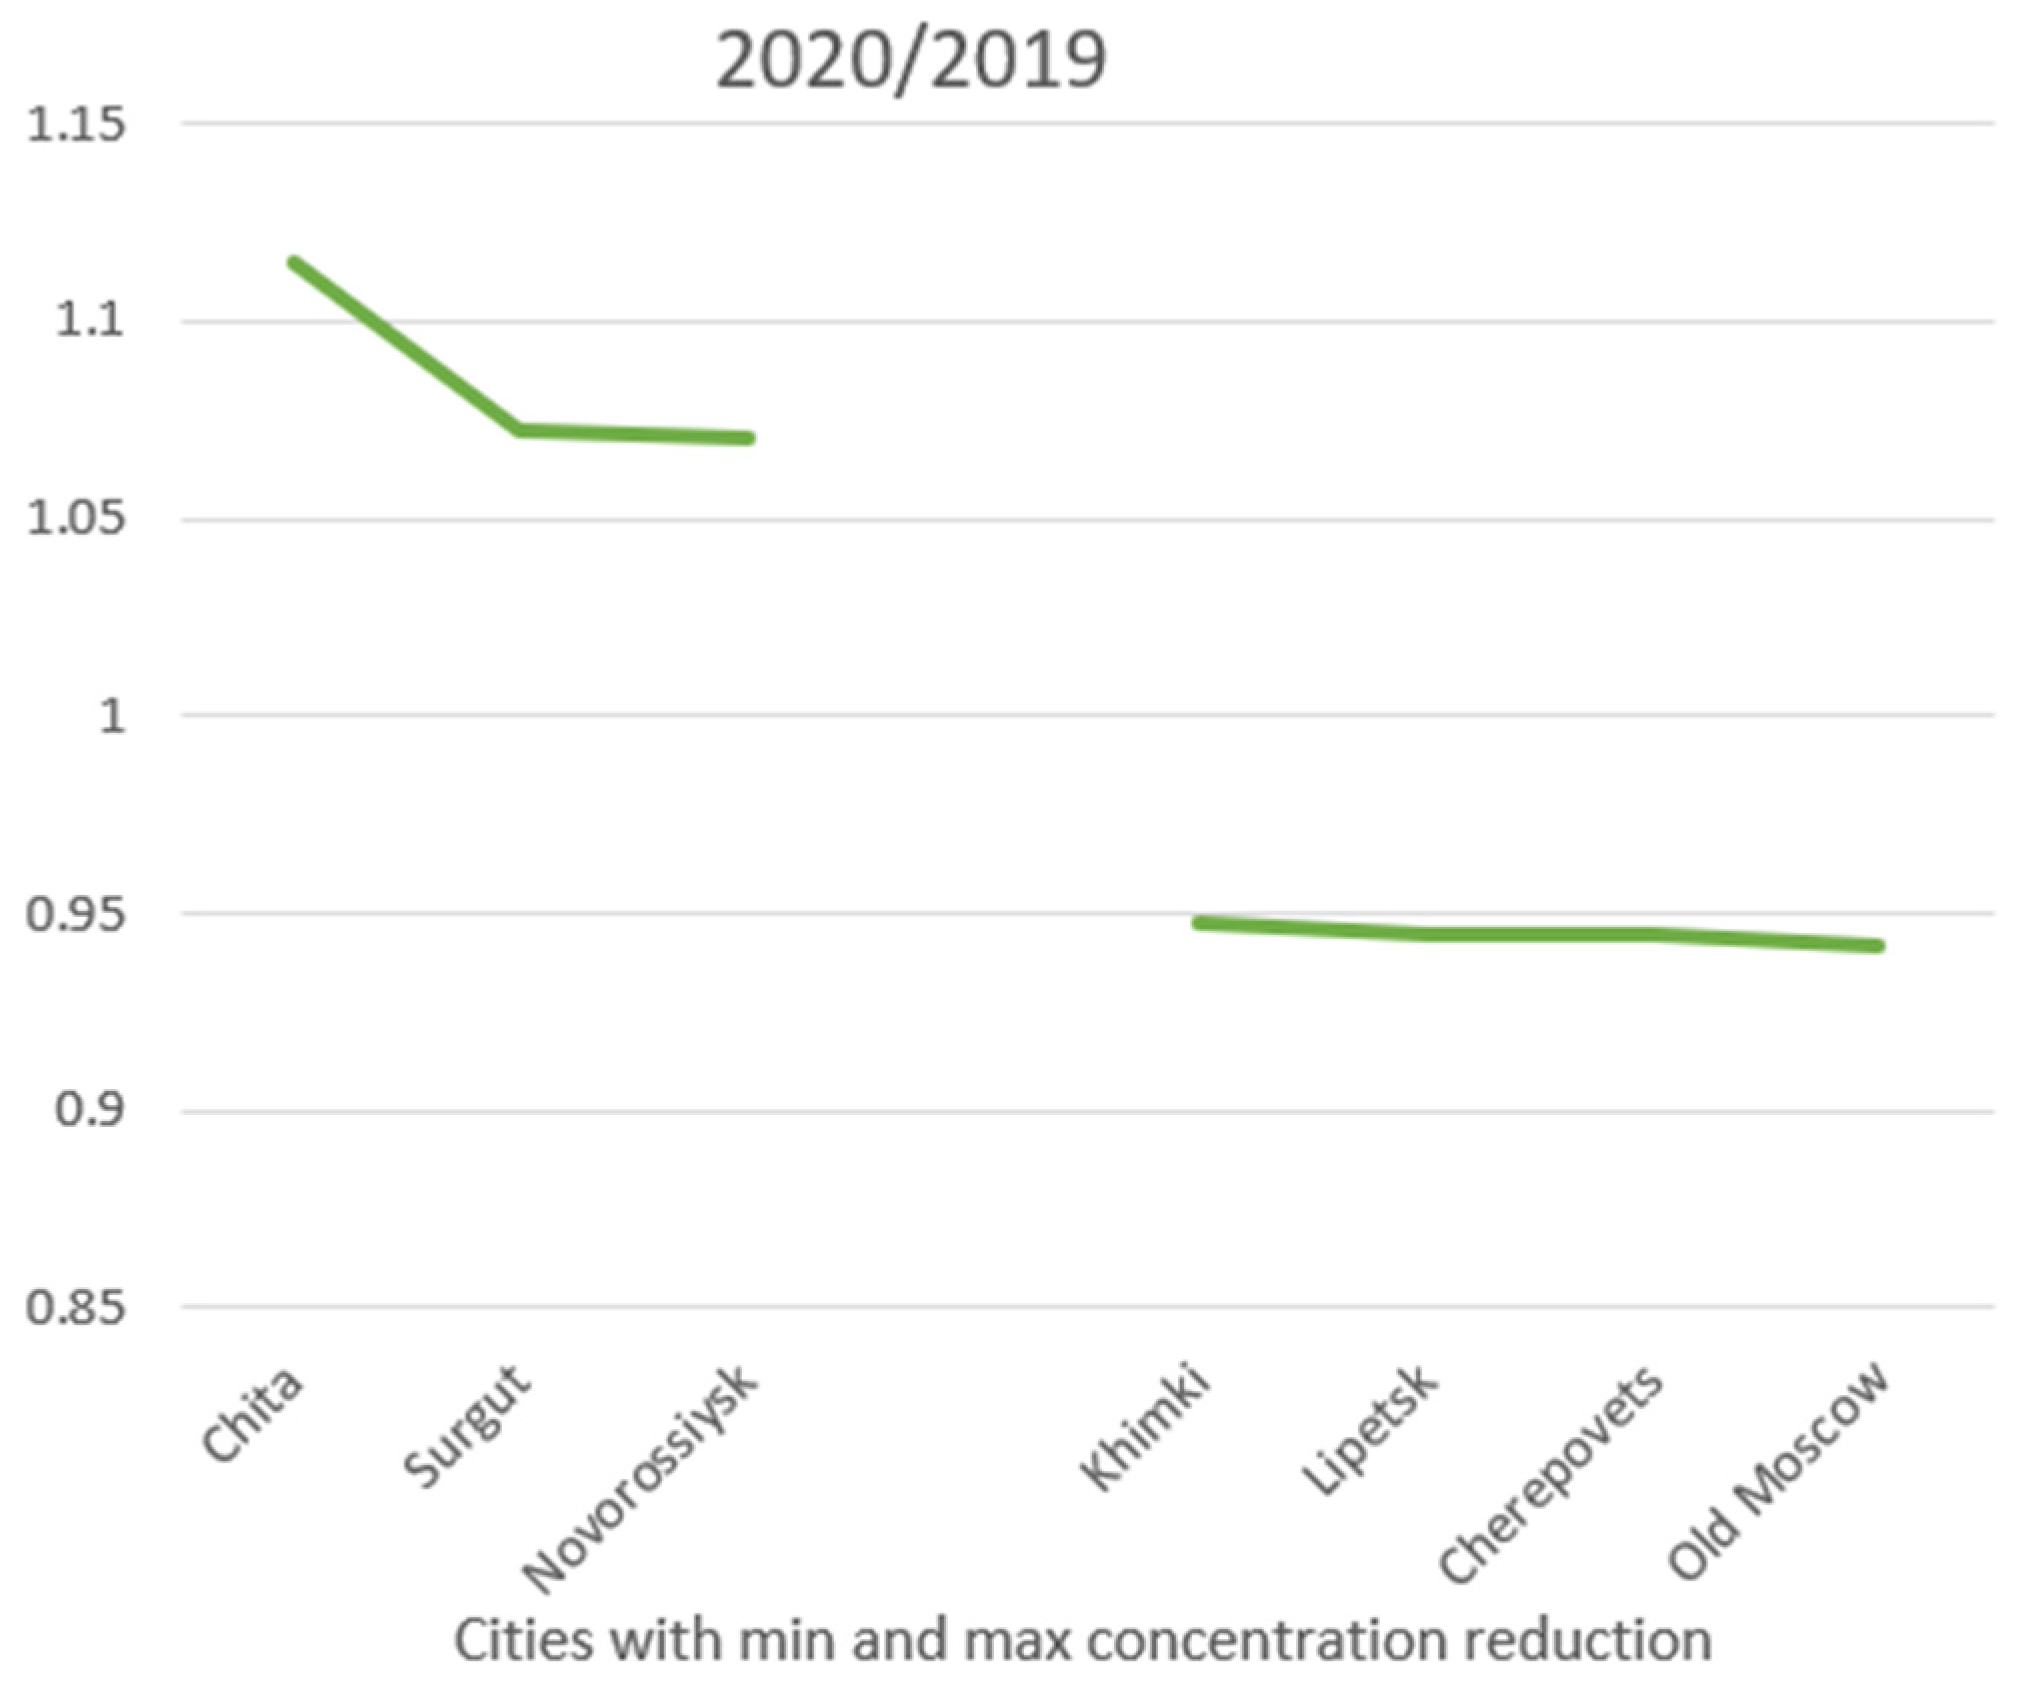
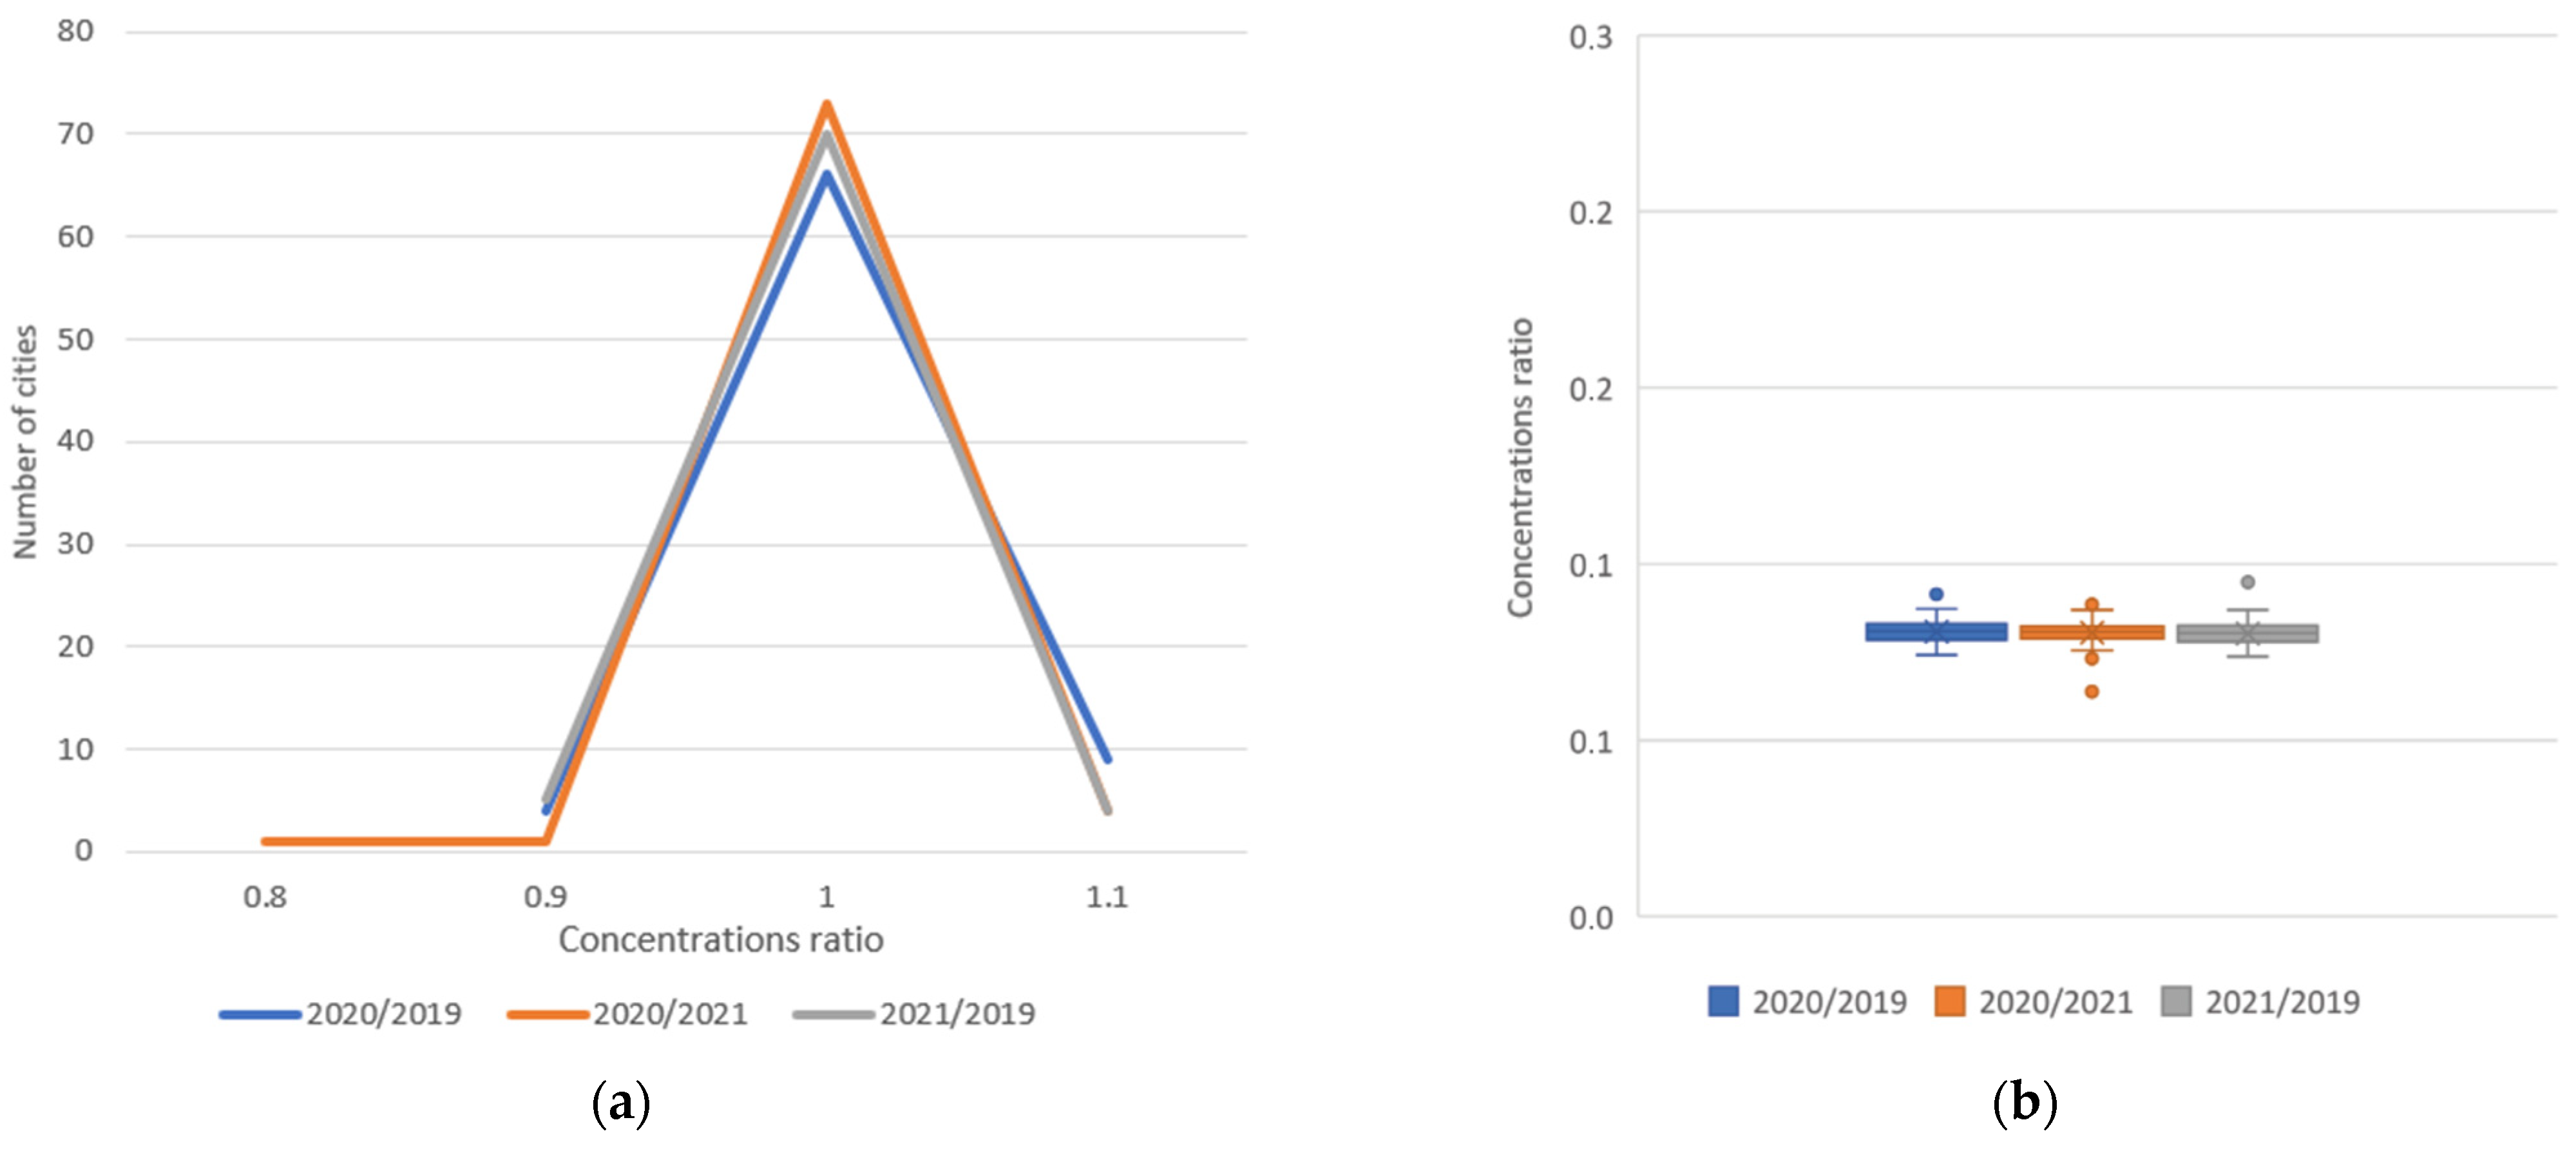
- The distribution of CO concentrations ratios was fairly uniform (100.9%). We identified the following cities with relatively high pollution growth in 2020: Chita, Surgut, and Novorossiysk (112%, 107%, and 107% of 2019 levels, respectively); the cities with the largest declines were Moscow (within its old city limits), Cherepovets, and Lipetsk (94% of 2019 levels for all cities).
- The effects of the COVID-19 lockdown on NO2, SO2, HCHO, and CO e concentrations in major Russian cities generally coincided with those in other industrialized cities of China, India, Turkey, and European countries. The maximum reductions were for NO2. The effect on SO2 concentrations was multidirectional and was more attributed to coal generation than to population activities. We found no effects of COVID-19 restrictions on carbon monoxide and formaldehyde concentrations.
- The impact of the COVID-19 pandemic on the concentration reductions in large Russian cities was local (more reductions in the central part of the country), while, over time, the differences leveled off, and the baseline pollution levels for all of the components under consideration were restored.
Author Contributions
Funding
Institutional Review Board Statement
Informed Consent Statement
Data Availability Statement
Conflicts of Interest
References
- Huang, C.; Wang, Y.; Li, X.; Ren, L.; Zhao, J.; Hu, Y.; Zhang, L.; Fan, G.; Xu, J.; Gu, X.; et al. Clinical features of patients infected with 2019 novel coronavirus in Wuhan, China. Lancet 2020, 395, 497–506. [Google Scholar] [CrossRef] [PubMed] [Green Version]
- WHO Coronavirus (COVID-19) Dashboard. Available online: https://covid19.who.int/ (accessed on 25 February 2023).
- Nicola, M.; Alsafi, Z.; Sohrabi, C.; Kerwan, A.; Al-Jabir, A.; Iosifidis, C.; Agha, M.; Agha, R. The socio-economic implications of the coronavirus pandemic (COVID-19): A review. Int. J. Surg. 2020, 78, 185–193. [Google Scholar] [CrossRef] [PubMed]
- Available online: https://www.who.int/ru/news-room/fact-sheets/detail/ambient-(outdoor)-air-quality-and-health (accessed on 27 April 2023).
- Bao, R.; Zhang, A. Does lockdown reduce air pollution? Evidence from 44 cities in northern China. Sci. Total Environ. 2020, 731, 139052. [Google Scholar] [CrossRef]
- He, G.; Pan, Y.; Tanaka, T. The short-term impacts of COVID-19 lockdown on urban air pollution in China. Nat. Sustain. 2020, 3, 1005–1011. [Google Scholar] [CrossRef]
- Mahato, S.; Pal, S.; Ghosh, K.G. Effect of lockdown amid COVID-19 pandemic on air quality of the megacity Delhi, India. Sci. Total Environ. 2020, 730, 139086. [Google Scholar] [CrossRef]
- Piccoli, A.; Agresti, V.; Balzarini, A.; Bedogni, M.; Bonanno, R.; Collino, E.; Colzi, F.; Lacavalla, M.; Lanzani, G.; Pirovano, G.; et al. Modeling the Effect of COVID-19 Lockdown on Mobility and NO2 Concentration in the Lombardy Region. Atmosphere 2020, 11, 1319. [Google Scholar] [CrossRef]
- List of Pollutants Subject to State Regulation Measures in the Field of Environmental Protection. Available online: https://docs.cntd.ru/document/420286994?marker=6500IL (accessed on 27 April 2023).
- Sicard, P.; De Marco, A.; Agathokleous, E.; Feng, Z.; Xu, X.; Paoletti, E.; Rodriguez, J.J.D.; Calatayud, V. Amplified ozone pollution in cities during the COVID-19 lockdown. Sci. Total Environ. 2020, 735, 139542. [Google Scholar] [CrossRef]
- Gautam, S. The Influence of COVID-19 on Air Quality in India: A Boon or Inutile. Bull. Environ. Contam. Toxicol. 2020, 104, 724–726. [Google Scholar] [CrossRef]
- Resmi, C.; Nishanth, T.; Kumar, M.S.; Manoj, M.; Balachandramohan, M.; Valsaraj, K. Air quality improvement during triple-lockdown in the coastal city of Kannur, Kerala to combat COVID-19 transmission. PeerJ 2020, 8, e9642. [Google Scholar] [CrossRef]
- Li, J.; Tartarini, F. Changes in Air Quality during the COVID-19 Lockdown in Singapore and associations with Human Mobility Trends. Aerosol Air Qual. Res. 2020, 20, 1748–1758. [Google Scholar] [CrossRef]
- Siciliano, B.; Carvalho, G.; da Silva, C.M.; Arbilla, G. The impact of COVID-19 partial lockdown on primary pollutant concen-trations in the atmosphere of Rio de Janeiro and Sao Paulo megacities (Brazil). Bull. Environ. Contam. Toxicol. 2020, 105, 2–8. [Google Scholar] [CrossRef]
- Hudda, N.; Simon, M.C.; Patton, A.P.; Durant, J.L. Reductions in traffic-related black carbon and ultrafine particle number concentrations in an urban neighborhood during the COVID-19 pandemic. Sci. Total Environ. 2020, 742, 140931. [Google Scholar] [CrossRef]
- Rossi, R.; Ceccato, R.; Gastaldi, M. Effect of Road Traffic on Air Pollution. Experimental Evidence from COVID-19 Lockdown. Sustainability 2020, 12, 8984. [Google Scholar] [CrossRef]
- Collivignarelli, M.C.; De Rose, C.; Abbà, A.; Baldi, M.; Bertanza, G.; Pedrazzani, R.; Sorlini, S.; Miino, M.C. Analysis of lockdown for COVID -19 impact on NO2 in London, Milan and Paris: What lesson can be learnt? Process Saf. Environ. Protect. 2021, 146, 952–960. [Google Scholar] [CrossRef] [PubMed]
- Dantas, G.; Siciliano, B.; França, B.B.; da Silva, C.M.; Arbilla, G. The impact of COVID-19 partial lockdown on the air quality of the city of Rio de Janeiro, Brazil. Sci. Total Environ. 2020, 729, 139085. [Google Scholar] [CrossRef] [PubMed]
- Le, T.; Wang, Y.; Liu, L.; Yang, J.; Yung, Y.L.; Li, G.; Seinfeld, J.H. Unexpected air pollution with marked emission reductions during the COVID-19 outbreak in China. Science 2020, 369, 702–706. [Google Scholar] [CrossRef] [PubMed]
- Rodríguez-Urrego, D.; Rodríguez-Urrego, L. Air quality during the COVID-19: PM2.5 analysis in the 50 most polluted capital cities in the world. Environ. Pollut. 2020, 266, 115042. [Google Scholar] [CrossRef] [PubMed]
- Venter, Z.S.; Aunan, K.; Chowdhury, S.; Lelieveld, J. COVID-19 lockdowns cause global air pollution declines. Proc. Natl. Acad. Sci. USA 2020, 117, 18984–18990. [Google Scholar] [CrossRef]
- Skorokhod, A.I.; Rakitin, V.S.; Kirillova, N.S. Impact of COVID-19 Pandemic Preventing Measures and Meteorological Conditions on the Atmospheric Air Composition in Moscow in 2020. Russ. Meteorol. Hydrol. 2022, 47, 183–190. [Google Scholar] [CrossRef]
- Tronin, A.; Saint Petersburg Scientific Research Center for Ecological Safety RAS; Kiselev, A.; Vasiliev, M.; Sedeeva, M.; Nerobelov, G. Monitoring NO2 content in the atmosphere of Russia using satellite data during COVID-19 pandemic. Curr. Probl. Remote Sens. Earth Space 2021, 18, 309–313. (In Russian) [Google Scholar] [CrossRef]
- Savin, I.Y.; Chinilin, A.V.; Avetyan, S.A.; Shishkonakova, E.A.; Prudnikova, E.Y. Satellite indicators of air quality changes over Russia due to the COVID-19 pandemic restrictions. RUDN J. Ecol. Life Saf. 2021, 29, 250–265. [Google Scholar] [CrossRef]
- Beloconi, A.; Vounatsou, P. Long-term air pollution exposure and COVID-19 case-severity: An analysis of individual-level data from Switzerland. Environ. Res. 2023, 216, 114481. [Google Scholar] [CrossRef] [PubMed]
- Yang, T.; Si, F.; Zhou, H.; Zhao, M.; Lin, F.; Zhu, L. Preflight Evaluation of the Environmental Trace Gases Monitoring Instrument with Nadir and Limb Modes (EMI-NL) Based on Measurements of Standard NO2 Sample Gas. Remote Sens. 2022, 14, 5886. [Google Scholar] [CrossRef]
- Chen, X.; Zhang, F.; Dianguo, Z.; Xu, L.; Liu, R.; Xiaomi, T.; Xin, Z.; Li, W.; Li, W. Variations of air pollutant response to COVID-19 lockdown in cities of the Tibetan Plateau. Remote Sens. 2023, 3, 708. [Google Scholar] [CrossRef]
- Bernath, P.F.; McElroy, C.T.; Abrams, M.C.; Boone, C.D.; Butler, M.; Camy-Peyret, C.; Carleer, M.; Clerbaux, C.; Coheur, P.; Colin, R.; et al. Atmospheric Chemistry Experiment (ACE): Mission overview. Geophys. Res. Lett. 2005, 32, 5. [Google Scholar] [CrossRef]
- Hamazaki, T.; Kaneko, Y.; Kuze, A.; Kondo, K. Fourier transform spectrometer for Greenhouse Gases Observing Satellite (GOSAT). Enabling Sens. Platf. Technol. Spaceborne Remote Sens. 2005, 5659, 73–80. [Google Scholar] [CrossRef]
- Saito, M.; Niwa, Y.; Saeki, T.; Cong, R.; Miyauchi, T. Overview of model systems for global carbon dioxide and methane flux estimates using GOSAT and GOSAT-2 observations. J. Remote Sens. Soc. Jpn. 2019, 39, 50–56. [Google Scholar]
- Waters, J.W.; Froidevaux, L.; Harwood, R.S.; Jarnot, R.F.; Pickett, H.M.; Read, W.G.; Siegel, P.H.; Cofield, R.E.; Filipiak, M.J.; Flower, D.; et al. The earth observing system microwave limb sounder (EOS MLS) on the aura satellite. IEEE Trans. Geosci. Remote Sens. 2006, 44, 1075–1092. [Google Scholar] [CrossRef]
- Prunet, P.; Lezeaux, O.; Camy-Peyret, C.; Thevenon, H. Analysis of the NO2 tropospheric product from S5P TROPOMI for monitoring pollution at city scale. City Environ. Interact. 2020, 8, 100051. [Google Scholar] [CrossRef]
- Saw, G.K.; Dey, S.; Kaushal, H.; Lal, K. Tracking NO2 emission from thermal power plants in North India using TROPOMI data. Atmos. Environ. 2021, 259, 118514. [Google Scholar] [CrossRef]
- Gorelick, N.; Hancher, M.; Dixon, M.; Ilyushchenko, S.; Thau, D.; Moore, R. Google Earth Engine: Planetary-scale geospatial analysis for everyone. Remote Sens. Environ. 2017, 202, 18–27. [Google Scholar] [CrossRef]
- Veefkind, J.P.; Aben, I.; McMullan, K.; Förster, H.; de Vries, J.; Otter, G.; Claas, J.; Eskes, H.J.; de Haan, J.F.; Kleipool, Q.; et al. TROPOMI on the ESA Sentinel-5 Precursor: A GMES mission for global observations of the atmospheric composition for climate, air quality and ozone layer applications. Remote Sens. Environ. 2012, 120, 70–83. [Google Scholar] [CrossRef]
- Russian Statistical Agency. The Population of the Russian Federation by Municipalities as of January 1, 2021. Available online: https://rosstat.gov.ru/compendium/document/13282 (accessed on 8 February 2021). (In Russian)
- Yandex DataLens. Available online: https://datalens.yandex/7o7is1q6ikh23?tab=q6 (accessed on 27 April 2023).
- Yandex Shelter-in-Place Index. Available online: https://yandex.ru/company/researches/2020/podomam (accessed on 27 April 2023).
- Hartwell, C.A.; Otrachshenko, V.; Popova, O. Waxing power, waning pollution: The effect of COVID-19 on Russian environmental policymaking. Ecol. Econ. 2021, 184, 107003. [Google Scholar] [CrossRef]
- National Lockdown. Russian Presidential Decree No. 206 Dated 25.03.2020. Available online: http://www.consultant.ru/document/cons_doc_LAW_348485/#:~:text=%D0%92%20%D1%86%D0%B5%D0%BB%D1%8F%D1%85%20%D0%BE%D0%B1%D0%B5%D1%81%D0%BF%D0%B5%D1%87%D0%B5%D0%BD%D0%B8%D1%8F%20%D1%81%D0%B0%D0%BD%D0%B8%D1%82%D0%B0%D1%80%D0%BD%D0%BE%2D%D1%8D%D0%BF%D0%B8%D0%B4%D0%B5%D0%BC%D0%B8%D0%BE%D0%BB%D0%BE%D0%B3%D0%B8%D1%87%D0%B5%D1%81%D0%BA%D0%BE%D0%B3%D0%BE,%D1%81%D0%BE%D1%85%D1%80%D0%B0%D0%BD%D0%B5%D0%BD%D0%B8%D0%B5%D0%BC%20%D0%B7%D0%B0%20%D1%80%D0%B0%D0%B1%D0%BE%D1%82%D0%BD%D0%B8%D0%BA%D0%B0%D0%BC%D0%B8%20%D0%B7%D0%B0%D1%80%D0%B0%D0%B1%D0%BE%D1%82%D0%BD%D0%BE%D0%B9%20%D0%BF%D0%BB%D0%B0%D1%82%D1%8B (accessed on 27 April 2023).
- COVID-19 Public Health Initiative. Russian Presidential Decree No. 239 Dated 02.04.2020. Available online: http://www.consultant.ru/document/cons_doc_LAW_349217/#dst100008 (accessed on 27 April 2023).
- COVID-19 Public Health Initiative Extension. Russian Presidential Decree No. 294 Dated 28.04.2020. Available online: http://www.consultant.ru/document/cons_doc_LAW_351539/ (accessed on 27 April 2023).
- Sentinel-5P OFFL SO2: Offline Sulfur Dioxide. Available online: https://developers.google.com/earth-engine/datasets/catalog/COPERNICUS_S5P_OFFL_L3_SO2 (accessed on 26 April 2023).
- Abdullah, S.; Mansor, A.A.; Napi, N.N.L.M.; Mansor, W.N.W.; Ahmed, A.N.; Ismail, M.; Ramly, Z.T.A. Air quality status during 2020 Malaysia Movement Control Order (MCO) due to 2019 novel coronavirus (2019-nCoV) pandemic. Sci. Total Environ. 2020, 729, 139022. [Google Scholar] [CrossRef]
- Cui, Y.; Ji, D.; Maenhaut, W.; Gao, W.; Zhang, R.; Wang, Y. Levels and sources of hourly PM2.5-related elements during the control period of the COVID-19 pandemic at a rural site between Beijing and Tianjin. Sci. Total Environ. 2020, 744, 140840. [Google Scholar] [CrossRef] [PubMed]
- Bekbulat, B.; Apte, J.S.; Millet, D.B.; Robinson, A.L.; Wells, K.C.; Presto, A.A.; Marshall, J.D. Changes in criteria air pollution levels in the US before, during, and after COVID -19 stay-at-home orders: Evidence from regulatory monitors. Sci. Total Environ. 2021, 769, 144693. [Google Scholar] [CrossRef]
- Chen, K.; Wang, M.; Huang, C.; Kinney, P.L.; Anastas, P.T. Air pollution reduction and mortality benefit during the COVID-19 outbreak in China. Lancet Planet Health 2020, 4, e210–e212. [Google Scholar] [CrossRef] [PubMed]
- Singh, R.P.; Chauhan, A. Impact of lockdown on air quality in India during COVID-19 pandemic. Air Qual. Atmos. Health 2020, 13, 921–928. [Google Scholar] [CrossRef] [PubMed]
- Vadrevu, K.P.; Eaturu, A.; Biswas, S.; Lasko, K.; Sahu, S.; Garg, J.K.; Justice, C. Spatial and temporal variations of air pollution over 41 cities of India during the COVID-19 lockdown period. Sci. Rep. 2020, 10, 16574. [Google Scholar] [CrossRef] [PubMed]
- Khreis, H. Chapter Three—Traffic, Air Pollution, and Health. In Advances in Transportation and Health; Nieuwenhuijsen, M.J., Khreis, H., Eds.; Elsevier: Amsterdam, The Netherlands, 2020; pp. 59–104. ISBN 9780128191361. [Google Scholar] [CrossRef]
- Singh, N.; Singh, S.; Mall, R. Chapter 17—Urban Ecology and Human Health: Implications of Urban Heat Island, Air Pollution and Climate Change Nexus. In Urban Ecology; Verma, P., Singh, P., Singh, R., Raghubanshi, A.S., Eds.; Elsevier: Amsterdam, The Netherlands, 2020; pp. 317–334. ISBN 9780128207307. [Google Scholar] [CrossRef]
- Manisalidis, I.; Stavropoulou, E.; Stavropoulos, A.; Bezirtzoglou, E. Environmental and Health Impacts of Air Pollution: A Review. Front. Public Health 2020, 8, 14. [Google Scholar] [CrossRef] [Green Version]
- Rodríguez, M.C.; Dupont-Courtade, L.; Oueslati, W. Air pollution and urban structure linkages: Evidence from European cities. Renew. Sustain. Energy Rev. 2016, 53, 1–9. [Google Scholar] [CrossRef]
- Borck, R.; Schrauth, P. Population density and urban air quality. Reg. Sci. Urban Econ. 2020, 86, 103596. [Google Scholar] [CrossRef]
- Carozzi, F.; Roth, S. Dirty density: Air quality and the density of American cities. J. Environ. Econ. Manag. 2023, 118, 102767. [Google Scholar] [CrossRef]
- American Lung Association. Nitrogen Dioxide. Available online: https://www.lung.org/clean-air/outdoors/what-makes-air-unhealthy/nitrogen-dioxide (accessed on 27 April 2023).
- Zhu, H.; Yang, L. Formation mechanism of NO2 distribution heterogeneity at different spatial scales. Resour. Environ. Sustain. 2023, 12, 100106. [Google Scholar] [CrossRef]
- Van Der A, R.J.; Eskes, H.J.; Boersma, K.F.; Van Noije, T.P.C.; Van Roozendael, M.; De Smedt, I.; Peters, D.H.M.U.; Meijer, E.W. Trends, seasonal variability and dominant NOx source derived from a ten year record of NO2 measured from space. J. Geophys. Res. Atmos. 2008, 113, D04302. [Google Scholar] [CrossRef]
- Degraeuwe, B.; Thunis, P.; Clappier, A.; Weiss, M.; Lefebvre, W.; Janssen, S.; Vranckx, S. Impact of passenger car NOX emissions on urban NO2 pollution—Scenario analysis for 8 European cities. Atmos. Environ. 2017, 171, 330–337. [Google Scholar] [CrossRef]
- Volke, M.I.; Abarca-Del-Rio, R.; Ulloa-Tesser, C. Impact of mobility restrictions on NO2 concentrations in key Latin American cities during the first wave of the COVID-19 pandemic. Urban Clim. 2023, 48, 101412. [Google Scholar] [CrossRef]
- Benchrif, A.; Wheida, A.; Tahri, M.; Shubbar, R.M.; Biswas, B. Air quality during three COVID -19 lockdown phases: AQI, PM2.5 and NO2 assessment in cities with more than 1 million inhabitants. Sustain. Cities Soc. 2021, 74, 103170. [Google Scholar] [CrossRef]
- Wyche, K.; Nichols, M.; Parfitt, H.; Beckett, P.; Gregg, D.; Smallbone, K.; Monks, P. Changes in ambient air quality and atmospheric composition and reactivity in the South East of the UK as a result of the COVID-19 lockdown. Sci. Total Environ. 2020, 755, 142526. [Google Scholar] [CrossRef]
- Zhang, Q.; Pan, Y.; He, Y.; Walters, W.W.; Ni, Q.; Liu, X.; Xu, G.; Shao, J.; Jiang, C. Substantial nitrogen oxides emission reduction from China due to COVID-19 and its impact on surface ozone and aerosol pollution. Sci. Total Environ. 2020, 753, 142238. [Google Scholar] [CrossRef]
- McDuffie, E.E.; Smith, S.J.; O’Rourke, P.; Tibrewal, K.; Venkataraman, C.; Marais, E.A.; Zheng, B.; Crippa, M.; Brauer, M.; Martin, R.V. A global anthropogenic emission inventory of atmospheric pollutants from sector- and fuel-specific sources (1970–2017): An application of the Community Emissions Data System (CEDS). Earth Syst. Sci. Data 2020, 12, 3413–3442. [Google Scholar] [CrossRef]
- Jiang, L.; He, S.; Cui, Y.; Zhou, H.; Kong, H. Effects of the socio-economic influencing factors on SO2 pollution in Chinese cities: A spatial econometric analysis based on satellite observed data. J. Environ. Manag. 2020, 268, 110667. [Google Scholar] [CrossRef]
- Madkour, K.M. Monitoring the impacts of COVID-19 pandemic on climate change and the environment on Egypt using Sen-tinel-5P Images, and the Carbon footprint methodology. Egypt. J. Remote Sens. Space Sci. 2022, 25, 205–219. Available online: https://www.sciencedirect.com/science/article/pii/S1110982321000508 (accessed on 26 April 2023).
- Ghasempour, F.; Sekertekin, A.; Kutoglu, S.H. Google Earth Engine based spatio-temporal analysis of air pollutants before and during the first wave COVID-19 outbreak over Turkey via remote sensing. J. Clean. Prod. 2021, 319, 128599. [Google Scholar] [CrossRef]
- Kovács, K.D.; Haidu, I. Effect of Anti-COVID-19 Measures on Atmospheric Pollutants Correlated with the Economies of Medium-sized Cities in 10 Urban Areas of Grand Est Region, France. Sustain. Cities Soc. 2021, 74, 103173. [Google Scholar] [CrossRef]
- Stationary Source Emissions (Federal Service for Supervision of Natural Resources). Available online: https://rpn.gov.ru/open-service/analytic-data/statistic-reports/air-protect/ (accessed on 27 April 2023).
- OKVED2 Production Index (Real-Time). Available online: https://showdata.gks.ru/report/274128 (accessed on 27 April 2023).
- Sannigrahi, S.; Kumar, P.; Molter, A.; Zhang, Q.; Basu, B.; Basu, A.S.; Pilla, F. Examining the status of improved air quality in world cities due to COVID-19 led temporary reduction in anthropogenic emissions. Environ. Res. 2021, 196, 110927. [Google Scholar] [CrossRef] [PubMed]
- Barré, J.; Petetin, H.; Colette, A.; Guevara, M.; Peuch, V.-H.; Rouil, L.; Engelen, R.; Inness, A.; Flemming, J.; Pérez García-Pando, C.; et al. Estimating lock-down-induced European NO2 changes using satellite and surface observations and air quality models. Atmos. Chem. Phys. 2021, 21, 7373–7394. [Google Scholar] [CrossRef]
- Bar, S.; Parida, B.R.; Mandal, S.P.; Pandey, A.C.; Kumar, N.; Mishra, B. Impacts of partial to complete COVID-19 lockdown on NO2 and PM2.5 levels in major urban cities of Europe and USA. Cities 2021, 117, 103308. [Google Scholar] [CrossRef]
- Habiboğlu, O.; Çelik, Z.; Bölükbasi, Y. Research of Consumers’ Online Shopping Attitudes and Intentions, Based on Fear of Coronavirus (COVID-19) and Death Anxiety. In Proceedings of the 3rd International Conference on Innovative Studies of Contemporary Sciences, Tokyo, Japan, 19–21 February 2021. [Google Scholar]
- Webb, A.; McQuaid, R.W.; Webster, C.W.R. Moving learning online and the COVID-19 pandemic: A university response. World J. Sci. Technol. Sustain. Dev. 2021, 18, 1–19. [Google Scholar] [CrossRef]
- NAFI and Logitech: Most Employees Want to Work 2–3 Days a Week from Home. Available online: https://nafi.ru/analytics/issledovanie-gibridnogo-formata-raboty-nafi-i-logitech-bolshinstvo-sotrudnikov-khotyat-rabotat-2-3-d/ (accessed on 27 April 2023).
- Remote Work Is Back, but So Far on a Smaller Scale. Available online: https://www.superjob.ru/research/articles/113689/udalenka-vozvraschaetsya/ (accessed on 27 April 2023).






| No. | Name | Region | pop | area_sqkm |
|---|---|---|---|---|
| 1. | Moscow * | Moscow | 12,678,079 | 2549.7 |
| 2. | Saint Petersburg | St. Petersburg | 5,398,064 | 493.6 |
| 3. | Novosibirsk | Novosibirsk Region | 1,625,631 | 555.5 |
| 4. | Yekaterinburg | Sverdlovsk Region | 1,493,749 | 469.2 |
| 5. | Kazan | Republic of Tatarstan | 1,257,391 | 614.1 |
| 6. | Nizhny Novgorod | Nizhny Novgorod Region | 1,252,236 | 500.8 |
| 7. | Chelyabinsk | Chelyabinsk Region | 1,196,680 | 597.6 |
| 8. | Samara | Samara Region | 1,156,659 | 541.9 |
| 9. | Omsk | Omsk Region | 1,154,507 | 340.5 |
| 10. | Rostov-on-Don | Rostov Region | 1,137,904 | 852.6 |
| 11. | Ufa | Republic of Bashkortostan | 1,128,787 | 378.4 |
| 12. | Krasnoyarsk | Krasnoyarsk Territory | 1,093,771 | 810.8 |
| 13. | Voronezh | Voronezh Region | 1,058,261 | 599.4 |
| 14. | Perm | Perm Territory | 1,055,397 | 845.3 |
| 15. | Volgograd | Volgograd Region | 1,008,998 | 339.6 |
| 16. | Krasnodar | Krasnodar Territory | 932,629 | 385.1 |
| 17. | Saratov | Saratov Region | 838,042 | 473.2 |
| 18. | Tyumen | Tyumen Region | 807,271 | 270.7 |
| 19. | Togliatti | Samara Region | 699,429 | 318.5 |
| 20. | Izhevsk | Udmurt Republic | 648,146 | 331.1 |
| 21. | Barnaul | Altai Territory | 632,391 | 277.3 |
| 22. | Ulyanovsk | Ulyanovsk Region | 627,705 | 544.8 |
| 23. | Irkutsk | Irkutsk Region | 623,562 | 383.7 |
| 24. | Khabarovsk | Khabarovsk Territory | 616,372 | 213.2 |
| 25. | Yaroslavl | Yaroslavl Region | 608,353 | 325.1 |
| 26. | Vladivostok | Primorsky Territory | 606,561 | 501.7 |
| 27. | Makhachkala | Republic of Dagestan | 603,518 | 258.3 |
| 28. | Tomsk | Tomsk Region | 576,624 | 340.9 |
| 29. | Orenburg | Orenburg Region | 572,188 | 318.9 |
| 30. | Kemerovo | Kemerovo Region (Kuzbass) | 556,382 | 495.6 |
| 31. | Novokuznetsk | Kemerovo Region (Kuzbass) | 549,403 | 223.9 |
| 32. | Ryazan | Ryazan Region | 539,290 | 212.8 |
| 33. | Naberezhnye Chelny | Republic of Tatarstan | 533,839 | 166.7 |
| 34. | Astrakhan | Astrakhan Region | 529,793 | 299.1 |
| 35. | Penza | Penza Region | 520,300 | 360.8 |
| 36. | Kirov | Kirov Region | 518,348 | 177.3 |
| 37. | Lipetsk | Lipetsk Region | 508,573 | 164 |
| 38. | Balashikha | Moscow Region | 507,366 | 111.9 |
| 39. | Cheboksary | Chuvash Republic | 497,618 | 224.6 |
| 40. | Kaliningrad | Kaliningrad Region | 489,359 | 191.7 |
| 41. | Tula | Tula Region | 475,161 | 378.7 |
| 42. | Kursk | Kursk Region | 452,976 | 175.8 |
| 43. | Stavropol | Stavropol Territory | 450,680 | 81.4 |
| 44. | Sevastopol | Sevastopol City | 449,138 | 395.3 |
| 45. | Sochi | Krasnodar Territory | 443,562 | 143.1 |
| 46. | Ulan-Ude | Republic of Buryatia | 439,128 | 105.6 |
| 47. | Tver | Tver Region | 425,072 | 153.1 |
| 48. | Magnitogorsk | Chelyabinsk Region | 413,253 | 222.5 |
| 49. | Ivanovo | Ivanovo Region | 404,598 | 161.7 |
| 50. | Bryansk | Bryansk Region | 402,675 | 304 |
| 51. | Belgorod | Belgorod Region | 394,142 | 141.5 |
| 52. | Surgut | Khanty-Mansi Autonomous Okrug (Ugra) | 380,632 | 254.1 |
| 53. | Vladimir | Vladimir Region | 356,937 | 215 |
| 54. | Chita | Zabaikalsky Territory | 351,784 | 375 |
| 55. | Nizhny Tagil | Sverdlovsk Region | 349,008 | 165.4 |
| 56. | Arkhangelsk | Arkhangelsk Region | 346,979 | 170.8 |
| 57. | Simferopol | Republic of Crimea | 342,054 | 216.6 |
| 58. | Kaluga | Kaluga Region | 332,039 | 392.5 |
| 59. | Smolensk | Smolensk Region | 325,495 | 122 |
| 60. | Volzhsky | Volgograd Region | 323,906 | 115.1 |
| 61. | Yakutsk | Republic of Sakha (Yakutia) | 322,987 | 170.6 |
| 62. | Saransk | Republic of Mordovia | 320,612 | 84.7 |
| 63. | Cherepovets | Vologda Region | 314,834 | 290.7 |
| 64. | Kurgan | Kurgan Region | 312,364 | 173.9 |
| 65. | Vologda | Vologda Region | 310,302 | 166.2 |
| 66. | Orel | Oryol Region | 308,838 | 40.4 |
| 67. | Podolsk | Moscow Region | 308,130 | 98.5 |
| 68. | Grozny | Chechen Republic | 305,911 | 298.8 |
| 69. | Vladikavkaz | Republic of North Ossetia (Alania) | 303,597 | 132.2 |
| 70. | Tambov | Tambov Region | 292,140 | 114.3 |
| 71. | Murmansk | Murmansk Region | 287,847 | 135.2 |
| 72. | Petrozavodsk | Republic of Karelia | 281,023 | 271.8 |
| 73. | Nizhnevartovsk | Khanty-Mansi Autonomous Okrug (Ugra) | 277,668 | 75.2 |
| 74. | Kostroma | Kostroma Region | 276,929 | 99.3 |
| 75. | Sterlitamak | Republic of Bashkortostan | 276,394 | 61.2 |
| 76. | Novorossiysk | Krasnodar Territory | 274,956 | 1447.1 |
| 77. | Yoshkar-Ola | Republic of Mari El | 274,715 | 103.7 |
| 78. | Khimki | Moscow Region | 259,550 | 96.9 |
| City | Country | Reduction Date | Link |
|---|---|---|---|
| Paris | France | NO2 (−46%), CO (−2.4%) | Sannigrahi et al., 2021 [71] |
| NO2 (−29%) | Barré et al., 2021 [72] | ||
| NO2 (−40%) | Bar et al., 2021 [73] | ||
| London | UK | NO2 (−33%), | Wyche et al., 2021 [62] |
| NO2 (−34%), CO (−1%) | Sannigrahi et al., 2021 [71] | ||
| NO2 (−30%) | Barré et al., 2021 [72] | ||
| Milan | Italy | NO2 (−37%), CO (−3.2%) | Sannigrahi et al., 2021 [71] |
| NO2 (−31%) | Bar et al., 2021 [73] | ||
| Torino | Italy | NO2 (−54%) | Barré et al., 2021 [72] |
| NO2 (−37%) | Sannigrahi et al., 2021 [71] | ||
| Frankfurt | Germany | NO2 (−24%) | Barré et al., 2021 [72] |
| NO2 (−36%), CO (−0.7%) | Sannigrahi et al., 2021 [71] | ||
| Madrid | Spain | NO2 (−60%), | Barré et al., 2021 [72] |
| NO2 (−34%), CO (−1.3%) | Sannigrahi et al., 2021 [71] | ||
| NO2 (−21%) | Bar et al., 2021 [73] | ||
| Rotterdam | Netherlands | NO2 (−27%), CO (−0.01%) | Sannigrahi et al., 2021 [71] |
| NO2 (−13%), | Barré et al., 2021 [72] | ||
| Antwerp | Belgium | NO2 (−24%), CO (−1.4%) | Sannigrahi et al., 2021 [71] |
| NO2 (−23%), | Barré et al., 2021 [72] | ||
| Barcelona | Spain | NO2 (−29.4%), CO (−2.86%) | Sannigrahi et al., 2021 [71] |
| NO2 (−59%), | Barré et al., 2021 [72] | ||
| Brussels | Belgium | NO2 (−29%), | Barré et al., 2021 [72] |
| NO2 (−27.9%), CO (−0.10%) | Sannigrahi et al., 2021 [71] | ||
| Stockholm | Sweden | NO2 (−17%) | Barré et al., 2021 [72] |
| NO2 (−19.4%) | Bar et al., 2021 [73] | ||
| Warsaw | Poland | NO2 (−30%) | Barré et al., 2021 [72] |
| NO2 (−6%) | Bar et al., 2021 [73] | ||
| Amsterdam | Netherlands | NO2 (−17%) | Barré et al., 2021 [72] |
| Berlin | Germany | NO2 (−38%) | Barré et al., 2021 [72] |
| Helsinki | Finland | NO2 (−28%) | Barré et al., 2021 [72] |
| Oslo | Norway | NO2 (−51%) | Barré et al., 2021 [72] |
| Rome | Italy | NO2 (−40%) | Barré et al., 2021 [72] |
Disclaimer/Publisher’s Note: The statements, opinions and data contained in all publications are solely those of the individual author(s) and contributor(s) and not of MDPI and/or the editor(s). MDPI and/or the editor(s) disclaim responsibility for any injury to people or property resulting from any ideas, methods, instructions or products referred to in the content. |
© 2023 by the authors. Licensee MDPI, Basel, Switzerland. This article is an open access article distributed under the terms and conditions of the Creative Commons Attribution (CC BY) license (https://creativecommons.org/licenses/by/4.0/).
Share and Cite
Morozova, A.; Sizov, O.; Elagin, P.; Lobzhanidze, N.; Fedash, A.; Mironova, M. Evaluation of the Impact of COVID-19 Restrictions on Air Pollution in Russia’s Largest Cities. Atmosphere 2023, 14, 975. https://doi.org/10.3390/atmos14060975
Morozova A, Sizov O, Elagin P, Lobzhanidze N, Fedash A, Mironova M. Evaluation of the Impact of COVID-19 Restrictions on Air Pollution in Russia’s Largest Cities. Atmosphere. 2023; 14(6):975. https://doi.org/10.3390/atmos14060975
Chicago/Turabian StyleMorozova, Anna, Oleg Sizov, Pavel Elagin, Natalia Lobzhanidze, Anatoly Fedash, and Marina Mironova. 2023. "Evaluation of the Impact of COVID-19 Restrictions on Air Pollution in Russia’s Largest Cities" Atmosphere 14, no. 6: 975. https://doi.org/10.3390/atmos14060975
APA StyleMorozova, A., Sizov, O., Elagin, P., Lobzhanidze, N., Fedash, A., & Mironova, M. (2023). Evaluation of the Impact of COVID-19 Restrictions on Air Pollution in Russia’s Largest Cities. Atmosphere, 14(6), 975. https://doi.org/10.3390/atmos14060975


