Communication

Culturable Airborne Fungi in Downtown Monterrey (Mexico) and Their Correlation with Air Pollution over a 12-Month Period

by
María Dolores Fernández-Gracia
1,
Mariana Elizondo-Zertuche
2,
Nydia Orué
1,
Rogelio de Jesús Treviño-Rangel
2,
Iram Pablo Rodríguez-Sánchez
1,
Juan Manuel Adame-Rodríguez
1,
Patricio Adrián Zapata-Morín
1,* and
Efrén Robledo-Leal
1,*
1
Department of Microbiology and Immunology, School of Biological Sciences, Universidad Autónoma de Nuevo León, San Nicolás de los Garza 66455, Nuevo León, Mexico
2
Department of Microbiology, School of Medicine, Universidad Autónoma de Nuevo León, Monterrey 64460, Nuevo León, Mexico
*
Authors to whom correspondence should be addressed.
Atmosphere 2023, 14(6), 983; https://doi.org/10.3390/atmos14060983
Submission received: 20 April 2023 / Revised: 27 May 2023 / Accepted: 1 June 2023 / Published: 6 June 2023
(This article belongs to the Section Air Quality and Human Health)

Abstract

:
Biological and non-biological aerosols are always present. According to the World Health Organization (WHO), air pollution is responsible for seven million deaths every year. The dynamics of airborne fungi and their association with air pollutants over time show mixed results. In this study, we sampled 50 L of air daily for a period of 12 months (February 2022–January 2023) in downtown Monterrey, Mexico to evaluate the presence of culturable fungi. May, October, November, and December were the months with the highest concentration of fungi with a significant difference from the rest of the months. Cladosporium was the predominant fungus in the air for every month except for September. Aspergillus, Fusarium, and Penicillium followed Cladosporium as the genera with the highest concentration. PM10, PM2.5, and NO2 were the most abundant pollutants, with levels above the recommended guidelines in practically every month studied. Cladosporium was the only fungus showing an inverse correlation with PM10 and PM2.5 in February, April, and May. It also showed an inverse correlation with NO, NO2, and NOx in February, March, and April. Aspergillus, Alternaria, Fusarium, and Penicillium had mixed correlations with pollutants. Yeasts showed no correlation with PM10 or PM2.5 but showed inverse correlations with nitrogen-based pollutants.

1. Introduction

Air pollution is a public health issue that has increased in importance in the city of Monterrey, Nuevo León (México) over the last decade. The presence of particulate matter suspended in the air represents a constant health risk, especially in urban areas with a highly industrialized environment where they can be highly concentrated. These aerosols can be either biological or non-biological and may be generated essentially from four different sources: industry (stationary sources), motor vehicles (mobile sources), wood burning, agriculture, and local commerce (area sources), and dust from wind (natural sources). According to the World Health Organization (WHO), air pollution is responsible for nearly seven million deaths worldwide every year, with nine out of every ten people on the planet breathing air that exceeds their guideline limits and which contains high levels of pollutants, with low- and middle-income countries suffering from the highest exposures [1]. Gaseous pollutants include ozone (O3), nitrogen dioxide (NO2), sulfur dioxide (SO2), carbon monoxide (CO), and volatile organic compounds (VOCs). These gases can react with each other and with other substances in the air to form secondary pollutants, such as smog and acid rain. Gaseous pollutants can cause respiratory and cardiovascular diseases, irritation of the eyes, nose, and throat, and damage to the lungs and other organs.
Particulate matter (PM) is a mixture of solid and liquid particles that vary in size, shape, composition, and origin. PM can be divided into coarse particles (PM10), fine particles (PM2.5), and ultrafine particles (PM0.1). Coarse particles are mainly generated by mechanical processes such as road dust, construction activities, and wind erosion. Fine particles are mostly formed by combustion processes such as motor vehicles, power plants, and wildfires. Ultrafine particles are produced by the nucleation of gas molecules or by fragmentation of larger particles; these PM can penetrate deep inside the lungs or surpass the lung barrier and enter the blood system, respectively, causing a wide range of illnesses; while their effects on human health are complex and not fully understood, several studies have suggested that exposure to the air microbiome and pollution can have adverse impacts on the respiratory system (impaired lung function, inflammation and oxidative stress in the airways and lung tissue, bronchial hyperreactivity and asthma, increased susceptibility to respiratory infections, increased risk of chronic obstructive pulmonary disease and lung cancer) [1,2], cardiovascular system (systemic inflammation, oxidative stress, altered blood pressure, heart rate variability, atherosclerosis promotion, thrombosis, impaired endothelial function and vascular reactivity, increased cardiac arrhythmias, ischemia, risk of stroke and myocardial infarction) [3,4,5,6], immune system (affecting the production and function of cytokines, chemokines, antibodies, and immune cells, influencing the activation and differentiation of T cells and B cells, enhancing or suppressing allergic responses and autoimmune diseases, altering the susceptibility to infectious agents and vaccines) [7], gut microbiota (dysbiosis, increasing intestinal permeability and inflammation, altering the production of short-chain fatty acids and other metabolites that regulate host metabolism and immunity) [8,9], a correlation with autism and brain inflammation diseases [10,11], and a general increase in risk of mortality [12,13].
The city of Monterrey is of a highly industrial nature, being thus considered “the industrial capital of México”, mostly because of its manufacturing activities. Along with this, there are more than three million vehicles in circulation and the city of Cadereyta, only 40 km away from the metropolitan area, holds the third largest refinery in Mexico, producing fumes and smoke that is constantly taken by the wind into Monterrey’s metropolitan area. Because of these factors, among others, Monterrey was ranked by the Pan American Health Organization as the third most polluted city in Latin America regarding PM10 [14] and is currently one of the most polluted cities in Mexico [15].
Air pollution can also affect the composition and diversity of the microbial communities that inhabit the air. The air microbiome consists of bacteria, viruses, fungi, and other microorganisms that are suspended in the air or attached to PM. The air microbiome can be influenced by various factors, such as geographic location, season, weather, vegetation, human activity, and pollution level. The air microbiome can have both beneficial and detrimental effects on human health. On one hand, some airborne microorganisms can stimulate the immune system, produce antimicrobial substances, or degrade pollutants. On the other hand, some airborne microorganisms can cause infections, allergies, asthma, or exacerbate existing diseases. One of the most studied aspects of the air microbiome is its potential role in the transmission and severity of respiratory viral infections, such as influenza, SARS-CoV-1, MERS-CoV, and SARS-CoV-2 [16]. These viruses can be transmitted through respiratory droplets or aerosols that contain viral particles and other components of the air microbiome. The interaction between viruses and other microorganisms in the air can affect the infectivity, stability, and pathogenicity of the viruses. For example, some bacteria or fungi can enhance or inhibit viral replication or attachment to host cells. Some bacteria or fungi can also modulate the host’s immune response to viral infection by inducing or suppressing inflammation or cytokine production.
Another important aspect of the air microbiome is its relationship with air pollution. Air pollution can alter the diversity and abundance of airborne microorganisms by selecting for resistant or tolerant species or by providing substrates for microbial growth or metabolism. Air pollution can also affect the viability and activity of airborne microorganisms by causing physical damage or oxidative stress. Moreover, air pollution can influence the interaction between airborne microorganisms and human health by modifying the exposure dose or route of infection or by altering the host’s susceptibility or response to microbial agents.
Previous reports have found both positive [17] and inverse [18] correlations between air pollutants and airborne fungi, with no clear resolution due to the complexity of variables involved both in terms of pollution and meteorology. Currently, there are no previous studies performed in Monterrey showing the dynamics of fungal presence in the air in relation to pollution. To provide more data on this subject and especially in the context of a city with highly polluted air such as Monterrey (México), we evaluated, for the first time in our city, the presence of culturable airborne fungi and their correlation with air pollutants over a 12-month period with daily sampling, from February 2022 to January 2023.

2. Materials and Methods

2.1. Area of Study

The sampling site was an open-air parking lot located on the 9th floor of an office building in downtown Monterrey (25.667863838034968, −100.31687384473982). This site was selected because it combined ease of access to an elevated open-air space and proximity to an environmental monitoring station from the State Environment Secretary, which constantly measures air pollution, so we considered the air quality in both sites as equivalent. Fungal concentration was analyzed for correlations with carbon monoxide (CO), nitric oxide (NO), nitric dioxide (NO2), nitric oxides (NOx), ozone (O3), sulfur dioxide (SO2), PM10, and PM2.5.

2.2. Sampling Method

Air samples were taken using an AirTest® device (LCB Food Safety, Boz, France). Following a previous report [19] a total of 50 L of air were impacted on Petri dishes containing Rose Bengal-malt extract-agar (RBME; BD, Franklin Lakes, NJ, USA). This media has offered us reliable and reproducible results while also slowing the fungal radial growth, allowing for better colony enumeration. The sampling device was located 1.5 m above the ground and all samples were taken 3 times. All samples were taken between 10:00 and 13:00 hrs.

2.3. Fungal Quantitation and Identification

Starting on day 5 of incubation, colony-forming units (CFU) were quantified according to the manufacturer’s instructions and microscopic structures were identified based on morphological features [20,21,22]. Fungi that did not sporulate after 30 days were reported as sterile mycelium. Yeasts were considered a group by themselves because morphological identification is not feasible.

2.4. Pollution Data Retrieval and Analysis

Data regarding air pollutants were retrieved online from the National System for Air Quality Information (SINAICA by its acronym in Spanish), which monitors air quality with 15 stations distributed around the metropolitan area of Monterrey [23]. We used data from the Obispado station because it was the closest one to the sampling site and thus it was appropriate for air quality to be equivalent. Pollutants included carbon monoxide (CO), nitric oxide (NO), nitric dioxide (NO2), nitrogen oxides (NOx), ozone (O3), PM10, PM2.5, and sulfur dioxide (SO2). Correlations between fungal concentration and air pollutants were analyzed in a monthly fashion comparing air pollutants to total fungal concentration and to fungal concentration grouped by genera, including yeasts and sterile mycelium as independent groups.

2.4.1. Statistical Analysis

The results were analyzed using RStudio Software version 4.2.2, data values were converted to a common logarithm to handle extreme values for normalization purposes. Normality testing was performed with ShapiroWilk to determine the need for non-parametric testing, which was utilized for all subsequent analyses. Group comparisons were carried out using a t-test or ANOVA for normally distributed data and for the non-normally distributed, the non-parametric Mann–Whitney U test or Kruskal–Wallis tests were used. Alpha values were set at 0.05. Linear regression analysis was used for normally distributed data and TheilSen Regression for the non-normally distributed with the alpha value set at 0.05.

2.4.2. Fold Change Analysis

Fold change (FC) was measured by taking, as baseline 0, the recommended average 24 h exposure thresholds set by the WHO for each contaminant (PM2.5: 15 μg/m3, PM10: 45 μg/m3, NO2: 0.025 ppm). The number of units up (+) or down (−) quantifies how each contaminant’s daily average behaves relative to its baseline.

3. Results

Airborne Fungi Diversity and Concentration

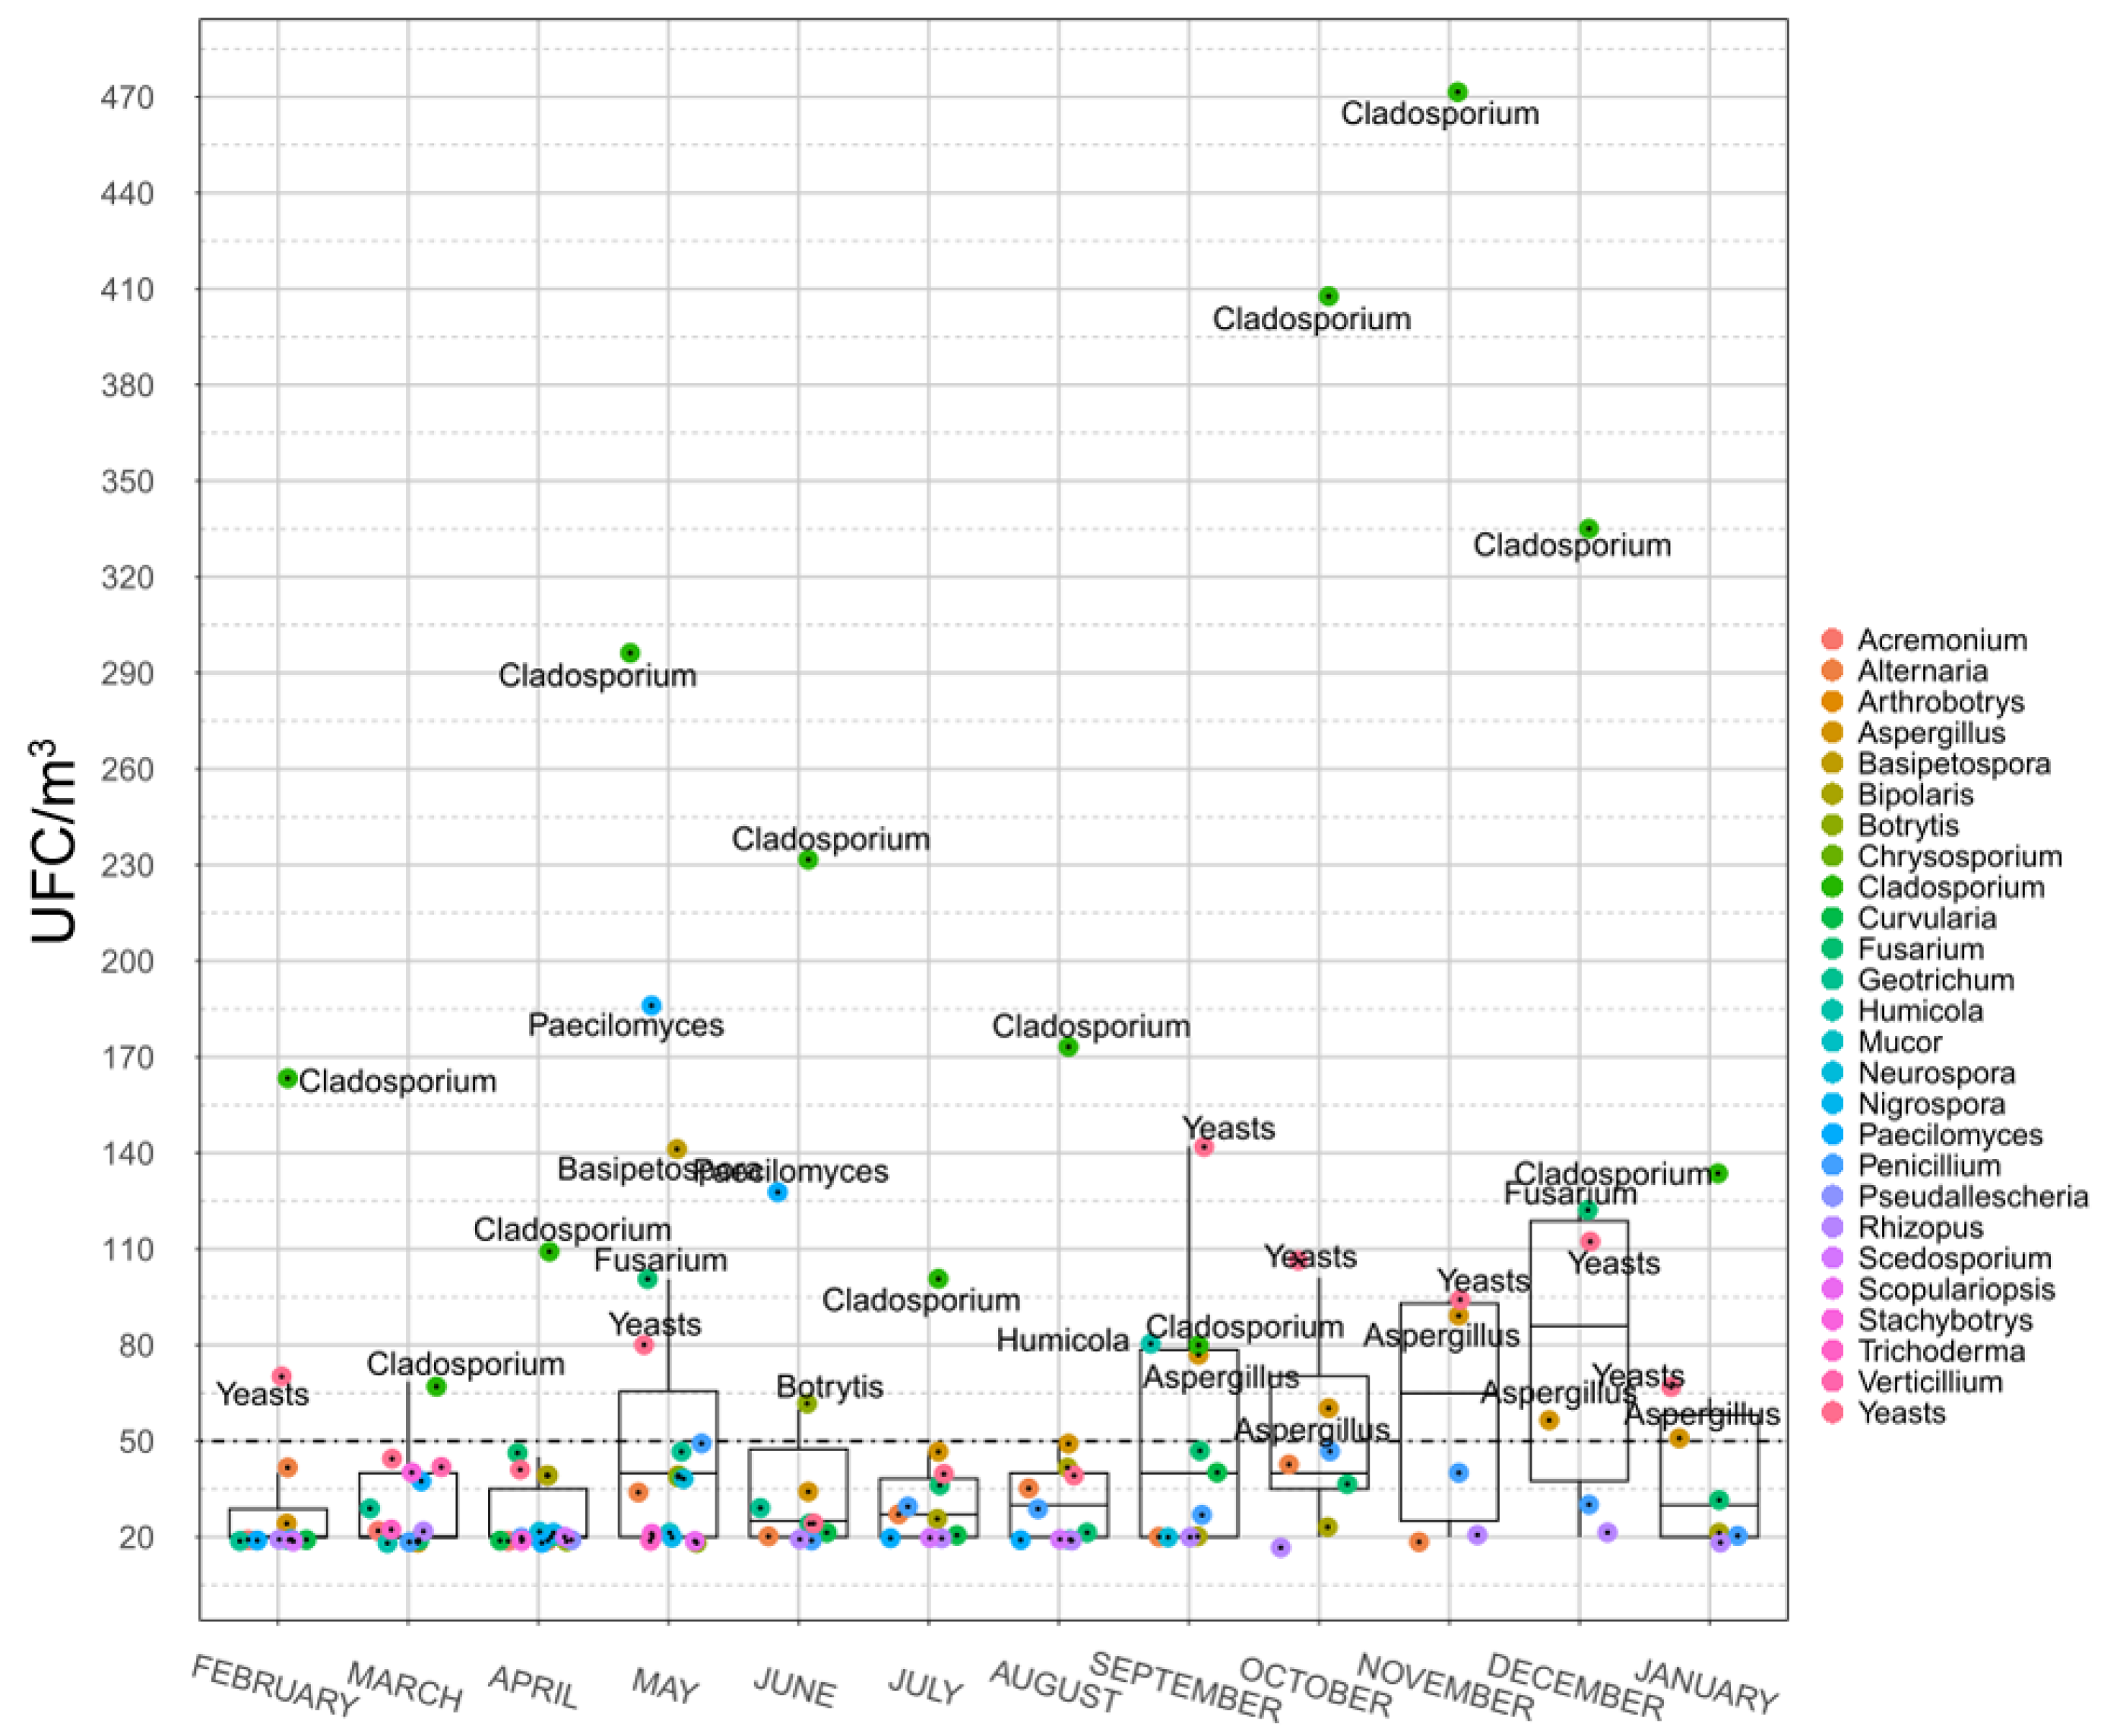
The accumulated colony number during the 12-month sampling showed that 98% of the fungi isolated were represented by (in descending order): Cladosporium, sterile mycelium, yeasts, Aspergillus, Fusarium, and Penicillium (Table 1). The months with the highest concentration of airborne fungi were May, October, November, and December, showing significantly higher fungal concentrations than the rest of the months (p < 0.05), which in turn did not show any statistical difference between each other (Figure 1). Using previous data due to their similarity and depth of analysis [24,25], May, October, November, and December showed abnormally high values of fungal propagules in the air. With respect to genus, Cladosporium were the most abundant fungi for the whole year except for September where yeasts (as a group) exhibited the highest concentration (Figure 2).
Regarding air pollutants, PM10, PM2.5, and NO2 were the only ones exceeding the daily level recommended by the WHO. During the 12-month period of this study, the monthly average levels for these two pollutants were several times above the annual recommended level, with NO2 also being beyond the guidelines (Figure 3). This clearly illustrates why Monterrey is one of Mexico’s and Latin America’s most polluted cities.
From a monthly perspective, correlations were found between total fungal UFC and at least one air pollutant in March, April, May, June, July, August, November, and December; correlations with PM10 and PM2.5 were found in April and May, the same months that exhibited the greatest number of daily averages above 1.5 times the recommended levels by the WHO for both PM10 and PM2.5. All correlations found between fungi concentration and air pollutants were inverse, i.e., the increase in pollutant level had a statistical correlation with the decrease in fungal concentration in the air, with the only exception being for PM10 in March, which showed a positive correlation (Table 2). The highest concentration recorded for any fungal genera happened during November and it corresponded to Cladosporium (Figure 3); this was also the month with the lowest levels of PM2.5.
Correlations between pollutants and specific genera were also found; among the top five fungal genera isolated, Cladosporium was the only one showing an inverse correlation with PM10 and PM2.5 in February, April, and May. This genus also showed an inverse correlation with NO, NO2, and NOx in February, March, and April, making O3 and SO2 (February and December, respectively) the only two pollutants with which Cladosporium showed a positive correlation. For other genera such as Aspergillus, Alternaria, Fusarium, and Penicillium, there were mixed correlations with pollutants. Yeasts showed no correlation with PM10 or PM2.5 but showed inverse correlations with nitrogen-based pollutants (Table 3). These results suggest a possible detrimental influence of fungal concentrations on PM2.5 and NO2, which appears to be shadowed when PM10 is elevated, probably because the composition of PM10 consists partly of fungal spores.

4. Discussion

Airborne fungi are a potential human health hazard, especially for individuals with weakened immune systems or those with increased susceptibility to aerosol allergens including those with asthma and reactive airway disease. In our study, the most prevalent genus isolated was Cladosporium, which represented the highest number of CFU for every month but September. When considering the frequency instead of the concentration (i.e., how many times a genus appeared in a month), Aspergillus, Penicillium, Alternaria, and Fusarium were among the most common genera isolated along with Cladosporium and yeasts. This shows agreement with many other reports of fungi in the air, both outdoor and indoor [24,25,26,27], and is relevant to human health for mainly a couple of reasons: all five genera, but especially Aspergillus, Penicillium, Alternaria, and Cladosporium, have been strongly reported as involved with the sensitization and exacerbation of respiratory conditions [28,29,30,31]. This issue, together with the fact that the air in Monterrey constantly surpasses the recommended values for pollutants, represents a double threat to the population’s health from the same air. Although species identification was not part of the scope of this study, there is a considerable likelihood that A. fumigatus may be included in the pool of Aspergillus isolates obtained; this organism, along with Fusarium spp. and Scedosporium/Lomentospora, is considered in the fungal priority pathogen list released by the World Health Organization (WHO) in 2022 [32] in the Critical, High, and Medium priority groups, respectively. In this regard, the presence of medically important fungi in the air of a permanently polluted city represents a constant health risk for its inhabitants. It has been previously reported that air pollution, especially PM2.5 and PM10, is positively associated with increased respiratory infections from both viral and bacterial agents and also with an increase in other non-infectious respiratory diseases that weaken the lungs [16]. In 2019, Martínez-Muñoz et al. [13], reported the results of a mortality risk estimation associated with exposure to fine particulate matter in the same city where this study was done (Monterrey); in their results, they found a positive significant association between exposure to fine particulate matter and daily mortality in the metropolitan area of Monterrey, showing that an increase of 10 μg/m3 of PM2.5 was associated with an 11.16% increased risk of respiratory mortality in children ≤5 years old and 6.6% (95% CI 3.31–9.37) increased risk of pneumonia-influenza in adults ≥65 years old. Considering that during 2022, the average concentration of PM2.5 for every month of the year was higher than both the WHO recommendations and Mexican policies with monthly averages ranging from 14.3 to 34.38 μg/m3, the population of Monterrey lives with a permanently increased risk of respiratory diseases and with the presence of medically important fungi that can cause respiratory infections. In addition, the risk of fungal infections or even co-infections is feasible, particularly for Aspergillus [33].
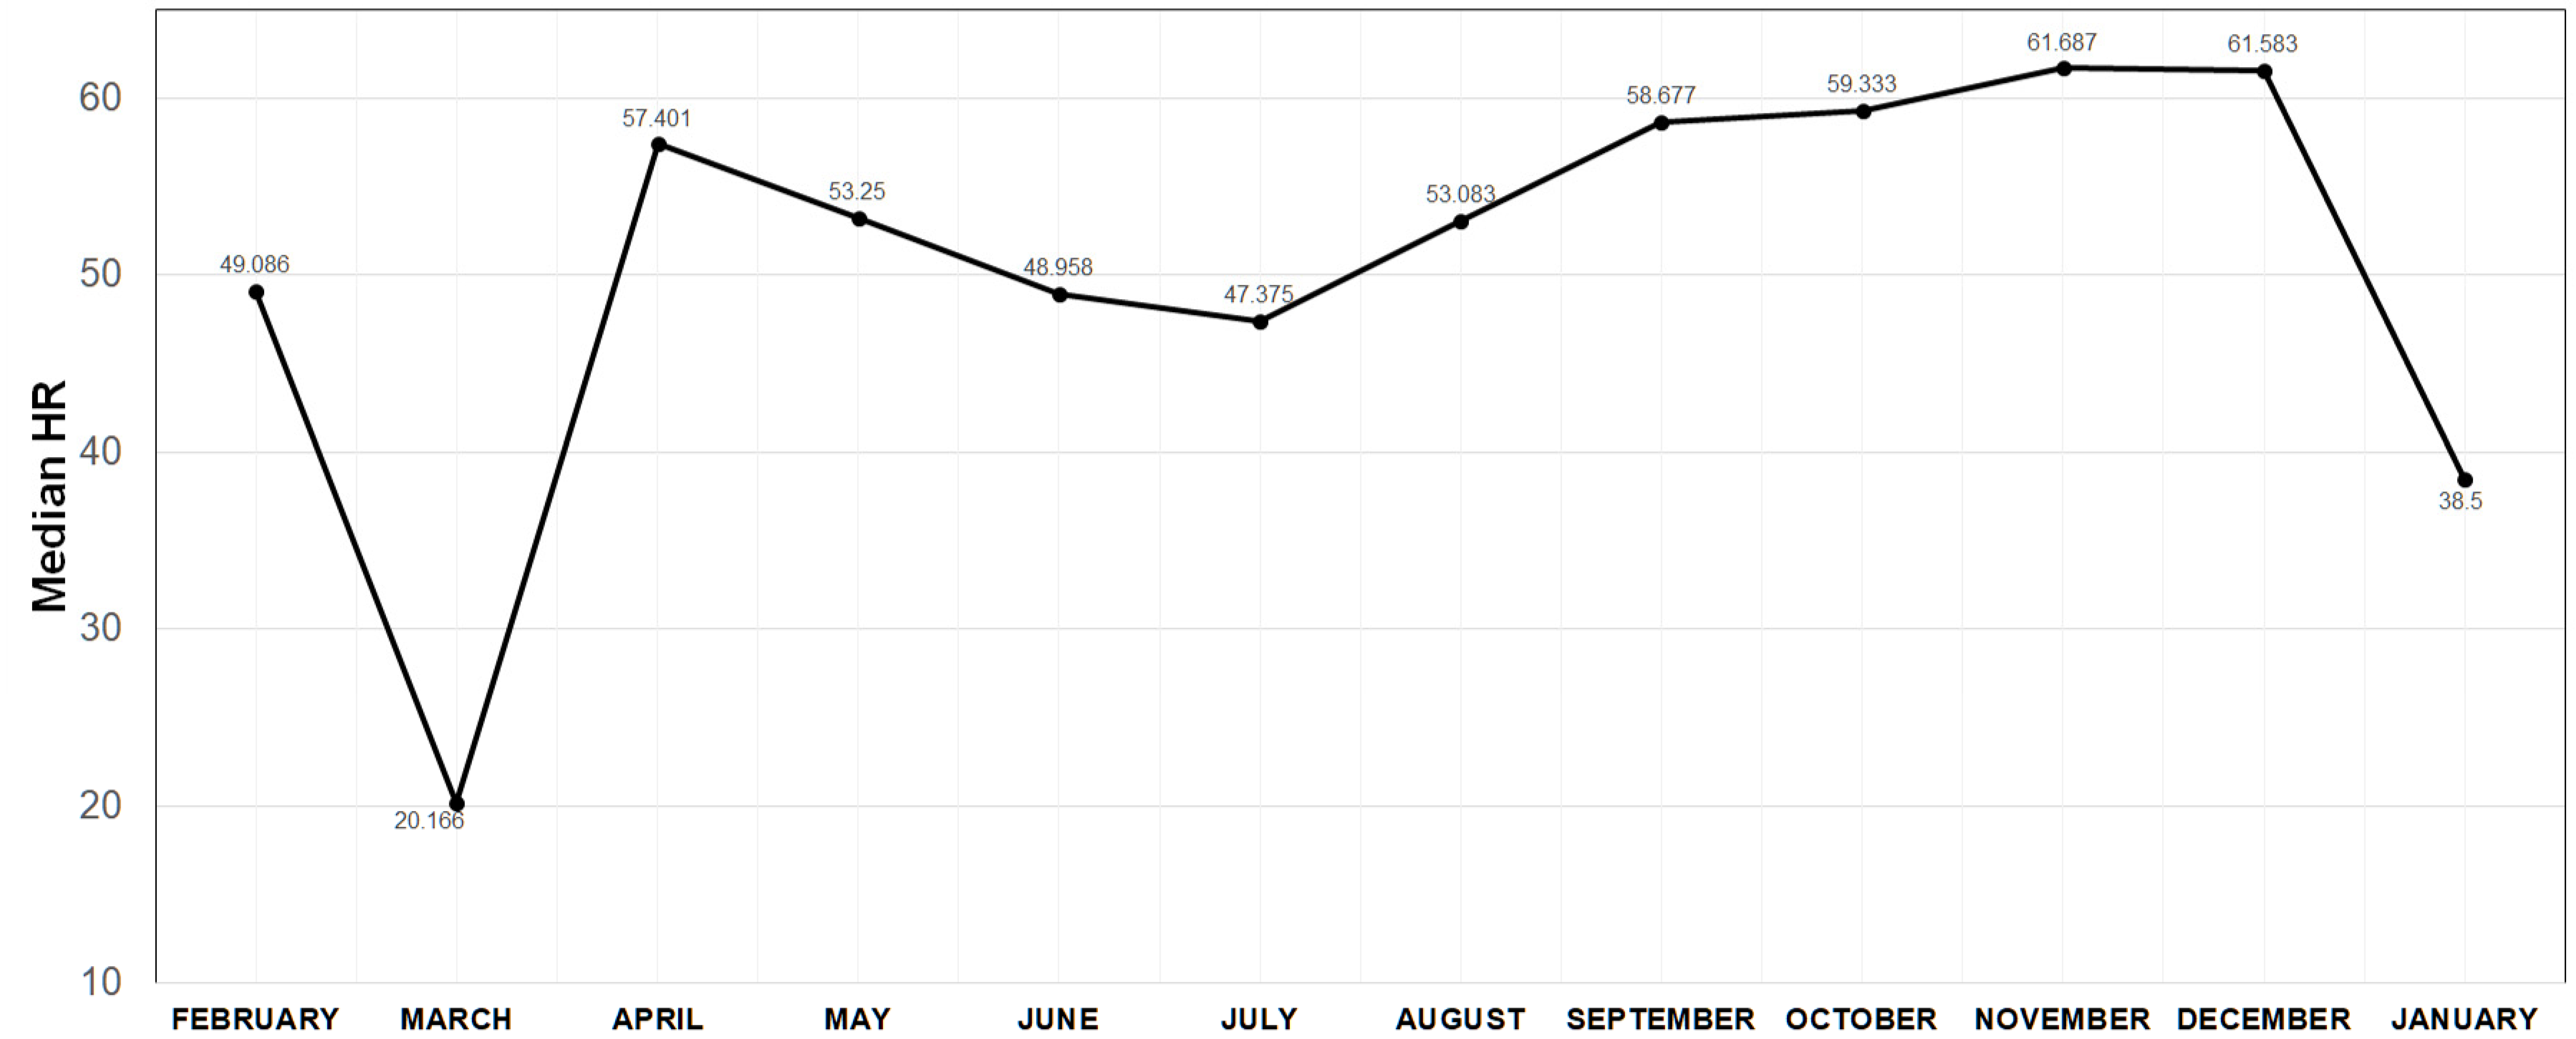
In the present study, Cladosporium was markedly the most abundant genus present in the air, followed by Aspergillus, Fusarium, and Penicillium. While yeasts were not identified, if they are considered as a group at the level of genus, they would be the second most abundant. This is relevant considering that yeasts are not usually highlighted when considering the risks of microbes in the air. In previous studies by our research group regarding airborne fungi in this city, Cladosporium, Aspergillus, and Penicillium were the most abundant genera isolated but Penicillium was the genus with the highest concentration instead of Cladosporium. This may be due to our previous work being about indoor fungi where environmental conditions could favor the growth of fungi other than Cladosporium. Our results show agreement with Rocha et al. (2015), where airborne fungi inside four churches in the metropolitan area of Monterrey were identified with a Hirst type volumetric collector, resulting in Cladosporium and Aspergillus/Penicillium being the most abundant fungi, respectively [34]. These genera have also been reported as the most abundant in outdoor air in other Mexican cities and other countries as well, regardless of the sampling and identification method [11,24,35]. Currently, there are no official guidelines that set recommendations for the levels of fungal concentrations in outdoor air and this also depends vastly on the fungal identity; however, taking previous similar studies as references [24,25], May, October, November, and December were the only months that showed higher concentrations than those reports. These concentrations may be explained by the fact that these months also showed high values of relative humidity (RH, Figure 4).
The possible correlation between fungal concentration and pollutants has been evaluated before, with results showing both positive and negative correlations. A recent publication [36] reported the bacteria and fungi concentrations in the air during a 7-day period in an urban area during which an important vehicle reduction occurred. The results showed that lower pollution in the air allowed for an increase in airborne fungi concentration, suggesting that air pollutants negatively impact the survival of fungi. It is noteworthy that among their most common genera isolated, they found Aspergillus and Penicillium but not a single Cladosporium colony was detected. In contrast, Cao et al. (2014), reported a positive correlation between PM10 and microbial concentration during a severe smog event in Beijing [17]. This is similar to what was recently published by Goralska et al. (2022) [18] regarding an analysis of the bacterial and fungal communities in the air of 10 selected parks in Poland and their relationship with pollution. Both studies showed an association between fungal concentration and PM10 levels, which could be explained by the particle size of fungi. However, the report showed that for bacteria, there is an inverse correlation with PM2.5 and, for both bacteria and fungi, an inverse correlation was also found with NO2, NOx, and SO2. These results show agreement with what is presented here, suggesting a possible detrimental effect of these pollutants on fungi. These effects could be enhanced or counteracted by weather conditions, especially RH, as is shown by the levels exhibited during the time period of this study and where months with higher and lower amounts of UFC concentration show a correspondence to the months with high and low RH (Figure 4); since moisture is one of the main requirements for fungal growth, the direct effect of air pollution on fungal viability may require an RH baseline in order to avoid bias, which could explain why March, the month with the lowest RH, was the only month with a positive correlation between PM10 and fungi.

5. Conclusions

Our results reaffirm that Cladosporium, Aspergillus, and Penicillium are the most abundant fungal genera in the air, with the inclusion of yeasts and, of particular interest, Fusarium. As a fungal contaminant, Fusarium, as a whole genus, has gained remarkable interest because of its ability to infect human tissue, together with its high resistance to antifungal drugs. Its presence as the third most abundant genus recovered from the air should raise awareness towards the monitoring of areas where susceptible patients live or where food or medical products that interact with the human body are developed.
Regarding air pollutants, 10 out of 12 months showed at least one pollutant statistically correlated to fungi. All of these correlations except one were inverse, where fungal concentrations decreased as air pollutants increased. While many other variables are important for these interactions such as temperature, humidity, wind, etc., our results suggest that fungal viability may be affected by toxic air particles. In order to confirm this, simulations of the interaction between fungi and pollutants in controlled conditions should be assayed and are thus projected in the near future.

Author Contributions

Conceptualization, E.R.-L. and P.A.Z.-M.; methodology, E.R.-L. and M.D.F.-G.; validation, N.O.; formal analysis, R.d.J.T.-R.; investigation, E.R.-L.; resources, J.M.A.-R.; data curation, P.A.Z.-M.; writing—original draft preparation, M.D.F.-G.; writing—review and editing, I.P.R.-S. and M.E.-Z.; visualization, supervision, project administration and funding acquisition, E.R.-L. and P.A.Z.-M. All authors have read and agreed to the published version of the manuscript.

Funding

This research received no external funding.

Institutional Review Board Statement

Not applicable.

Informed Consent Statement

Not applicable.

Data Availability Statement

Data is available upon request via e-mail to any of the corresponding authors.

Acknowledgments

We are thankful to Marcelo Guajardo for his support in this research.

Conflicts of Interest

The authors declare no conflict of interest.

References

  1. United States Environmental Protection Agency. Available online: https://www.epa.gov/pmcourse/particle-pollution-and-respiratory-effects (accessed on 19 May 2023).
  2. World Health Organization. Air Pollution. Available online: https://www.who.int/health-topics/air-pollution#tab=tab_2 (accessed on 3 January 2021).
  3. Brook, R.D.; Rajagopalan, S.; Pope, C.A., 3rd; Brook, J.R.; Bhatnagar, A.; Diez-Roux, A.V.; Holguin, F.; Hong, Y.; Luepker, R.V.; Mittleman, M.A.; et al. Particulate Matter Air Pollution and Cardiovascular Disease: An update to the scientific statement from the american heart association. Circulation 2010, 121, 2331–2378. [Google Scholar] [CrossRef] [PubMed] [Green Version]
  4. Cortes, T.R.; Silveira, I.H.; de Oliveira, B.F.A.; Bell, M.L.; Junger, W.L. Short-term association between ambient air pollution and cardio-respiratory mortality in Rio de Janeiro, Brazil. PLoS ONE 2023, 18, e0281499. [Google Scholar] [CrossRef] [PubMed]
  5. Cosselman, K.E.; Navas-Acien, A.; Kaufman, J.D. Environmental factors in cardiovascular disease. Nat. Rev. Cardiol. 2015, 12, 627–642. [Google Scholar] [CrossRef]
  6. Yang, Y.-S.; Pei, Y.-H.; Gu, Y.-Y.; Zhu, J.-F.; Yu, P.; Chen, X.-H. Association between short-term exposure to ambient air pollution and heart failure: An updated systematic review and meta-analysis of more than 7 million participants. Front. Public Health 2023, 10, 948765. [Google Scholar] [CrossRef] [PubMed]
  7. Rook, G.A. Regulation of the immune system by biodiversity from the natural environment: An ecosystem service essential to health. Proc. Natl. Acad. Sci. USA 2013, 110, 18360–18367. [Google Scholar] [CrossRef] [Green Version]
  8. Mutlu, E.A.; Engen, P.A.; Soberanes, S.; Urich, D.; Forsyth, C.B.; Nigdelioglu, R.; Chiarella, S.E.; Radigan, K.A.; Gonzalez, A.; Jakate, S.; et al. Particulate matter air pollution causes oxidant-mediated increase in gut permeability in mice. Part. Fibre Toxicol. 2011, 8, 19. [Google Scholar] [CrossRef] [Green Version]
  9. Zhang, L.; Nichols, R.G.; Correll, J.; Murray, I.A.; Tanaka, N.; Smith, P.B.; Hubbard, T.D.; Sebastian, A.; Albert, I.; Hatzakis, E.; et al. Persistent Organic Pollutants Modify Gut Microbiota–Host Metabolic Homeostasis in Mice Through Aryl Hydrocarbon Receptor Activation. Environ. Health Perspect. 2015, 123, 679–688. [Google Scholar] [CrossRef] [Green Version]
  10. Imbriani, G.; Panico, A.; Grassi, T.; Idolo, A.; Serio, F.; Bagordo, F.; De Filippis, G.; De Giorgi, D.; Antonucci, G.; Piscitelli, P.; et al. Early-Life Exposure to Environmental Air Pollution and Autism Spectrum Disorder: A Review of Available Evidence. Int. J. Environ. Res. Public Health 2021, 18, 1204. [Google Scholar] [CrossRef]
  11. Calderón-Garcidueñas, L.; Reed, W.; Maronpot, R.R.; Henríquez-Roldán, C.; Delgado-Chavez, R.; Calderón-Garcidueñas, A.; Dragustinovis, I.; Franco-Lira, M.; Aragón-Flores, M.; Solt, A.C.; et al. Brain Inflammation and Alzheimer’s-Like Pathology in Individuals Exposed to Severe Air Pollution. Toxicol. Pathol. 2004, 32, 650–658. [Google Scholar] [CrossRef]
  12. Anita, W.M.; Ueda, K.; Uttajug, A.; Seposo, X.T.; Takano, H. Association between Long-Term Ambient PM2.5 Exposure and under-5 Mortality: A Scoping Review. Int. J. Environ. Res. Public Health 2023, 20, 3270. [Google Scholar] [CrossRef]
  13. Martínez-Muñoz, A.; Hurtado-Díaz, M.; Cruz, J.C.; Riojas-Rodríguez, H. Mortalidad aguda asociada con partículas suspendidas finas y gruesas en habitantes de la Zona Metropolitana de Monterrey. Salud Pública México 2020, 62, 468–476. [Google Scholar] [CrossRef] [PubMed]
  14. Riojas-Rodríguez, H.; da Silva, A.S.; Sangrador, J.L.T.; Moreno-Banda, G.L. Air pollution management and control in Latin America and the Caribbean: Implications for climate change. Rev. Panam. De Salud Pública 2016, 40, 150–159. [Google Scholar]
  15. IQAir. Available online: https://www.iqair.com/mx/mexico (accessed on 20 May 2023).
  16. Moelling, K.; Broecker, F. Air Microbiome and Pollution: Composition and Potential Effects on Human Health, Including SARS Coronavirus Infection. J. Environ. Public Health 2020, 2020, 1646943. [Google Scholar] [CrossRef] [PubMed]
  17. Cao, C.; Jiang, W.; Wang, B.; Fang, J.; Lang, J.; Tian, G.; Jiang, J.; Zhu, T.F. Inhalable Microorganisms in Beijing’s PM2.5 and PM10 Pollutants during a Severe Smog Event. Environ. Sci. Technol. 2014, 48, 1499–1507. [Google Scholar] [CrossRef]
  18. Góralska, K.; Lis, S.; Gawor, W.; Karuga, F.; Romaszko, K.; Brzeziańska-Lasota, E. Culturable Filamentous Fungi in the Air of Recreational Areas and Their Relationship with Bacteria and Air Pollutants during Winter. Atmosphere 2022, 13, 207. [Google Scholar] [CrossRef]
  19. Zapata-Morín, P.; Reyna-Martinez, R.; Orue, N.; Treviño-Rangel, R.D.J.; Elizondo-Zertuche, M.; Adame-Rodríguez, J.; Becerra-Siller, Y.; Sánchez-Ovalle, V.; Robledo-Leal, E. The Influence of Carpeting, Human Activity and Number of Beds on Airborne Fungi Concentration in Hotel Bedrooms. Appl. Sci. 2021, 11, 6773. [Google Scholar] [CrossRef]
  20. Larone, D.H. Medically Important Fungi: A Guide to Identification, 5th ed.; American Society for Microbiology: Washington, DC, USA, 2011. [Google Scholar] [CrossRef]
  21. Watanabe, T. Pictorial Atlas of Soil and Seed Fungi: Morphologies of Cultured Fungi and Key to Species; CRC Press Taylor & Francis: Boca Raton, FL, USA, 2010. [Google Scholar]
  22. Guarro, J. Atlas of Soil Ascomycetes; CBS-KNAW Fungal Biodiversity Centre: Utrech, The Netherland, 2007. [Google Scholar]
  23. Instituto Nacional de Ecología y Cambio Climático—Calidad del Aire. Available online: https://sinaica.inecc.gob.mx/estacion.php?estId=134 (accessed on 1 February 2023).
  24. Rosas, C.I.O.; Calderón-Ezquerro, M.D.C.; Gutiérrez-Ruacho, O.G. Fungal spores and pollen are correlated with meteorological variables: Effects in human health at Hermosillo, Sonora, Mexico. Int. J. Environ. Health Res. 2019, 30, 677–695. [Google Scholar] [CrossRef]
  25. Shelton, B.G.; Kirkland, K.H.; Flanders, W.D.; Morris, G.K. Profiles of Airborne Fungi in Buildings and Outdoor Environments in the United States. Appl. Environ. Microbiol. 2002, 68, 1743–1753. [Google Scholar] [CrossRef] [Green Version]
  26. Pavan, R.; Manjunath, K. Qualitative Analysis of Indoor and Outdoor Airborne Fungi in Cowshed. J. Mycol. 2014, 2014, 985921. [Google Scholar] [CrossRef] [Green Version]
  27. Calderón-Ezquerro, M.D.C.; Serrano-Silva, N.; Brunner-Mendoza, C. Aerobiological study of bacterial and fungal community composition in the atmosphere of Mexico City throughout an annual cycle. Environ. Pollut. 2021, 278, 116858. [Google Scholar] [CrossRef]
  28. Zhang, S.; Liang, Z.; Wang, X.; Ye, Z.; Li, G.; An, T. Bioaerosols in an industrial park and the adjacent houses: Dispersal between indoor/outdoor, the impact of air purifier, and health risk reduction. Environ. Int. 2023, 172, 107778. [Google Scholar] [CrossRef]
  29. Jaakkola, M.S.; Hyrkäs-Palmu, H.; Jaakkola, J.J.K. Residential Exposure to Dampness Is Related to Reduced Level of Asthma Control among Adults. Int. J. Environ. Res. Public Health 2022, 19, 11338. [Google Scholar] [CrossRef] [PubMed]
  30. Mortelliti, C.L.; Banzon, T.M.; Vieira, C.Z.; Phipatanakul, W. Environmental Exposures Impact Pediatric Asthma Within the School Environment. Immunol. Allergy Clin. N. Am. 2022, 42, 743–760. [Google Scholar] [CrossRef] [PubMed]
  31. Peeters, S.; Wang, C.; Bijnens, E.M.; Bullens, D.M.A.; Fokkens, W.J.; Bachert, C.; Hellings, P.W.; Nawrot, T.S.; Seys, S.F. Association between outdoor air pollution and chronic rhinosinusitis patient reported outcomes. Environ. Health 2022, 21, 134. [Google Scholar] [CrossRef] [PubMed]
  32. WHO Fungal Priority Pathogens List to Guide Research, Development and Public Health Action; Licence: CC BY-NC-SA 3.0 IGO; World Health Organization: Geneva, Switzerland, 2022.
  33. Castro-Fuentes, C.A.; Reyes-Montes, M.D.R.; Frías-De-León, M.G.; Valencia-Ledezma, O.E.; Acosta-Altamirano, G.; Duarte-Escalante, E. Aspergillus-SARS-CoV-2 Coinfection: What Is Known? Pathogens 2022, 11, 1227. [Google Scholar] [CrossRef] [PubMed]
  34. Estrada, A.R.; Torres, E.M.; Vázquez, M.A.A.; Piñero, J.L.H.; Lucio, M.A.G.; Martínez, S.M.S. Fungal spores in four catholic churches in the metropolitan area of Monterrey, Nuevo León State, Mexico—First study. Ann. Agric. Environ. Med. 2015, 22, 221–226. [Google Scholar] [CrossRef] [Green Version]
  35. Flores, M.E.; Medina, P.G.; Camacho, S.P.; de Jesús Uribe Beltrán, M.; De la Cruz Otero, M.D.; Ramírez, I.O.; Hernández, M.E. Fungal spore concentrations in indoor and outdoor air in university libraries, and their variations in response to changes in meteorological variables. Int. J. Environ. Health Res. 2013, 24, 320–340. [Google Scholar] [CrossRef]
  36. Castro E Silva, D.M.; Marcusso, R.M.N.; Barbosa, C.G.G.; Gonçalves, F.L.T.; Cardoso, M.R.A. Air pollution and its impact on the concentration of airborne fungi in the megacity of São Paulo, Brazil. Heliyon 2020, 6, e05065. [Google Scholar] [CrossRef]
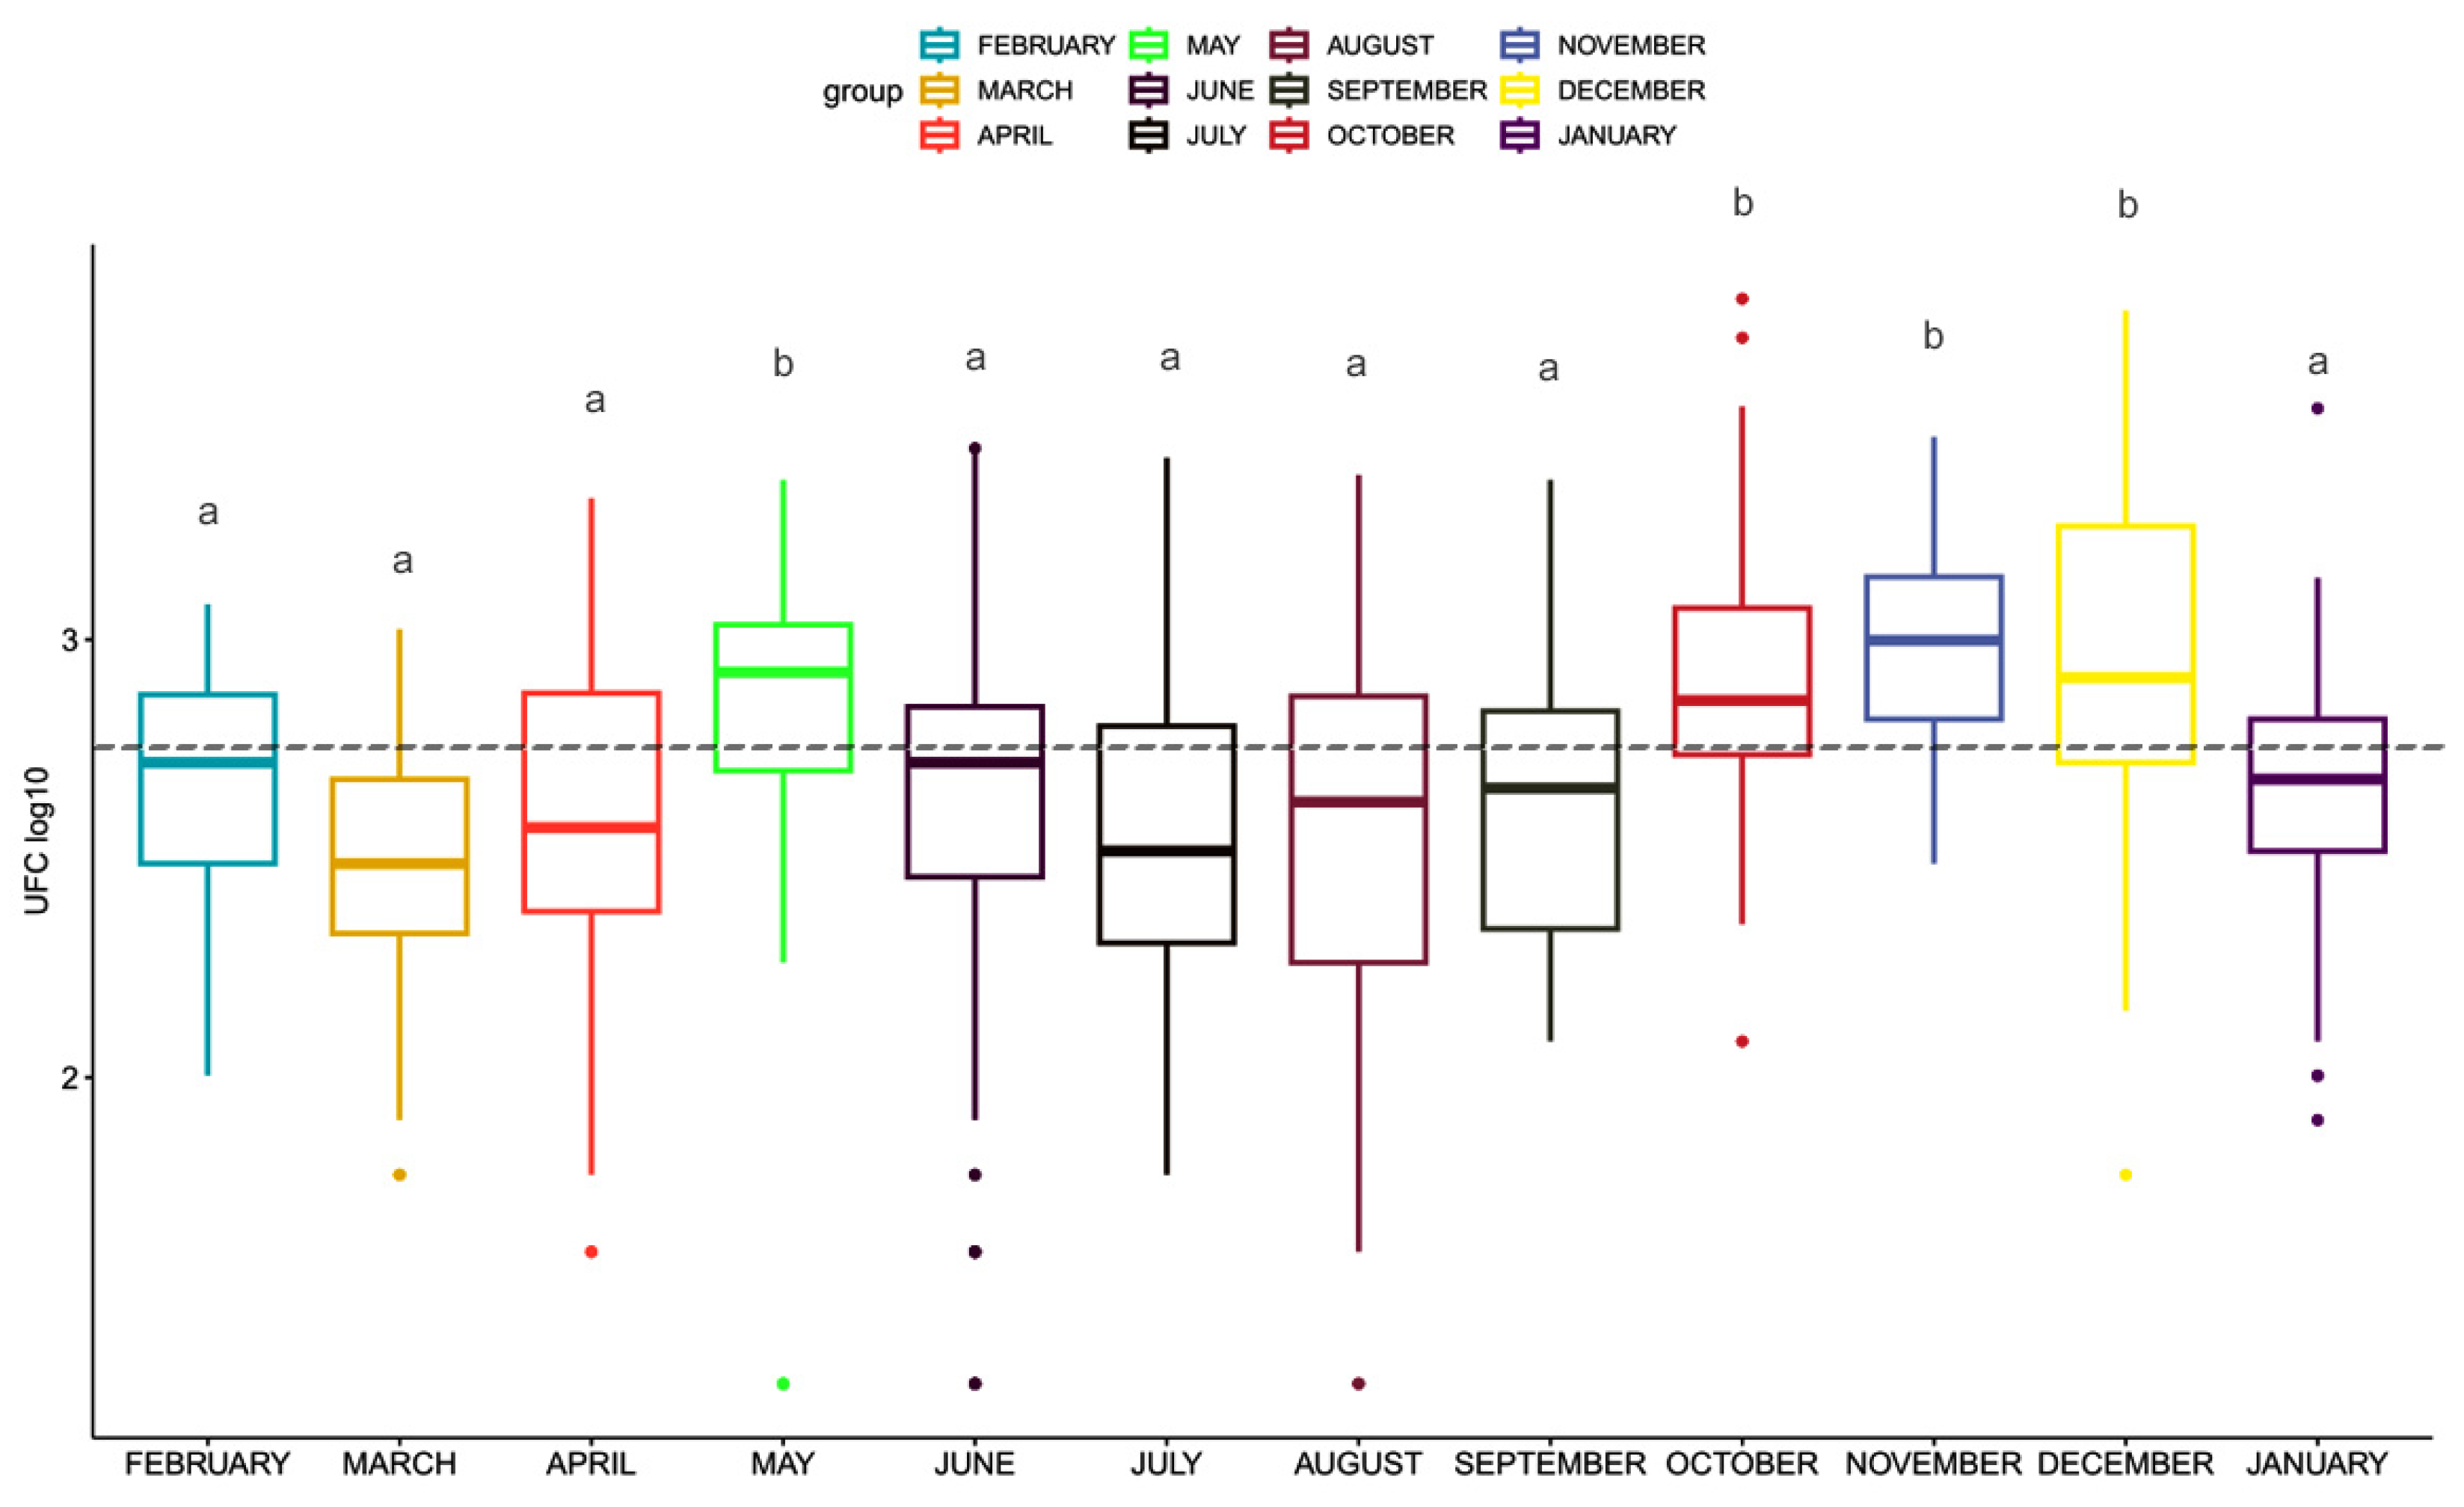
Figure 1. Monthly UFC concentration (medians expressed as base 10 logarithm). Statistically different values are marked with different letters (p < 0.05). Dashed line sets the upper normal upper limit based on an average between Ortega et al. [24] and Shelton et al. [25].
Atmosphere 14 00983 g001
Figure 2. Mean concentration (CFU/m3) of the fungal genera for each month (genera that exhibited a concentration higher than 50 CFU/m3 are shown).
Atmosphere 14 00983 g002
Figure 3. Monthly averages for air pollutants (medians expressed as fold change—see methods). The broken line at the bottom represents the annual concentration level (based as zero) recommended by the WHO for each pollutant.
Atmosphere 14 00983 g003
Figure 4. Mean percentages of monthly relative humidity (CFU/m3) for the time period of this study.
Atmosphere 14 00983 g004
Table 1. Cumulative colony-forming units isolated for each genus during the 12-month sampling period. Numbers represent mean values.
GenusCFU
Cladosporium4276
Sterile mycelium3764
Yeasts2117
Aspergillus972
Fusarium205
Penicillium174
Paecilomyces64
Alternaria61
Rhizopus28
Geotrichum17
Bipolaris8
Basipetospora5
Curvularia4
Humicola3
Scedosporium complex3
Stachybotrys3
Botrytis2
Acremonium2
Trichoderma2
Chrysosporium1
Neurospora1
Mucor1
Nigrospora1
Verticillium1
Arthrobotrys1
Phaeoacremonium1
Scopulariopsis1
Table 2. Correlations found between air pollutants and the mean of monthly UFC.
Compared Parameters *Correlation Value (log10) **R2p-Value
March UFC vs. PM101.1830.348911290.016
APRIL UFC vs. NO2−1.0780.1821688240.024
APRIL UFC vs. PM10−1.3920.2466709140.007
APRIL UFC vs. PM2.5−0.878NA0.003
MAY UFC vs. PM10−2.0110.2484698550.004
MAY UFC vs. PM2.5−1.0360.185517890.017
JUNE UFC vs. CO−0.367NA0.011
JULY UFC vs. SO2−2.3240.2081164330.017
AUGUST UFC vs. NO2−0.455NA0.023
NOVEMBER UFC vs. CO−0.258NA0.019
DECEMBER UFC vs. SO2−1.1530.2280.010
* Only comparisons showing significant correlations are shown. ** Negative values imply an inverse correlation. NA: Not available.
Table 3. Correlations found between air pollutants and the mean of monthly UFC for each genus.
Compared Parameters *GenusCorrelation Value (log10) **R2p-Value
February UFC vs. COAcremonium0.336NA0.001
February UFC vs. PM10Alternaria0.675NA0.008
May UFC vs. NO20.979NA0.001
May UFC vs. NOx1.511NA0.000
June UFC vs. NO20.9610.3950.029
June UFC vs. NOx1.0940.3560.041
June UFC vs. PM2.53.1050.4400.026
July UFC vs. CO−2.9530.3990.012
August UFC vs. CO−0.8900.9940.003
August UFC vs. PM2.51.9820.9850.008
October UFC vs. SO2−4.6540.6950.020
October UFC vs. NO20.789NA0.001
October UFC vs. O3−0.267NA0.001
April UFC vs. PM10Aspergillus0.7250.2240.019
July UFC vs. CO5.4950.2470.011
September UFC vs. NO2−1.4460.2240.047
October UFC vs. NOx0.9640.1910.014
November UFC vs. SO2−1.0080.2620.021
November UFC vs. CO−0.370NA0.014
November UFC vs. NOx0.7680.2000.048
November UFC vs. PM101.2280.2190.037
AGOSTO UFC vs. NO2Bipolaris1.205NA0.001
September UFC vs. CO−10.185NA0.006
October UFC vs. CO−0.689NA0.017
October UFC vs. O3−0.249NA0.026
April UFC vs. PM2.5Botrytis−1.799NA0.006
June UFC vs. CO−0.576NA0.019
February UFC vs. NOCladosporium−1.1930.2960.007
February UFC vs. O30.8260.2170.025
February UFC vs. PM2.5−1.2280.3170.006
March UFC vs. NO−2.1390.3410.018
April UFC vs. NO2−1.6160.1890.026
April UFC vs. NOx−1.6330.1690.037
April UFC vs. PM10−1.8000.1900.026
May UFC vs. PM2.5−1.2120.1750.033
December UFC vs. SO22.0040.4550.008
May UFC vs. NOFusarium−2.084NA0.036
June UFC vs. PM101.1130.5870.027
July UFC vs. O3−1.271NA0.001
October UFC vs. NO27.3230.8470.009
October UFC vs. NOx7.7460.8720.006
October UFC vs. PM108.3430.7060.036
December UFC vs. PM101.835NA0.021
February UFC vs. COGeotrichum0.080NA0.007
May UFC vs. NOx0.617NA0.005
May UFC vs. O3−0.686NA0.003
June UFC vs. CO0.044NA0.021
August UFC vs. CO−0.543NA0.045
May UFC vs. COYeasts4.3770.1570.034
June UFC vs. SO2−5.3410.2740.012
June UFC vs. NO2−1.4560.2250.026
June UFC vs. NOx−1.7480.2060.034
October UFC vs. NO2−0.328NA0.046
October UFC vs. NOx−0.432NA0.033
November UFC vs. SO21.4230.2390.025
November UFC vs. CO1.3120.2990.013
December UFC vs. SO2−3.0480.3150.029
December UFC vs. CO3.4480.20740.0148
December UFC vs. O3−2.2720.4010.011
March UFC vs. NOxPaecilomyces−3.2600.9710.015
April UFC vs. PM100.000NA0.034
May UFC vs. NO21.058NA0.002
May UFC vs. NOx1.2790.9710.009
February UFC vs. NOPenicillium−1.1370.5020.022
May UFC vs. CO6.1810.2930.017
January UFC vs. SO2−3.8140.8940.015
January UFC vs. NO22.0230.7920.042
January UFC vs. NOx1.6820.8030.039
November UFC vs. PM10Rhizopus−0.5030.9350.033
* Only comparisons showing significant correlations are shown. ** Negative values imply an inverse correlation. NA: Not available.
Disclaimer/Publisher’s Note: The statements, opinions and data contained in all publications are solely those of the individual author(s) and contributor(s) and not of MDPI and/or the editor(s). MDPI and/or the editor(s) disclaim responsibility for any injury to people or property resulting from any ideas, methods, instructions or products referred to in the content.