

Study on the Layout of Public Space in Multistory Settlements Based on Outdoor Thermal Environment in Hot-Summer and Cold-Winter Regions of China


Abstract
:1. Introduction
- Conducting a comprehensive review of the existing literature on microclimate research in settlements as well as the research methods that combine building planning and design with environmental physical performance optimization.
- Analyzing meteorological data to summarize the basic characteristics of Changsha’s climate and creating an abstract model of multistory settlements in Changsha by conducting field research and utilizing web data.
- Setting the location and number of public spaces as the independent variables and measuring the dependent variables, which include the average outdoor thermal comfort and sunshine hours in the summer and winter, by conducting a multiobjective search for optimization and utilizing the ideal model as the research object.
- Conducting qualitative and quantitative analyses to rigorously analyze the results of the search. The qualitative analysis primarily focuses on the overall layout of the public space, while the quantitative analysis scrutinizes the morphological elements of the public space.
2. Methodology
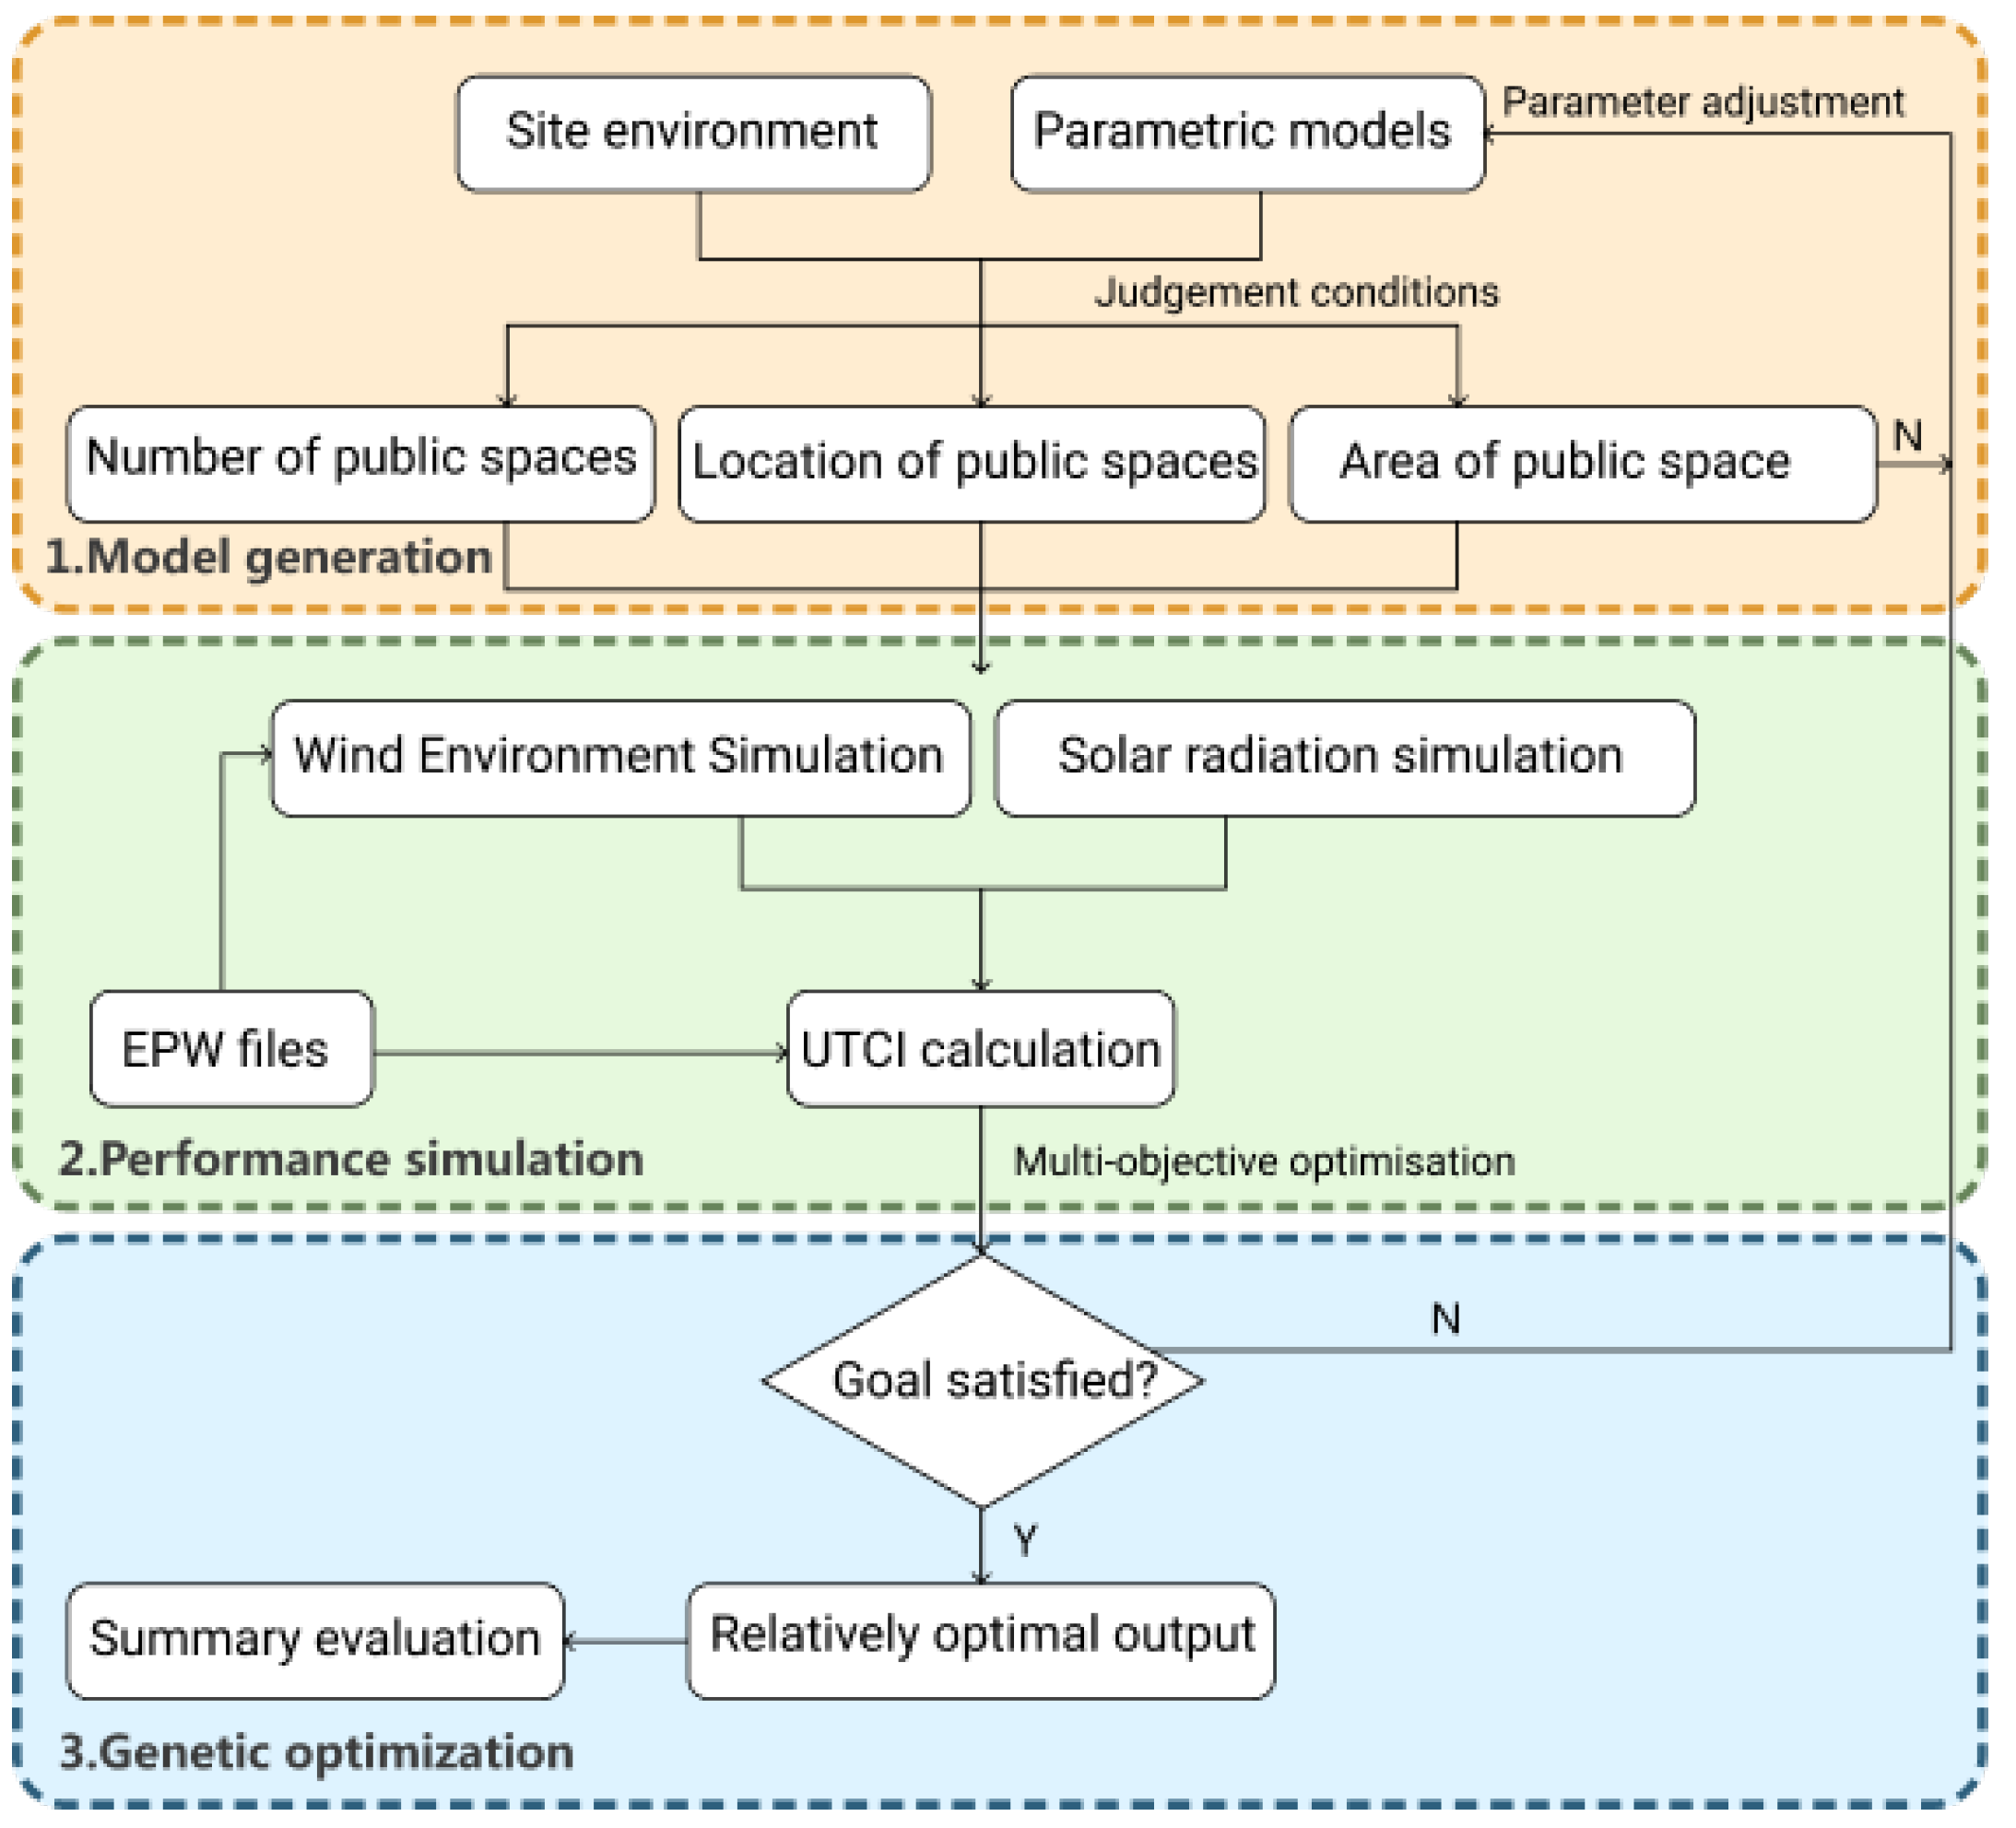
2.1. Overview Workflow
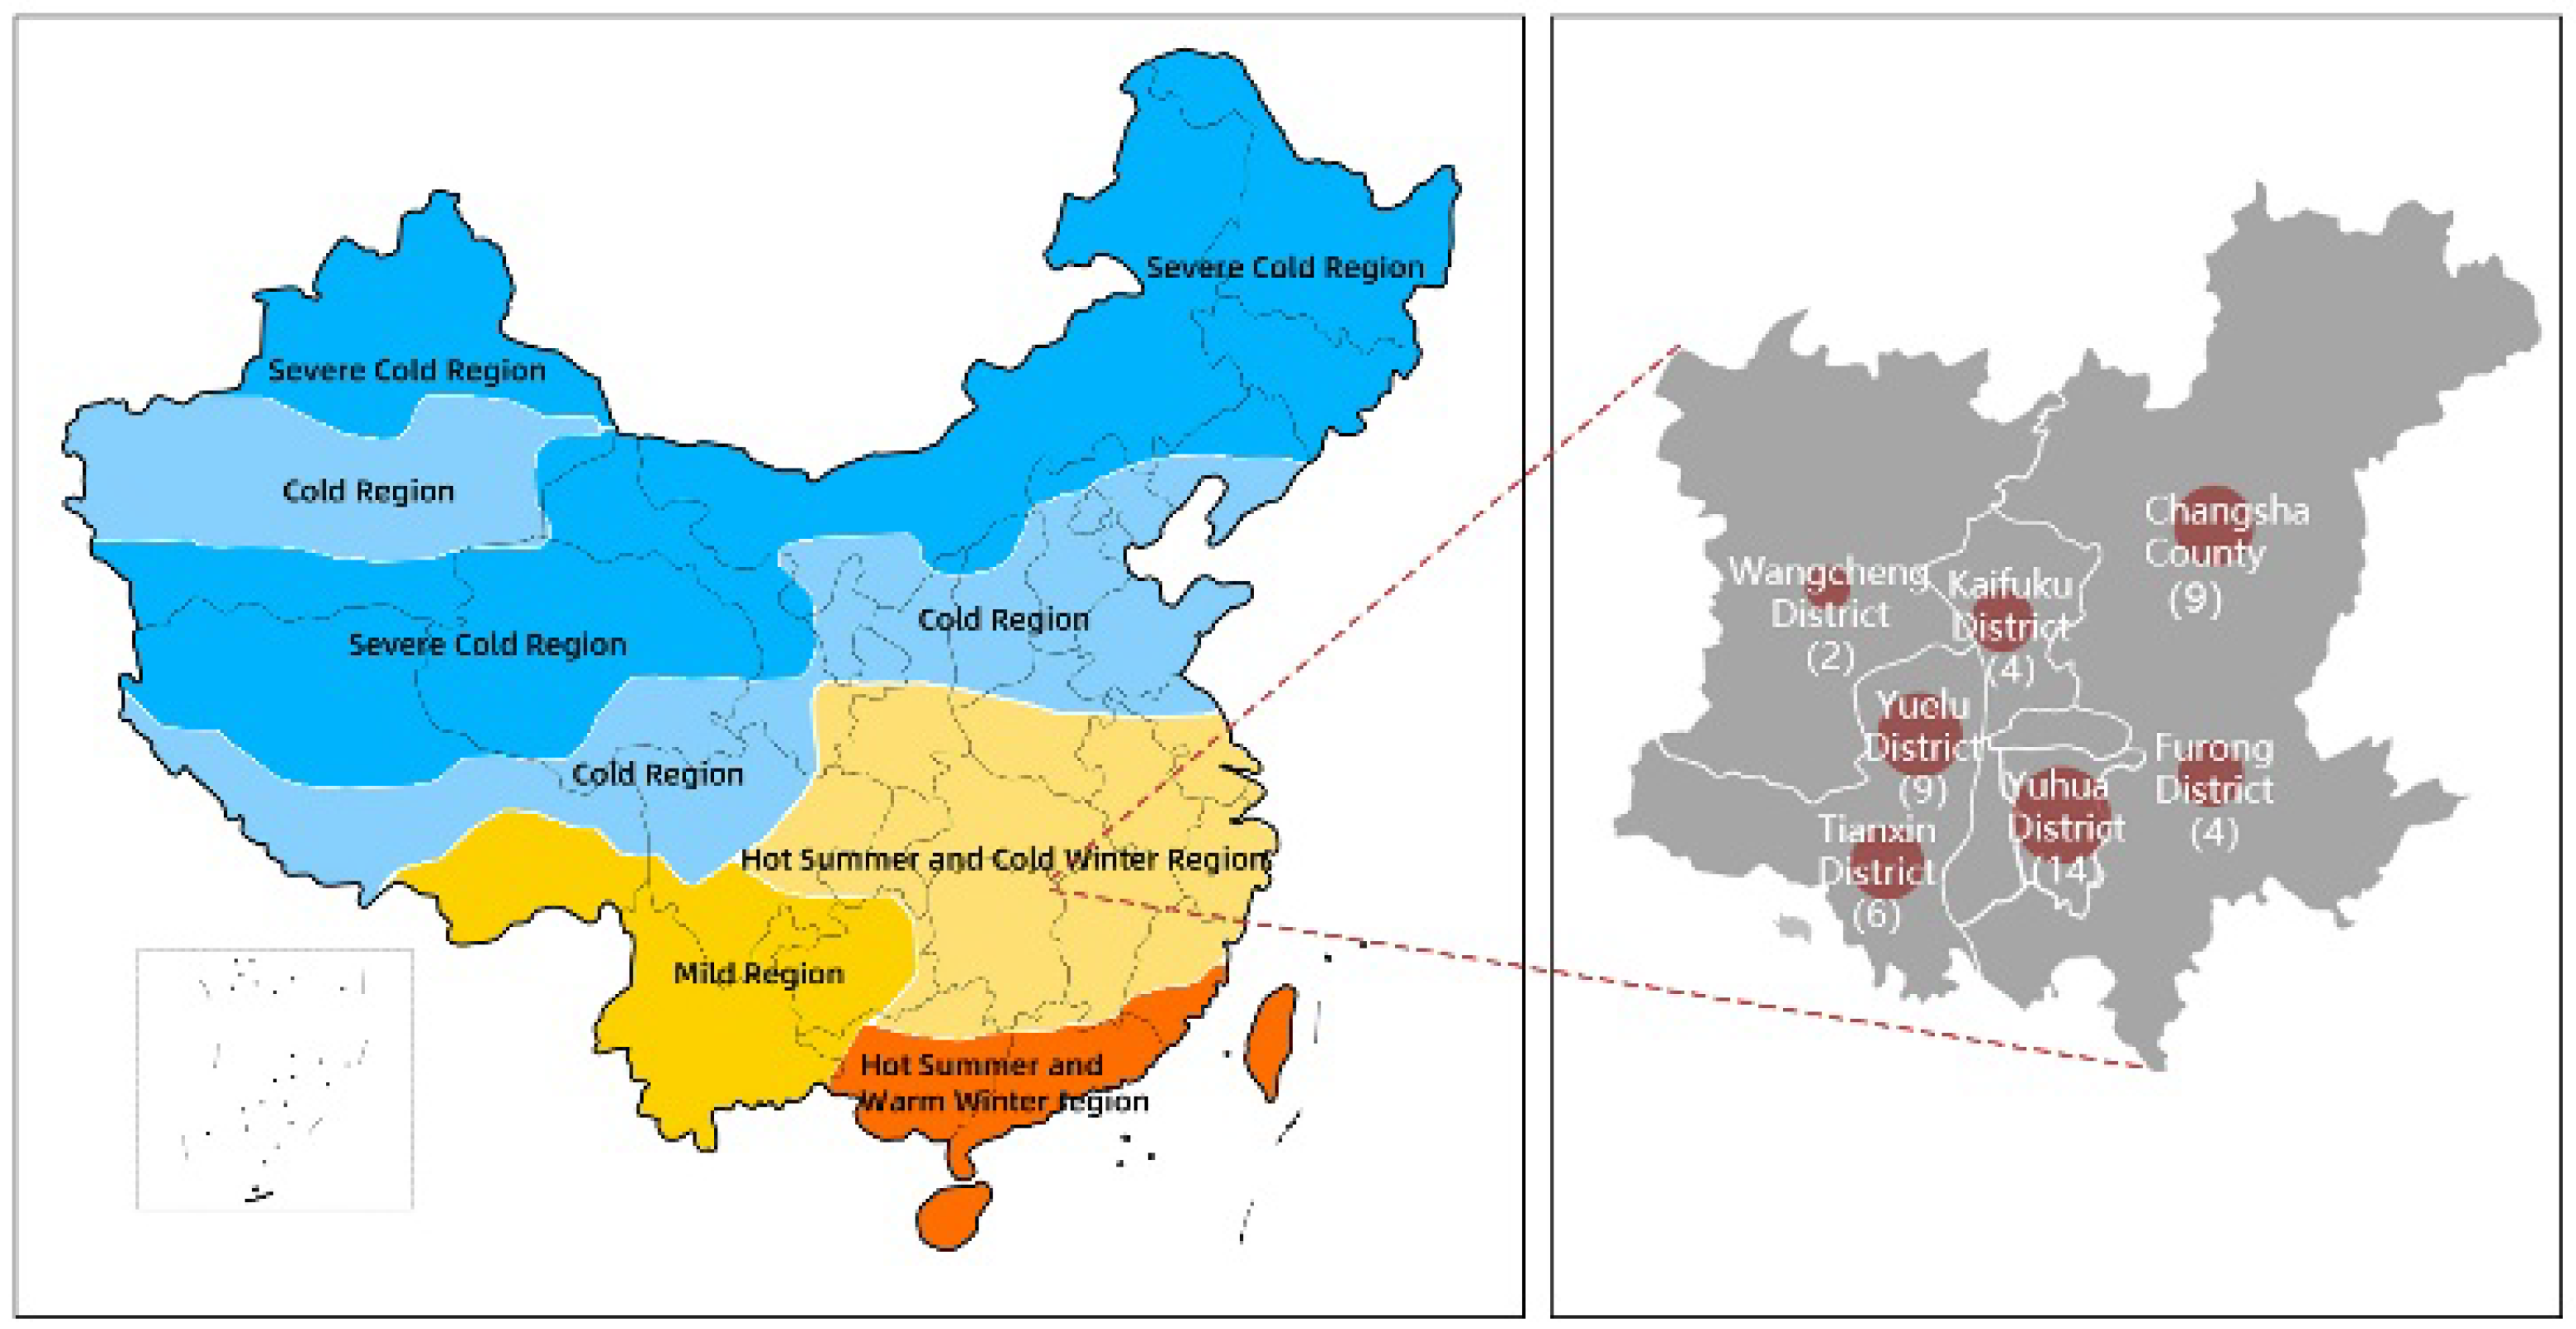
2.2. Case Study
2.2.1. Study Area
2.2.2. Selection of Sample Residential Clusters
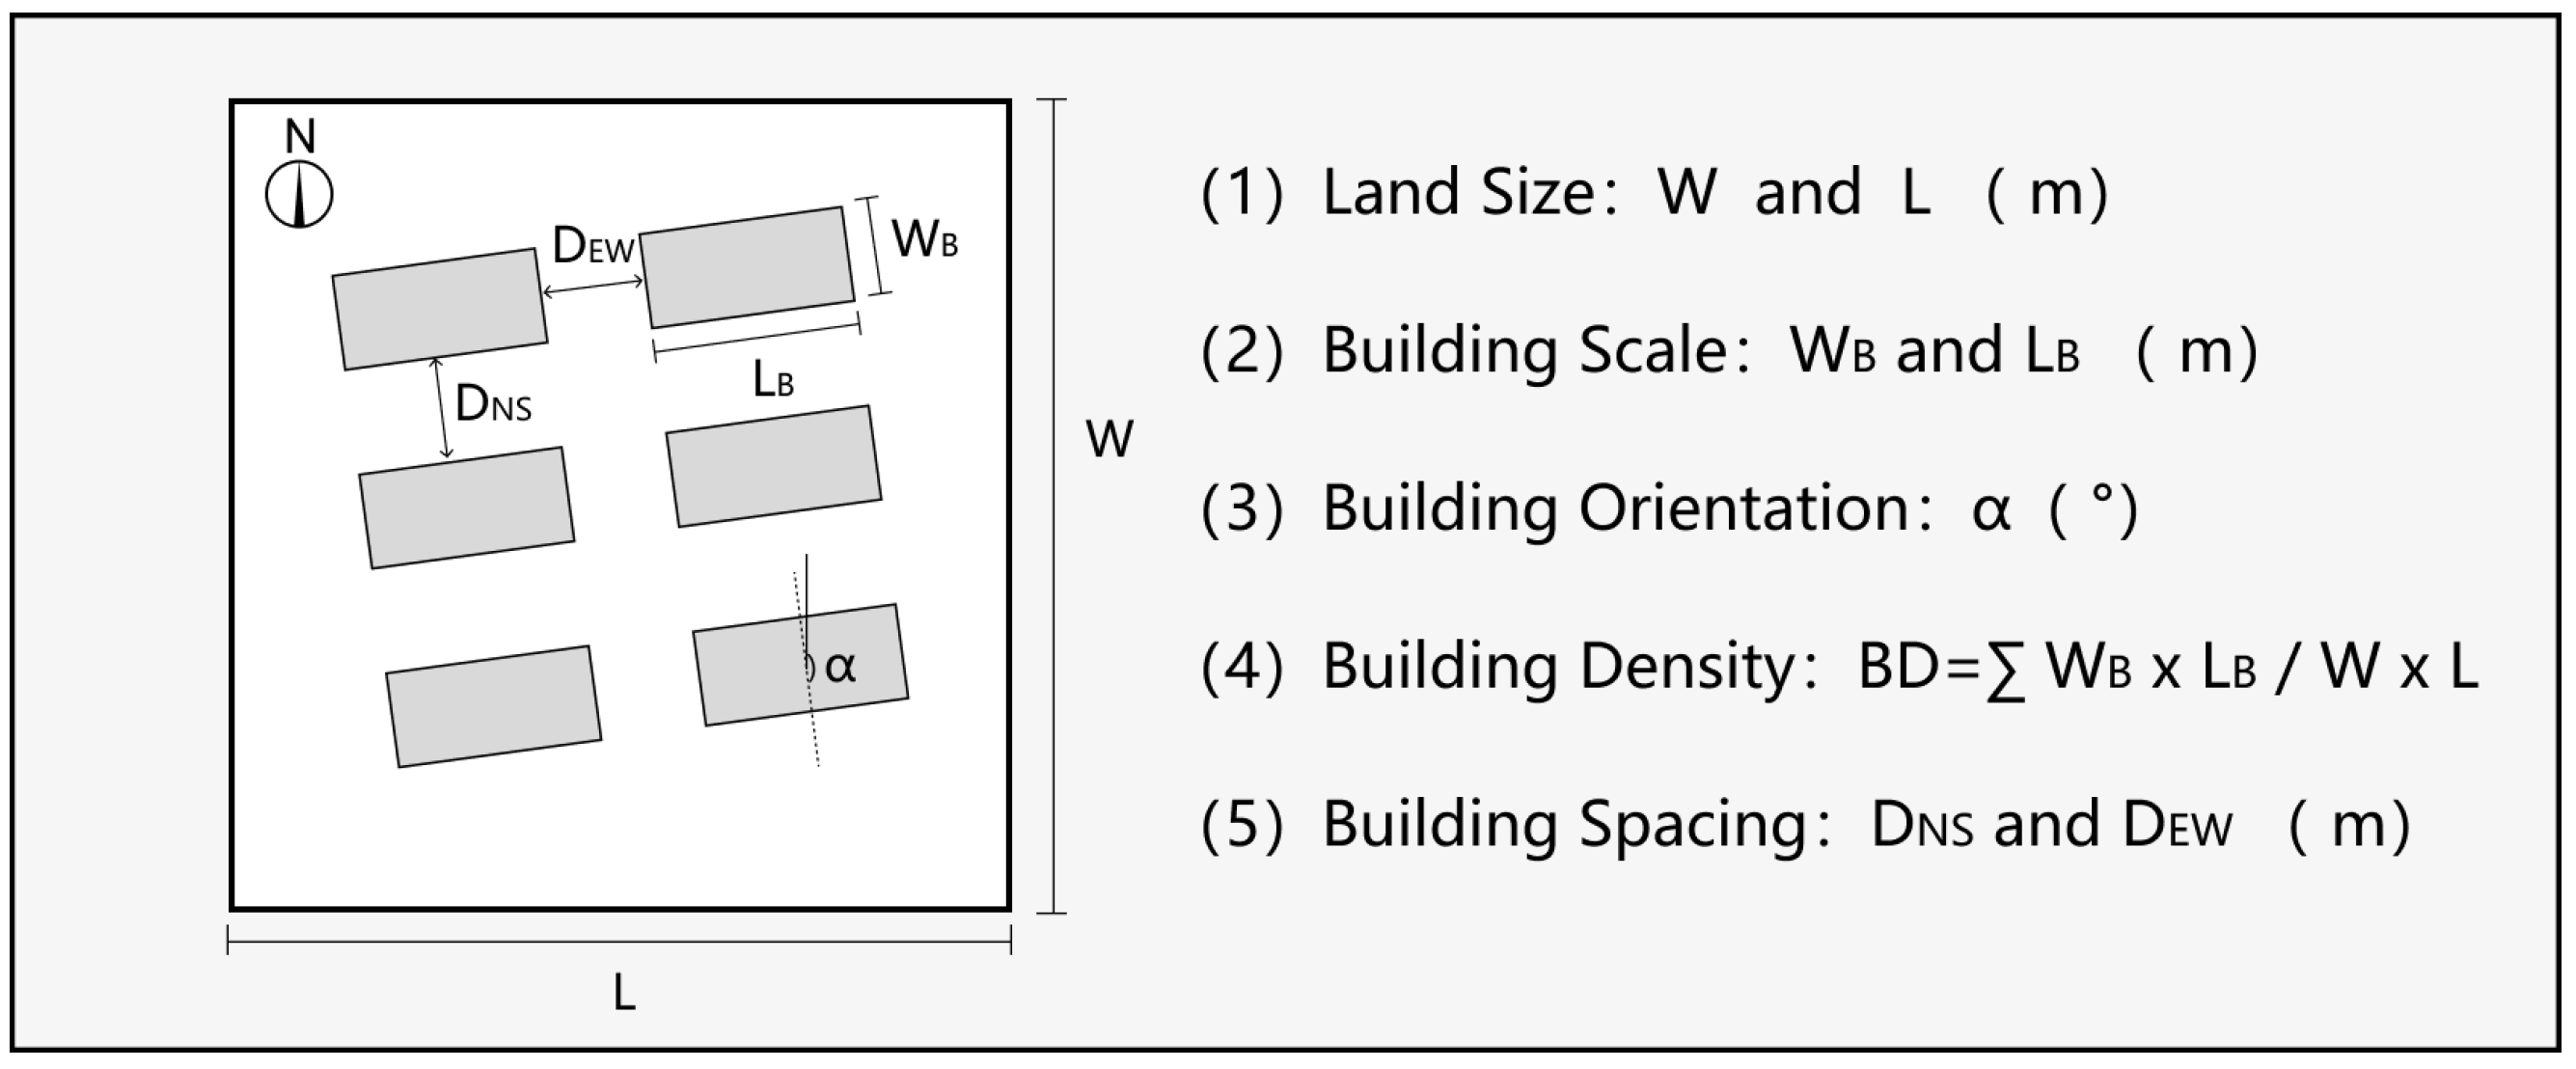
2.3. Model Generation
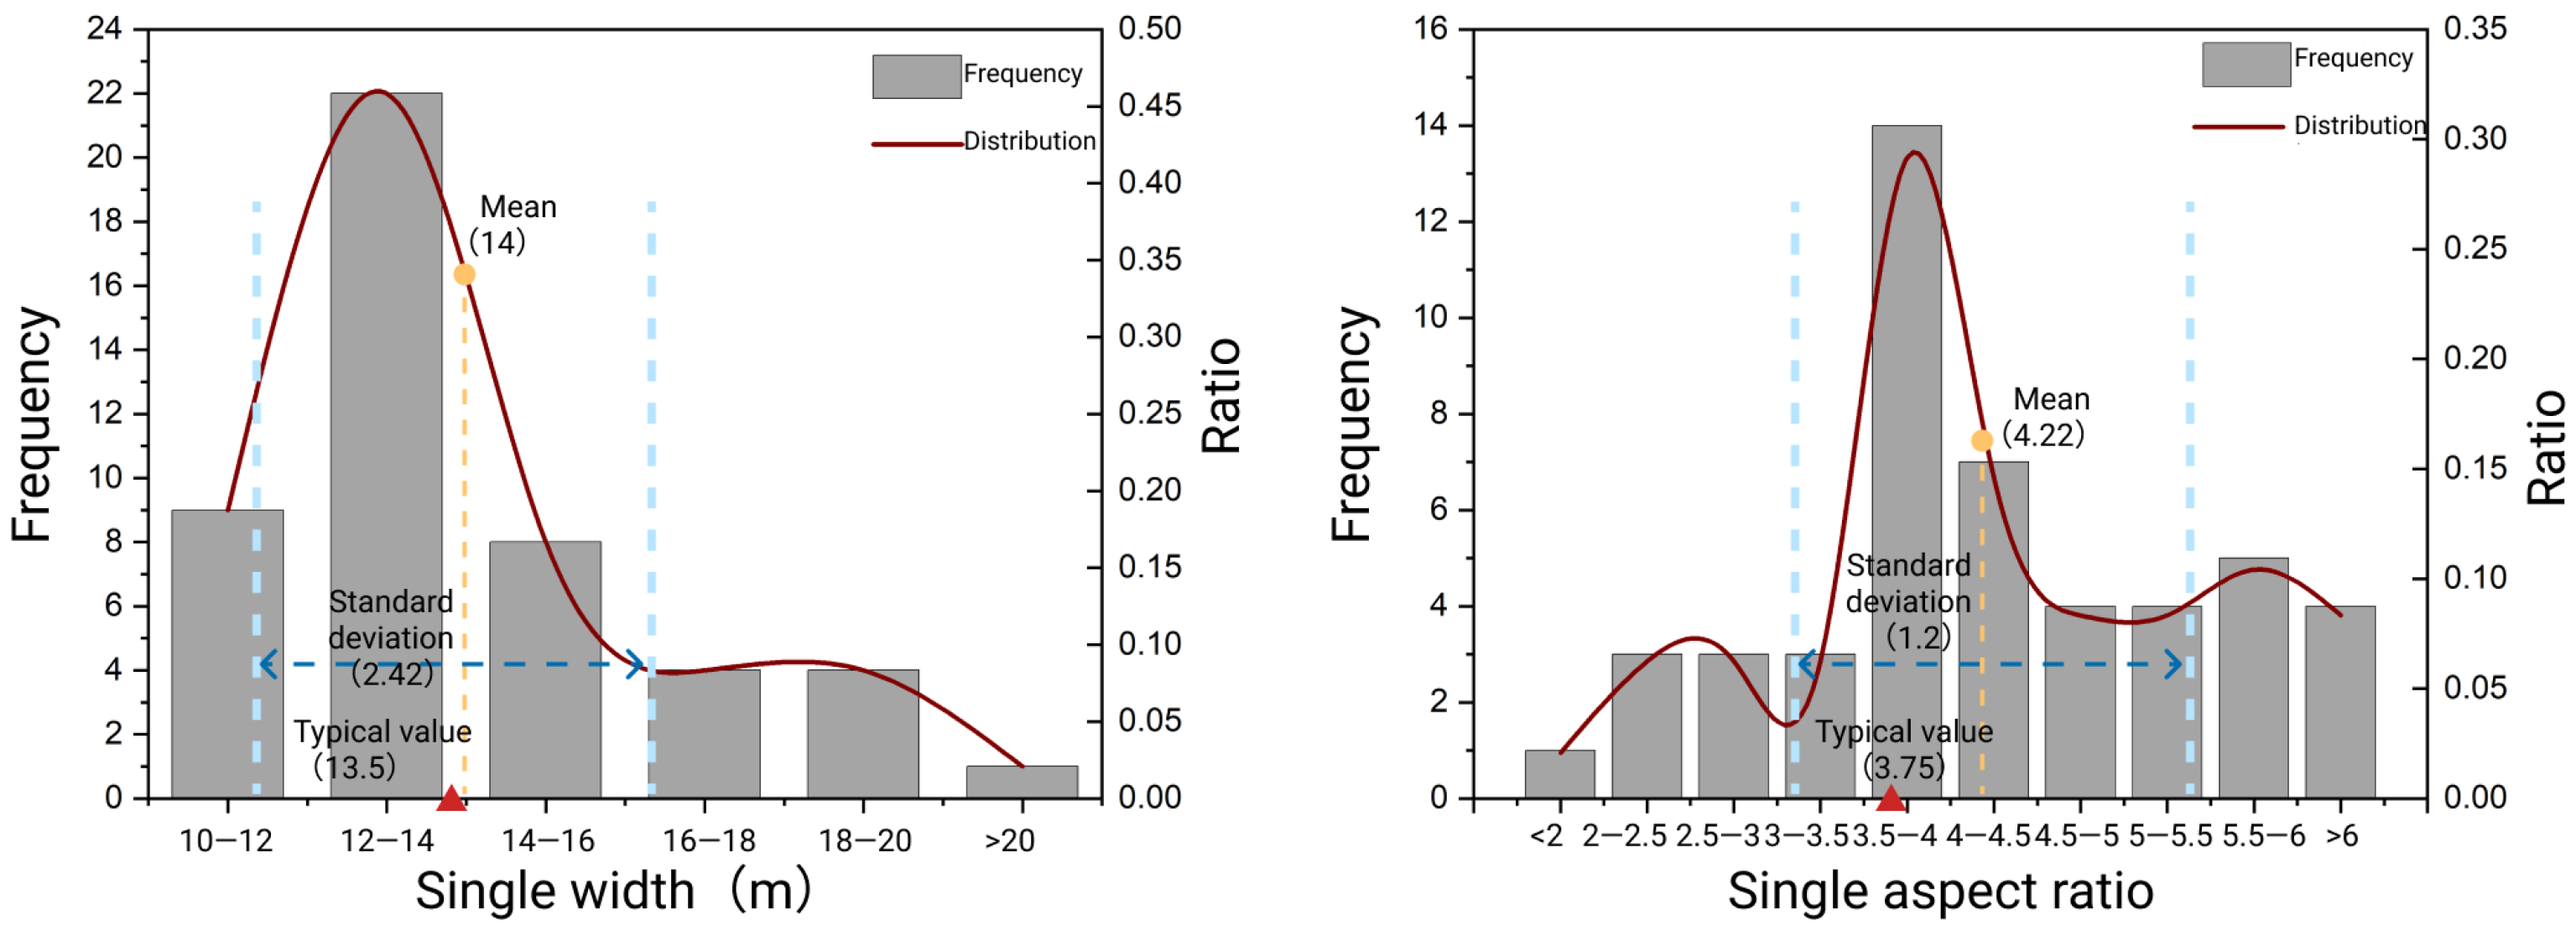
2.3.1. Field Measurements
2.3.2. Typical Models
2.4. Simulation and Optimization
2.4.1. Computer Simulations
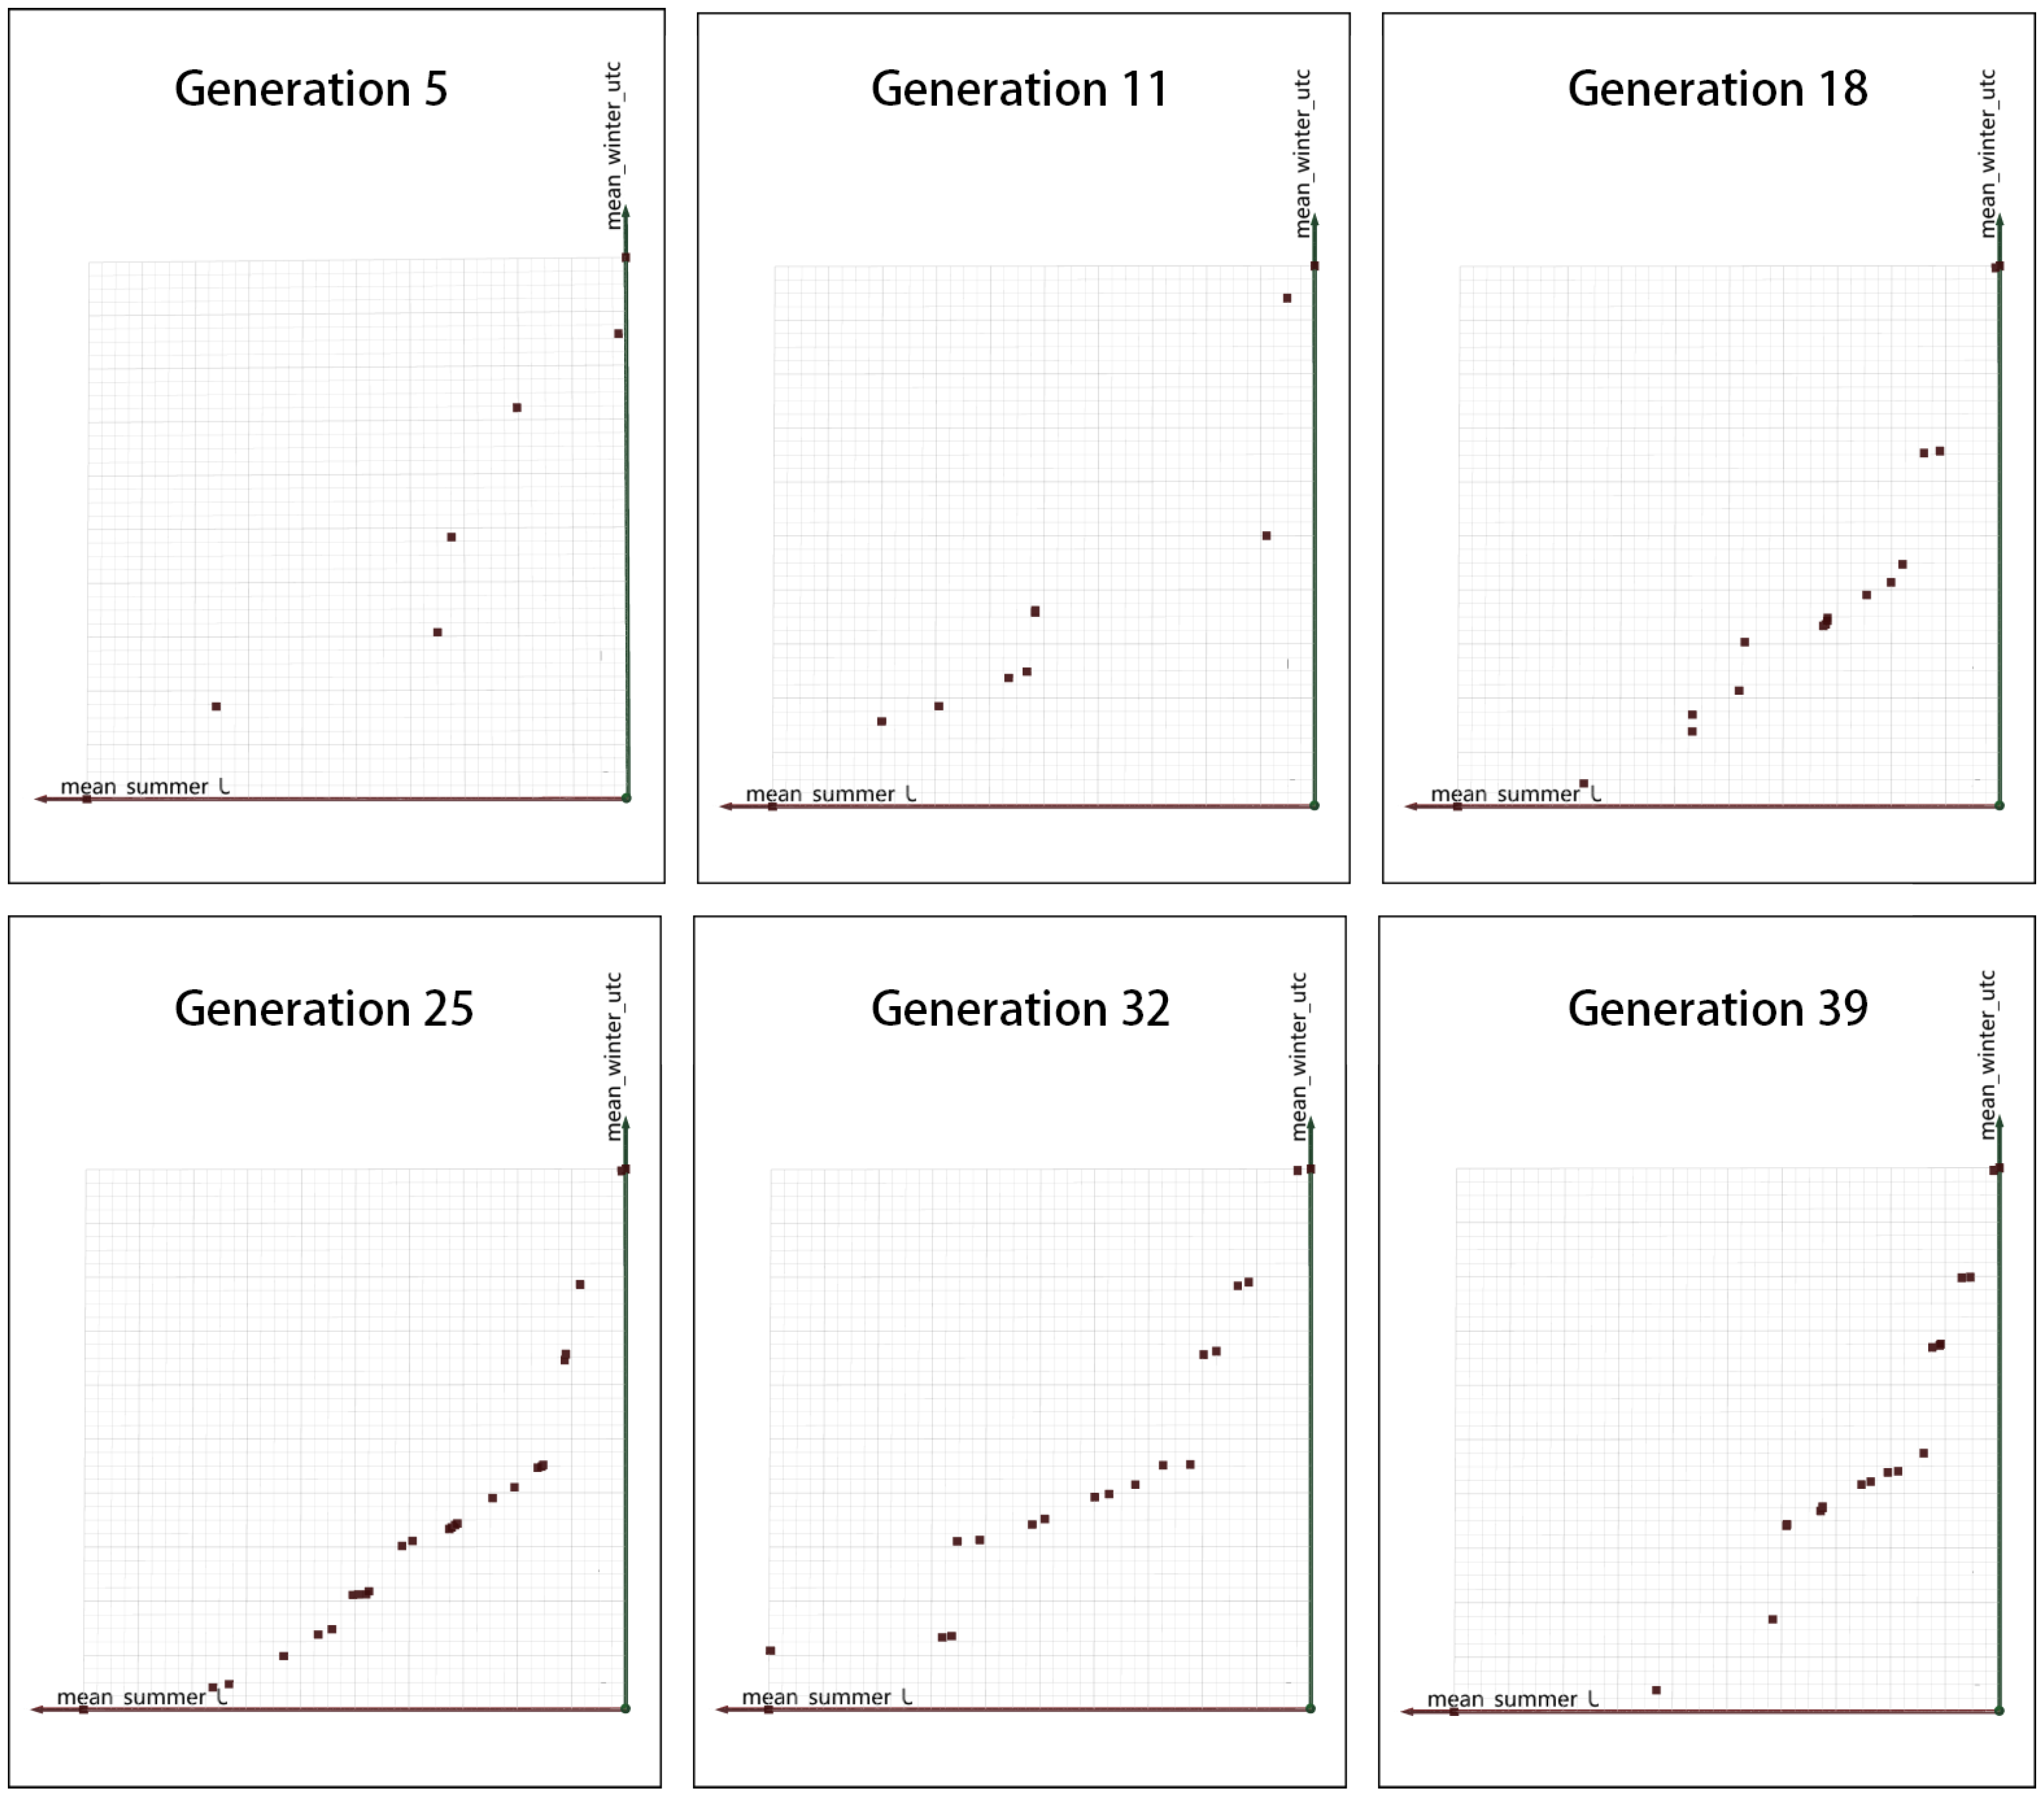
2.4.2. Multiple Objective Optimization
Parameter Setting
- (1)
- Minimize the mean value of the UTCI in the summer;
- (2)
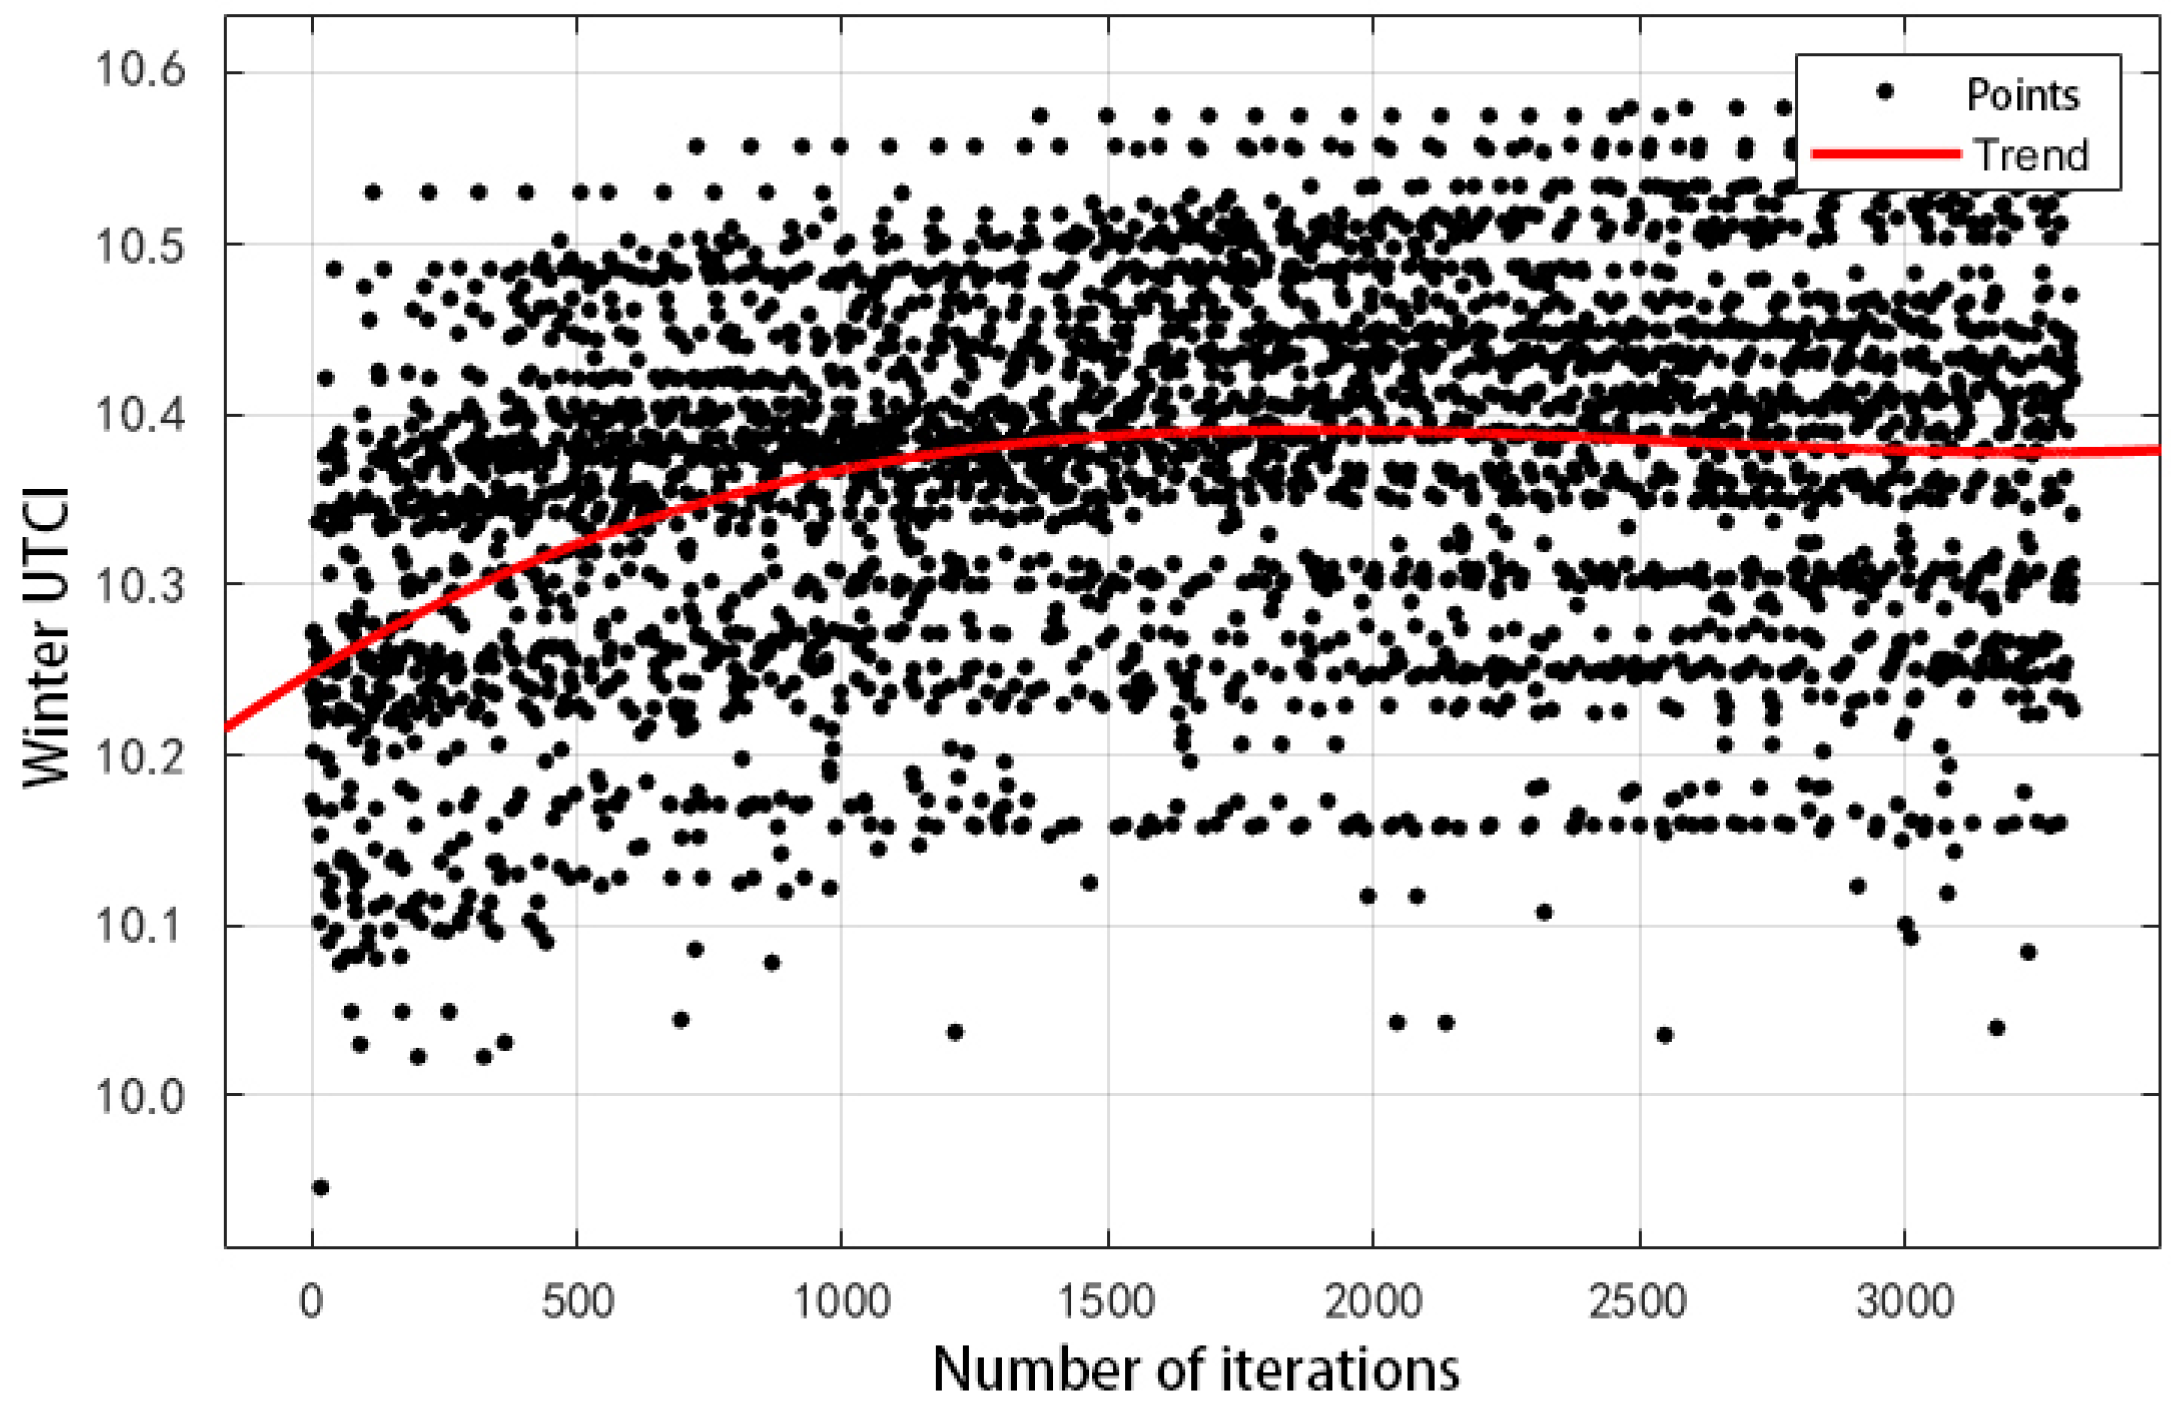
- Maximum the average value of the UTCI in the winter;
- (3)
- Minimize the percentage of days where the sunshine hours are less than 2 h in the winter.
2.5. Quantification of Public Space
2.5.1. Location
2.5.2. Dispersion
2.5.3. Upwind Opening Rate
3. Results
3.1. Overall Optimization Results
3.2. Location
3.3. Dispersion
3.4. Relationship with the Windward Entrance
3.5. Larger Squares
4. Discussion and Conclusions
4.1. Main Findings of This Study
4.2. Public Space Design Strategy
- (1)
- Consider the layout of the windward location in summer and winter
- (2)
- Uniform dispersion is better than dispersion
- (3)
- Larger squares are arranged in the south or southeast
4.3. Limitations and Future Work
Author Contributions
Funding
Institutional Review Board Statement
Informed Consent Statement
Data Availability Statement
Acknowledgments
Conflicts of Interest
References
- Zhibin, R.; Yao, F.; Yulin, D.; Peng, Z.; Xingyuan, H. Rapid urbanization and climate change significantly contribute to worsening urban human thermal comfort: A national 183-city, 26-year study in China. Urban Clim. 2002, 43, 101154. [Google Scholar]
- He, W.; Zhang, L.; Yuan, C. Future air temperature projection in high-density tropical cities based on global climate change and urbanization—A study in Singapore. Urban Clim. 2022, 42, 101115. [Google Scholar] [CrossRef]
- Smith, P.; Henriquez, C. Perception of thermal comfort in outdoor public spaces in the medium-sized city of Chillán, Chile, during a warm summer. Urban Clim. 2019, 30, 100525. [Google Scholar] [CrossRef]
- Liu, Y.; Guo, Y.; Chan, O.F.; Chui, C.; Ho, H.C.; Song, Y.; Cheng, W.; Chiu, R.; Webster, C.; Lum, T.Y. Understanding the long-term effects of public open space on older adults’ functional ability and mental health. Build. Environ. 2023, 234, 110126. [Google Scholar] [CrossRef]
- Zhang, J.; Zhang, F.; Gou, Z.; Liu, J. Assessment of macroclimate and microclimate effects on outdoor thermal comfort via artificial neural network models. Urban Clim. 2022, 42, 101134. [Google Scholar] [CrossRef]
- Hong, T.; Xu, Y.; Sun, K.; Zhang, W.; Luo, X.; Hooper, B. Urban microclimate and its impact on building performance: A case study of San Francisco. Urban Clim. 2021, 38, 100871. [Google Scholar] [CrossRef]
- Shareef, S. The impact of urban morphology and building’s height diversity on energy consumption at urban scale. The case study of Dubai. Build. Environ. 2021, 194, 107675. [Google Scholar] [CrossRef]
- Golany, G.S. Urban design morphology and thermal performance. Atmos. Environ. 1996, 30, 455–465. [Google Scholar] [CrossRef]
- Grimmond, C.S.B.; Oke, T.R. Heat Storage in Urban Areas: Local-Scale Observations and Evaluation of a Simple Model. Am. Meteorol. Soc. 1999, 38, 922–940. [Google Scholar] [CrossRef]
- Hotano, A.; Iino, A.; Ono, M.; Tanighchi, S. Analysis of the influence of urban form and materials on sensible heat—A case study of Japan’s largest housing development “Tama New Towna”. Atmos. Environ. 1999, 33, 3931–3939. [Google Scholar]
- Bourbia, F.; Awbi, H.B. Building cluster and shading in urban canyon for hot dry climate Part 1: Air and surface temperature measurements. Renew. Energy 2004, 29, 249–262. [Google Scholar] [CrossRef]
- Yezioro, A.; Capeluto, I.G.; Shaviv, E. Design guidelines for appropriate insolation of urban squares. Renew. Energy 2006, 31, 1011–1023. [Google Scholar] [CrossRef]
- Deb, C.; Alur, R. A simple technique to classify urban locations with respect to human thermal comfort: Proposing the HXG scale. Build. Environ. 2011, 46, 1321–1328. [Google Scholar] [CrossRef]
- Taleghani, M.; Kleerekoper, L.; Tenpierik, M.; van den Dobbelsteen, A. Outdoor thermal comfort within five different urban forms in the Netherlands. Build. Environ. 2015, 83, 65–78. [Google Scholar] [CrossRef]
- Gamero-Salinas, J.; Kishnani, N.; Monge-Barri, A.; Lopez-Fidalgo, J.; Sanchez-Ostiz, A. Evaluation of thermal comfort and building form attributes in different semi-outdoor environments in a high-density tropical setting. Build. Environ. 2021, 205, 108255. [Google Scholar] [CrossRef]
- Lai, D.; Liu, Y.; Liao, M.; Yu, B. Effects of different tree layouts on outdoor thermal comfort of green space in summer Shanghai. Urban Clim. 2023, 47, 101398. [Google Scholar] [CrossRef]
- Erell, E.; Pearlmutter, D.; Williamson, T.J. Urban Microclimate: Designing Between Buildings; China Architecture & Building Press: Beijing, China, 2014. [Google Scholar]
- Hoyano, A. Climatological uses of plants for solar control and the effects on the thermal environment of a building. Energy Build. 1988, 11, 181–199. [Google Scholar] [CrossRef]
- Nagara, K. Evaluation of the thermal environment in an outdoor pedestrian space. Atmos. Environ. 1996, 30, 497–505. [Google Scholar] [CrossRef]
- Bruse, M.; Fleer, H. Simulating surface–plant–air interactions inside urban environments with a three dimensional numerical model. Environ. Model. Softw. 1998, 13, 373–384. [Google Scholar] [CrossRef]
- Ali-Toudert, F.; Mayer, H. Effects of asymmetry, galleries, overhanging façades and vegetation on thermal comfort in urban street canyons. Sol. Energy 2006, 81, 742–754. [Google Scholar] [CrossRef]
- Shi, X. Design optimization of insulation usage and space conditioning load using energy simulation and genetic algorithm. Energy 2010, 36, 1659–1667. [Google Scholar] [CrossRef]
- Hermawan; Sunaryo, S.; Kholil, A. The analysis of thermal performance of vernacular building envelopes in tropical high lands using Ecotect. IOP Conf. Series Earth Environ. Sci. 2020, 423, 012004. [Google Scholar] [CrossRef]
- Vlachokostas, A.; Madamopoulos, N. Daylight and thermal harvesting performance evaluation of a liquid filled prismatic façade using the Radiance five-phase method and EnergyPlus. Build. Environ. 2017, 126, 396–409. [Google Scholar] [CrossRef]
- Ibrahim, Y.; Kershaw, T.; Shepherd, P.; Coley, D. On the Optimisation of Urban form Design, Energy Consumption and Outdoor Thermal Comfort Using a Parametric Workflow in a Hot Arid Zone. Energies 2021, 14, 4026. [Google Scholar] [CrossRef]
- Yan, H.; Yan, K.; Ji, G. Optimization and prediction in the early design stage of office buildings using genetic and XGBoost algorithms. Build. Environ. 2022, 218, 109081. [Google Scholar] [CrossRef]
- Nembrini, J.; Samberger, S.; Labelle, G. Parametric scripting for early design performance simulation. Energy Build. 2014, 68, 786–798. [Google Scholar] [CrossRef]
- Heimann, D. Three-dimensional linearised Euler model simulations of sound propagation in idealised urban situations with wind effects. Appl. Acoust. 2005, 68, 217–237. [Google Scholar] [CrossRef] [Green Version]
- Zhang, L.; Zhang, L.; Wang, Y. Shape optimization of free-form buildings based on solar radiation gain and space efficiency using a multi-objective genetic algorithm in the severe cold zones of China. Sol. Energy 2016, 132, 38–50. [Google Scholar] [CrossRef]
- Li, Y.; Li, X. Preliminary study on heating energy consumption distribution of dwellings in hot summer and cold winter climate region of China. Indoor Built Environ. 2019, 28, 950–963. [Google Scholar] [CrossRef]
- He, X.; Gao, W.; Wang, R.; Yan, D. Study on outdoor thermal comfort of factory areas during winter in hot summer and cold winter zone of China. Build. Environ. 2022, 228, 109883. [Google Scholar] [CrossRef]
- Tong, C.; Li, X.; Duanmu, L.; Wang, H. Prediction of the temperature profiles for shallow ground in cold region and cold winter hot summer region of China. Energy Build. 2021, 242, 110946. [Google Scholar] [CrossRef]
- Yang, S.; Zhou, D.; Wang, Y.; Li, P. Comparing impact of multi-factor planning layouts in residential areas on summer thermal comfort based on orthogonal design of experiments (ODOE). Build. Environ. 2020, 182, 107145. [Google Scholar] [CrossRef]
- Qu, S.; Wang, Z.; Liu, W. Clothing adjustment in outdoor environment: A new clothing model based on temperature change. Build. Environ. 2021, 206, 108395. [Google Scholar] [CrossRef]
- Saryazdi, S.M.E.; Etemad, A.; Shafaat, A.; Bahman, A.M. Data-driven performance analysis of a residential building applying artificial neural network (ANN) and multi-objective genetic algorithm (GA). Build. Environ. 2022, 225, 109633. [Google Scholar] [CrossRef]
- Wang, S.; Yi, Y.K.; Liu, N. Multi-objective optimization (MOO) for high-rise residential buildings’ layout centered on daylight, visual, and outdoor thermal metrics in China. Build. Environ. 2021, 205, 108263. [Google Scholar] [CrossRef]
- Tong, M.; Chen, T. Classification and pedestrian-level wind environment assessment among Tianjin’s residential area based on numerical simulation. Urban Clim. 2020, 34, 100702. [Google Scholar]
- Esposito, A.; Grulois, M.; Pappaccogli, G.; Palusci, O.; Donateo, A.; Salizzoni, P.; Santiago, J.L.; Martilli, A.; Maffeis, G.; Buccolieri, R. On the Calculation of Urban Morphological Parameters Using GIS: An Application to Italian Cities. Atmosphere 2023, 14, 329. [Google Scholar] [CrossRef]
- Siegel, A.F. Chapter 4—Landmark Summaries: Interpreting Typical Values and Percentiles Practical, Business Statistics, 7th ed.; Academic Press: Cambridge, MA, USA, 2016. [Google Scholar]
- d’Ambrosio Alfano, F.R.; Dell’Isola, M.; Ficco, G.; Palella, B.I.; Riccio, G. Small globes and pocket heat stress meters for WBGT and PHS evaluations. A critical analysis under controlled conditions. Build. Environ. 2022, 226, 109781. [Google Scholar] [CrossRef]
- Yu, H.; Zhang, T.; Fukuda, H.; Ma, X. The effect of landscape configuration on outdoor thermal environment: A case of urban Plaza in Xi’an, China. Build. Environ. 2023, 231, 110027. [Google Scholar] [CrossRef]
- Tian, X.; Deng, Y.; Wargocki, P.; Liu, W. Effects of increased activity level on physiological and subjective responses at different high temperatures. Build. Environ. 2021, 201, 108011. [Google Scholar] [CrossRef]
- Peng, Z.; Bardhan, R.; Ellard, C.; Steemers, K. Urban climate walk: A stop-and-go assessment of the dynamic thermal sensation and perception in two waterfront districts in Rome, Italy. Build. Environ. 2022, 221, 109267. [Google Scholar] [CrossRef]
- Zhang, J.; Li, Z.; Wei, Y.; Hu, D. The impact of the building morphology on microclimate and thermal comfort—A case study in Beijing. Build. Environ. 2022, 223, 109469. [Google Scholar] [CrossRef]
- Soflaei, F.; Shokouhian, M.; Tabadkani, A.; Moslehi, H.; Berardi, U. A simulation-based model for courtyard housing design based on adaptive thermal comfort. J. Build. Eng. 2020, 31, 101335. [Google Scholar] [CrossRef]
- Ladybug. Ladybug Tool. 2012. Available online: https://www.ladybug.tools/index.html (accessed on 1 January 2012).
- Boukhabl, M.; Alkam, D. Impact of Vegetation on Thermal Conditions Outside, Thermal Modeling of Urban Microclimate, Case Study: The Street of the Republic, Biskra. Energy Procedia 2012, 18, 73–84. [Google Scholar] [CrossRef] [Green Version]
- Sun, R.; Liu, J.; Lai, D.; Liu, W. Building form and outdoor thermal comfort: Inverse design the microclimate of outdoor space for a kindergarten. Energy Build. 2023, 284, 112824. [Google Scholar] [CrossRef]
- Vissilia, A.-M. Evaluation of a sustainable Greek vernacular settlement and its landscape: Architectural typology and building physics. Build. Environ. 2009, 44, 1095–1106. [Google Scholar]
- Wang, W.; Zmeureanu, R.; Rivard, H. Applying multi-objective genetic algorithms in green building design optimization. Build. Environ. 2004, 40, 1512–1525. [Google Scholar] [CrossRef]
- Zhang, H.; Hewage, K.; Prabatha, T.; Sadiq, R. Life cycle thinking-based energy retrofits evaluation framework for Canadian residences: A Pareto optimization approach. Build. Environ. 2021, 204, 108115. [Google Scholar] [CrossRef]
- Lakhdari, K.; Sriti, L.; Painter, B. Parametric optimization of daylight, thermal and energy performance of middle school classrooms, case of hot and dry regions. Build. Environ. 2021, 204, 108173. [Google Scholar] [CrossRef]
- Magnier, L.; Haghighat, F. Multiobjective optimization of building design using TRNSYS simulations, genetic algorithm, and Artificial Neural Network. Build. Environ. 2009, 45, 739–746. [Google Scholar] [CrossRef]
- Tong, M.; Chen, T. Outdoor ventilation evaluation and optimization based on spatial morphology analysis in Macau. Urban Clim. 2022, 46, 101335. [Google Scholar]
- Jon, K.S.; Luo, Y.; Sin, C.H.; Cui, P.; Huang, Y.; Tokgo, J. Impacts of wind direction on the ventilation and pollutant dispersion of 3D street canyon with balconies. Build. Environ. 2023, 230, 110034. [Google Scholar] [CrossRef]
- Duan, G.; Nakamae, K.; Takemi, T. Impacts of urban morphometric indices on ventilation. Build. Environ. 2023, 229, 109907. [Google Scholar] [CrossRef]
- Li, Q.; Wang, W.; Yu, Z.; Chen, J. Assessing urban micro-climates with vertical and horizontal building morphological cutting deep transfer learning neural networks. Build. Environ. 2023, 234, 110186. [Google Scholar] [CrossRef]
- Tseliou, A.; Koletsis, I.; Pantavou, K.; Thoma, E.; Lykoudis, S.; Tsiros, I. Evaluating the effects of different mitigation strategies on the warm thermal environment of an urban square in Athens, Greece. Urban Clim. 2022, 44, 5218. [Google Scholar] [CrossRef]
- Xu, F.; Gao, Z.; Zhang, J.; Hu, Y.; Ding, W. Influence of typical street-side public building morphologies on the ventilation performance of streets and squares. Build. Environ. 2022, 221, 109331. [Google Scholar] [CrossRef]
- He, Y.; Tablada, A.; Wong, N.H. Effects of non-uniform and orthogonal breezeway networks on pedestrian ventilation in Singapore’s high-density urban environments. Urban Clim. 2018, 24, 460–484. [Google Scholar] [CrossRef]
- Xu, X.; Wu, Y.; Wang, W.; Hong, T.; Xu, N. Performance-driven optimization of urban open space configuration in the cold-winter and hot-summer region of China. Build. Simul. 2019, 12, 411–424. [Google Scholar] [CrossRef] [Green Version]
- Shaeri, J.; Aflaki, A.; Yaghoubi, M.; Janalizadeh, H. Investigation of passive design strategies in a traditional urban neighborhood: A case study. Urban Clim. 2018, 26, 31–50. [Google Scholar] [CrossRef]
- Jhalili, S.; Fayaz, R.; Zolfaghari, S.A. Analyzing outdoor thermal comfort conditions in a university campus in hot-arid climate: A case study in Birjand, Iran. Urban Clim. 2022, 43, 101128. [Google Scholar]
- Chen, L.; Wen, Y.; Zhang, L.; Xiang, W.-N. Studies of thermal comfort and space use in an urban park square in cool and cold seasons in Shanghai. Build. Environ. 2015, 94, 644–653. [Google Scholar] [CrossRef]


| Parameter | Values |
|---|---|
| Variable parameters | Random to cut cell |
| Test grid | 2 m |
| Optimization objective | Summer mean UTCI; winter mean UTCI |
| Elitism | 0.3 |
| Mut. Probability | 0.1 |
| Mutation Rate | 0.6 |
| Crossover Rate | 0.9 |
| Population Size | 50 |
| Max. Generations | 0 |
| Convergence mechanism | Hype Reduction |
| Mutation mechanism | Hype Mutation |
| Generations | Winter UTCI | Summer UTCI | Upwind Opening Rates |
|---|---|---|---|
| g1 | 9.8 | 33.8 | 1 |
| g3 | 10 | 33.9 | 1 |
| g5 | 10.1 | 33.8 | 0.74 |
| g7 | 9.9 | 33.5 | 0.74 |
| g9 | 10.2 | 33.5 | 1 |
| g11 | 10.1 | 33.5 | 0.74 |
| g13 | 10.1 | 33.5 | 0.74 |
| g15 | 9.9 | 33.6 | 0.74 |
| g17 | 10.2 | 33.6 | 0.74 |
| g19 | 10 | 33.5 | 0.74 |
| g21 | 10.1 | 33.4 | 0.74 |
| g23 | 10.3 | 33.5 | 1 |
| g25 | 10.3 | 33.4 | 0.74 |
| g27 | 10 | 33.5 | 0.74 |
| g29 | 10.2 | 33.3 | 0.74 |
| g31 | 10.4 | 33.4 | 1 |
| g33 | 10.3 | 33.6 | 0.48 |
| g35 | 10.2 | 33.4 | 0.48 |
| g37 | 10.1 | 33.5 | 0.48 |
| g39 | 10.2 | 33.6 | 0.74 |
| Generations | Illustrations | Location within the Plot | Orientation |
|---|---|---|---|
| g1 |  | edge, interior | east, south, west, north, center |
| g3 |  | edge | south, northeast |
| g5 |  | edge, interior | southeast, north |
| g7 |  | edge | southeast, east |
| g9 |  | edge | southeast, east |
| g11 |  | edge | southeast, east |
| g13 |  | edge, interior | southeast, center |
| g15 |  | edge, interior | southeast, center, southwest |
| g17 |  | edge | southeast, east |
| g21 |  | edge | southwest, east |
| g23 |  | edge | southeast, east |
| g25 |  | edge | southeast |
| g27 |  | edge, interior | southwest, east |
| g29 |  | edge | southeast |
| g31 |  | edge | southeast |
| g39 |  | edge, interior | southeast, southwest, center |
| Item | Description | Percentage |
|---|---|---|
| Location | edge | 26% |
| interior | 0% | |
| edge and interior | 74% | |
| Orientation | north | 2.6% |
| south | 5.2% | |
| east | 18.4% | |
| west | 0% | |
| southeast | 34.2% | |
| southwest | 10.5% | |
| northeast | 2.6% | |
| northwest | 0% | |
| center | 10.5% |
| Number | Winter UTCI Score | Summer UTCI Score | Sunshine Hours Score | Rating |
|---|---|---|---|---|
| 1 | 0.67 | 0.38 | 0.85 | 1.9 |
| 2 | 0.54 | 0.59 | 0.76 | 1.89 |
| 3 | 0.62 | 0.4 | 0.84 | 1.86 |
| 4 | 0.71 | 0.46 | 0.67 | 1.85 |
| 5 | 0.63 | 0.68 | 0.52 | 1.83 |
| 6 | 0.63 | 0.69 | 0.52 | 1.83 |
| 7 | 0.62 | 0.69 | 0.52 | 1.83 |
| 8 | 0.8 | 0.21 | 0.81 | 1.83 |
| 9 | 0.46 | 0.51 | 0.85 | 1.82 |
| 10 | 0.52 | 0.41 | 0.87 | 1.81 |
| Number | Layout | Winter UTCI | Summer UTCI |
|---|---|---|---|
| Case 1 |  |  |  |
| Case 2 |  |  |  |
| Case 3 |  |  |  |
| Case 4 |  |  |  |
| Case 5 |  |  |  |
Disclaimer/Publisher’s Note: The statements, opinions and data contained in all publications are solely those of the individual author(s) and contributor(s) and not of MDPI and/or the editor(s). MDPI and/or the editor(s) disclaim responsibility for any injury to people or property resulting from any ideas, methods, instructions or products referred to in the content. |
© 2023 by the authors. Licensee MDPI, Basel, Switzerland. This article is an open access article distributed under the terms and conditions of the Creative Commons Attribution (CC BY) license (https://creativecommons.org/licenses/by/4.0/).
Share and Cite
Ma, Q.; Shi, L.; Shi, J.; Liu, S.; Chen, M.; Zhang, F. Study on the Layout of Public Space in Multistory Settlements Based on Outdoor Thermal Environment in Hot-Summer and Cold-Winter Regions of China. Atmosphere 2023, 14, 1070. https://doi.org/10.3390/atmos14071070
Ma Q, Shi L, Shi J, Liu S, Chen M, Zhang F. Study on the Layout of Public Space in Multistory Settlements Based on Outdoor Thermal Environment in Hot-Summer and Cold-Winter Regions of China. Atmosphere. 2023; 14(7):1070. https://doi.org/10.3390/atmos14071070
Chicago/Turabian StyleMa, Qian, Lei Shi, Jiaqi Shi, Simian Liu, Mengjia Chen, and Fupeng Zhang. 2023. "Study on the Layout of Public Space in Multistory Settlements Based on Outdoor Thermal Environment in Hot-Summer and Cold-Winter Regions of China" Atmosphere 14, no. 7: 1070. https://doi.org/10.3390/atmos14071070
APA StyleMa, Q., Shi, L., Shi, J., Liu, S., Chen, M., & Zhang, F. (2023). Study on the Layout of Public Space in Multistory Settlements Based on Outdoor Thermal Environment in Hot-Summer and Cold-Winter Regions of China. Atmosphere, 14(7), 1070. https://doi.org/10.3390/atmos14071070