Abstract
In the Yellow and Bohai Seas, the detailed characteristics of visibility are analyzed based on automatic hourly observation data of marine visibility between 2019 and 2021. The results show that the annual average visibility in the Yellow and Bohai Seas is 13.346 km. The average visibility at high latitudes is higher than that at low latitudes in the Yellow and Bohai Seas. The low visibility area is mainly distributed in the southwest of the Yellow Sea. There are obvious seasonal differences in visibility in the Yellow and Bohai Seas. Visibility is high from September to November, with maximum values in October. Visibility is lowest in July when the maximum visibility is low and the minimum visibility is high. The visibility in spring is overall relatively low, and the areas of low visibility appear in the southwest of the Yellow Sea. The visibility in autumn is overall relatively high, and the areas of high visibility occur in the northern part of the Bohai and Yellow Seas. The visibility has significant intraday variation. The visibility around sunset is significantly higher than that around sunrise. The hourly visibility is low between 4:00 and 9:00, with the lowest visibility most likely around 7:00. The hourly visibility is high between 16:00 and 21:00, with the highest visibility most likely around 18:00. Low visibility occurs frequently between November and April, most of all in March. Low visibility most often occurs between 4:00 and 7:00. Low visibility may occur at any time between November and April, and also in mornings between May and August. It occurs less often at other times.
1. Introduction
The Yellow and Bohai Seas form an important maritime area in the north of China, and many of its ports are busy with shipping. Atmospheric visibility is an important meteorological factor affecting marine transportation. Low visibility will make it difficult to observe and position, which can easily cause marine traffic accidents such as collisions, resulting in casualties, property losses, and environmental pollution. The monitoring and forecasting of visibility can be improved by studying the changes in visibility more precisely [1,2,3,4].
Many researchers have studied maritime visibility. Visibility research methods can be roughly divided into three categories: field observation [5,6,7], satellite remote sensing [8,9] and numerical simulation [10,11,12,13]. Research areas have been mostly concentrated in the Newfoundland Sea area on the east coast of Canada, the sea area south of the Kamchatka Peninsula, the California sea area on the west coast of the United States, the sea area off the northeast coast of Scotland in the United Kingdom and the Yellow Sea of China [14,15,16,17,18].
Fog is the most common and severe low–visibility weather, receiving much attention. Visibility is an indicator used to distinguish different intensities of fog. The weather processes that lead to low visibility and thus impact maritime navigation mainly occur in the atmospheric boundary layer at sea. However, most of our understanding of the atmospheric boundary layer comes from studies carried out on land. A series of observation plans of maritime visibility have been implemented such as CALSPAN, CEWCOM and Project Haar [19,20,21]. By such means, detailed information about the maritime atmospheric boundary layer formed by low visibility has been obtained. At the same time, the boundary layer structure of sea fog with low visibility is analyzed. These field observation plans have raised awareness of low visibility and related concerns [22,23,24,25]. The research provides an important reference for the accurate observation and judgment of low visibility weather. However, these observations are mostly experiments, and real-time and continuous observation data cannot be obtained.
Changes in sea visibility in the Yellow and Bohai Seas have long been a matter of concern. Due to a lack of data obtained by direct observation at sea [26,27,28], the temporal and spatial characteristics of visibility have few studies over the whole Yellow and Bohai Seas. However, detailed observational data are essential if sea visibility in this region is to be effectively monitored and forecasted. For this reason, the observation of marine visibility needs to be improved in the Yellow and Bohai Seas [2,29,30].
In recent years, through the deployment of automatic stations and buoys and the accumulation of ship observation data, the visibility observation capability of the Yellow Sea and the Bohai Sea has been gradually enhanced. In this study, climatic characteristics of maritime visibility and the frequency of low-visibility conditions in the Yellow and Bohai Seas are analyzed in detail, based on high-temporal-resolution automatic observation data of marine visibility obtained.
2. Materials and Methods
This study uses the automatic observation data of hourly marine visibility between 2019 and 2021, which is sourced from the National Meteorological Information Center. The hourly automatic observation data set can monitor changes in meteorological parameters, as well as hydrological information, in key sea areas with high time resolution in a continuous and long-term manner. Automatic visibility observation devices are carried on observation platforms such as buoys and oil platforms. The observation instruments of visibility include forward scattering instruments and transmission instruments. Two instruments obtain visibility, respectively, by measuring the scattering coefficient and transmission coefficient of air [31]. The average observation error of the instruments is less than 20%, which meets the range of visibility measurement uncertainty specified by WMO [32,33]. The National Meteorological Information Center has integrated and controlled the quality of data from automatic observation device which have been added to the Yellow and Bohai Seas in recent years, thereby enriching the ocean observation data of this area and providing data support for the development of marine meteorological research. The 2 m temperature, sea surface temperature, 10 m u-component of wind, and 10 m v-component of wind of ERA5 monthly averaged reanalysis data was used to analyze the climate characteristics in the Yellow and Bohai seas from 1991 to 2020 (https://cds.climate.copernicus.eu/cdsapp#!/dataset/reanalysis-era5-single-levels-monthly-means?tab=form, accessed on 30 June 2023) [34].
Automatic hourly observation data of marine visibility are obtained as follows: If less than 3 h are missing in a day, the data for that day are retained. If more than 3 h are missing in a day, the observation data for that day are considered absent. There are 12 missing times, with missing times accounting for less than 0.04% of the total times. The annual average value of visibility is the average value of visibility from January to December in a calendar year. The seasonal division method is as follows: winter extends from December in one year through to February of the next; spring from March to May; summer from June to August; and autumn from September to November. The standard deviation of visibility is calculated based on the hourly average visibility data in the Yellow and Bohai Sea.
According to Koschmieder’s law (Formula (1)), the visibility is inversely proportional to the atmospheric extinction coefficient.
where VIS is visibility, and σ is atmospheric extinction coefficient, and ε is contrast threshold.
The atmospheric extinction coefficient can be considered as spatially continuous and can be Linear interpolation. For the visible light interpolation process, visibility is first converted to atmospheric extinction coefficient, and then the extinction coefficient is interpolated, and then converted back to visibility.
The spatial distribution of visibility is interpolated using natural interpolation method and extrapolated using linear method [35]. The spatiotemporal characteristics of monthly visibility in the Yellow and Bohai Sea from 2019 to 2021 were analyzed by the EOF method. The seasonal probability distribution function of visibility, at intervals of 2 km, is determined by the frequency of visibility. The probability distribution function of visibility has been normalized. The cumulative probability distribution function is used to analyze the distribution of visibility data in February and July. The cumulative probability distribution function of visibility has also been normalized. According to the “Convention on the International Regulations for Preventing Collisions at Sea” [36], special safety measures are required for sea navigation with visibility below 2 nautical miles. The frequency characteristics of visibility from 2 km to 5 km were analyzed by classification in this study. Average visibility of less than 5 km is defined as low visibility. The frequency of low visibility is the times accumulated when the average visibility is less than 5 km. The study area (117~127.5° E, 35~41.5° N) is the Yellow Sea and the Bohai Sea (Figure 1a). The selected period of visibility observation data covers three years from 2019 to 2021. The spatial distribution of observation stations covers the same sea area (Figure 1b).
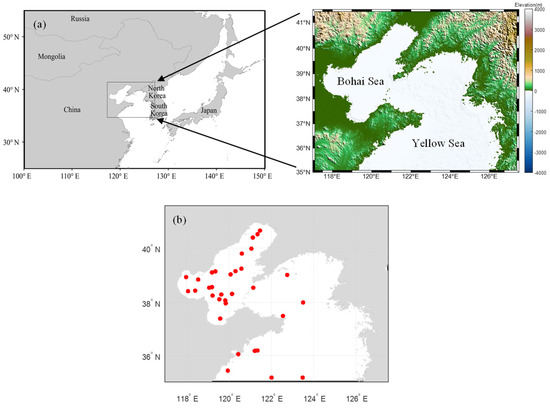
Figure 1.
The study region (a) and Spatial distribution of observation stations (b) (The red dots denote the observation stations).
3. Results
3.1. Annual and Seasonal Characteristics of Visibility
The climate characteristics of the Yellow and Bohai Seas were analyzed using ERA5 reanalysis data on 2 m air temperature, sea surface temperature, and wind from 1991 to 2020 (Figure 2). From the spatial distribution, it can be seen that both the 2 m air temperature and sea surface temperature in the Yellow and Bohai Sea have the characteristics of low in the north and high in the south. In the Yellow and Bohai Seas, the climate is obviously a monsoonal climate, and southern winds prevail in summer, and northwestern winds prevail in winter.
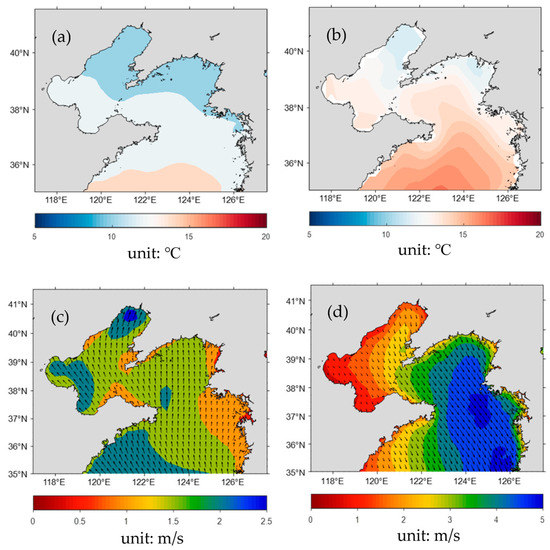
Figure 2.
The climate characteristics in the Yellow and Bohai Seas from 1991 to 2020 ((a) 2 m air temperature, (b) sea surface temperature, (c) wind in summer, (d) wind in winter).
In the Yellow and Bohai Seas, the average visibility at high latitudes is higher than that at low latitudes (Figure 3a). The low visibility area is mainly distributed in the southwest of the Yellow Sea. From the seasonal distribution of visibility (Figure 3b–e), the visibility in spring is overall relatively low, and the areas of low visibility appear in the southwest of the Yellow Sea. The visibility in autumn is overall relatively high, and the areas of high visibility occur in the northern part of the Bohai and Yellow Seas. Throughout the four seasons, the visibility in the southwest of the Yellow Sea has been consistently low.
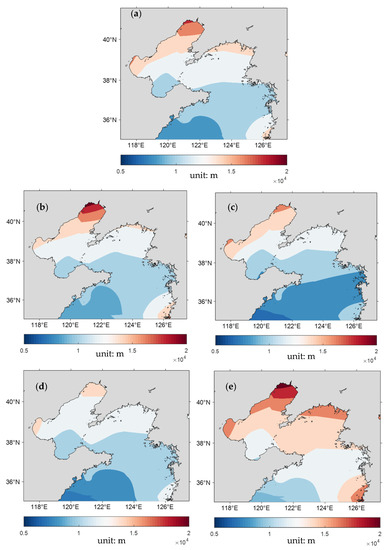
Figure 3.
The distribution of annual (a) and seasonal ((b) winter, (c) spring, (d) summer, (e) autumn) average visibility in the Yellow and Bohai Seas from 2019 to 2021.
Between 2019 and 2021, annual average visibility in the Yellow and Bohai Seas was 13.346 km, and the standard deviation of the annual average visibility was 4.351 km (Table 1). As shown by the values in Table 1, the maximum average and median of visibility both occurred in autumn and were 15.514 km and 15.696 km, respectively. The minimum average and median of visibility both occurred in summer and were 12.529 km and 12.312 km (Table 1), respectively. The average and median visibility shows significant differences between that in autumn and in summer. The average and median visibility in winter and spring were similar.

Table 1.
Seasonal average and standard deviations of visibility (unit/km) in the Yellow and Bohai Seas from 2019 to 2021.
The maximum standard deviation of visibility was 4.749 km, in winter, and the minimum standard deviation of visibility was 3.612 km, in summer. Although the average visibility in winter and summer is similar, the standard deviation of visibility in winter is significantly greater than that in summer, indicating that there is a significant difference in the distribution of visibility in winter and summer.
Analysis of the data reveals obvious seasonal differences in the distribution of visibility in the Yellow and Bohai Seas (Figure 4). Maximum values of PDF (Probability Density Function) in summer and autumn are greater than 0.2, while maximum values of PDF in winter and spring are lower than 0.2. The maximum value of visibility distribution in winter and spring is obtained at 12–14 km, while the maximum values of visibility distribution in summer and autumn are obtained at 10–12 km and 16–18 km, respectively. The area of statistical distribution of low visibility is greatest in winter, and the area of high visibility is greatest in autumn.
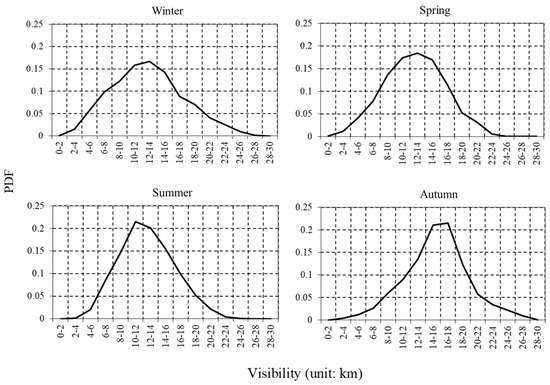
Figure 4.
Seasonal distribution of visibility in the Yellow and Bohai Seas from 2019 to 2021.
3.2. Monthly Characteristics of Visibility
The average visibility was high and was more than 15 km from September to November (Table 2). The average visibility was smaller in February and July, and the visibility was less than 12 km. The maximum average visibility appeared in October and was 15.659 km. The minimum average visibility appeared in July and was 11.677 km.
Table 2.
Monthly average and standard deviations of visibility (unit/km) in the Yellow and Bohai Seas from 2019 to 2021.
The median visibility was high from September to November, which also exceeded 15 km (Table 2). The median visibility was low in February and July, and was less than 12 km. The maximum median visibility appeared in September and was 16.009 km. The minimum median visibility appeared in February and was 11.098 km. The maximum average visibility and the maximum median visibility appeared in October and September, respectively. The occurrence time of the minimum average visibility and the minimum median visibility appeared in July and February, respectively.
From the monthly data distribution (Figure 5), it can also be observed that changes in monthly median visibility are similar to changes in the average value. Notably, the maximum visibility is low and the minimum visibility is high in July.
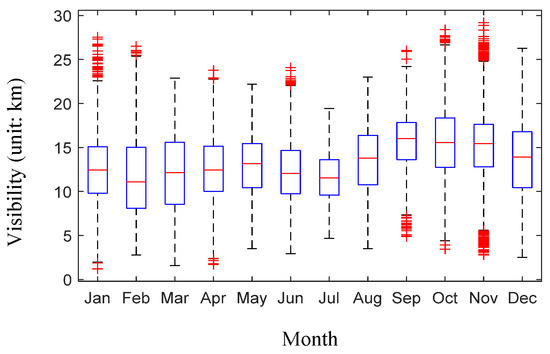
Figure 5.
Monthly distributions of visibility in the Yellow and Bohai Seas from 2019 to 2021.
The minimum value of the standard deviation of visibility appeared in July and was 2.906 km (Table 2). The maximum value of standard deviation of visibility appeared in December, which was 4.904 km. The standard deviation of visibility in July was small, indicating that the distribution of visibility in July was concentrated, and the fluctuation of visibility in July was small. The standard deviation of visibility in December is large (Figure 5).
The average and median visibility in February and July are very close, but the standard deviation in February is significantly greater than that in July, resulting in a large difference in the distribution of visibility between February and July. It can be clearly seen from the comparison of the cumulative distribution function (CDF) in February and July (Figure 6) that the occurrence probability of low visibility of less than 6 km in February is significantly larger than that in July, and the occurrence probability of a high visibility of more than 16 km in February is also significantly larger than that in July. The frequency of low visibility weather and high visibility weather in February is greater than that in July. Although the average and median visibility in February and July are very close, there is a huge difference in terms of low visibility between February and July, which has attracted much attention.
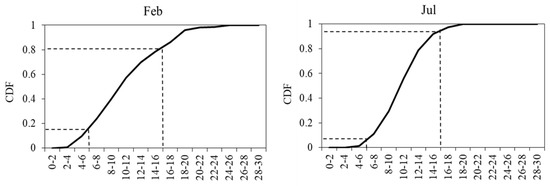
Figure 6.
Cumulative distribution function of visibility in February and July in the Yellow and Bohai Seas from 2019 to 2021.
The spatiotemporal characteristics of visibility in the Yellow and Bohai Sea from 2019 to 2021 were analyzed using the EOF method (Figure 7). The variance contribution of the first and second modes are 64.4% and 17.4%, respectively, and the total variance contribution of the two modes is 81.8%. The first mode is positive in the northern Bohai Sea and negative in the eastern Yellow Sea. The second mode is negative in the west of Bohai Sea and positive in the north and southeast of Yellow Sea. The time coefficients of the first and second modes have obvious changes with time, and the frequency of positive–negative alternation of the first mode time coefficient is higher.
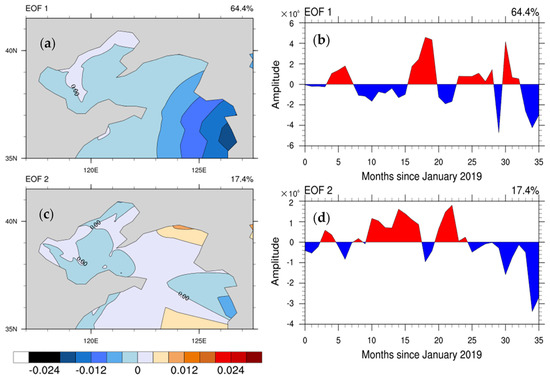
Figure 7.
Spatial modes ((a) EOF1, (c) EOF2) and time coefficients ((b) EOF1, (d) EOF2) of visibility in the Yellow Sea and Bohai Sea of EOF analysis.
3.3. Intraday Variations of Visibility
It can be seen from the curve of hourly visibility in the Yellow and Bohai Seas (Figure 8) that the hourly visibility is low between 4:00 and 9:00, and the lowest visibility is most likely around 7:00. The hourly visibility is high between 16:00 and 21:00, and highest visibility most likely around 18:00. The visibility has obvious intraday variation characteristics. The visibility around sunset is significantly higher than that around sunrise.
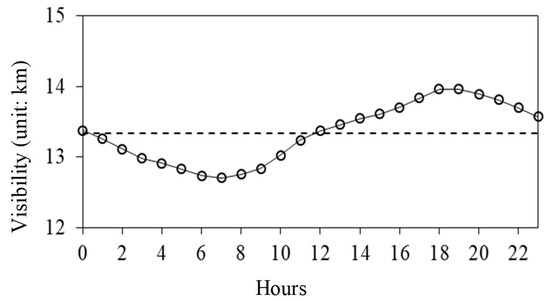
Figure 8.
Hourly visibility in the Yellow and Bohai Seas from 2019 to 2021.
Considering the distribution of visibility in the Yellow and Bohai Seas on an hourly and monthly basis (Figure 9), it can be seen that visibility between September and November is significantly higher than in other months. There is an obvious low-visibility period between 5:00 and 9:00 in the June–September period, with the lowest visibility occurring around 7:00 in July. There is also a high-visibility period between 18:00 and 21:00 in September, with the highest visibility occurring around 19:00.
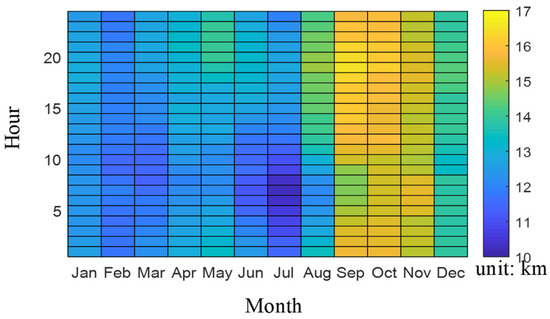
Figure 9.
Monthly and hourly distributions of visibility in the Yellow and Bohai Seas from 2019 to 2021.
3.4. Characteristics of Low Visibility
Because low visibility has attracted more attention in previous studies, we focus on low visibility in our analysis. From the monthly statistical chart of low-visibility frequency in the Yellow and Bohai Seas (Figure 10), it can be seen that low visibility occurs frequently between November and April, and most frequently of all in March. The frequency of low visibility from July to October is relatively low.
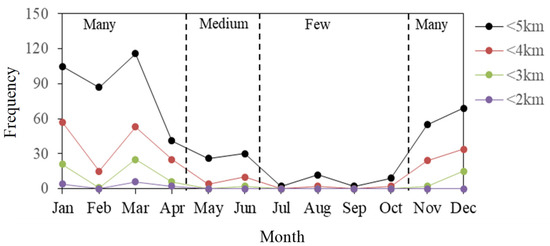
Figure 10.
Monthly frequencies of low visibility in the Yellow and Bohai Seas from 2019 to 2021.
The change of low visibility in the Yellow and Bohai Seas during the years from 2019 to 2021 can be divided into three stages: many, medium and few. The many stage of low visibility is from November to April of the next year. The medium stage is May and June. The few stage is from July to October (Figure 10). In the many stage, the frequency of visibility of less than 5 km is higher and is more than 30 times. In the few stage, the frequency of visibility of less than 5 km is less than 15 times. In the medium stage, the frequency of visibility of less than 5 km is between 15 and 30 times. The variation characteristics of visibility of less than 4 km are similar as those of visibility of less than 5 km. The frequency of low visibility in the many stage is significantly higher than that in the few stage.
It can be seen from the hourly frequency of low visibility in the Yellow and Bohai Seas (Figure 11) that there are many instances of visibility less than 5 km between 4:00 and 7:00. Low visibility occurs less frequently between 13:00 and 18:00. The frequency of low visibility around sunrise is significantly higher than that around sunset. The curve of hourly low-visibility frequency is similar to the curve of hourly visibility, showing obvious intraday variation characteristics, but the two curves are not completely corresponding.
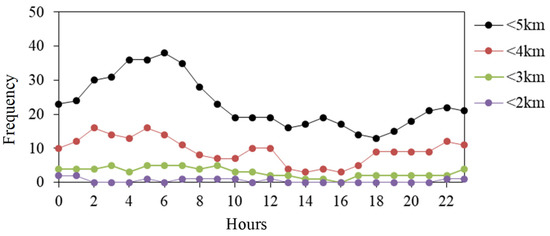
Figure 11.
Hourly frequencies of low visibility in the Yellow and Bohai Seas from 2019 to 2021.
From the days–hours statistical chart of low visibility in the Yellow and Bohai Seas (Figure 12), it can be seen that low visibility is most likely between November and April, when it may occur at any time of the day. Low visibility is also widespread during mornings between May and August. It occurs less frequently at other times.
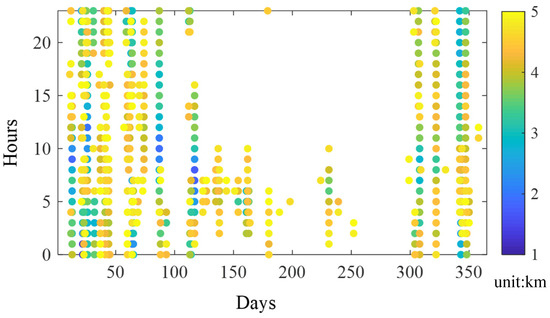
Figure 12.
Daily and hourly distributions of low visibility values in the Yellow and Bohai Seas from 2019 to 2021 (Average visibility of less than 5 km is defined as low visibility).
4. Discussion
At present, the visibility monitoring of the Yellow and Bohai Seas is mainly based on field observation data and satellite data, both of which have advantages and disadvantages. The field observation data offer high accuracy, but limited coverage. Satellite data have advantages in spatial distribution, but their observation accuracy is low. Recently, the number of automatic observation devices of visibility in the Yellow and Bohai Seas has been increased, and their observation mode has been changed from manual observation three times a day to automatic observation with high time resolution. Using automatic observation data of hourly marine visibility, the precise characteristics of visibility in the region were analyzed in this study.
We found that low visibility in the Yellow and Bohai Seas occurs most frequently between November and April, and most frequently of all in March. The frequency of low visibility from July to October is relatively low. Using satellite data, Wu et al. [37] found that sea fog in the Bohai Sea is most prevalent in December, followed by April, but is less likely to occur between August and October. In the Yellow Sea, fog is most prevalent between March to June, and most of all in April, with less fog between August and November, least of all in October. The study region of this paper covered both the Yellow Sea and the Bohai Sea. The periods of low visibility identified in this study are basically consistent with those found by Wu et al. [37]. The reported periods of high visibility indicate the common time characteristics of the Yellow and Bohai Seas.
This study used high-time-resolution observation data, and because observation modes have recently changed from manual observation three times a day to a higher-frequency automatic observation, more detailed data can now be obtained. The hourly visibility is low between 4:00 and 9:00, with low visibility most likely around 7:00. The hourly visibility is high between 16:00 and 21:00, and high visibility most likely around 18:00. The visibility has obvious intraday variation characteristics. The visibility around sunset is significantly higher than that around sunrise. From hourly marine visibility data, we found that low visibility is most likely between 4:00 and 7:00, and most likely of all at 6:00. Low visibility is least likely between 17:00 and 19:00, and least likely of all around 18:00. The curve of hourly low-visibility frequency is similar to the curve of hourly visibility, showing obvious intraday change characteristics, but the two curves are not consistent. Zheng et al. [38] studied daily variations in sea fog in the Bohai Sea using artificial observation data obtained three times a day. They found that fog was most likely to occur at 8:00, and less likely at 14:00 and at 20:00. The results of this study are supported by those obtained by Zheng et al. [38]. We give the hourly variation of low visibility, which is more detailed than the characteristics reflected by Zheng et al. [38].
Although the average visibility in July is small, the low visibility is very few; the two are not contradictory. The maximum visibility is low and the minimum visibility is high in July, resulting in the overall average visibility is low, while the frequency of low visibility weather is very few. The average and median of visibility in February and July are very close, but the standard deviation of February is significantly greater than that of July, resulting in a large difference in the distribution of visibility between February and July. There is a huge difference in terms of low visibility between February and July. The frequency of low-visibility weather and high-visibility weather in February are greater than that in July.
In spring, the areas of low visibility appear in the southwest of the Yellow Sea. In autumn, the areas of high visibility occur in the northern part of the Bohai and Yellow Seas. Using satellite data, Wu et al. [37] found that the frequency of sea fog in the western Yellow Sea is significantly higher than that in the Bohai Sea in spring, and the frequency of sea fog in autumn is the lowest among the four seasons. The results of this study are supported by those obtained by Wu et al. [37].
According to Koschmieder’s law, visibility is inversely proportional to the extinction coefficient. The attenuation of light intensity caused by the absorption and scattering of light by substances such as gas molecules, aerosol particles, and water droplets when visible light passes through the atmosphere [39]. Therefore, the magnitude of this coefficient is influenced by the composition of the atmosphere. The weather phenomena that affect the extinction coefficient include fog, haze, precipitation, snowfall, and dust. The corresponding meteorological elements include humidity, aerosol concentration, precipitation and snowfall [40,41].
The data in this study covers the period from 2019 to 2021. There is a great deal of scientific evidence to support that the global pollutant levels dropped during the pandemic of COVID-19. Some pollutants have the ability to act as fog condensation nuclei, and reduced pollutants may lead to increased visibility [42,43]. The visibility during 2020–2021 in the Yellow Sea and Bohai Sea may be better than the average. The data used in this study covers a short time period. There is, therefore, a need for longer-term high-resolution visibility observation data, so that variations in visibility in the Yellow and Bohai Sea area can be better understood.
At present, although the extent of sea visibility observation covers the whole of the Yellow and Bohai Sea region, there is an uneven spatial distribution of observation stations. The density of observation stations close to the coast is higher than that of those located far offshore. In terms of spatial representation, there is still a significant difference between offshore and the open sea. The observations of marine visibility in the Yellow and Bohai Seas needs to be increased continuously.
5. Conclusions
Based on the hourly observation data of visibility which we obtained for the Yellow and Bohai Seas during the years 2019–2021, and our analysis of climatic characteristics of sea visibility in this region during this time, the following conclusions can be stated.
- (1)
- Between 2019 and 2021, the annual average visibility of the Yellow Sea and Bohai Sea was 13.346 km, and the standard deviation of the annual average visibility was 4.351 km. There were obvious differences in the distribution of visibility across the seasons. The maximum average visibility was 15.514 km, in autumn. The minimum average visibility of 12.529 km occurred in summer. The maximum standard deviation of visibility of 4.749 km was recorded in winter and the minimum standard deviation of 3.612 km was recorded in summer. The highest values of visibility distribution in winter and spring were in the range of 12–14 km, while the highest values of visibility distribution in summer and autumn were in the range of 10–12 km and 16–18 km, respectively. The areas of low visibility appear in the southwest of the Yellow Sea in spring. The areas of high visibility occur in the northern part of the Bohai and Yellow Seas in autumn. The low visibility area is mainly distributed in the southwest of the Yellow Sea.
- (2)
- Changes in monthly median visibility were similar to changes in average value. The monthly visibility was high from September to November. The average value of visibility was highest in October and lowest in July. In July, the maximum visibility is low, and the minimum visibility is high. The visibility has obvious intraday variation characteristics. The visibility around sunset is significantly higher than that around sunrise. The hourly visibility is low between 4:00 and 9:00, with low visibility most likely around 7:00. The hourly visibility is high between 16:00 and 21:00, and high visibility most likely around 18:00.
- (3)
- Between November and April, low visibility occurs frequently, most frequently in March. Between July and October, the frequency of low visibility was relatively low. Low visibility occurred frequently between 4:00 and 7:00. The change of low visibility in the Yellow and Bohai Seas can be divided into three stages: many, medium and few. The many stage of low visibility is from November to April of the next year. The medium stage is May and June. The few stage is from July to October. In the Yellow and Bohai seas, low visibility mainly occurs at any time between November and April, and also during mornings between May and August. It occurs less often at other times.
Author Contributions
L.Z. analyzed the data, made the figures and wrote the paper. M.X., X.Q., D.Z., R.L., X.F. and B.W. gave scientific advice and helped improve the paper. F.M. revised the language and characters. All the authors contributed to the discussion and final version of the paper. All authors have read and agreed to the published version of the manuscript.
Funding
This study was funded by Innovation and Development Project of China Meteorological Administration (CXFZ2022J028, CXFZ2023J004), the National Key Research and Development Program of China (2022YFC3090600), Bohai Rim Regional Science and Technology Collaborative Innovation Fund (QYXM202101, QYXM202202), The Natural Science Foundation of Tianjin (22JCQNJC00370), Basic Research Fund of Chinese Academy of Meteorological Sciences (Grant No. 2023Z016) and the Transverse Item-Research Project of the Chinese Academy of Meteorological Sciences (Grant No. IN_JS_2022031).
Institutional Review Board Statement
Not applicable.
Informed Consent Statement
Not applicable.
Data Availability Statement
The data used in this study are publicly available via the National Meteorological Information Centre http://www.nmic.cn/ (Recently accessed date: 30 May 2022).
Acknowledgments
The authors acknowledge, with deep gratitude, the contribution of the anonymous reviewers whose time and effort in providing comments has improved this paper substantially.
Conflicts of Interest
The authors declare that there are no conflicts of interest regarding the publication of this paper.
References
- Wu, D.; Wu, X.J.; Zhu, X.X. Fog and Haze; China Meteorological Press: Beijing, China, 2009. [Google Scholar]
- Fu, G.; Li, P.Y.; Zhang, S.P.; Gao, S.H. A Brief Overview of the Sea Fog Study in China. Adv. Meteor. Sci. Technol. 2016, 2, 20–28. [Google Scholar]
- Niu, S.J.; Lu, C.S.; Lü, J.J.; Xu, F.; Zhao, L.J.; Liu, D.Y.; Yue, Y.Y.; Zhou, Y.; Yu, H.Y.; Wang, T.S. Advances in Fog Research in China. Adv. Meteor. Sci. Technol. 2016, 2, 6–14. [Google Scholar]
- Zhang, G.C. The Progress of Fog Forecast Operation in China. Adv. Meteor. Sci. Technol. 2016, 2, 42–48. [Google Scholar]
- Tanimoto, Y.; Xie, S.P.; Kai, K.; Okajima, H.; Tokinaga, H.; Murayama, T.; Nonaka, M.; Nakamura, H. Observations of marine atmospheric boundary layer transitions across the summer Kuroshio Extension. J. Clim. 2009, 6, 1360–1374. [Google Scholar] [CrossRef]
- Zhang, S.P.; Zhang, X.; Shi, X.M. Observational analysis of a fog event in the Oyashio Extension area. J. Mar. Meteorol. 2022, 1, 1–11. [Google Scholar]
- WMO: Guide to Meteorological Instruments and Methods of Observation, 7th ed.; WMO-No. 8; World Meteorological Organization: Geneva, Switzerland, 2008.
- Wu, D.; Lu, B.; Zhang, T.C.; Yan, F.Q. A method of detecting sea fogs using CALIOP data and its application to improve MODIS-based sea fog detection. J. Quant. Spectrosc. Radiat. Transf. 2015, 153, 88–94. [Google Scholar] [CrossRef]
- Wu, X.J.; Li, Y.; Huang, B.; Wang, X.; Song, W. Application of dynamic threshold method to sea fog detection with FY-2 satellite. J. Mar. Meteor. 2017, 2, 31–41. [Google Scholar]
- Fu, G.; Xu, J.; Zhang, S.Q. Comparison of Modeling Atmospheric Visibility with Visible Satellite Imagery. Period. Ocean Univ. China 2011, 4, 1–10. [Google Scholar]
- Wang, Y.M.; Gao, S.H.; Fu, G.; Sun, J.L.; Zhang, S.P. Assimilating MTSAT-derived humidity in nowcasting sea fog over the Yellow Sea. Weather. Forecast. 2014, 29, 205–225. [Google Scholar] [CrossRef]
- Jiang, Y.X.; Zhang, S.P.; Xie, S.P.; Chen, Y.; Liu, H.K. Effects of a cold ocean eddy on local atmospheric boundary layer near the Kuroshio Extension: In situ observations and model experiments. J. Geophys. Res. 2019, 11, 5779–5790. [Google Scholar] [CrossRef]
- Tian, M.; Wu, B.G.; Huang, H.; Zhang, H.S.; Zhang, W.Y.; Wang, Z.Y. Impact of water vapor transfer on a Circum-Bohai-Sea heavy fog: Observation and numerical simulation. Atmos. Res. 2019, 229, 1–22. [Google Scholar] [CrossRef]
- Koracin, D.; Dorman, C.E. Marine Fog: Challenges and Advancements in Observations, Modeling, and Forecasting; Springer International Publishing: Cham, Switzerland, 2017. [Google Scholar]
- Fu, G.; Song, Y.J. Climatology Characteristics of Sea Fog Frequency over the Northern Pacific. Period. Ocean Univ. China 2014, 10, 35–41. [Google Scholar]
- Philip, A.; Bergot, T.; Bouteloup, Y.; Bouyssel, F. The impact of vertical resolution on fog forecasting in the kilometric-scale model AROME: A case study and statistics. Weather. Forecast. 2016, 5, 1655–1671. [Google Scholar] [CrossRef]
- Koracin, D.; Dorman, C.E.; Lewis, J.M.; Hudson, J.G.; Wilcox, E.M.; Torregrosa, A. Marine fog: A review. Atmos. Res. 2014, 143, 142–175. [Google Scholar] [CrossRef]
- Zhang, S.P.; Xie, S.P.; Liu, Q.Y.; Yang, Y.Q.; Wang, X.G.; Ren, Z.P. Seasonal variations of Yellow Sea fog: Observations and mechanisms. J. Clim. 2009, 24, 6758–6772. [Google Scholar] [CrossRef]
- Goodman, J. The microstructure of California coastal fog and stratus. J. Appl. Meteorol. Clim. 1977, 10, 1056–1067. [Google Scholar] [CrossRef]
- Pilie, R.; Mack, E.; Rogers, C.; Katz, U.; Kocmond, W. The formation of marine fog and the development of fog-stratus systems along the California Coast. J. Appl. Meteorol. Clim. 1979, 18, 1275–1286. [Google Scholar] [CrossRef]
- Findlater, J.; Roach, W.; McHugh, B. The haar of North-East Scotland. Q. J. Roy. Meteor. Soc. 1989, 115, 581–608. [Google Scholar] [CrossRef]
- Moores, J.E.; Komguem, L.; Whiteway, J.A.; Lemmon, M.T.; Dickinson, C.; Daerden, F. Observations of near-surface fog at the Phoenix Mars landing site. Geophys. Res. Lett. 2011, 38, L04203. [Google Scholar] [CrossRef]
- Lewis, J.M.; Koracin, D.; Redmond, K.T. Sea fog research in the United Kingdom and United States: A historical essay including outlook. B. Am. Meteorol. Soc. 2004, 3, 395–408. [Google Scholar] [CrossRef]
- Lewis, J.M.; Koracin, D.; Rabin, R.; Businger, J. Sea fog off the California Coast: Viewed in the Context of Transient Weather Systems. J. Geophys. Res. 2003, 108, 4457. [Google Scholar] [CrossRef]
- Oliver, D.A.; Lewellen, W.S.; Williamson, G.G. The interaction between turbulent and radiative transport in the evelopment of fog and low level stratus. J. Atmos. Sci. 1978, 35, 301–316. [Google Scholar]
- Fan, G.F.; Ma, H.; Zhang, X.W.; Liu, Y. Impacts of relative humidity and PM2.5 concentration on atmospheric visibility: A comparative study of hourly observations of multiple stations. Acta. Meteor. Sin. 2016, 6, 959–973. [Google Scholar]
- Xiao, S.R.; Zhou, J.; Wu, Q.Y.; Xu, M.; Shang, G.Q.; Shi, L.F. Improved method for nighttime visibility measurement based on digital photography. Appl. Opt. 2014, 6, 1016–1022. [Google Scholar]
- Zhao, L.J.; Niu, S.J.; Zhang, Y.; Xu, F. Microphysical characteristics of sea fog over the east coast of Leizhou Peninsula, China. Adv. Atmos. Sci. 2013, 4, 1154–1172. [Google Scholar] [CrossRef]
- Qu, P.; Xie, Y.Y.; Liu, L.L.; Lin, Y.; He, N.G. Character Analysis of Sea Fog in Bohai Bay from 1988 to 2010. Plateau Meteor. 2014, 1, 285–293. [Google Scholar]
- Yang, M.; Guo, X.Y.; Zheng, J.Y.; Sun, Q. Long-Term Trend and Inter-Annual Variation of Ocean Heat Content in the Bohai, Yellow, and East China Seas. Water 2022, 17, 2763. [Google Scholar] [CrossRef]
- China Meteorological Administration. Specification for Automatic Ground Meteorological Observation; China Meteorological Press: Beijing, China, 2020. [Google Scholar]
- GB/T 12763.3-2020; National Standards of the People’s Republic of China—Specifications for Marine Survey—Part 3: Marine Meteorological Observations. Ministry of Natural Resources: Beijing, China, 2020.
- Organization, W.M. WMO Guide to Meteorological Instruments and Methods of Observation. World Meteorological Organization (WMO): Geneva, Switzerland, 2008. [Google Scholar]
- Hersbach, H.; Bell, B.; Berrisford, P.; Hirahara, S.; Horányi, A.; Muñoz-Sabater, J.; Nicolas, J.; Peubey, C.; Radu, R.; Schepers, D.; et al. The ERA5 global reanalysis. Q. J. R. Meteorol. Soc. 2020, 146, 1999–2049. [Google Scholar] [CrossRef]
- Amidror, I. Scattered data interpolation methods for electronic imaging systems: A survey. J. Electron. Imaging. 2002, 2, 157–176. [Google Scholar] [CrossRef]
- IMO. Convention on the International Regulations for Preventing Collisions at Sea, 1972 (COLREGs). Available online: https://www.imo.org/en/About/Conventions/Pages/COLREG.aspx (accessed on 30 June 2023).
- Wu, X.J.; Li, S.M.; Liao, M.; Cao, Z.Q.; Wang, L.; Zhu, J. Analyses of seasonal feature of sea fog over the Yellow Sea and Bohai Sea based on the recent 20 years of satellite remote sensing data. Acta. Oceanol. Sin. 2015, 1, 63–72. [Google Scholar]
- Zheng, Y.; Li, R.; Shi, D.D.; Wang, Y.N.; Sun, M.N. Characteristics of offshore and coastal sea fog in the mid-west Bohai Sea. Mar. Forecasts 2016, 6, 74–80. [Google Scholar]
- Griffing, G.W. Relations between the prevailing visibility, nephelometer scattering coefficient and sunphotometer turbidity coefficient. Atmos. Environ. 1980, 14, 577–584. [Google Scholar] [CrossRef]
- Chen, J.; Zhao, C.S. A Review of Influence Factors and Calculation of Atmospheric Low Visibility. Adv. Meteor. Sci. Technol. 2014, 4, 44–51. [Google Scholar]
- Clark, P.A.; Harcourt, S.A.; Macpherson, B.; Mathison, C.T.; Cusack, S.; Naylor, M. Prediction of visibility and aerosol within the operational Met Office unified model. I: Model formulation and variational assimilation. Q. J. R. Meteorol. Soc. 2008, 134, 1801–1816. [Google Scholar] [CrossRef]
- Liu, D.Y.; Yan, W.L.; Qian, J.L.; Liu, M.; Wang, Z.D.; Cheng, M.N.; Peng, H.Q. A movable fog-haze boundary layer conceptual model over Jianghuai area, China. Front. Environ. Sci. 2021, 9, 802316. [Google Scholar] [CrossRef]
- Qian, J.L.; Liu, D.Y.; Yan, S.Q.; Cheng, M.N.; Liao, R.W.; Niu, S.J.; Yan, W.L.; Zha, S.Y.; Wang, L.L.; Chen, X.X. Fog scavenging of particulate matters in air pollution events: Observation and simulation in the Yangtze River Delta, China. Sci. Total. Environ. 2023, 876, 162728. [Google Scholar] [CrossRef]


Disclaimer/Publisher’s Note: The statements, opinions and data contained in all publications are solely those of the individual author(s) and contributor(s) and not of MDPI and/or the editor(s). MDPI and/or the editor(s) disclaim responsibility for any injury to people or property resulting from any ideas, methods, instructions or products referred to in the content. |
© 2023 by the authors. Licensee MDPI, Basel, Switzerland. This article is an open access article distributed under the terms and conditions of the Creative Commons Attribution (CC BY) license (https://creativecommons.org/licenses/by/4.0/).