Article

Investigating VOCs Speciation Characteristics at the Fenceline of Synthetic Rubber Manufacturing Industries via Active and Passive Monitoring Techniques

1
Department of Health Science, Korea University, Anam-ro 145, Seongbuk-gu, Seoul 02841, Republic of Korea
2
Department of Fire and Disaster Protection Engineering, Seoul Digital University, Gonghang-daero, Ganseo-gu, Seoul 07654, Republic of Korea
3
Environmental Research Complex, National Institute of Environmental Research, Hwangyeong-ro 42, Seo-gu, Incheon 22689, Republic of Korea
*
Author to whom correspondence should be addressed.
Atmosphere 2023, 14(7), 1119; https://doi.org/10.3390/atmos14071119
Submission received: 16 June 2023 / Revised: 27 June 2023 / Accepted: 3 July 2023 / Published: 6 July 2023
(This article belongs to the Special Issue Characteristics and Formation of Secondary Organic Aerosols)

Abstract

:
Volatile Organic Compounds (VOCs) are prevalent emissions from a plethora of industries, known for their role in the formation of atmospheric ozone, thus contributing to secondary pollution. Both the United States and the European Union have presented various regulatory measures to mitigate VOC emissions. Nevertheless, the diversity of VOCs, some exhibiting carcinogenic properties, pose substantial challenges in devising comprehensive mitigation strategies. In light of this, the current study focuses on the synthetic rubber manufacturing industry, specifically analyzing VOCs with high emission volumes and elevated Photochemical Ozone Creation Potentials (POCPs). A total of 88 compounds, including PM-57 and TO-14A, were examined in this study. The Active and Passive monitoring methods, two out of the six recommended by the Environmental Protection Agency (EPA) for Fenceline monitoring, were employed. For business entity ‘A’, the Active method revealed the highest emission rates of n-butane (13.5%) and n-Pentane (12.8%). In contrast, the Passive method indicated styrene (9.4%) and toluene (8.1%) as the most prominently emitted compounds. Benzene, though detected at all points ranging from 1~3 µg/m³, is not manipulated in this industry, suggesting potential influence from neighboring enterprises. Compounds such as benzene, toluene, ethylbenzene, xylene, and styrene demonstrated convertible concentrations using both Active and Passive methods, detected within the range of 0~3 µg/m³. Notably, the average concentrations determined by both methods exhibited remarkable similarity. For business entity ‘B’, the Active method detected significant levels of n-hexane (45.0%) and methylcyclopentane (14.4%), whereas the Passive method identified high concentrations of n-hexane (37.7%) and isopentane (8.8%). A general pattern emerged where high concentrations were exhibited at points 9, 10, and 11, located within the production area, while points 1, 2, and 3 displayed lower concentrations, likely due to the influence of eastward wind patterns. In terms of compounds with high POCPs, business entity ‘A’ demonstrated substantial emission of n-butane (38.80%) and n-hexane (27.15%) using the Active method, and toluene (28.62%) and n-hexane (25.23%) via the Passive method. For business entity ‘B’, n-hexane emerged dominantly, detected at 84.57% using the Active method and 68.85% via the Passive method. This suggests that in the synthetic rubber manufacturing industry, n-hexane should be prioritized in formulating effective emission reduction strategies.

1. Introduction

Volatile Organic Compounds (VOCs) constitute a diverse array of compounds and originate from numerous sources. These compounds are known for instigating photochemical reactions in the atmosphere, thus leading to the formation of smog and influencing the levels of particulate matter, specifically PM10 [1].
As a result, countries worldwide are implementing research initiatives aimed at managing the presence of VOCs in the environment effectively. These initiatives involve the development of emission source inventories, the formulation of emission coefficients, and periodic measurements [2].
However, the existing emission coefficients and measurement methodologies are somewhat inadequate in elucidating VOC behavior within the atmospheric context. This shortfall primarily stems from the current focus on modeling and the predictive diffusion distribution of VOCs [3].
In the United States, the Clean Air Act (CAA) underwent amendments in 1977, marking the onset of emission restrictions for large-scale sources that annually discharge more than 100 t of VOCs. Further amendments in 1990 enhanced regulatory structures, categorizing areas into five stages based on ozone standards, while also reinforcing regulations for mobile pollution sources. In addition, it requires state governments to provide a State Implementation Plan (SIP) that incorporates strategies for VOC reduction with the aim of upholding federal air quality standards for a minimum duration of 10 years [4].
In parallel, the European Union (EU) has demonstrated concerted efforts to reduce VOC emissions across its member states. Notably, the EU passed legislation in 1994 regarding the control of VOC emissions from petroleum storage, shipment, and sales facilities. Further, individual member states have developed distinct VOC management strategies to reduce facility-specific VOC emissions [5].
However, air pollution cannot be attributed to a single factor. As tropospheric ozone (O3) in the atmosphere is generated from photochemical reactions between nitrogen oxides (NOx) and VOCs, any effort to mitigate ozone-related issues must consider both NOx and VOCs simultaneously. Pertinent research has utilized the Empirical Kinetic Modeling Approach (EKMA) to examine the correlation between VOCs and NOx, both being precursors of ozone (O3) [6].
Ozone has a bad effect on plants and the human body. According to previous studies, molecules of O3 penetrating the leaves through the stomatal apertures trigger the formation of reactive oxygen species, leading thus to the damage of the photosynthetic apparatus [7].
Importantly, VOC emissions from industrial sites are significant among various emission sources. As per statistics from 2018, industrial processes that utilize large volumes of organic solvents, particularly those in the petroleum and chemical product manufacturing sectors, feature prominently in VOC emissions [8].
In addition, some VOCs such as benzene are known for their high carcinogenicity, which can significantly affect the health of residents living near industrial areas. Recognizing this, the U.S. Environmental Protection Agency (EPA) has implemented the Fenceline Monitoring system. This system allows for real-time measurement of VOC concentrations at the perimeter of industrial sites, with these data then made publicly available. These VOC concentrations are evaluated against the Reference Exposure Level (REL) standards and subsequently disclosed to the local communities. This approach not only identifies the points where concentrations exceed the permissible standards but also aids in tracing these emissions back to their sources, thereby enhancing management and control efforts [9].
Certain VOCs, while not highly carcinogenic, demonstrate high Photochemical Ozone Creation Potentials (POCP), contributing to ozone pollution through their participation in photochemical reactions in the atmosphere [10].
Given these diverse properties, VOCs present a significant challenge in terms of reduction or regulation, especially considering their close association with industrial activities. However, it is feasible to prioritize compounds by industry based on their high carcinogenicity or POCP. The U.S. EPA enforces mandatory public disclosure of concentrations of highly carcinogenic substances like benzene, and it allows each state to select and disclose their priority compounds [11].
The objective of this study is to identify the VOCs requiring priority reduction. This present study focuses on large-scale businesses within industrial complexes that extensively handle organic solvents, particularly in the synthetic rubber manufacturing sector. By examining VOC speciation, this investigation aims to propose a prioritization strategy for VOC reduction.

2. Materials and Method

2.1. Overview of Synthetic Rubber Manufacturing

Rubber is one of the most versatile materials worldwide, with elasticity being its most notable characteristic. This attribute is found in both natural rubber produced from rubber trees and synthetic rubber. The revelation of the structure of natural rubber spurred rapid advancements in the manufacturing of synthetic rubber. Synthetic rubber refers to polymers with physical properties identical or similar to natural rubber [12]. Currently, around 25 types of synthetic rubber are in use, but a select few are more commercially viable and widely used, as depicted in Table 1.
In the production of synthetic rubber, a substantial amount of aliphatic hydrocarbons, specifically chemicals from the C4 to C6 group, are utilized as organic solvents. Importantly, the polymerization process, which unfolds within these organic solutions, has a high potential to produce large numbers of VOCs. Table 2 provides an overview of the typical VOCs emitted in considerable quantities from each respective process [13].

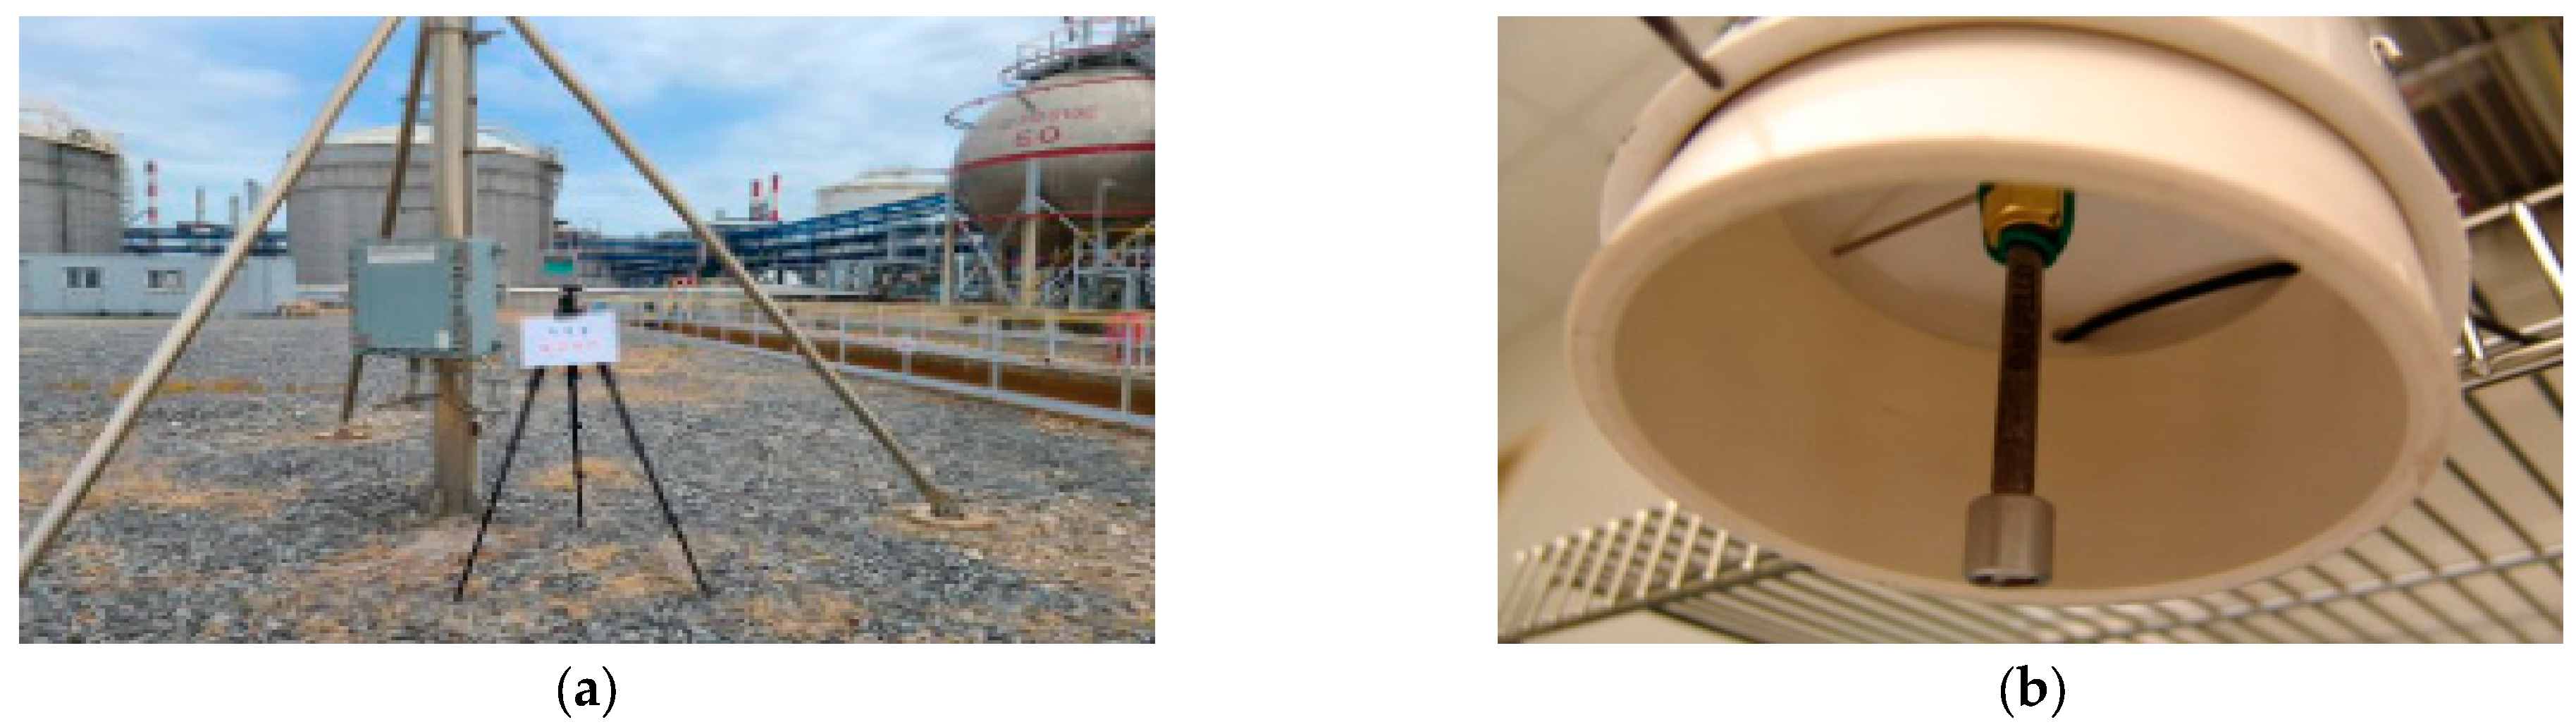
2.2. Methods for VOCs Monitoring

The choice of monitoring locations within an industrial facility adheres to the EPA Method 325A (Volatile Organic Compounds from Fugitive and Area Sources-Sampler Deployment and VOC Sample Collection). The arrangement of samplers accounts for all emission sources within the premises, positioned according to either the angle or distance from the monitoring boundary. The number of sampling sites is chosen based on the total area of the industrial premise [14].
For the monitoring methodologies employed at the targeted facilities, both Passive and Active sampling strategies are utilized, following the EPA Method 325A. The adsorption tubes used for sample collection are in line with the Guidelines for Sorbent Selection from EPA Method TO-17, utilizing the Carbotrap 300 (1/4 in × 3 1/2 in, Sigma, Seoul, Republic of Korea) filled with Carbopack C+Carbopack B+Carbosieve SⅢ. The monitoring height is adjusted using a pole or other safe structure, such that the Diffusive Sampling Cap of the passive diffusion tube is positioned 1.5–3 m above the ground. In order to prevent the entry of particulates, the sampler is placed vertically with the end of the sampling tube facing downwards, and sampling is carried out for a duration of 14 days. In this study, both Passive and Active techniques are employed among the six methodologies recommended by the EPA for Fenceline monitoring. Particularly, the Passive technique captures data over 14 days, with the results subsequently reported (Figure 1). The EPA proposes six monitoring techniques, which are described in Table 3 [15].

2.3. Targets for VOCs Monitoring

VOCs serve as key precursors that catalyze the photochemical reactions involved in the formation of ozone (O3), leading to their classification and regulation as photochemical pollutants. Accordingly, this study primarily focuses on monitoring 57 basic precursors of ozone (Table 4). In addition, the study monitors a selection of compounds outlined in the TO-14 list, which includes chloroform-an organic solvent used in the synthetic rubber manufacturing industry (Table 5) [17].

2.4. Conditions for Sample Analysis

The collection and analysis of samples will be conducted in compliance with US EPA Method TO-15 and the South Korean Air Pollution Process Test Standard (ES01804.2). A stainless steel adsorption tube, filled with the adsorbent Carbotrap 300 (1/4 in × 3 1/2 in, Sigma), is utilized for the process. Prior to its use, the adsorption tube is conditioned for over two hours with 99.99% pure nitrogen at 350 °C using a thermal desorber. The sample collection is conducted with a flow sample suction pump (SIBATA, MP-∑30) at a flow rate of 200 mL/min for 30 min per session, with a total of five sessions conducted between 10 a.m. and 5 p.m. The samples collected via the solid adsorption tube are analyzed using a Gas Chromatograph/Mass Spectrometer (GC/MS). This methodology involves the thermal desorption of collected samples in an adsorption tube, followed by their concentration in a low-temperature trap, another round of thermal desorption, and finally, the separated analytes are measured using a mass spectrometer (MS) [18].

3. Results

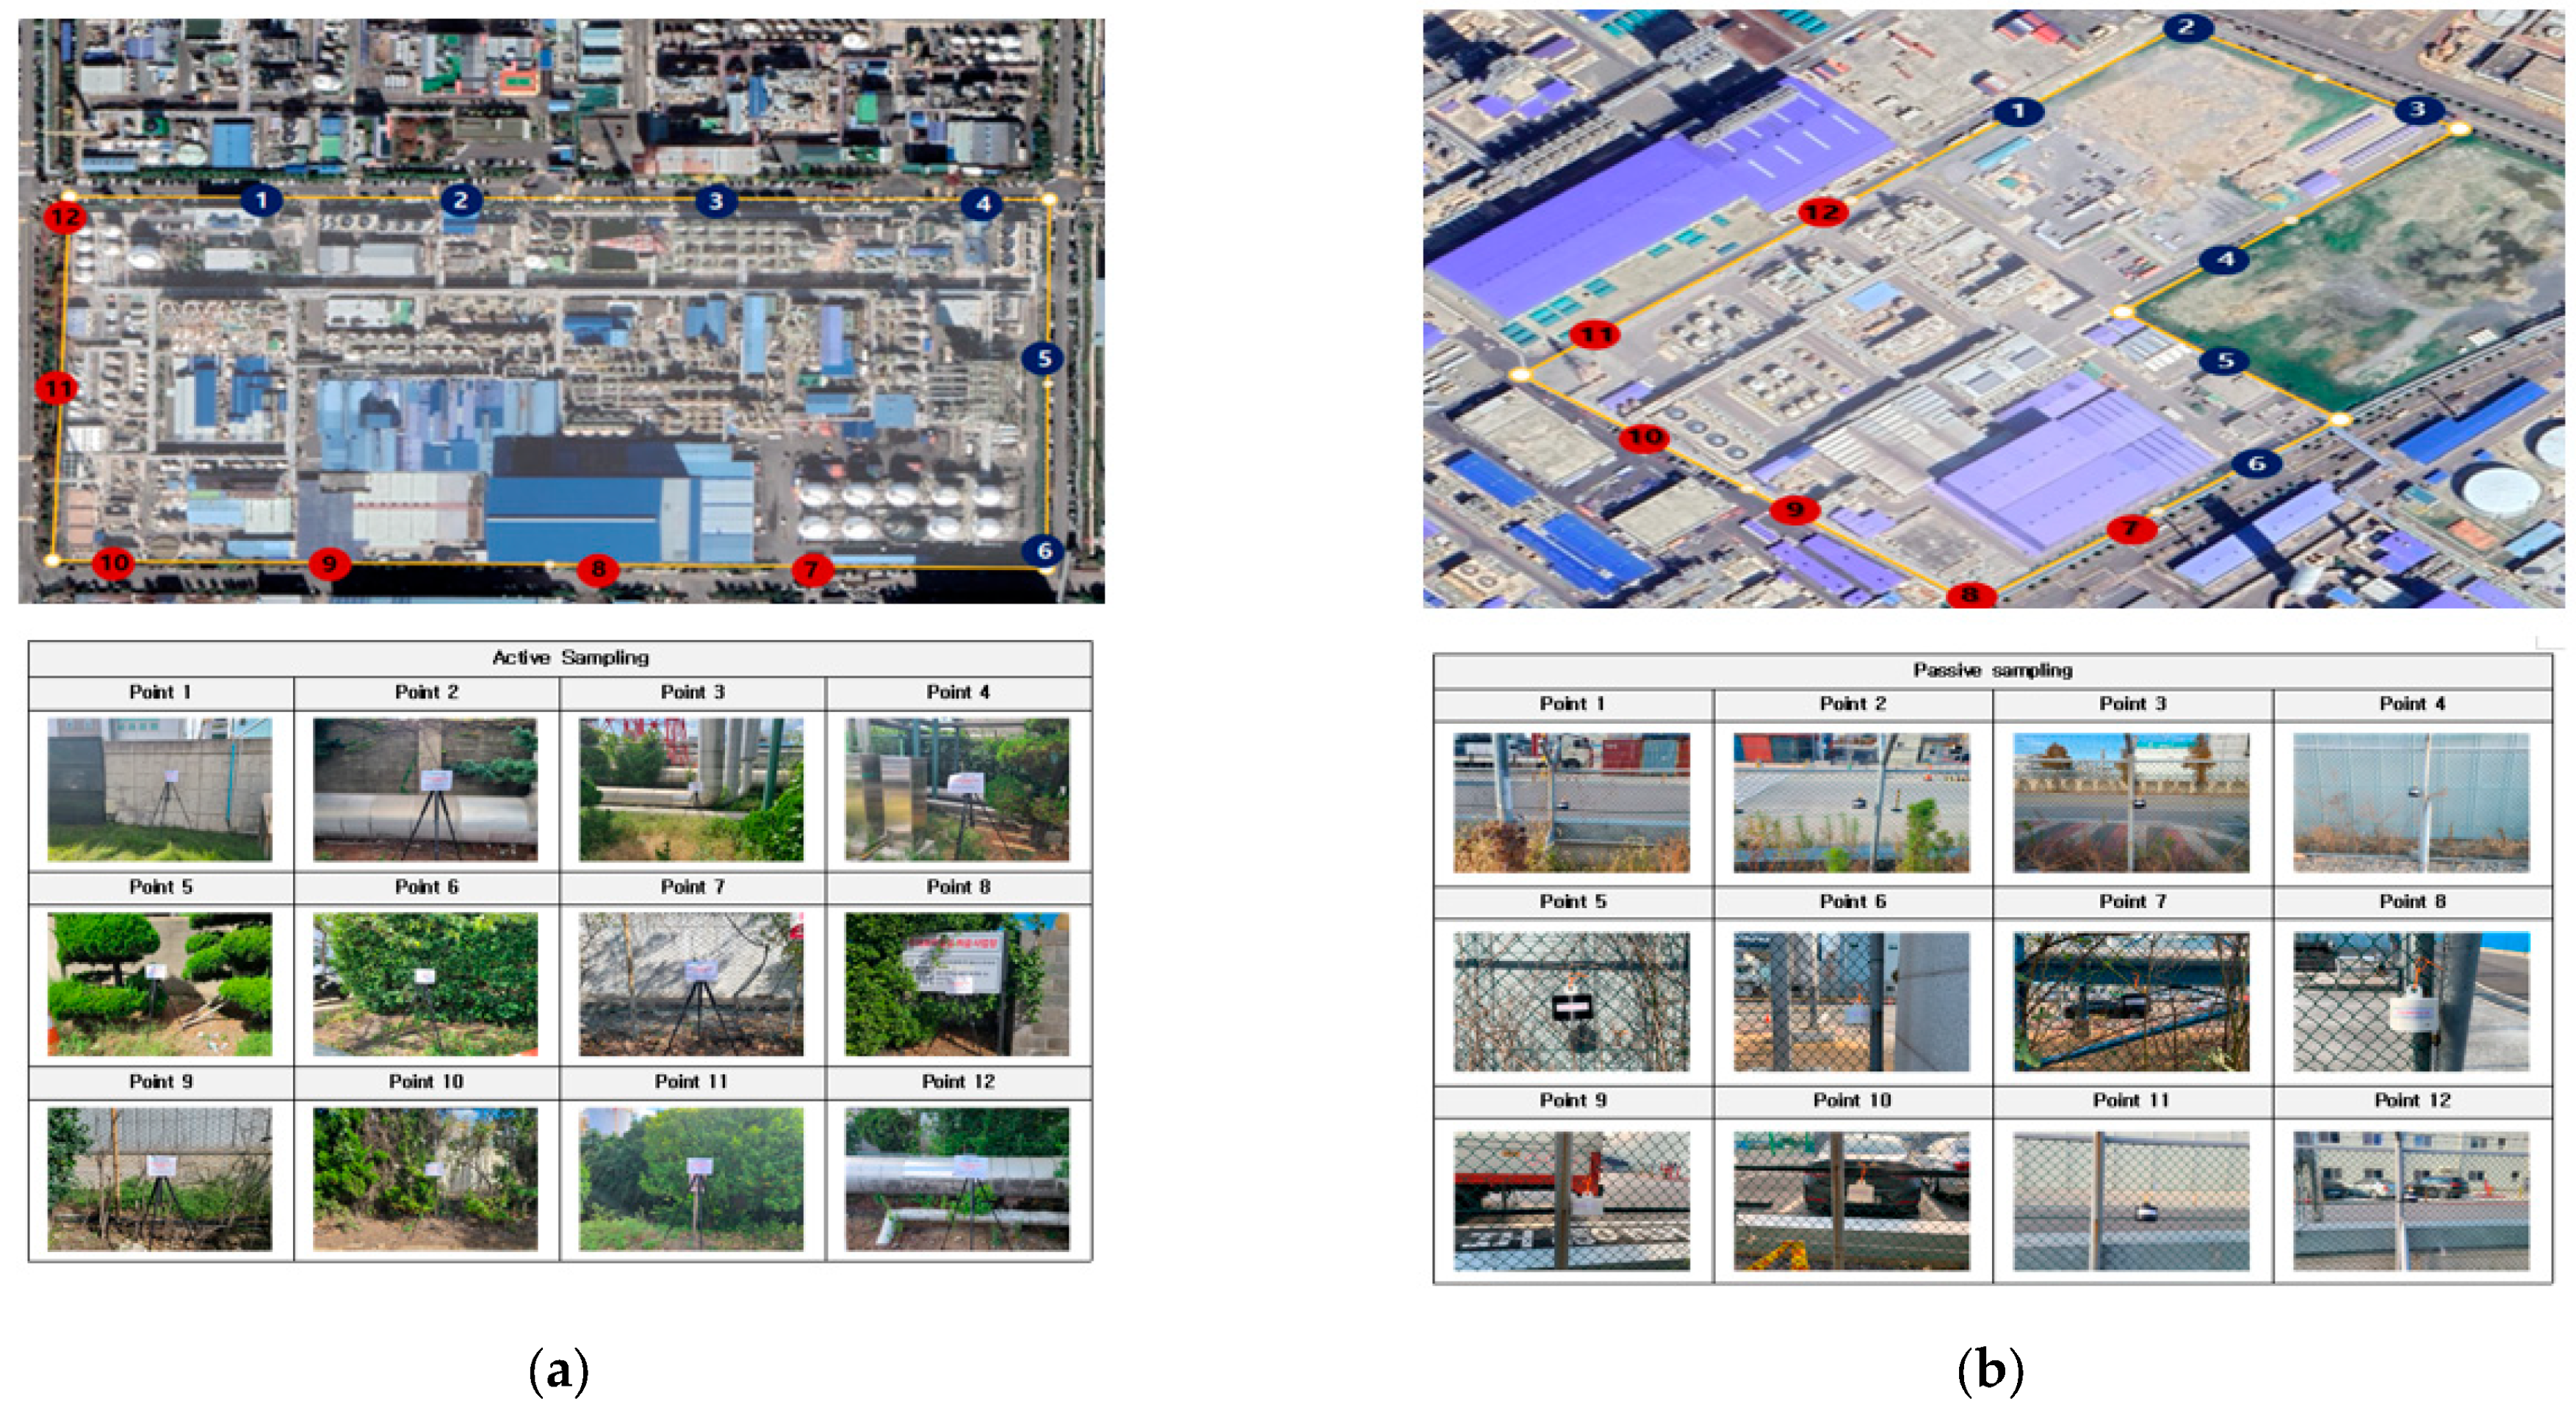
3.1. Overview of Measurement Locations and Results for the Research Targets

In this research, both the Active method and a 14-day Passive method, as prescribed by the U.S. EPA’s Fenceline monitoring guidelines, were employed. For certain VOCs, concentration conversion can be performed using specific diffusion coefficients in the Passive method. Key findings from the research include the detection of the target substance benzene, the comparison of possible VOC emissions from neighboring processes at each site against actual emission results (Active and Passive), and the comparison of concentration results obtained through the two methods. Each research target facility, A and B, had 12 measurement locations (Figure 2).
Upon reviewing the average VOC emission ratios at 12 locations in Target Research Facility A, Active sampling demonstrated that n-butane and n-Pentane were prevalent at 13.5% and 12.8% respectively. Meanwhile, Passive sampling revealed the prominence of Styrene and Toluene at 9.4% and 8.1%, respectively.
Upon comparing the concentration-convertible VOCs between the Active and Passive methods, six common compounds were found: Benzene, Toluene, Ethylbenzene, m,p-Xylene, Styrene, and o-Xylene.
The average concentration at each location was as follows: Benzene presented 2.5 µg/m³ in Active sampling and 0.58 µg/m³ in Passive sampling, Toluene showed 3.33 µg/m³ in Active sampling and 2.67 µg/m³ in Passive sampling, Ethylbenzene was at 2.23 µg/m³ in Active sampling and 2.02 µg/m³ in Passive sampling, m,p-Xylene indicated 3.24 µg/m³ in Active sampling and 2.35 µg/m³ in Passive sampling, Styrene displayed 3.37 µg/m³ in Active sampling and 3.23 µg/m³ in Passive sampling, and o-Xylene yielded 2.33 µg/m³ in Active sampling and 2.27 µg/m³ in Passive sampling.
These six compounds exhibited comparable concentration values across all areas of the facility for both Active and Passive methods. Moreover, Benzene was detected, although none of the results from either the Active or Passive methods surpassed the Action level of 9 µg/m³ [19].
In Target Research Facility B, the average VOC emission ratios across 12 locations revealed n-hexane and Methylcyclopentane to be at 45.0% and 14.4%, respectively, in Active sampling. Conversely, Passive sampling results showed n-hexane at 37.7% and Isopentane at 8.8%.
Comparing the concentration-convertible VOCs between Active and Passive methods, the same six compounds (Benzene, Toluene, Ethylbenzene, m,p-Xylene, Styrene, and o-Xylene) were identified as common to both.
The average concentration levels per site were as follows: For benzene, the active sampling showed 1.25 µg/m³ and passive sampling exhibited 1.48 µg/m³. Toluene demonstrated 2.02 µg/m³ in active sampling and 4.54 µg/m³ in passive sampling. Ethylbenzene recorded 1.12 µg/m³ in active sampling and 1.39 µg/m³ in passive sampling. M,p-Xylene displayed 0.67 µg/m³ in active sampling and 2.54 µg/m³ in passive sampling. Styrene presented 1.46 µg/m³ in active sampling and 1.77 µg/m³ in passive sampling, while o-Xylene indicated 0.42 µg/m³ in active sampling and 0.75 µg/m³ in passive sampling.
Out of the six common compounds, excluding toluene and m,p-xylene, the remaining four compounds showed comparable concentration levels throughout all locations within the facility, under both active and passive sampling methods. Toluene and m,p-xylene revealed results two to three times higher in passive sampling, which was found to be due to a higher production volume during the two-week period of passive sampling compared to the day of active sampling.
Furthermore, benzene was detected; however, no results from either active or passive sampling exceeded the action level of 9 µg/m³. It was anticipated that this facility, which manufactures synthetic rubber using ethylene and propylene as feedstocks, would have emissions of these compounds. However, no emissions were detected due to the business importing gas from external sources via pipelines and implementing double-sealed management systems, instead of storing it in outdoor tanks.

3.2. Evaluation of the Correspondence between Measurement Results per Site and Nearby Processes

The target research facility A is a synthetic rubber manufacturer. It uses butadiene and styrene, derived from mixed C4, as base materials to produce SBR rubber, NBR rubber, and SB-Latex. Each product is utilized appropriately, such as raw materials for tires or shoes, or for manufacturing medical gloves. The production distribution is 30% SBR rubber, 40% NBR rubber, and 30% SB-Latex, positioning it as a comprehensive synthetic rubber facility. The anticipated emissions for each processing site are described below. Areas marked ‘Not Applicable’ were considered to have no impact due to their distance from the Fenceline and their central location within the plant (Table 6).
In general, similar compounds were expected at each site. However, 11 of the 17 compounds detected at the research target site A were not handled by the site (Table 7). Given the site’s location, which is inevitably influenced by nearby areas, continuous measurement and tracking of emission sources are required.
Notably, at the research target site A, benzene was detected at levels of 1~3 µg/m³ across all points, despite not being handled at the site. This finding suggests possible influences from benzene diffused from nearby petroleum product manufacturing facilities.
Research target facility B is a leading manufacturer of EPDM (ethylene propylene diene monomer) in Korea. The facility processes ethylene and propylene to produce EPDM rubber, which due to its resistance to acids and alkalis, is used in items like gaskets for process piping. The rubber’s exceptional ability to prevent leaks also makes it suitable for applications in packing and sealing. The various processes at the facility and their associated emissions are detailed in Table 8 [20].
While passive techniques could not provide the uptake rate needed to calculate the concentration of n-hexane, using the Active method showed an average concentration of 40.9 µg/m³, indicating high levels. Specifically, the concentration at point 10 reached about 100 µg/m³, accounting for 50% of NIOSH’s (National Institute for Occupational Safety and Health) recommended exposure limit (REL) for a 10-h time-weighted average (TWA) of 180 µg/m³ [21]. However, it is only 1/10th of the permissible exposure limit (PEL) set by the Occupational Safety and Health Administration (OSHA) for an 8-h TWA, which is 1800 µg/m³ [22]. OSHA’s PEL is a legal standard that must be maintained in workplaces to protect workers. Comparatively, the average concentration of n-hexane at point 12, while relatively low at 40.9 µg/m³ against the PEL (1800 µg/m³), does pose some influence when considering the REL (180 µg/m³).
In addition to these, toluene and benzene were also detected, albeit at lower concentrations, 1~6 µg/m³ and 0~2 µg/m³, respectively. Moreover, compounds that aren’t handled at the facility, like styrene and ethylbenzene, were detected at levels of 0~2 µg/m³. These could potentially be attributed to the influence of nearby businesses, given the facility’s location within an industrial complex surrounded by large-scale petroleum refining and chemical manufacturing companies.

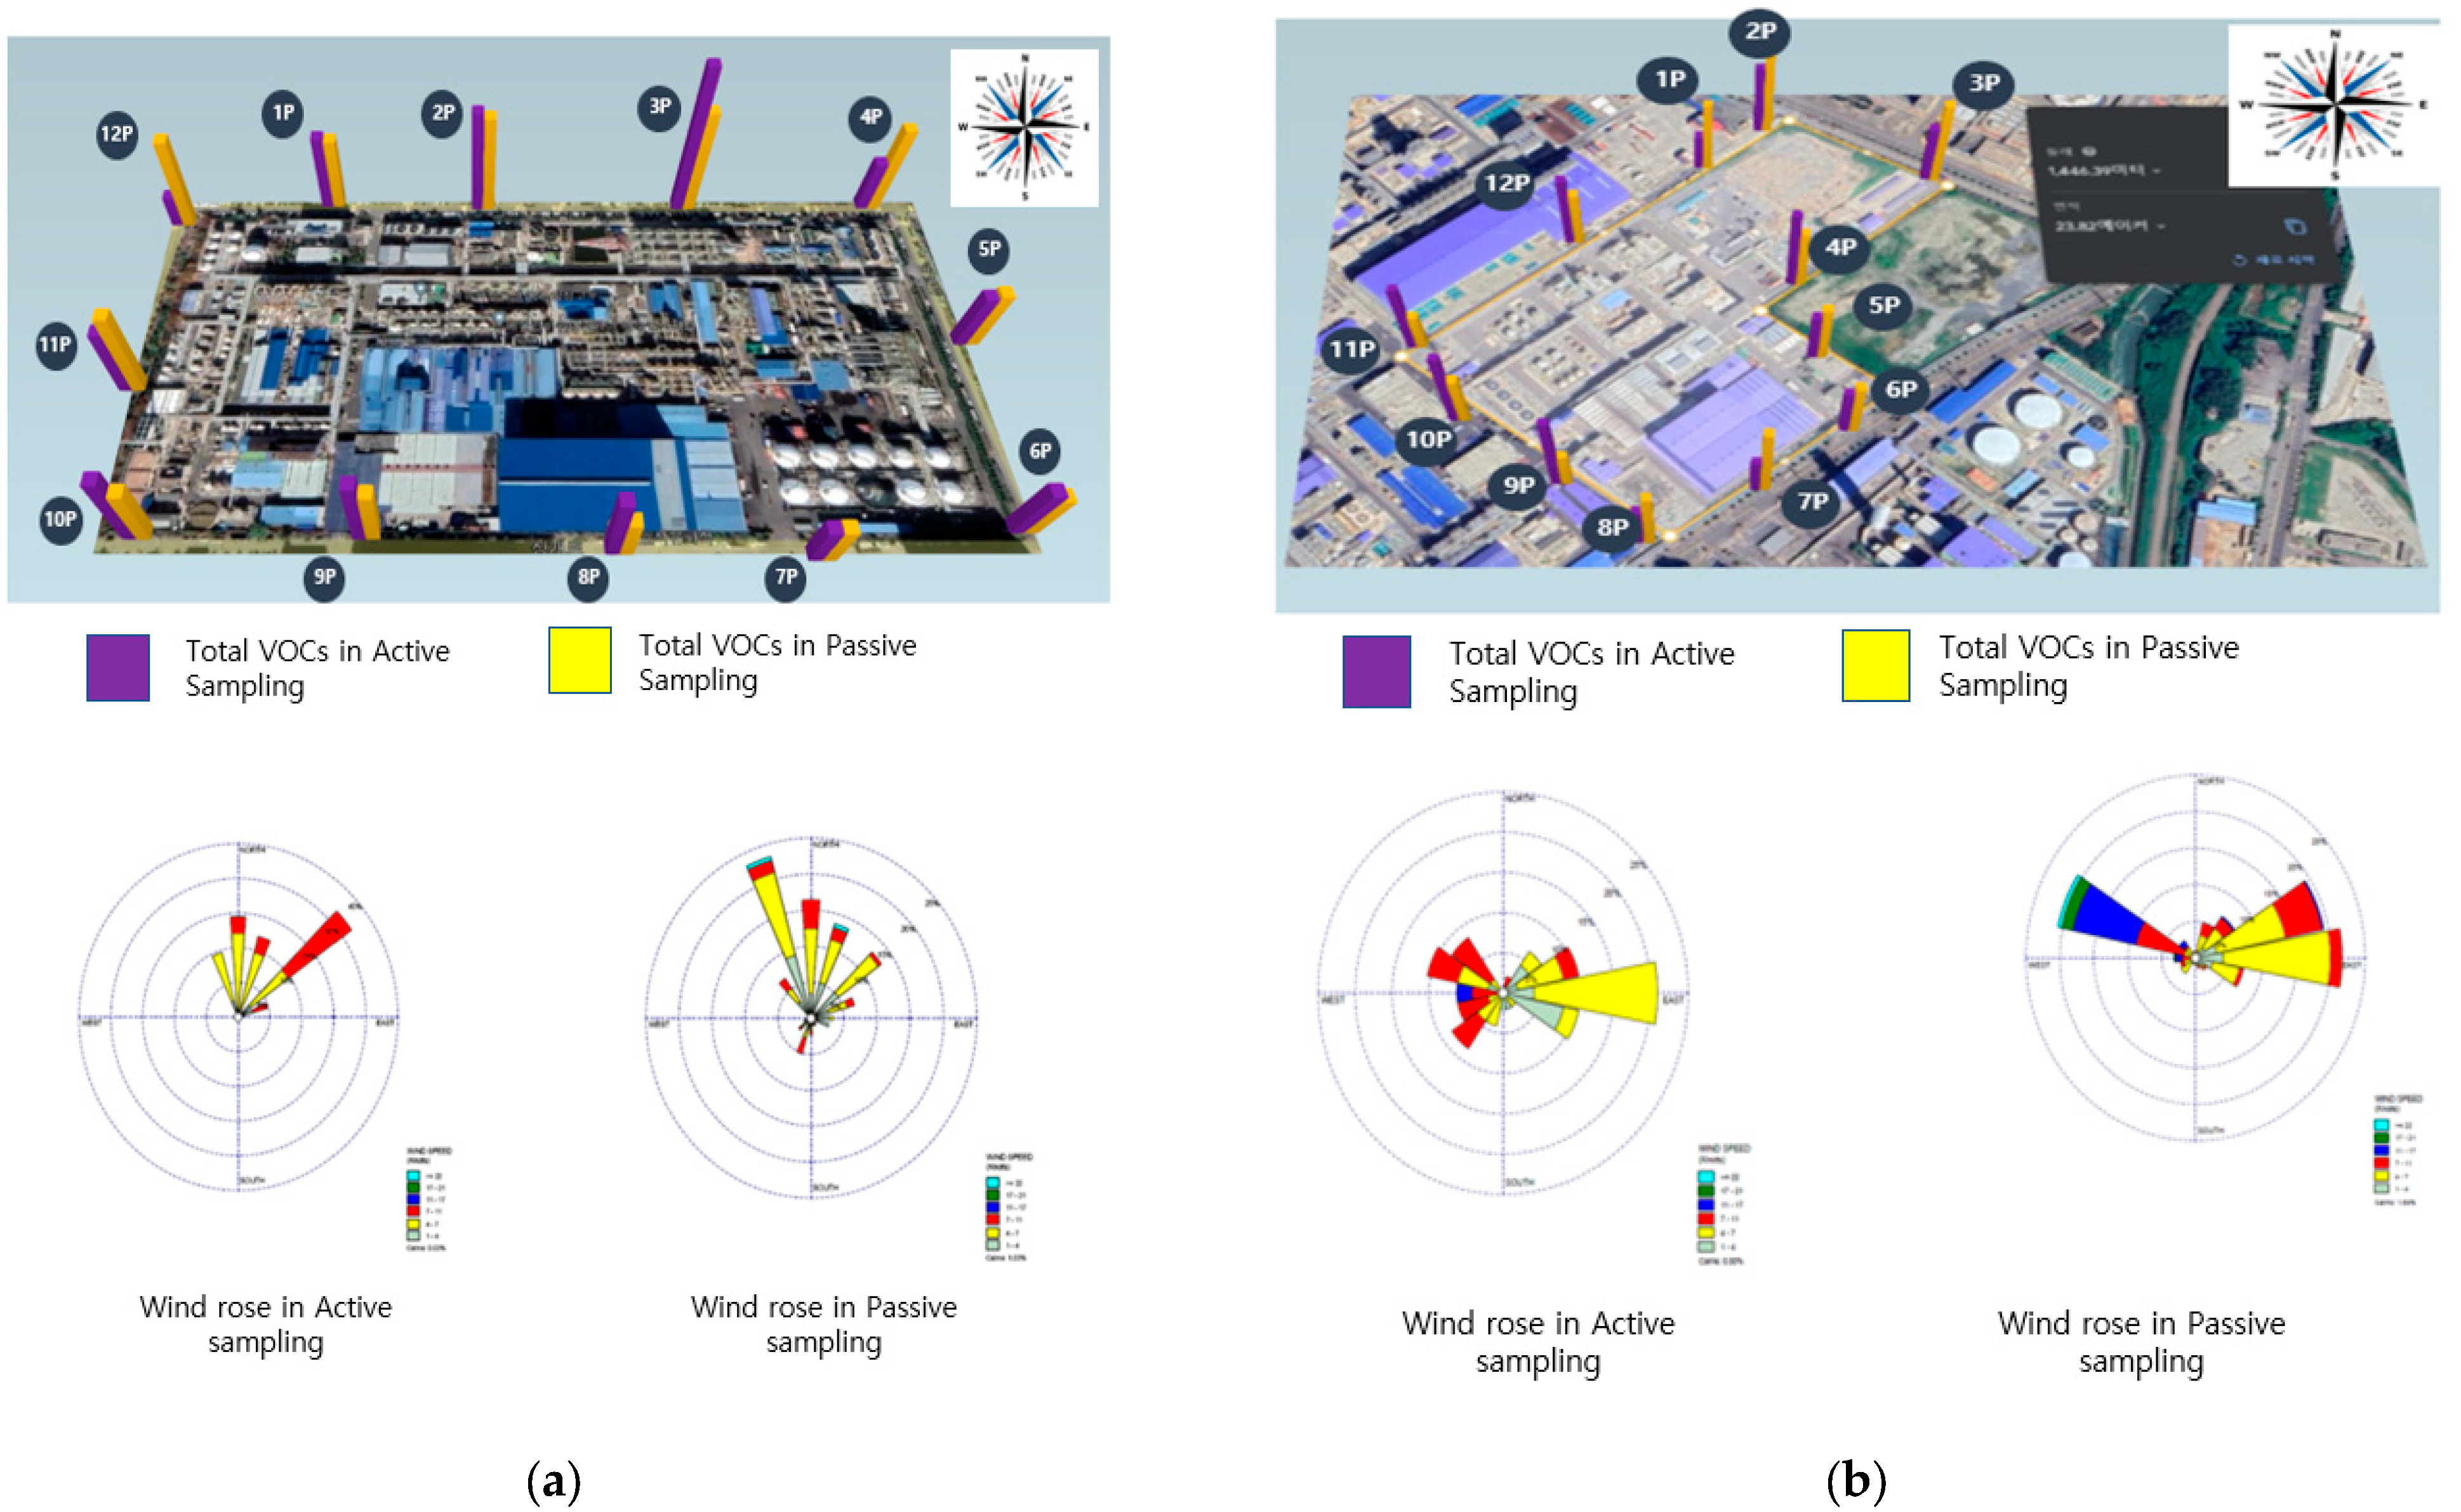
3.3. Analysis of Meteorological Impact

The impact of wind on VOCs cannot be overlooked. In the case of Research Facility A, an examination of the wind rose during active measurements reveals a prevailing northeast wind. As a result, compounds such as 1,3-butadiene originating from areas 12 or 1 appear to have influenced the downstream regions, notably points 11 and 10. In contrast, the passive results detected toluene at 13%, styrene at 13%, and xylene at 10%. The detection of toluene, utilized as a solvent, and styrene, used as a raw material, is evident. In the case of Research Facility B, the main wind direction during both active and passive measurements was from the east. Hence, VOCs released near point 12 were relatively higher at the leftward points, namely 11, 10, and 9. This suggests these locations are more significantly influenced by weather conditions than by nearby operations (Figure 3).

3.4. Analysis of High POCP VOC Emission Proportions from Research Facilities

VOCs are regulated as photochemical pollutants due to their role as catalysts in photochemical reactions that lead to ozone formation. Accordingly, this study selected the top ten compounds with high Photochemical Ozone Creation Potential (POCP) values, as reported by the EU, among the numerous VOCs emitted from synthetic rubber production [23].
The study adopted both active and passive measurement techniques. While the active method accommodates concentration applicability for all compounds, the passive method allows only m/p-xylene, ethylbenzene, and toluene to be converted into concentrations. Using these two techniques, a comparison of the emission ratio of concentration values at the two research facilities can be made (Table 9).

4. Discussion

This study aimed to analyze 88 types of VOCs, inclusive of benzene, at the periphery of synthetic rubber manufacturing facilities, following the guidelines of U.S. Fenceline monitoring, to discern the VOCs extensively emitted by various industries.
Emission sources were categorized for each research facility, and potential emission compounds were identified per process. The compounds targeted for analysis included 57 types of ozone precursor VOCs and 31 types of Hazardous Air Pollutants (HAPs). The employed measurement methodologies were the passive and active techniques. The passive method spanned 14 days of measurement, and the active method comprised five measurements daily. A total of 288 points were measured and analyzed: 240 points from five active measurements and 48 points from one passive measurement, across two research facilities.
The measurement outcomes largely detected compounds handled in synthetic rubber production. For Facility A, significant emissions of raw materials such as 1,3-butadiene and acrylonitrile were observed. However, 11 out of the 17 detected compounds were not handled at the facility, suggesting an influence from nearby facilities. Comparisons with the wind rose indicated unexpectedly high concentrations at locations such as wastewater treatment plants. This suggests the diffusion of VOCs from production sites to wastewater treatment plants due to wind direction. Should national VOC reduction regulations be introduced, disputes could potentially arise among facilities within an industrial complex. To preempt this, the EPA recommends determining the basic atmospheric concentration through continuous annual measurements. Furthermore, they suggest measuring a control group in a pristine area to allow for corresponding value deductions from each facility’s emissions.
In the context of Facility B, significant usage of ethylene and propylene was noted; however, these were not detected in the analyses. This absence could potentially be attributed to robust leakage prevention measures such as double sealing given the compounds are supplied via external piping. Alternatively, the non-detection during the analysis could be due to the small molecular weights of ethylene and propylene. For the identification or mitigation of such VOCs, alternative analytical methods may be required [24]. However, n-hexane, a prevalent solvent used in Facility B, was detected in substantial quantities.
Generally, the concentration levels derived from both active and passive methods displayed analogous results across all sampling locations. Nonetheless, the passive method permits concentration conversion for only a limited 18 compounds, which include benzene, toluene, and styrene. This presents a limitation in the inability to convert the concentration of large quantities of detected n-hexane [25].
Within the synthetic rubber manufacturing industry, VOCs like n-hexane, which exhibit high Photochemical Ozone Creation Potential (POCP) values, could potentially trigger secondary air pollution. Although the POCP value of n-hexane at 65 is lower than that of xylene (109) or ethylbenzene (81), its extensive usage within the synthetic rubber industry necessitates special attention.
This study revealed that various industries generate a diverse array of VOCs. The VOCs present in the atmosphere can not only impact the premises from which they originate but also possess a broad diffusion range that potentially affects surrounding facilities. This discovery underscores the need for cooperative efforts at the regional and industrial park scale, beyond the isolated monitoring and measuring of VOCs in individual facilities.
The results suggest a compelling need for ongoing monitoring and regulatory measures concerning the concentration levels of an array of chemical compounds beyond benzene. Specifically, in the United States, facilities are independently selecting and undertaking the management of chemical compounds that (1) pose heightened risks to humans, (2) have considerable potential for atmospheric contamination, and (3) exhibit high persistency and residual presence in the atmosphere. Through the findings of this research, we propose the necessity of prioritizing the management and reduction of VOCs in facilities with a high likelihood of substantial VOC emissions, utilizing the Fenceline monitoring technique.

5. Conclusions

This research was undertaken to trace the VOCs generated by the synthetic rubber manufacturing sector, assess their influence on neighboring businesses, and evaluate VOCs with elevated Photochemical Ozone Creation Potential (POCP). The findings from this research pave the way to identify priority VOCs that necessitate a reduction in the synthetic rubber manufacturing industry.
Upon evaluating the emission data in Facility A, we discovered that the active sampling technique identified n-butane constituting 13.5% and n-Pentane constituting 12.8%, whereas the passive sampling method detected Styrene at 9.4% and Toluene at 8.1%.
However, an interesting observation was that 11 out of the 17 compounds detected at Facility A were not handled within the plant’s premises. Given this facility’s location and its vulnerability to external influences, continuous monitoring and emission source tracing are deemed imperative. Particularly in the case of businesses located within petrochemical complexes, the close proximity of enterprises, often within a mere 20–30 m distance, calls for stringent monitoring. The EPA, in response to such challenges, mandates the establishment of additional tracing points when benzene’s action level is exceeded, along with the requirement of submitting a corresponding rationale [24]. Interestingly, despite Facility A not engaging in any operations involving benzene, it was detected at levels of 1–3 µg/m³ at all tested points. However, it did not surpass the action level of 9 µg/m³, thereby suggesting potential influences of benzene diffusion from proximate petroleum product manufacturers.
Upon comparing the results obtained from active and passive sampling techniques, we discovered that convertible compounds into concentrations included benzene, toluene, ethylbenzene, xylene, and styrene. The detected concentrations fell within the 0–3 µg/m³ range, with the mean concentrations showing similarity across both methodologies.
Results from the active sampling methodology at Facility B showed n-hexane comprising 45.0% of detected compounds, followed by Methylcyclopentane at 14.4%. Similarly, passive sampling results revealed n-hexane at 37.7% and Isopentane at 8.8%. Ethylene and propylene were not detected, likely due to their delivery through double-sealed exterior pipes. In contrast, significant quantities of n-hexane, used as a solvent, were detected. Across all testing locations, points 9, 10, and 11 showed high concentrations, particularly at point 12, corresponding to the production area. In contrast, points 1, 2, and 3 indicated lower concentrations, possibly influenced by the prevalent easterly wind direction. Though benzene was detected, its levels were below the action threshold at all points. As Facility B does not handle benzene directly, this detection might have been influenced by neighboring petroleum refining operations. With regard to n-hexane, the U.S. National Institute for Occupational Safety and Health (NIOSH) and Occupational Safety and Health Administration (OSHA) recommend exposure limits (REL) and permissible exposure limits (PEL) for workers at 180 µg/m³ and 1800 µg/m³, respectively. The latter is legally enforceable. The average n-hexane concentration at the premises’ boundary was measured at 40.93 µg/m³, with momentary peaks nearing 100 µg/m³. Given that this exceeds 50% of the recommended exposure limit, continual monitoring and evaluation are warranted.

Author Contributions

Conceptualization, H.E.L. and J.H.K.; formal analysis, H.E.L.; investigation, J.H.K.; data curation, B.-W.L.; writing—original draft preparation, H.E.L.; writing—review and editing, J.H.K.; supervision, B.-W.L. All authors have read and agreed to the published version of the manuscript.

Funding

This research received no external funding.

Institutional Review Board Statement

Not applicable.

Informed Consent Statement

Not applicable.

Data Availability Statement

The data presented in this study are available on request from the corresponding author. The data are not publicly available due to the policy of the Ministry of Environment in Korea.

Acknowledgments

This research was supported by a grant from the National Institute of 404 Environment Research (NIER), funded by the Ministry of Environment (MOE) of the Republic of 405 Korea (NIER-2023-01-01-109).

Conflicts of Interest

The authors declare no conflict of interest.

References

  1. Atkinson, R. Atmospheric chemistry of VOCs and NOx. Atmos. Environ. 2000, 34, 2063–2101. [Google Scholar] [CrossRef]
  2. Ruddy, E.N.; Carroll, L.A. Select the best VOC control strategy. Chem. Eng. Prog. 1993, 89, 7. [Google Scholar]
  3. Miller, S.L.; Anderson, M.J.; Daly, E.P.; Milford, J.B. Source apportionment of exposures to volatile organic compounds. I. Evaluation of receptor models using simulated exposure data. Atmos. Environ. 2022, 36, 3629–3641. [Google Scholar] [CrossRef]
  4. Schmalensee, R.; Stavins, R.N. Policy Evolution under the Clean Air Act. J. Econ. Perspect. 2019, 33, 27–50. [Google Scholar] [CrossRef] [Green Version]
  5. Liebscher, H. Economic solutions for compliance to the new European VOC Directive. Prog. Org. Coat. 2000, 40, 75–83. [Google Scholar] [CrossRef]
  6. Tan, Z.; Lu, K.; Dong, H.; Hu, M.; Li, X.; Liu, Y.; Lu, S.; Shao, M.; Su, R.; Wang, H.; et al. Explicit diagnosis of the local ozone production rate and the ozone-NOx-VOC sensitivities. Sci. Bull. 2018, 63, 1067–1076. [Google Scholar] [CrossRef] [PubMed] [Green Version]
  7. Juráň, S.; Grace, J.; Urban, O. Temporal changes in ozone concentrations and their impact on vegetation. Atmosphere 2021, 12, 82. [Google Scholar] [CrossRef]
  8. Gao, Y.; Li, M.; Wan, X.; Zhao, X.; Wu, Y.; Liu, X.; Li, X. Important contributions of alkenes and aromatics to VOCs emissions, chemistry and secondary pollutants formation at an industrial site of central eastern China. Atmos. Environ. 2020, 244, 117927. [Google Scholar] [CrossRef]
  9. Kim, M.-G.; Kim, J.H.; Yoon, S.J.; Cho, S.H.; Yu, J.U.; Kang, C.W.; Moon, K.W.; Lee, H.E. Evaluating the feasibility of air environment management system for VOCs through ‘VOCs specification’of petroleum refining industry. J. Air Waste Manag. Assoc. 2023, 73, 362–373. [Google Scholar] [CrossRef] [PubMed]
  10. Kim, J.-H.; Lee, H.E.; Yoon, S.J. Study on the Speciation of VOCs at Oil Refining Plant Fenceline through Active Sampling. Atmosphere 2023, 14, 485. [Google Scholar] [CrossRef]
  11. Kim, M.-G.; Lee, J.Y.; Kim, J.H.; Lee, H.E.; Cho, S.W.; Yu, J.U.; Kang, C.W.; Moon, K.W. Study of Chemical Compounds Emitted during Paint Manufacturing through VOC Speciation. Atmosphere 2022, 13, 1245. [Google Scholar] [CrossRef]
  12. Matanoski, G.; Elliott, E.; Tao, X.; Francis, M. A Correa-Villasenor, C Santos-Burgoa. Lymphohematopoietic cancers and butadiene and styrene exposure in synthetic rubber manufacture. Ann. N. Y. Acad. Sci. 1998, 837, 157–169. [Google Scholar] [CrossRef] [PubMed]
  13. Poh, G.K.X.; Chew, I.M.L.; Tan, J. Life Cycle Optimization for Synthetic Rubber Glove Manufacturing. Chem. Eng. Technol. 2019, 42, 1771–1779. [Google Scholar] [CrossRef]
  14. Thoma, E.D.; Miller, M.C.; Chung, K.C.; Parsons, N.L.; Shine, B.C. Facility fence-line monitoring using passive samplers. J. Air Waste Manag. Assoc. 2011, 61, 834–842. [Google Scholar] [CrossRef] [PubMed]
  15. Eisele, A.P.; Mukerjee, A.; Smith, L.A.; Thoma, E.D.; Whitaker, D.A.; Oliver, K.D.; Wu, T.; Colon, M.; Alston, L.; Cousett, T.A.; et al. Volatile organic compounds at two oil and natural gas production well pads in Colorado and Texas using passive samplers. J. Air Waste Manag. Assoc. 2016, 66, 412–419. [Google Scholar] [CrossRef] [PubMed]
  16. Envera Consulting Homepage. Available online: https://enveraconsulting.com/petroleum-refinery-fenceline-monitoring/ (accessed on 27 June 2023).
  17. Chung, M.Y.; Beene, M.; Ashkan, S.; Krauter, C.; Hasson, A.S. Evaluation of non-enteric sources of non-methane volatile organic compound (NMVOC) emissions from dairies. Atmos. Environ. 2010, 44, 786–794. [Google Scholar] [CrossRef]
  18. Lubes, G.; Goodarzi, M. GC–MS based metabolomics used for the identification of cancer volatile organic compounds as biomarkers. J. Pharm. Biomed. Anal. 2018, 147, 313–322. [Google Scholar] [CrossRef] [PubMed]
  19. Daves, G. Refinery fence-line monitoring to impact petrochemical operators. Oil Gas J. 2017, 115, 68–73. [Google Scholar]
  20. Karpeles, R.; Grossi, A.V. EPDM Rubber technology. In Handbook of Elastomers; CRC Press: Boca Raton, FL, USA, 2000; pp. 863–894. [Google Scholar]
  21. Bollinger, N.J. NIOSH Respirator Selection Logic; NIOSH Publication Dissemination: Cincinati, OH, USA, 2004; pp. 1–39. [Google Scholar]
  22. Szymendera, S. Respirable Crystalline Silica in the Workplace: New Occupational Safety and Health Administration (OSHA) Standards; Congressional Research Service: Washington, DC, USA, 2017. [Google Scholar]
  23. Andersson-Sköld, Y.; Holmberg, L. Photochemical ozone creation potentials (POCP) and replacement of solvents in Europe. Atmos. Environ. 2000, 34, 3159–3169. [Google Scholar] [CrossRef]
  24. Agarwal, M.; Balachandran, M.D.; Shrestha, S.; Varahramyan, K. SnO2 Nanoparticle-Based Passive Capacitive Sensor for Ethylene Detection. J. Nanomater. 2012, 2012, 5. [Google Scholar] [CrossRef] [Green Version]
  25. Larsen, M. Evaluation of Passive Samplers for the Monitoring of Contaminants in Sediment and Water: Monitoring of POPs and PCBs in International Monitoring Programmes; Nordic Council of Ministers: Copenhagen, Denmark, 2009. [Google Scholar]
Figure 1. VOCs Sampling Method (a) Active sampling, (b) Passive sampling.
Atmosphere 14 01119 g001
Figure 2. Measurement Sites: (a) Target Research Facility A and Active Sampling (b) Target Research Facility B and Passive Sampling.
Atmosphere 14 01119 g002
Figure 3. Wind Impact on Each Research Facility (a) Research Facility A and Wind Rose on the Measurement Date, (b) Research Facility B and Wind Rose on the Measurement Date.
Atmosphere 14 01119 g003
Table 1. Principal Types of Synthetic Rubber.
No.Name
1Styrene-Butadiene Rubber (SBR)
2Acrylonitrile-Butadiene Rubber (NBR)
3Ethylene-Propylene-Diene Monomer (EPDM)
4Isobutylene-Isoprene Copolymer (IIR)
5Polybutadiene (BR)
6Polychloroprene (CR)
7Polyisoprene (IR)
Table 2. Representative VOCs Emitted Across Different Stages of Synthetic Rubber Production.
ProcessEmitted Compounds
Storage and MixingButadiene, Styrene, Aliphatic Hydrocarbons (C4~C8)
PolymerizationDiethylaluminium Chloride, Aliphatic Hydrocarbons (C4~C8), Freon, Ammonia
Adhesive Formulation and MixingMethanol
Coagulation and StrippingAliphatic Hydrocarbons (C4~C8), Styrene, Butadiene
Drying and PackagingAliphatic Hydrocarbons (C4~C8), Elastomeric Rubber Dust, Clay or Ferrite Dust
Table 3. The Six Fenceline Monitoring Techniques Proposed by the EPA [16].
Monitoring TechniqueDescriptionAdvantages & Disadvantages
Passive Diffusive Tube Monitoring Network
  • A direct measurement method by adsorbing the target pollutant onto a tube monitor
  • (Advantages) Optimal for low setup and maintenance costs.
  • (Disadvantages) Potential for sample contamination and low time resolution during sample transport.
Active Monitoring Station Networks
  • Similar to Passive Diffusion Tube, but utilizes a pump for air intake, a direct measurement method
  • (Advantages) Improved time resolution due to rapid collection via pump usage.
  • (Disadvantages) Can be used in various environments but incurs high costs.
Ultraviolet Differential Optical Absorption Spectroscopy (UV-DOAS)
  • Open-path condensation technique that uses a continuous beam of light for detecting pollutants in an open path
  • (Advantages) Low detection threshold allows for real-time data.
  • (Disadvantages) Susceptible to interference from visible emissions such as dust or smoke.
Open-Path Fourier Transform Infrared Spectroscopy (OP-FTIR)
  • Similar to UV-DOAS, but uses infrared (interfering with carbon monoxide (CO), carbon dioxide (CO2), and water vapor) instead of UV
  • (Advantages) Simultaneous monitoring of all compounds of interest.
  • (Disadvantages) High detection threshold for benzene, making it less suitable for monitoring this substance.
Differential Absorption Lidar Monitoring (DIAL)
  • Uses two wavelengths of light pulsed across a path, one strongly and one weakly absorbed by the target pollutant
  • (Advantages) Useful for specific short-term studies and for measuring emissions from petroleum refineries and other petrochemical compounds.
  • (Disadvantages) Requires highly skilled personnel.
Solar Occultation Flux (SOF) Monitoring
  • An open-path technique using the sun as a light source and UV or FTIR detectors
  • (Advantages) Provides superior spatial resolution compared to other open-path methods and is more cost-effective than DIAL systems.
  • (Disadvantages) Weather-sensitive due to the use of the sun as a light source.
Table 4. PAMS-57 1 Component.
No.Substance NameCAS No.No.Substance NameCAS No.
1Ethylene74-85-1303-Methylhexane589-34-4
2Acetylene74-86-2312,2,4-Trimethylpentane50-84-1
3Ethane74-84-032n-Heptane142-82-5
4Propylene115-07-133Methylcyclohexane108-87-2
5Propane74-98-6342,3,4-Trimethylpentane565-75-3
6Isobutane75-28-535Toluene108-88-3
71-butene106-98-9362-Methylheptane592-27-8
8n-butane106-97-8373-Methylheptane589-81-1
9trans-2-Butene624-64-638n-Octane111-65-9
10cis-2-Butene590-18-139Ethylbenzene100-41-4
11Isopentnae78-78-440m-Xylene108-38-3
121-Pentene109-67-141p-Xylene106-42-3
13n-Pentane109-66-042Styrene100-42-5
14Isoprene78-79-5043o-Xylene95-47-6
15trans-2-Pentene646-04-844n-Nonane111-84-2
16cis-2-Pentene627-20-345Isopropylbenzene98-82-8
172,2-Dimethylbutane75-83-246n-Propylbenzene103-65-1
18Cyclopentane287-92-347m-Ethyltoluene620-14-4
192,3-Dimethylbutane79-29-848p-Ethyltoluene622-96-8
202-Methylpentane107-83-5491,3,5-Trimethylbenzene108-67-8
213-Methylpentane96-14-050o-Ehtyltoluene611-14-3
221-hexene592-41-6511,2,4-Trimethylbenzene95-63-6
23n-hexane110-54-352n-Decane124-18-5
24Methylcyclopentane96-37-7531,2,3-Trimethylbenzene526-73-8
252,4-Dimethylpentane108-08-754m-Diehtylbenzene141-93-5
26Benzene71-43-255p-Diehtylbenzene105-05-5
27Cyclohexane110-82-756n-Undecane1120-21-4
282-Methylhexane591-76-457n-Dodecane112-40-3
292,3-Dimethylpentane565-59-3---
1 These are 57 types of ozone precursor compounds selected by Photochemical Assessment Monitoring Stations. (PAMs).
Table 5. TO-14A 1 43 Components (excluding duplicated compounds from PMS 57 types).
No.Compounds NameCAS No.No.Compounds NameCAS No.
1Dichlorodifluoromethane75-71-812cis-1,2-Dichloroethylene156-59-2
2Chloromethane74-87-313Chloroform67-66-3
3Vinyl chloride75-01-4141,2-Dichloroethane107-06-2
41,3-Butadiene106-99-0151,1,1-Trichloroethane71-55-6
5Bromomethane74-83-916Carbon tetrachloride56-23-5
6Chloroethane75-00-3171,2-Dichloropropane78-87-5
7Acrylonitrile107-13-118Trichloroethylene79-01-6
81,1-Dichloroethene75-35-419cis-1,3-Dichloropropene10061-01-5
9Methylene chloride75-09-220trans-1,3-Dichloropropene10061-02-6
103-Chloropropene107-05-1211,1,2-Trichloroethane79-00-5
111,1-Dichloroethane75-34-3221,2-Dibromoethane106-93-4
1 Method TO-14 provides procedures for the sampling, detection, and quantitative measurement of Volatile Organic compounds (VOCs) in ambient air. TO-14 is one of the EPA’s, Compendium of Methods for the Determination of Toxic Organic Compounds in ambient air.
Table 6. Anticipated Emission Compounds by Process and Measurement Site at Target Research Facility A.
Process NamesProcess SummaryEmissions or Hazardous FactorsMeasurement Points
Polymerization ProcessThis involves the low-temperature polymerization of monomers like butadiene and styrene. The conversion rate is approximately 60% and the resulting product is referred to as latex.1,3-Butadiene, Styrene, etc.Point 9
Solvent Recovery ProcessThis procedure includes adding a polymer solution, water, and other additives before implementing steam stripping to recover unreacted monomers and solvents.Solvents and Styrene MonomersPoint 1
SB-Latex Manufacturing ProcessThis process aims to produce SB-Latex with high cross-linking density. It proceeds in the following order: purification → polymerization → solvent recovery → drying.Styrene, Butane, Butadiene, etc.Not Applicable
BDplant ProcessThis process generates 1,3-Butadiene from either n-butane or n-butene.
This process entails the retrieval of components such as Butadiene from unprocessed C4 streams. Following this, Acrylonitrile is combined with these components to produce NBR (Nitrile Butadiene Rubber).
n-butane, n-butene, 1,3-Butadiene, Acrylonitrile, etc.Points 5, 6, 7
Solidification Drying ProcessInvolves the removal of water and hydrocarbons from polymerized adhesive compounds consisting of butadiene and styrene. This is followed by using hot air for moisture elimination.Inorganic dust (Clay, Copper Stone) or Aliphatic HydrocarbonsNot Applicable
Cooling ProcessThis process cools down the final product.-Points 2, 4
Raw Material Storage Process (1,3-Butadiene)This process pertains to the storage of raw materials such as 1,3-Butadiene.1,3-ButadienePoints 1, 12
Raw Material Storage Process (Acrylonitrile)Involves storing raw materials like Acrylonitrile.AcrylonitrilePoint 11
Finished Product Storage ProcessStores final products like SBR and NBR rubber.No specific emissions from synthetic rubber (Potential odor emissions)Point 8
Wastewater Treatment FacilityProcess of treating wastewater.Odor, etc.Points 3, 4, 10
Table 7. Detected and Non-Handled Compounds at Research Target Site A.
Detected CompoundsCompounds Handled at Research Target Site ACompounds Not Handled at Research Target Site A
17 typesStyrene, 1-butane, Acrylonitrile, 1,3-Butadiene, n-butane, Toluene
6 types
Methylene chloride, iso-Hexane, Benzene, Chloroform, m,p-Xylene, o-Xylene, Ethylbenzene, n-Hexane, iso-Pentane, Cyclohexane, Xylene, n-Pentane
11 types
Table 8. Processes and Anticipated Emissions at Different Measurement Points at Research Target Facility B.
Process NameProcess OverviewEmissions or Hazardous FactorsMeasurement Points
PolymerizationThe process of polymerizing ethylene and propylene.Ethylene, Propylene, n-hexane, etc.Point 12
Catalyst RemovalThe process that involves adding a hot solution of sodium hydroxide to the reaction mixture to remove any residual catalysts.Sodium Hydroxide, etc.Point 12
Solvent and Monomer Recovery and PurificationThe process of separating and recovering unreacted monomers via a Flashing process.n-hexane, Dichloromethane, Acetonitrile, etc.Point 12
Shaping and InspectionThe process of molding rubber, checking for impurities, and shipping the product.Odor, etc.Point 12
n-hexane StorageThe process that involves storing n-hexane, which is used as a solvent.n-hexane ePoint 11
Ethylene Propylene External PipingThe section where raw materials, ethylene, and propylene are introduced through external piping.Ethylene, PropylenePoint 10
Product WarehouseA warehouse for storing the finished rubber products.-Points 7, 8, 1, 3
Wastewater Treatment The process for wastewater treatment.-Point 9
Flare Stack and UtilitiesProcesses associated with the flare stack, cooling tower, and other utilities at the facility.Various VOCs, including Benzene, Toluene, etc.Points 8, 10, 11
Construction and Parking AreaArea that includes construction site, parking lot, and offices.-Points 6, 5, 4, 2
Table 9. Analysis of Compounds with High POCP at Research Target Facilities A and B.
CategoryResearch Target Facility AResearch Target Facility B
RankSubstance NameCAS No.POCP ValueActive
(µg/m³)
Active Ratio (%)Passive
(µg/m³)
Passive Ratio (%)Active
(µg/m³)
Active Ratio (%)Passive
(µg/m³)
Passive Ratio (%)
11-butene106-98-91131.935.80Not Detected-2.024.17Unable to Convert7.26
2Propylene115-07-1108Not Detected-Not Detected-Not Detected-Not Detected-
3Ethylene74-85-1100Not Detected-Not Detected-Not Detected-Not Detected-
4m/p-Xylene108-38-3,
106-42-3
109/953.249.732.3522.280.671.382.545.20
5Ethylbenzene100-41-4812.246.702.0219.091.122.311.392.85
6Toluene108-88-3773.339.982.6828.622.024.184.5310.49
73-Methylhexane589-34-4730.621.85Unable to Convert4.780.100.20Unable to Convert0.64
8n-hexane110-54-3659.0527.15Unable to Convert25.2340.9384.57Unable to Convert68.85
9n-butane106-97-86012.9438.80Not Detected-1.222.52Unable to Convert3.12
10Isobutane75-28-543Not Detected-Not Detected-0.320.66Unable to Convert1.59
Disclaimer/Publisher’s Note: The statements, opinions and data contained in all publications are solely those of the individual author(s) and contributor(s) and not of MDPI and/or the editor(s). MDPI and/or the editor(s) disclaim responsibility for any injury to people or property resulting from any ideas, methods, instructions or products referred to in the content.

