Article

Global Atmospheric δ13CH4 and CH4 Trends for 2000–2020 from the Atmospheric Transport Model TM5 Using CH4 from Carbon Tracker Europe–CH4 Inversions

1
Finnish Meteorological Institute, FI-00101 Helsinki, Finland
2
SRON Netherlands Institute for Space Research, 2333 CA Leiden, The Netherlands
3
Department of Earth Sciences, Vrije Universiteit Amsterdam, 1081 HV Amsterdam, The Netherlands
4
Department of Climate, Air & Sustainability, Netherlands Organisation for Applied Scientific Research (TNO), 3508 TA Utrecht, The Netherlands
5
Department of Environmental Sciences, Wageningen University & Research, Meteorology and Air Quality, 6700 AA Wageningen, The Netherlands
6
Institute for Marine and Atmospheric Research Utrecht IMAU, Utrecht University, Str. Princetonplein 5, 3584 CC Utrecht, The Netherlands
7
Laboratoire des Sciences du Climat et de l’Environnement, MCF–Université de Versailles Saint-Quentin, CEA-Orme des Merisiers, 91191 Gif-sur-Yvette, France
8
NASA Goddard Space Flight Center, 8800 Greenbelt Rd., Greenbelt, MD 20771, USA
9
Earth System Science Interdisciplinary Center, University of Maryland, 5825 University Research Ct Suite 4001, College Park, MD 20740, USA
10
NOAA Global Monitoring Laboratory (GML), 325 Broadway, Boulder, CO 80305, USA
11
Institute of Arctic and Alpine Research (INSTAAR), University of Colorado, Campus Box 450, Boulder, CO 80309, USA
12
Department of Earth Marine and Environmental Sciences, University of North Carolina at Chapel Hill, Chapel Hill, NC 27514, USA
*
Author to whom correspondence should be addressed.
Atmosphere 2023, 14(7), 1121; https://doi.org/10.3390/atmos14071121
Submission received: 23 April 2023 / Revised: 30 May 2023 / Accepted: 4 July 2023 / Published: 6 July 2023
(This article belongs to the Special Issue Novel Techniques for Measuring Greenhouse Gases (2nd Edition))

Abstract

:
This study investigates atmospheric δ 13 CH 4 trends, as produced by a global atmospheric transport model using CH 4 inversions from CarbonTracker-Europe CH 4 for 2000–2020, and compares them to observations. The CH 4 inversions include the grouping of the emissions both by δ 13 CH 4 isotopic signatures and process type to investigate the effect, and to estimate the CH 4 magnitudes and model CH 4 and δ 13 CH 4 trends. In addition to inversion results, simulations of the global atmospheric transport model were performed with modified emissions. The estimated global CH 4 trends for oil and gas were found to increase more than coal compared to the priors from 2000–2006 to 2007–2020. Estimated trends for coal emissions at 30 N–60 N are less than 50% of those from priors. Estimated global CH 4 rice emissions trends are opposite to priors, with the largest contribution from the EQ to 60 N. The results of this study indicate that optimizing wetland emissions separately produces better agreement with the observed δ 13 CH 4 trend than optimizing all biogenic emissions simultaneously. This study recommends optimizing separately biogenic emissions with similar isotopic signature to wetland emissions. In addition, this study suggests that fossil-based emissions were overestimated by 9% after 2012 and biogenic emissions are underestimated by 8% in the inversion using EDGAR v6.0 as priors.

1. Introduction

Methane (CH 4 ) is a greenhouse gas emitted into the atmosphere by natural and anthropogenic processes. Emissions can also be categorized according to their formation processes into biogenic, pyrogenic, and thermogenic emissions [1]. Atmospheric CH 4 concentrations have more than doubled since pre-industrial times [1]. The atmospheric concentration of CH 4 is well known, unlike the magnitude and contribution of each CH 4 source [2,3]. Atmospheric records show that the concentration of CH 4 was almost stable during the early 2000s but started to increase again after 2006. At the same time, observations of 13 CH 4 show a decrease, i.e., the atmosphere is becoming more depleted in the heavy isotope [4].
CH 4 has two stable carbon isotopes, and their isotopic signatures ( δ 13 C; deviation of the ratio relative to a standard) depend on the processes producing CH 4 [5]. In general, emissions from biogenic processes are most depleted in 13 C, and emissions of pyrogenic origin are most enriched in 13 C, followed by thermogenic sources (e.g., [5,6]). At present, isotopic measurements are limited in both spatial and temporal coverage, while partly overlapping signatures make source attribution uncertain [7]. Furthermore, the isotopic signatures of emissions can vary from place to place due to differences in production processes, types of origin, or methanogenesis [8,9,10,11]. It is important to have detailed spatial information on isotopic signatures; otherwise, the results may be erroneous [8]. In combination with atmospheric inversions with only total CH 4 budgets (e.g., [1,12]), isotopic information is helpful in characterizing CH 4 sources [7,13,14,15]. In addition CH 4 emissions, all sinks have fractionation factors, and there are uncertainties such as the fractionation factor of OH, which also varies between studies [16,17]. There is also some uncertainty in the tropospheric Cl sink, which varies from 13–37 Tg CH 4 yr 1 [18] to 12–13 Tg CH 4 yr 1 [19] and even smaller estimates [20].
Previous studies have proposed a variety of causes for the CH 4 plateau in the early 2000s and the post-2006 growth. Lan et al. [15] concluded, using the forward modeling of atmospheric chemistry, that fossil fuel emissions are unlikely to be the dominant driver of global CH 4 growth after 2006 and that a significant reduction in OH would not correspond to the observed decrease in global mean δ 13 CH 4 . Lassey and Ragnauth [21] also concluded that it is unlikely that the post-2006 increase is primarily due to sinks of OH and Cl. In addition, Thompson et al. [13], Zhang et al. [22] concluded that changes in the atmospheric sink are not significant to the recent increase in global CH 4 . Similarly, Milkov et al. [23] found that emissions from shale gas and shale oil are not the dominant driver of the increase in global CH 4 , even though emissions from these sources are expected to increase. Instead, Milkov et al. [23] proposed that changes in the emissions of isotopically lighter CH 4 dominate the increase in global CH 4 . Yin et al. [24] used ensemble inverse modeling to suggest that the recent acceleration in the CH 4 growth rate from 2010 to 2017 is due to increases in CH 4 emissions, particularly from wetlands in the tropics and anthropogenic emissions from China, rather than variations in OH. Similarly, Zhang et al. [22] suggested that the high grow rates from 2016 to 2018 are due to increases in tropical and boreal wetlands with increased anthropogenic emission, especially livestock emissions in tropical regions.
A box-model analysis by Schaefer et al. [25] suggested that decreasing thermogenic emissions and/or changes in OH concentrations, which is an atmospheric sink for CH 4 , are responsible for the plateau in the early 2000s. On the contrary, Fujita et al. [26] suggest that the plateau is explained by decreases in biogenic and biomass burning CH 4 emissions. In contrast, Zhang et al. [27] suggest that the decreased coal, oil, and gas emissions, together with the anomaly of increasing OH, contributed to the plateau. Schaefer et al. [25] suggests that the growth after 2006 is predominantly biogenic and more consistent with agriculture than wetlands, and tropical regions have shown the highest increase based on satellite measurements [12]. Thompson et al. [13], Fujita et al. [26] also suggest that biogenic emissions from the tropics are responsible for the growth after 2006. Zhang et al. [27] suggest that the post-2006 growth is primarily due to increases in agriculture and landfill and waste sectors with minor contributions from increased emissions from industrial fossil and wetland. Bousquet et al. [28] found that Arctic warming increased emissions from wetlands in 2007. Dlugokencky et al. [29] estimated that tropical wetland CH 4 emissions increased during La Niña conditions in 2007 and 2008, contributing to the global increase in CH 4 , as natural wetland CH 4 emissions in the tropics are driven by precipitation, which is enhanced during La Niña conditions in some regions. Lassey and Ragnauth [21] also suggest that southern tropical wetlands may be behind the increase in global CH 4 after 2006.
Previous CH 4 inversion studies divide emissions into anthropogenic, biospheric, and other categories (e.g., [30,31]). The category of anthropogenic emissions include all CH 4 emissions from human activity, while biospheric emissions include emissions from wetlands and soil sinks. The other emissions include geological, ocean, and termite emissions. In this study, we challenge the traditional division of emissions and instead group the emissions based on their isotopic signatures and origin. In this study, we categorize the emissions based on their isotopic signatures: fossil-based and more enriched in 13 CH 4 and biogenic with depleted 13 CH 4 .
We performed two inversion runs using a CarbonTracker Europe –CH 4 data assimilation system using CH 4 mole fraction data. The TM5 atmospheric chemistry model was run using the posterior fluxes and process-specific isotopic signatures to examine atmospheric δ 13 CH 4 and CH 4 trends. Furthermore, the simulations were also performed with TM5, which included 1) increasing wetland emissions and 2–3) changing the ratio of biogenic to fossil emissions in the anthropogenic sources. The results from the study show the role of fossil emissions in the global methane budget and that grouping sources isotopically is an effective way to optimize emissions in atmospheric inversions.

2. Materials and Methods

2.1. CarbonTracker-Europe-CH 4

CarbonTracker-Europe-CH 4 (CTE-CH 4 ) is an atmospheric inversion model that optimizes surface CH 4 fluxes globally using the Ensemble Kalman Filter (EnKF) [32] as the model scheme [30,33]. The atmospheric chemistry transport model TM5 [34] (see Section 2.1.1) is used as an observation operator EnKF. TM5 uses a priori information on the CH 4 fluxes, the initial mole fraction of atmospheric CH 4 , and ECMWF ERA5 meteorological reanalysis data to compute estimated atmospheric concentrations, after which the EnKF is applied to optimize emission fields for anthropogenic and biogenic sources using the observed atmospheric concentrations [30]. TM5 in the CTE-CH 4 is run at a global resolution of 4 × 6 (latitude × longitude) with a 1 × 1 zoom and 2 × 3 intermediate zoom surrounding the 1 × 1 zoom grid over Europe (see more details in Section 2.1.1).
CTE-CH 4 optimizes fluxes from two categories simultaneously at a weekly resolution. The horizontal resolution of the optimization varies: for northern land, including Canada, the USA, Europe, and Russia, fluxes are optimized grid-wise, and elsewhere, they are optimized region-wise (see, e.g., [35]). The two categories are assumed to be independent, with an uncertainty of 80% over land and 20% over oceans. The spatial correlation length varies from 100 to 900 km between optimized regions, depending on the grid or optimization region size and observation density (see Tenkanen et al. [35] for details). Uncertainties for emissions are calculated for each emission source based on its prior or posterior ratio of the category in the model.

2.1.1. TM5

TM5 is a global Eulerian atmospheric chemistry transport model [34]. It is driven by ECMWF ERA5 meteorological fields with a 1 × 1 (latitude × longitude) zoom grid over Europe (up to 74 N) embedded in a 4 × 6 global grid with an intermediate 2 × 3 zoom region (e.g., [30]). TM5 includes off-line chemical reactions with OH, Cl, and O( 1 D), where the the reaction with OH is the largest atmospheric sink of CH 4 . The reaction with OH is calculated based on Houweling et al. [12], and the monthly variations in OH concentrations from Spivakovsky et al. [36] are scaled by 0.92 based on an evaluation with methyl chloroform [37]. Atmospheric sinks of Cl and O( 1 D) are considered only in the stratosphere, where the reaction rates are prescribed based on the atmospheric chemistry general circulation model ECHAM5/MESSy1 [38]. The TM5 in this study does not consider any interannual variability in the photochemical sink processes, as they are assumed to be small during the study period [39,40,41].
In this study, TM5 in CTE-CH 4 includes only CH 4 , but the forward runs based on the results of the inversions include both total CH 4 (incl. 12 CH 4 and 13 CH 4 ) and 13 CH 4 . The kinetic isotope effects (KIE) k( 12 CH 4 )/k( 13 CH 4 ) of 1.004 and 1.013 are used for 13 CH 4 OH and O( 1 D), respectively [16], and 1.066 [42] is used for Cl. In this study, the TM5 forward model applied after the inversions assumes that the KIE of the total CH 4 is the same as for 12 CH 4 , i.e., k( 12 CH 4 )/k( 13 CH 4 ) ≈ k(CH 4 )/k( 13 CH 4 ).
In this study, we also include the CH 4 sink to dry soils (i.e., a negative flux from the atmosphere to the soil) in the lowermost layer of TM5. The soil sink depends on soil moisture, temperature, and soil texture, resulting in the smallest sink in winter and the largest sink in the summer [43].
Soil sink removal rate of 13 CH 4 is calculated as [44]
L soil , 13 = F soil , 12 h · KIE soil × [ 13 CH 4 ] [ 12 CH 4 ]
where F soil , 12 is the negative flux of 12 CH 4 at the surface, h is the thickness of the lowermost layer, [ 12 CH 4 ] and [ 13 CH 4 ] are the atmospheric concentrations of 12 CH 4 and 13 CH 4 , and KIE soil is assumed to be 1.0177 [45].
In the TM5 forward simulations, we include two separate tracers, CH 4 (incl. 12 CH 4 and 13 CH 4 ) and 13 CH 4 . The δ 13 CH 4 ( δ 13 C) is calculated as follows:
δ 13 CH 4 = ( 13 C / 12 C ) sample ( 13 C / 12 C ) std 1 × 1000 ,
where ( 13 C/ 12 C) std = 0.0112372 is the isotopic ( 13 C and 12 C) ratio of the standard, Vienna Pee-Dee Belemnite (VPDB; [46]).

2.2. CH 4 and 13 CH 4 Fluxes

In this study, we use inventories and process-based model data for global CH 4 flux fields from anthropogenic and natural sources. All the CH 4 fields are pre-processed to a 1 × 1 grid to match the TM5 model resolution. The 13 CH 4 fluxes are obtained using Equation (2).
CH 4 anthropogenic flux data are taken from the EDGAR inventory v6.0 [47,48]. The data used in this study cover the years 2000–2020. The anthropogenic emissions include emissions from coal, oil and gas, residential, rice cultivation, landfills and wastewater treatment (LWW), and enteric fermentation and manure management (EFMM). EDGAR v6.0 includes the seasonal cycle of emissions.
Anthropogenic emissions can be of fossil or biogenic origin, and the grouping between them is based on the processes by which CH 4 is formed, using isotopic signatures. In general, fossil sources are more enriched in 13 CH 4 than emissions of biogenic origin.
Emissions from wetlands, soil sinks, and termites are taken from Saunois et al. [1]. Wetland emissions are the climatological monthly means from the bottom-up models for 2000–2017. Biomass burning emissions are taken from the Global Fire Emissions Database (GFED) v4.1 [49], ocean emissions from Weber et al. [50], and geological emissions from Etiope et al. [10]. Based on the Intergovernmental Panel on Climate Change (IPCC) AR6 WG1 report [51], we scaled the geological emissions to obtain the total global emissions of 23 Tg.

2.3. Atmospheric Observations

Atmospheric observations for CH 4 were taken from the National Oceanic and Atmospheric Administration—Global Monitoring Laboratory (NOAA/GML) and other national and international networks [52], and the observations of δ 13 C were taken from the Institute of Arctic and Alpine Research (INSTAAR) and the University of Colorado Boulder [53]. We used the CH 4 observations from NOAA/GML and the δ 13 C observations to evaluate the simulation results and trends. The uncertainty target for CH 4 is 3 ppb [54], and for δ 13 C, the reproducibility of the measurements is 0.08‰ ± 0.02‰ [55].

2.3.1. CH 4 Observations for Constraining CH 4 Fluxes

Atmospheric observations for CH 4 mole fractions were obtained from NOAA/GML and other national and international networks and assimilated in the CTE-CH 4 . The CH 4 observations include surface observations from continuous and flask samples, i.e., weekly discrete air samples. The hourly data from the continuous in situ CH 4 observations were processed similarly to Tsuruta et al. [30] before the inversions were performed. Observation uncertainties were defined for each site and observation based on the site’s characteristics and the measurement accuracy. The observation uncertainty is defined by taking into account both the observation error and the TM5 model error. The model error arises from the ability of the TM5 to simulate the observations. The observation uncertainty is somewhat arbitrary and based on expert judgement [3,30,56]. Observations were not assimilated to constrain posterior CH 4 fluxes if the absolute differences between observations and prior mole fractions were greater than three times the observation uncertainty.

2.3.2. δ 13 CH 4 Observations for Evaluation

We used observations of δ 13 CH 4 to evaluate the emission trends and model estimates. Anomalies in the trends were used for comparison. We used curve fitting methods from Thoning et al. [57] to calculate the trend. The trend curve represents the long-term trend with seasonal cycles removed. Anomalies were obtained by subtracting the mean of the time series. In this study, we compared the model with observations at 13 stations, which has a long enough data time series, as shown in Table 1 and Supplementary Table S1.

2.4. Isotopic Signatures

Each CH 4 source was assigned to a process a specific isotopic signature (Table 2) in a same way as previously carried out by Kangasaho et al. [44], which was used together with Equation (2) to calculate the global 13 CH 4 flux fields from CH 4 emission fields. For LWW, rice, residential, ocean, and termite emissions, a single isotopic value was used, and the signature was taken from Thompson et al. [13] (mean values). For the remaining categories (EFMM, coal, oil and gas, wetlands, biomass burning, and geological) a spatially varying isotopic signature was used from Feinberg et al. [9]. EFMM isotopic signatures consider the local ratio of C3 and C4 vegetation [58] and the emitted isotopic signatures of livestock fed with C3 or C4 diets [59]. Country-level natural gas and oil signatures [59] were used in the oil and gas isotopic signatures in Feinberg et al. [9]. The M-COAL version presented by Feinberg et al. [9] and references therein were used as coal isotopic signatures, which are based on coal rank and depth. Globally varying isotopic signatures for geological emissions were taken from Etiope et al. [10]. Wetland isotopic signatures were based on observations characterizing wetland ecosystems taken from Ganesan et al. [8].
The original resolution of the isotopic signatures from Feinberg et al. [9] was T42 resolution but were converted to 1 × 1 resolution by selecting the closest coordinate value and by simple grid-averaging, respectively, for [44]. For all sources, the grid cells, where isotopic signature data were not available from the data described above, were filled with mean values from Thompson et al. [13] (see Table 2) according to Kangasaho et al. [44].
We acknowledge the differences in the spatial distributions of emissions used in, e.g., Feinberg et al. [9] against the EDGAR v6.0. We are also aware of the seasonal variations in δ 13 CH 4 signatures, but in this study, the seasonal variations in δ 13 CH 4 signatures are not taken into account. However, considering the wide range of source signatures [5,6,7,60], we assume that our values are reasonable for the purposes of this study.

2.5. Model Setup

We used different set-ups for the inversions, which are described in Section 2.5.1. The different model set-ups for the TM5 transport model are described in detail in Section 2.5.2.

2.5.1. Inversion Model—CH 4 Only

The inversions differ in the categorization of the optimized fluxes (Table 3). For each category, one flux-scaling factor is applied per optimized region (see Section 2.1). In ORIG, the optimized category 1 (categ1) includes all anthropogenic sources, i.e., coal, oil, and gas, EFMM, LWW, rice, and residential, as well as biomass burning. Category 2 (categ2) includes wetlands and soil sinks. This division was used in, e.g., Saunois et al. [1]. This kind of division does not consider the differences in isotopic signatures, and the CH 4 budgets can be better resolved when emissions with similar isotopic signatures are optimized in the same category. Therefore, we wanted to optimize emissions together with similar isotopic signatures, so SET1 and SET2 inversions were performed. In SET1, categ1 includes coal and oil and gas, and categ2 includes EFMM, LWW, rice, wetlands, and soil sinks. In SET2, categ1 includes coal and oil and gas, and categ2 includes EFMM, LWW, and rice. In all inversions, the emission sources that are not included in categ1 or categ2 are taken as priors and not optimized.

2.5.2. TM5 Forward Model with δ 13 CH 4

We performed a spin-up including δ 13 CH 4 prior to the TM5 simulation for the years 2000–2020. For the spin-up, we ran TM5 40 times using year 2000 emissions and meteorological fields, together with the isotopic signatures described in Section 2.2 and Section 2.4. The spin-up was performed to obtain a well-mixed initial field for the TM5 forward modeling. The spin-up is important because the inversion did not include δ 13 CH 4 but only CH 4 .
We performed a total of nine simulations using TM5 (Table 4). Out of these nine, six simulations were performed using prior and posterior emissions from ORIG, SET1, and SET2 inversions. The prior simulations for ORIG and SET1 are the same, but SET2 differs from ORIG and SET1. For the prior simulations, the spin-up was performed with posterior fluxes, and the same initial fields were used for the simulations with the prior fluxes.
We also modified the emissions after 2012 for the ORIG simulation to examine the effect of the ratio of fossil to biogenic emissions and to obtain a stronger response of the isotopic trend to the emission change. We increased the ratio of biogenic (including emissions from rice, LWW, EFMM, and wetlands) to fossil (including emissions from coal, oil and gas, and residential) by 2% from 74% to 76%. The ratio is defined as follows: ((rice + LWW + EFMM) + wetland)/((rice + LWW + EFMM) + wetland+ (coal + oil and gas + residential)). This increase was achieved by increasing wetland emissions by 29% (43.3 Tg yr 1 ) (WET); decreasing fossil emissions by 9%, and increasing rice, LWW, and EFMM emissions by 2% (COMBO_1). In addition, we changed the biogenic fossil ratio to be 77% by decreasing fossil emissions by 9% and increasing rice, LWW, and EFMM emissions by 8% (COMBO_2).

3. Results

3.1. Estimated CH 4 Fluxes

The results for estimated CH 4 fluxes are divided into two sections. Section 3.1.1 focuses on differences in the CH 4 budget at 30 degree latitudinal bands and globally. Section 3.1.2 focuses on an analysis of the emission change during different time periods (2000–2006, 2007–2013, and 2014–2020), both globally and in 30-degree latitudinal bands.

3.1.1. Estimated Emission Budgets

The estimated global posterior CH 4 emissions for oil and gas are higher compared to priors after 2010 (Figure 1). SET1 and SET2 estimate higher posterior emissions for oil and gas compared to ORIG, on average 3.16–3.19 TgCH 4 yr 1 (Table S2), and this is statistically significant ( p < 0.05 ). In general, the largest contribution to the increase in oil and gas emissions in the posteriors comes from latitudes EQ–60 N (Figures S3 and S4). In contrast, posterior global coal emissions do not increase as much as priors suggest after 2007 in any of the simulations (Figure 1). The most significant difference in the magnitude of posterior and prior coal emissions occurs at latitudes 30 N–60 N (Figure S4). On average, posterior coal emissions are 0.86–4.72 TgCH 4 yr 1 lower than priors, although the result is not statistically significant ( p > 0.05 ) (Table S2). Residential posterior emissions in ORIG differ in magnitude and trend from SET1 and SET2 (Figure 1), with the largest contribution coming from latitudes EQ–60 N (Figures S3 and S4). However, on average, the total estimated residential emissions in ORIG are 0.13 Tg yr 1 (Table S2) lower than prior. Residential emissions in SET1 and SET2 are not optimized.
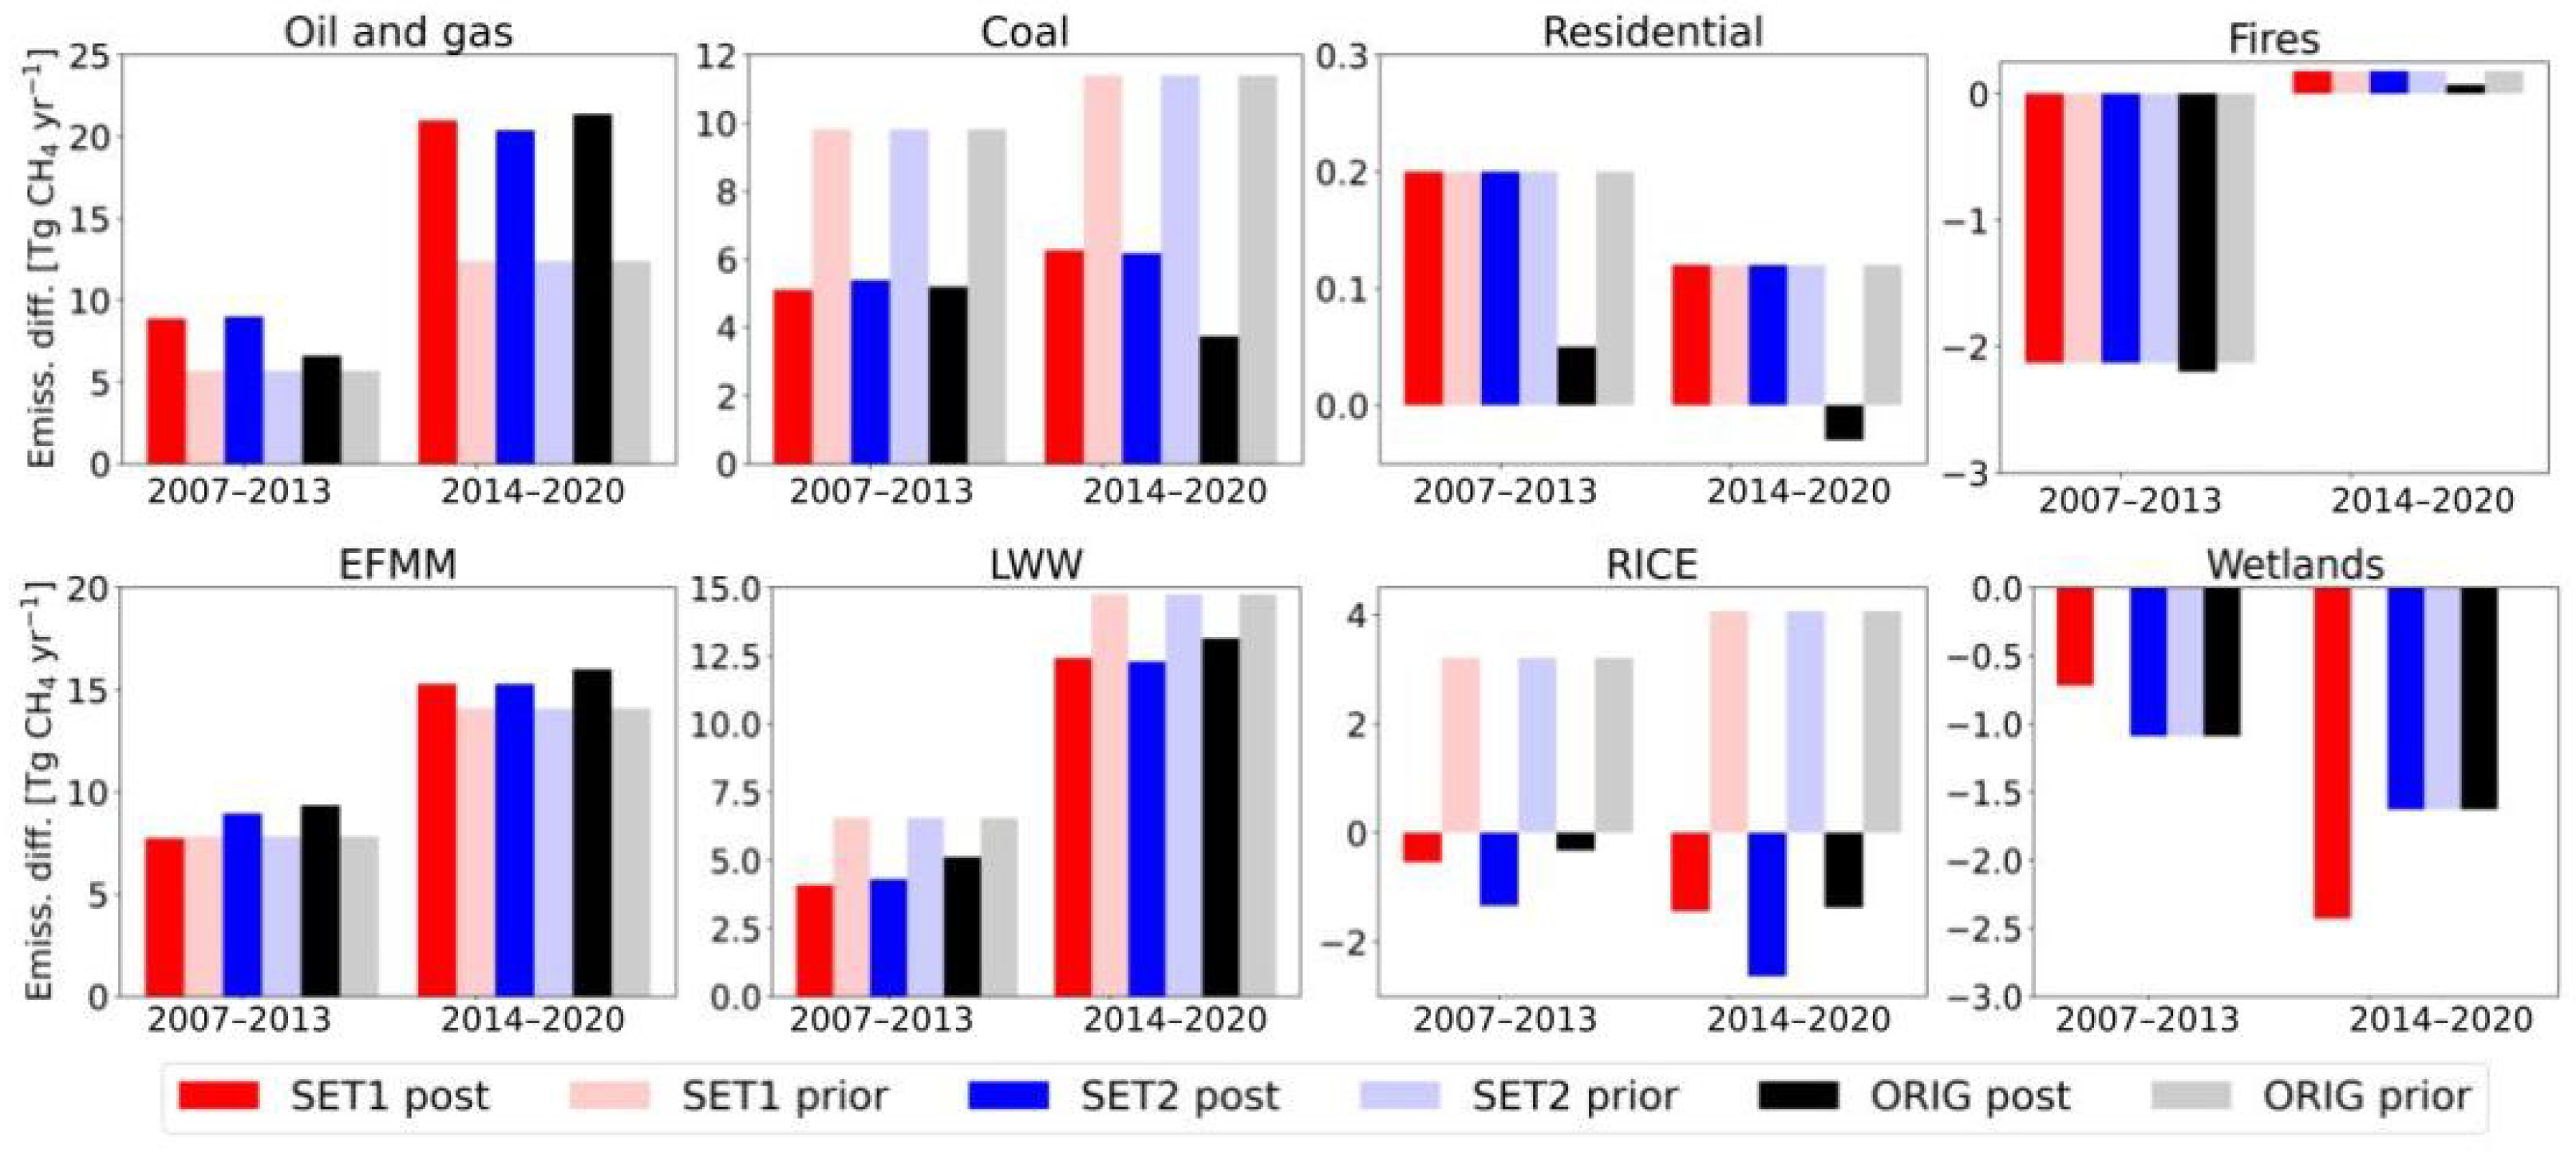
Global LWW- and EFMM-estimated CH 4 emissions have a similar trend to the priors, but the magnitudes are higher (Figure 1 and Table S2). Average prior LWW emissions are approx. 1.7–4.2 TgCH 4 yr 1 smaller than the posteriors, and EFMM posterior emissions are 7.8–9.8 TgCH 4 yr 1 larger than in the priors in all inversions (Table S2). The largest contribution to the increase in LWW and EFMM posterior emissions comes from latitudes 90 S–EQ and 30 N–60 N (Figures S2 and S4). The global posterior rice emissions show an opposite trend to the prior emissions. However, the global total differs, on average, by less than 1 TgCH 4 yr 1 (Table S2).
The global posterior wetland CH 4 emissions differ between the simulations (Figure 1). SET1 estimates the largest posterior wetland CH 4 emissions among the total simulations. The largest contribution to the increase in SET1 wetland emissions comes from latitudes 30 S–EQ and 30 N–60 N (Table S2).
The global average soil-sink posteriors vary among simulated years, and no clear trend is visible for the years 2000–2014 (Figure 1). However, a strong decrease in the soil sink is estimated by SET1 in 2018, along with an increase in ORIG (and SET2). Termite, ocean, and geological emissions are not optimized in any simulation; therefore, posterior and prior emissions are the same (Table S2). Residential and fire emissions were optimized in ORIG in the biomass burning but are not optimized in SET1 or SET2. However, the estimated fire emissions differ very little from priors.

3.1.2. Emission Changes during 2000–2006, 2007–2013, and 2014–2020

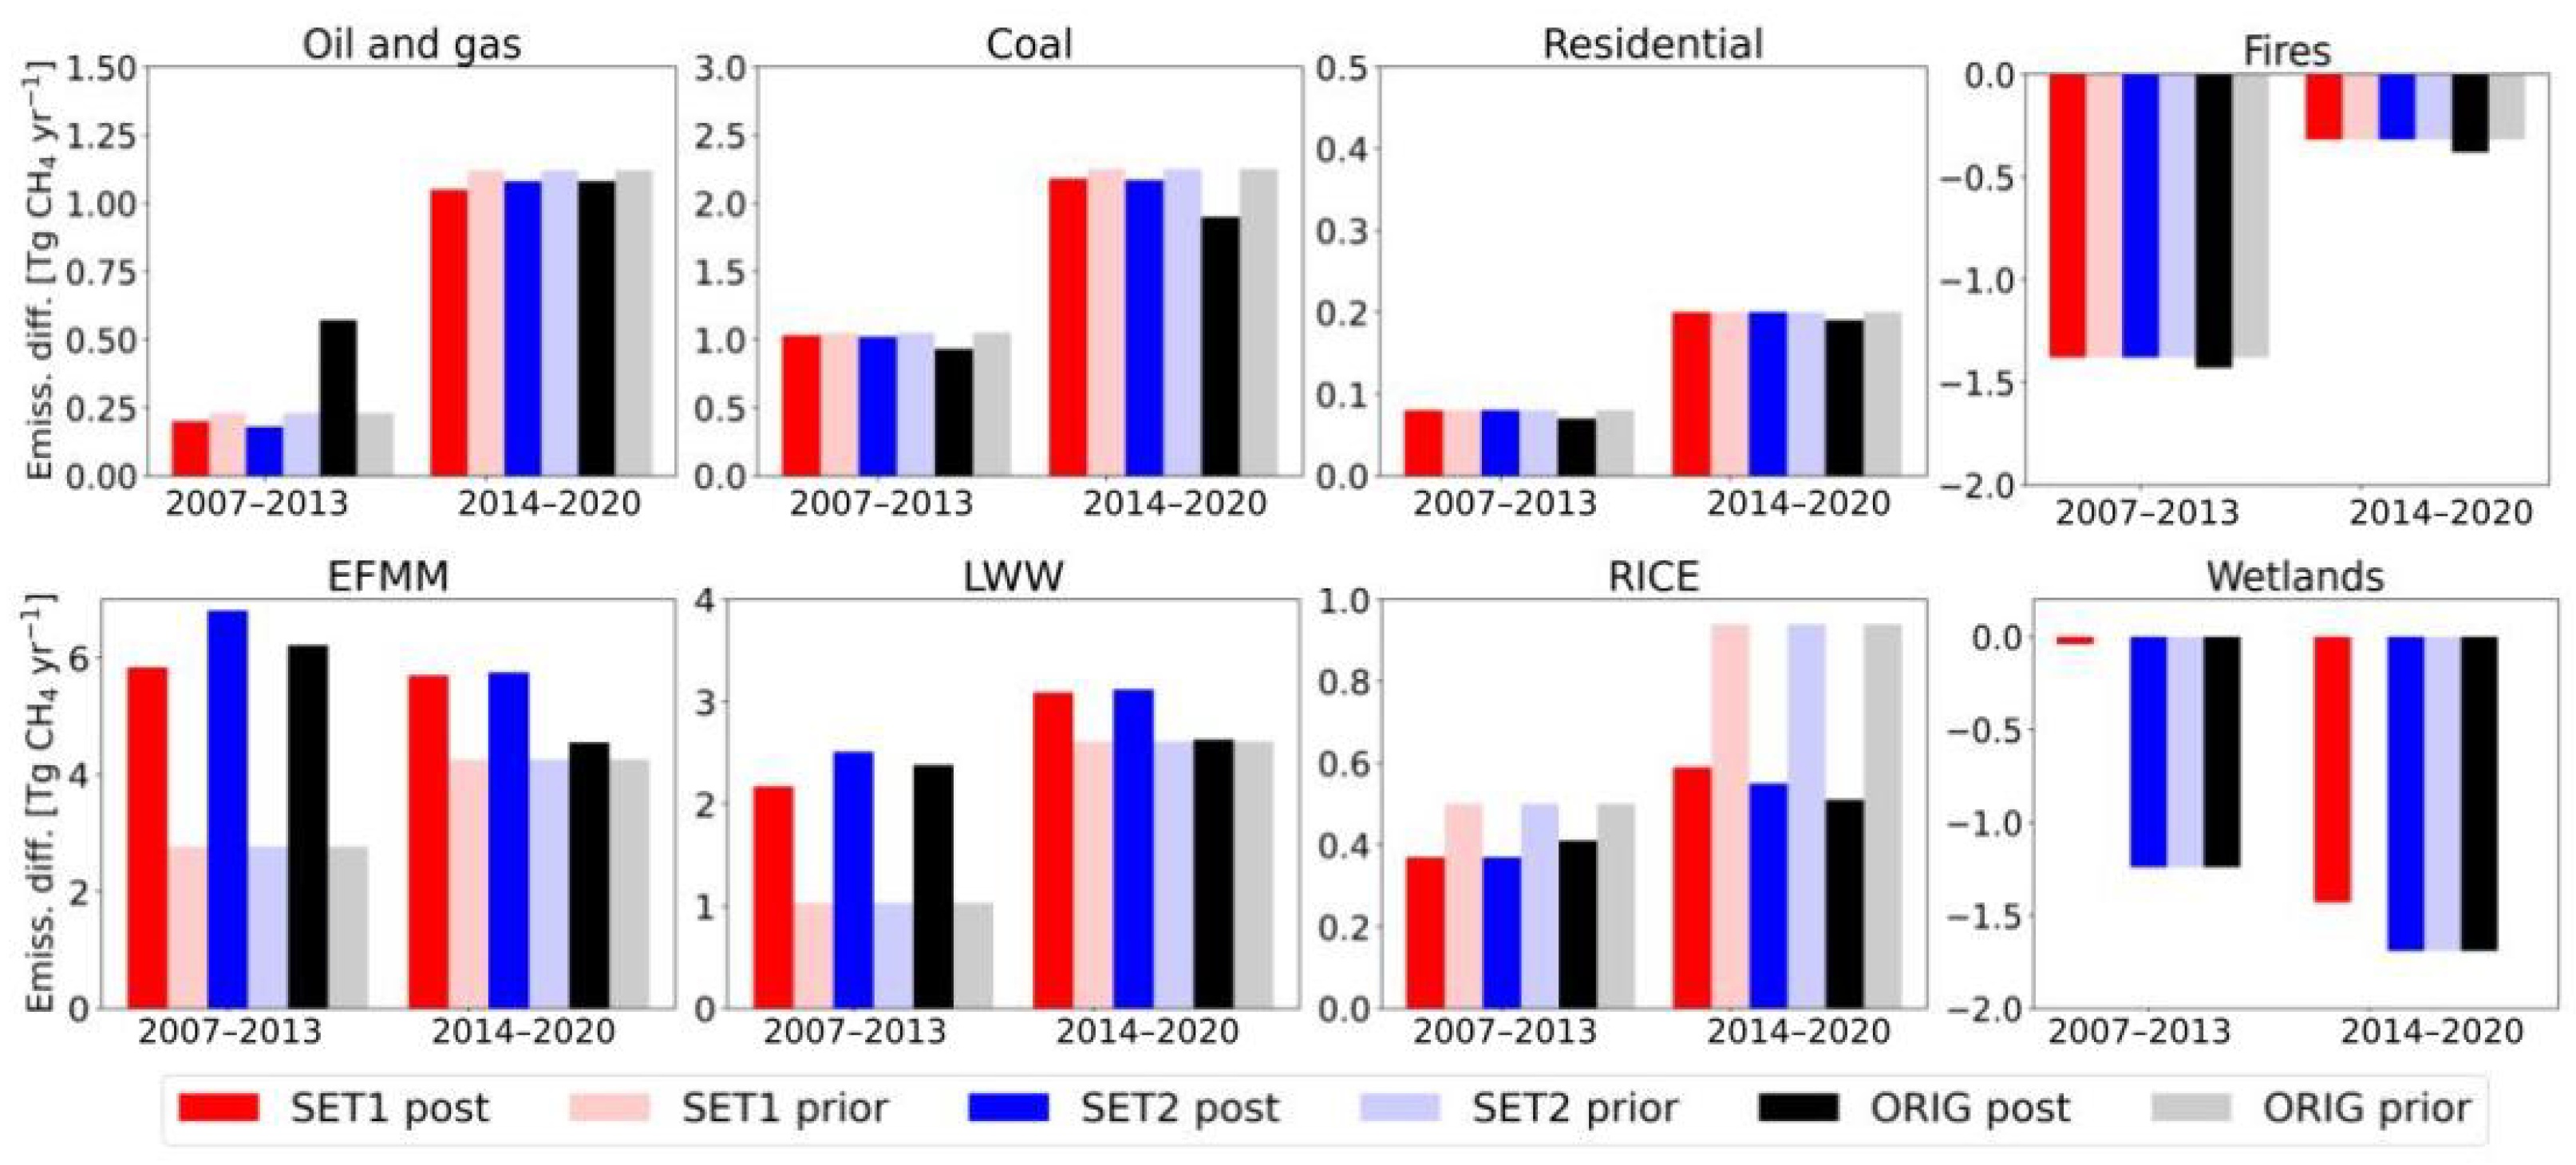
Globally, oil and gas, EFMM, and LWW prior and posterior CH 4 emissions show an increasing trend (Figure 2). Coal emissions in SET1 and SET2 also show a globally increasing trend. The posterior mean LWW and coal emissions suggest a smaller increasing trend for CH 4 emissions compared to the priors (Figure 2). EFMM and oil and gas trends for SET1 and SET2 show a stronger increasing trend in comparison to the priors (Figure 2). However, the estimated EFMM trend from 2000–2006 to 2007–2013 is slightly smaller (<0.1 TgCH 4 yr 1 ) for SET1 (Figure 2 and Table S2). The contributions of different latitude bands to the global EFMM CH 4 posterior trend is different. At the latitudes 30 S–EQ, the EFMM posterior trend is decreased from 2007–2013 to 2014–2020 (Figure 3). At the latitudes 30 N–60 N, the posterior trends in SET1 and SET2 are opposite to the prior trends from 2000–2006 to 2007–2013. From 2007–2013 to 2014–2020, the trend increases again, similar to the priors, but the increasing trend in ORIG is 69% larger than that in the priors (Figure 4 and Table S3). At the latitudes 60 N–90 N, the posterior trend differs only a little from the priors, although the decrease in ORIG from 2000–2006 to 2013-2020 is more than twice as large as in the priors (Figures S6 and S7). At the latitudes 90 S–30 S, the EFMM posterior trends are stronger from 2000–2006 to 2007–2013 in all simulations but weaker from 2000–2006 to 2014–2020 for SET1 and SET2. LWW emissions have a globally increasing trend, but there are differences between the latitude bands and the simulations. The trend at 30 N–60 N and 90 S–30 S is opposite to that of the priors from 2000–2006 to 2007–2013 (Figure 4 and Figure S6). The increasing trends for LWW emission in the posteriors are smaller than in the priors, except for SET1 and SET2 for 90 S–EQ from 2000–2006 to 2014–2020 and also for 30 S–EQ from 2000–2006 to 2007–2013 (Figure 2, Figure 3, Figure 5 and Figure S7). However, all simulations show a larger decreasing trend than priors at 60 N–90 N and 90 S–30 S from 2000–2006 to 2007–2013. The stronger decreasing trend from 2000–2006 to 2014–2020 continues at 60 N–90 N (Figures S6 and S7). Estimated posterior trends for oil and gas emissions at 60 N–90 N indicate a smaller decrease in emissions than priors (Figure S7) from 2000–2006 to 2007–2020. For SET1 and SET2, the posterior emissions indicate a larger increase in emissions from 2000–2006 to 2007–2020 compared to the priors at EQ–60 N. Global posterior coal emissions indicate a smaller increase in emissions from 2000–2006 to 2007–2020 compared to the priors, but there are differences between latitude bands. At latitudes of 30 N–60 N, the posterior trends are less than half of the priors in all simulations. At the latitudes 30 S–30 N, the posterior trend is similar to the priors over the time periods (Figure 3, Figure 4 and Figure 5). At the latitudes 90 S–30 S and 60 N–90 N, the posterior trends differ from the priors, but the contribution is small (Table S3 and Figures S6 and S7). As a result, the global posterior coal emissions have a smaller magnitude compared to the priors expect for ORIG during 2000–2006 (Tables S2 and S3).
The global posterior CH 4 emission trends for rice are opposite to the priors, indicating a decrease in rice emissions (Figure 2). Estimated global residential emissions in ORIG increase less from 2000–2006 to 2007–2013 compared to priors, and there is decrease in the estimated emissions for 2014–2020 compared to 2000–2006 (Figure 2). The estimated global trends for fire emissions in ORIG are similar to the priors (Figure 2). The estimated global trends for wetland CH 4 emissions are decreasing in all simulations (Figure 2), although the magnitude of the emissions is 4.79 TgCH 4 yr 1 larger ( p < 0.05 ) than the priors in SET1 (Table S3). Prior rice emissions have an increasing trend in all latitudinal bands, a small decreasing trend at 90 S–30 S and no trend at all at 60 N–90 N (Figure 3, Figure 4 and Figure 5 and Figures S6 and S7). The decreasing trend for SET2 is the strongest among the simulations (Figure 2). The largest contribution to the differences between the prior and posterior comes from latitudes EQ–60 N (Figure 4 and Figure 5). At latitudes 30 S–EQ, the posterior rice emission trends suggest a smaller increase in emissions compared to the priors (Figure 3). the estimated wetland CH 4 trends show some differences between the simulations at different latitude bands; e.g., the decreasing trend from 2000–2006 to 2014–2020 is stronger for SET1 than for ORIG at latitudes EQ–30 N but vice versa for 30 S–EQ (Figure 3 and Figure 5).

3.2. Estimated CH 4 and δ 13 CH 4 Trends

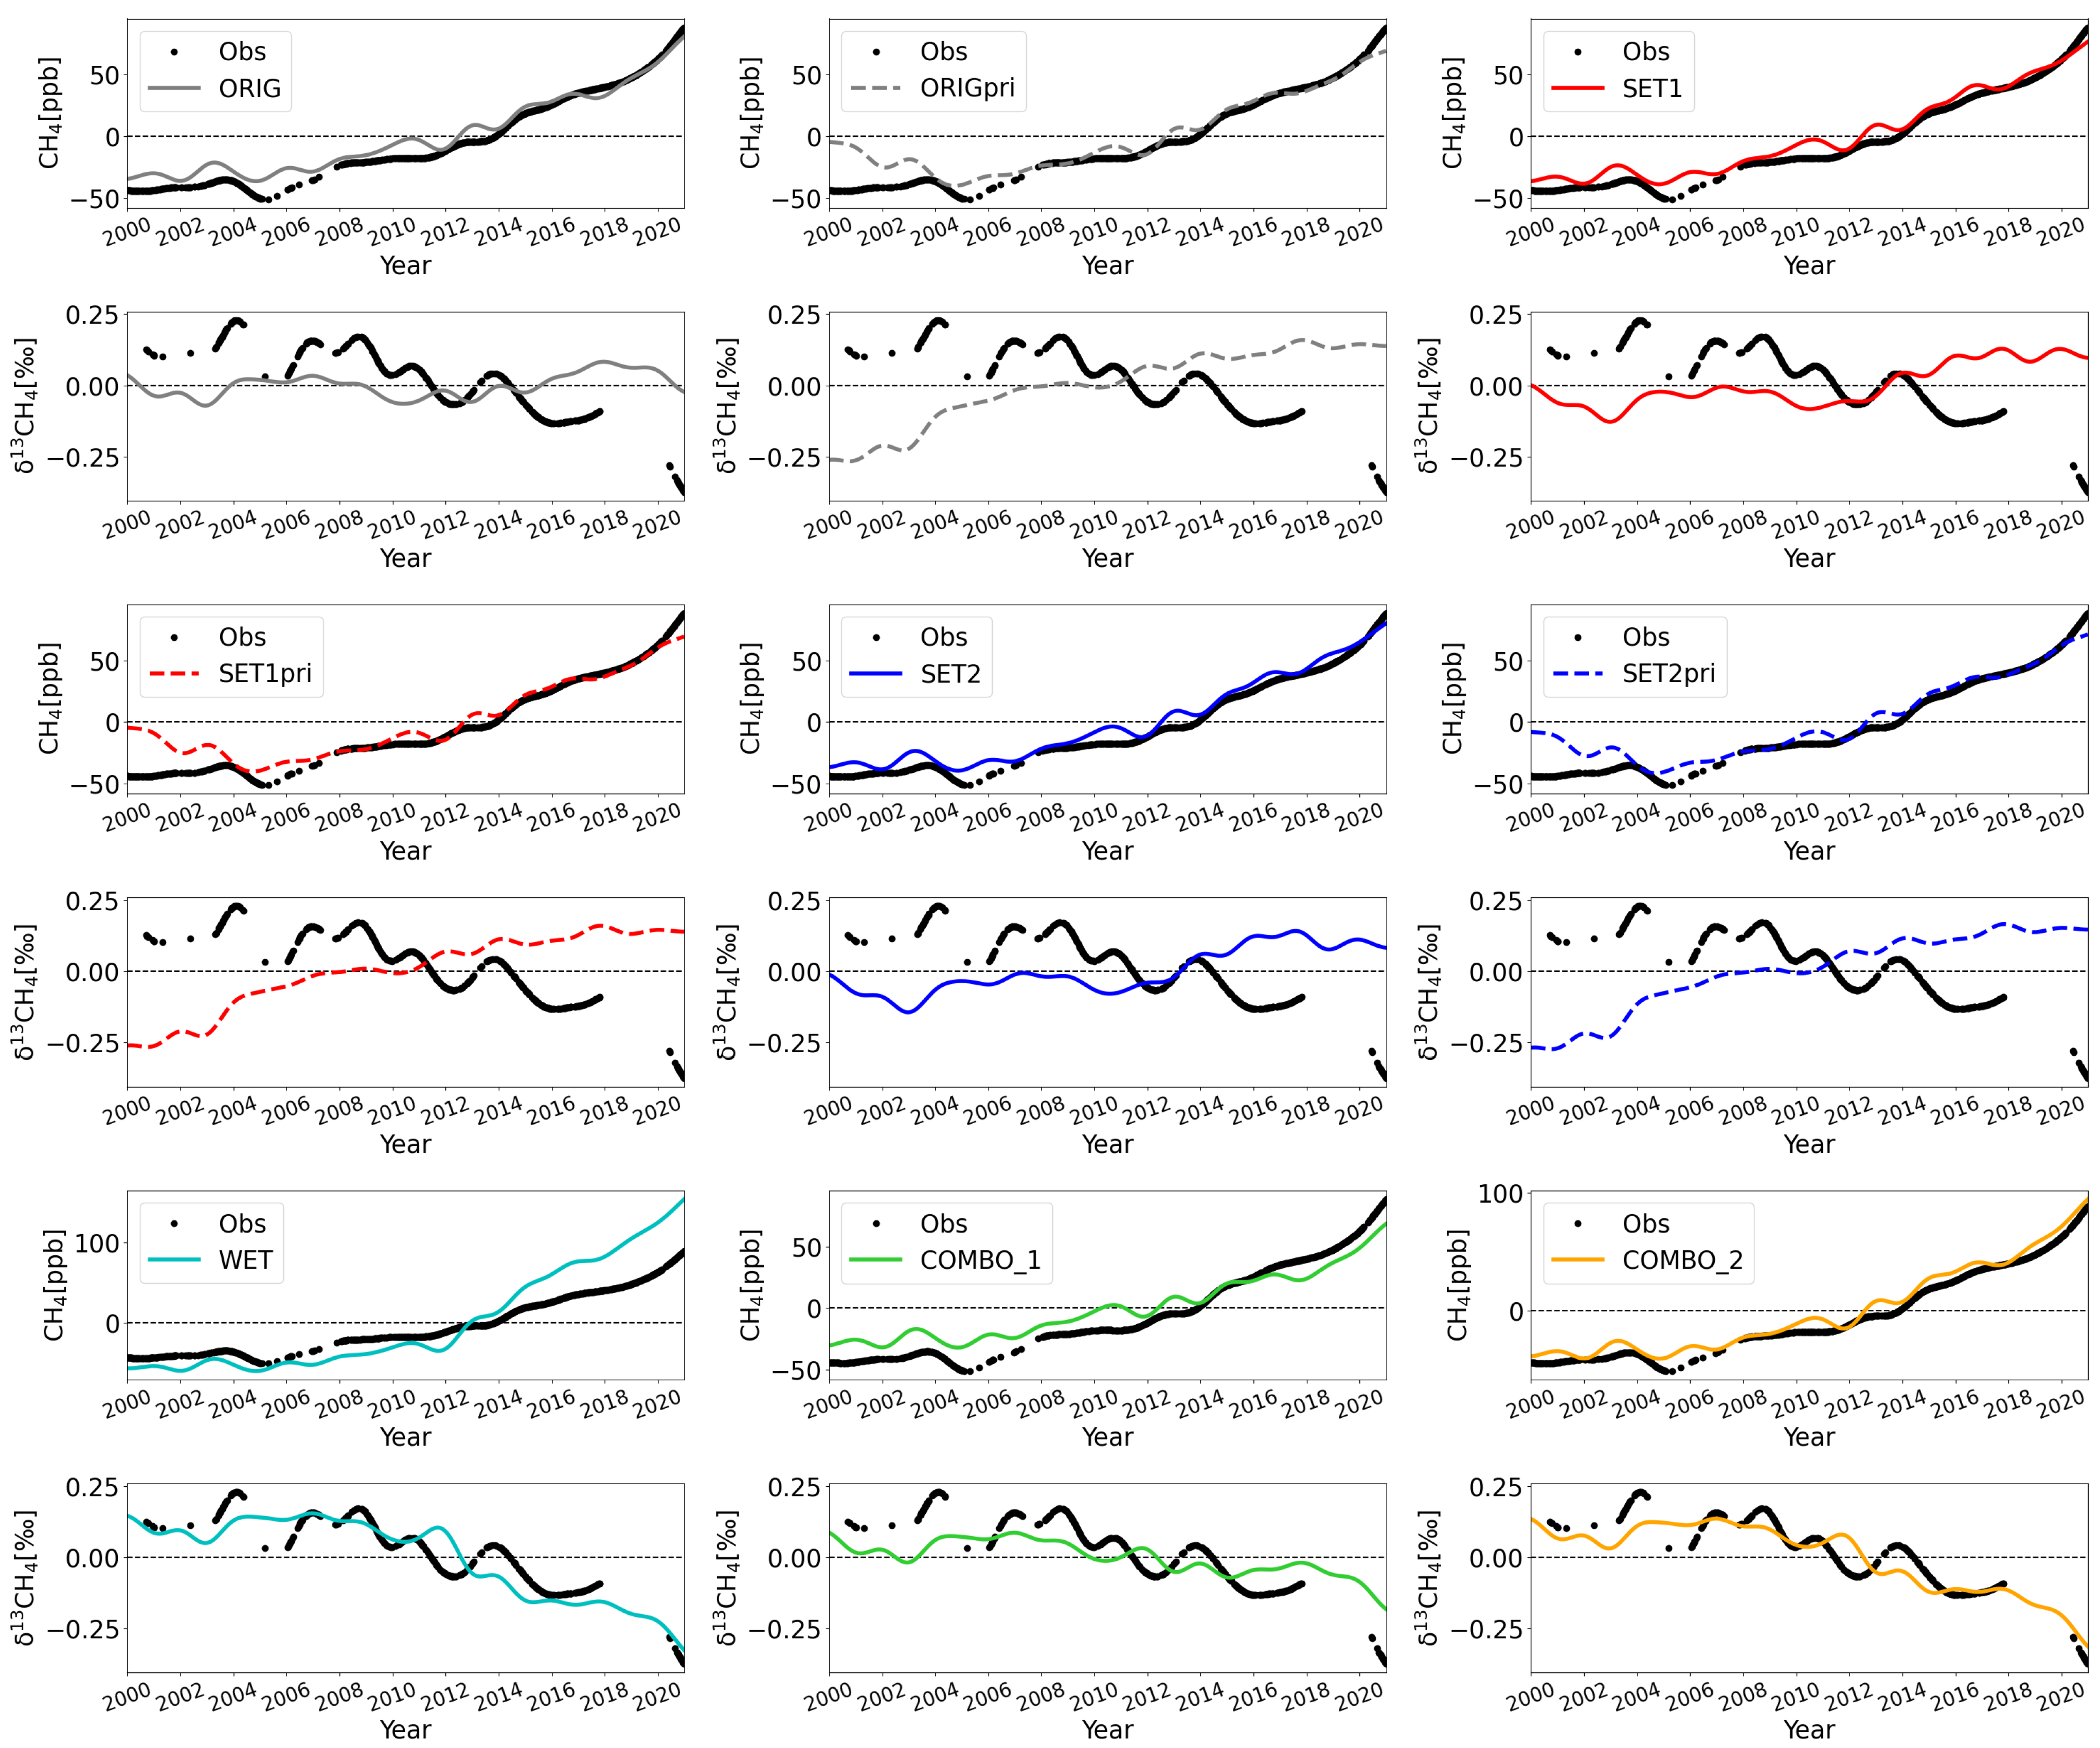
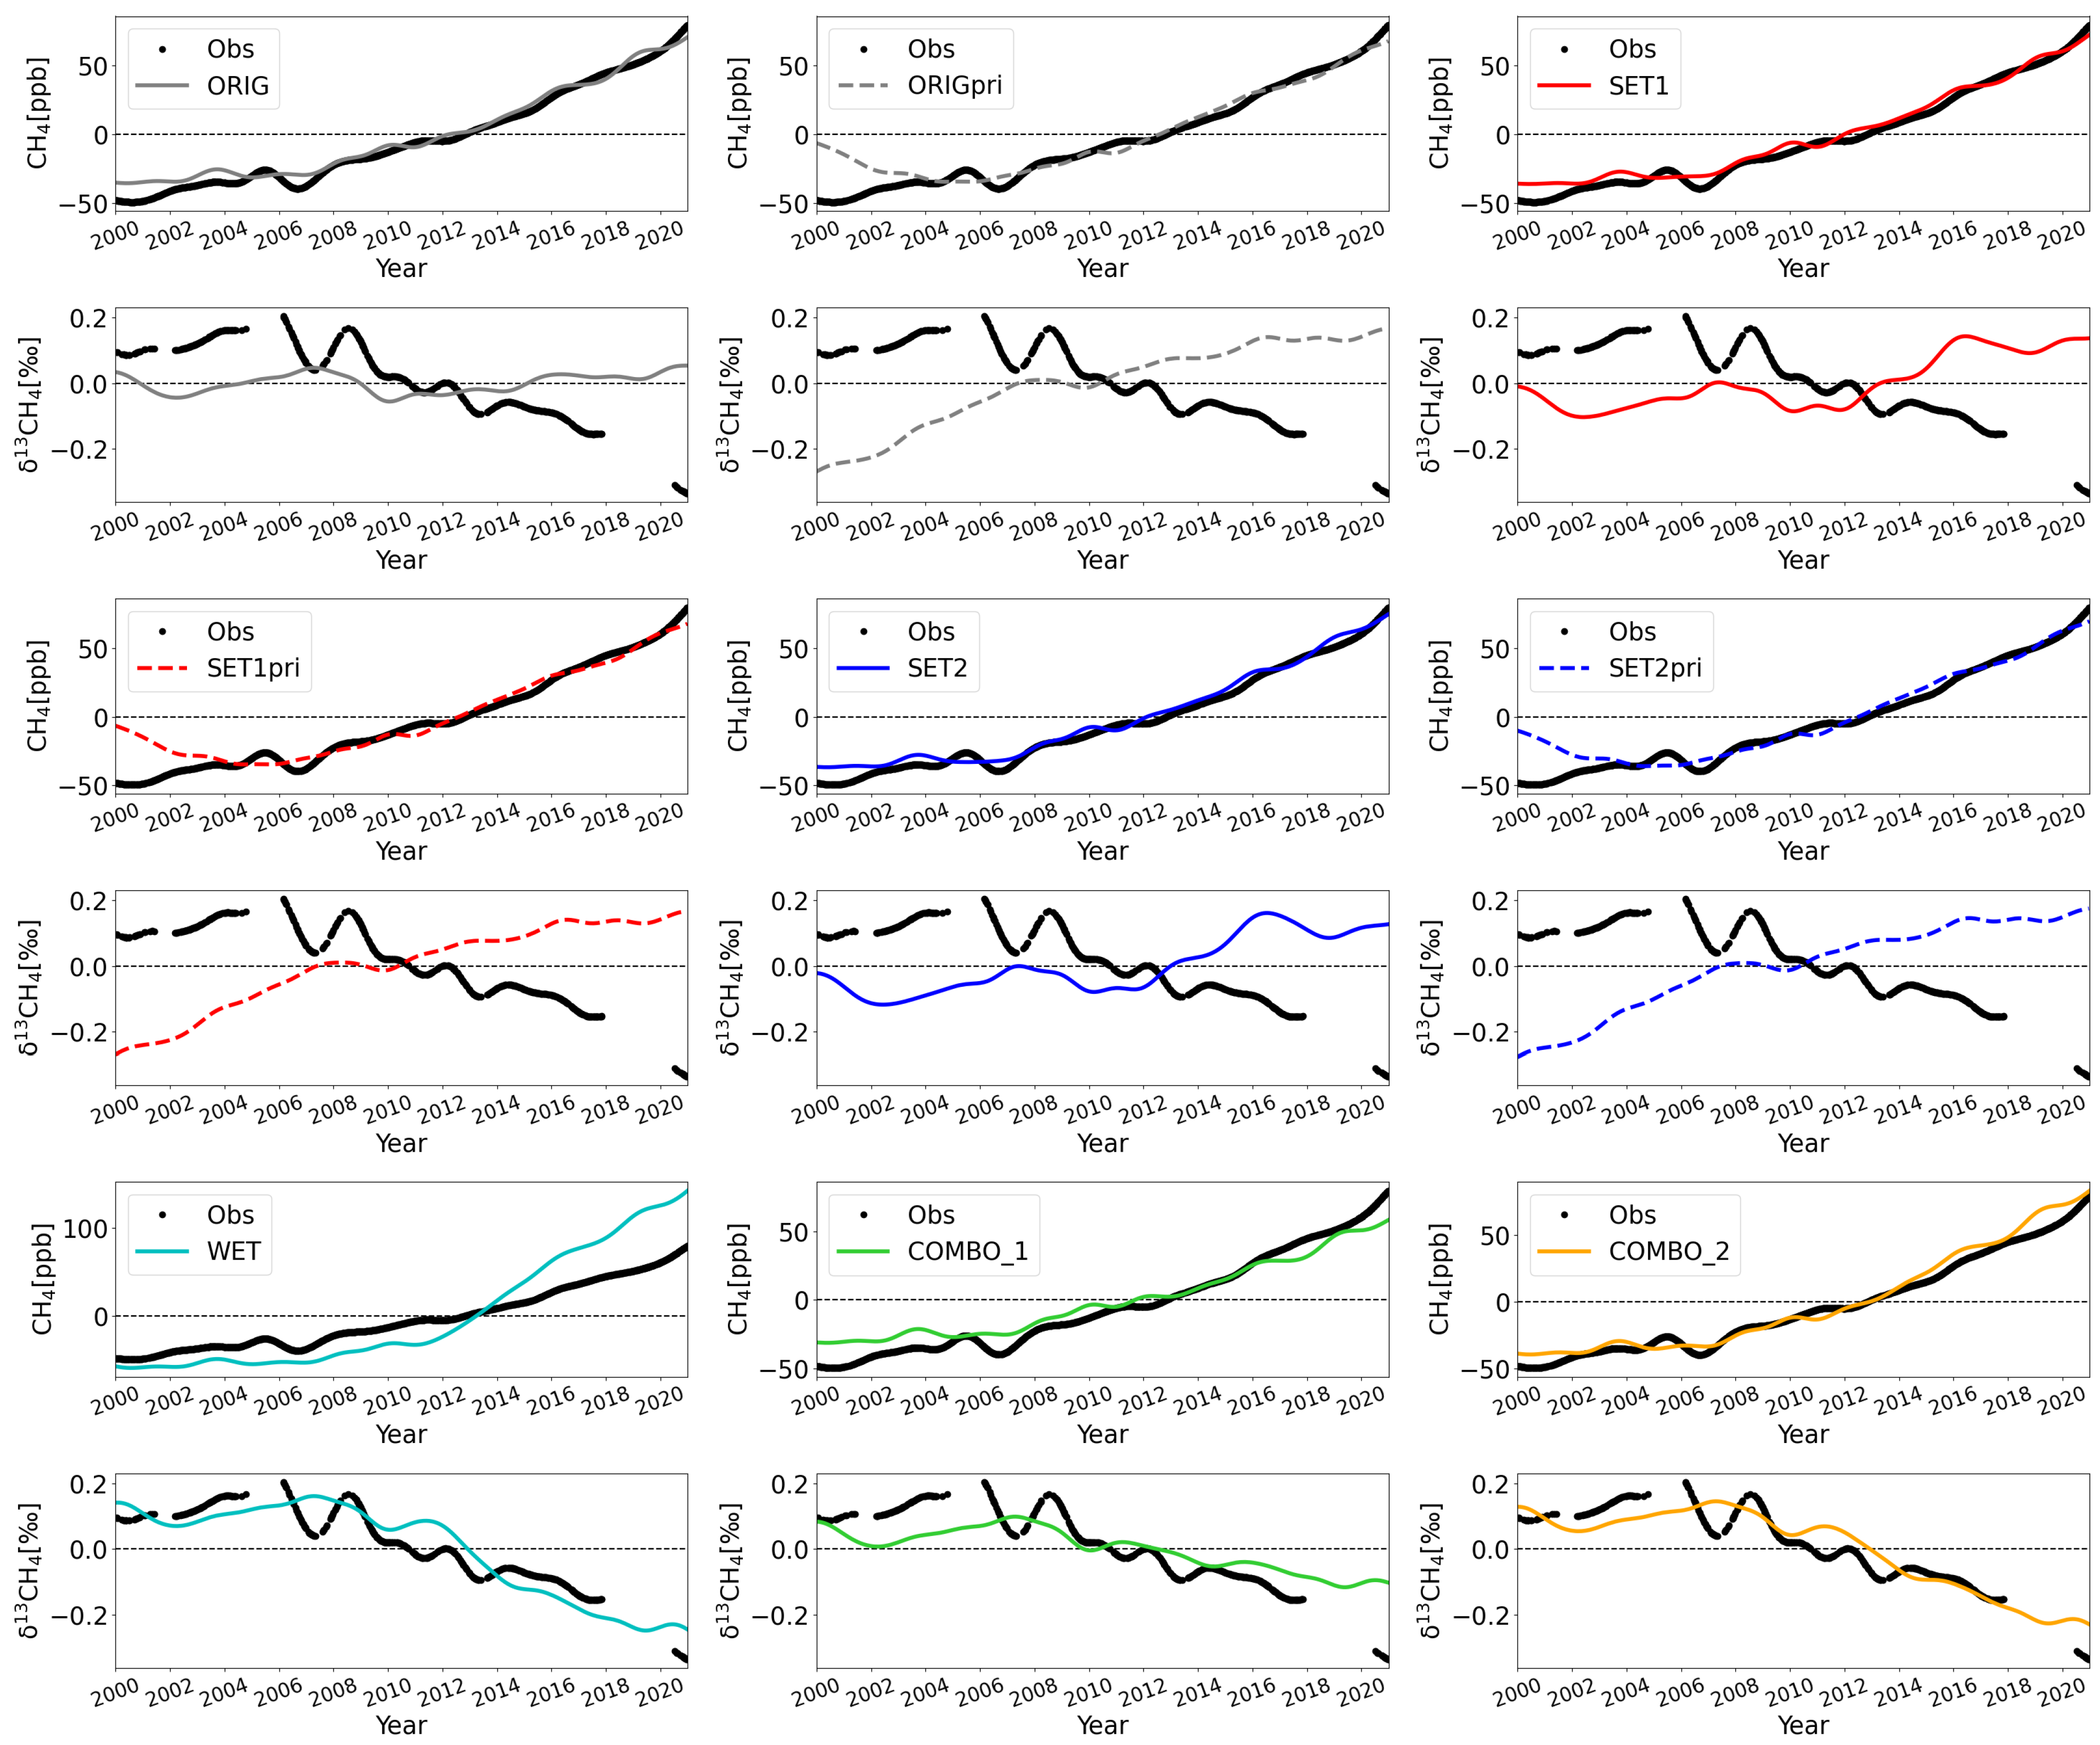
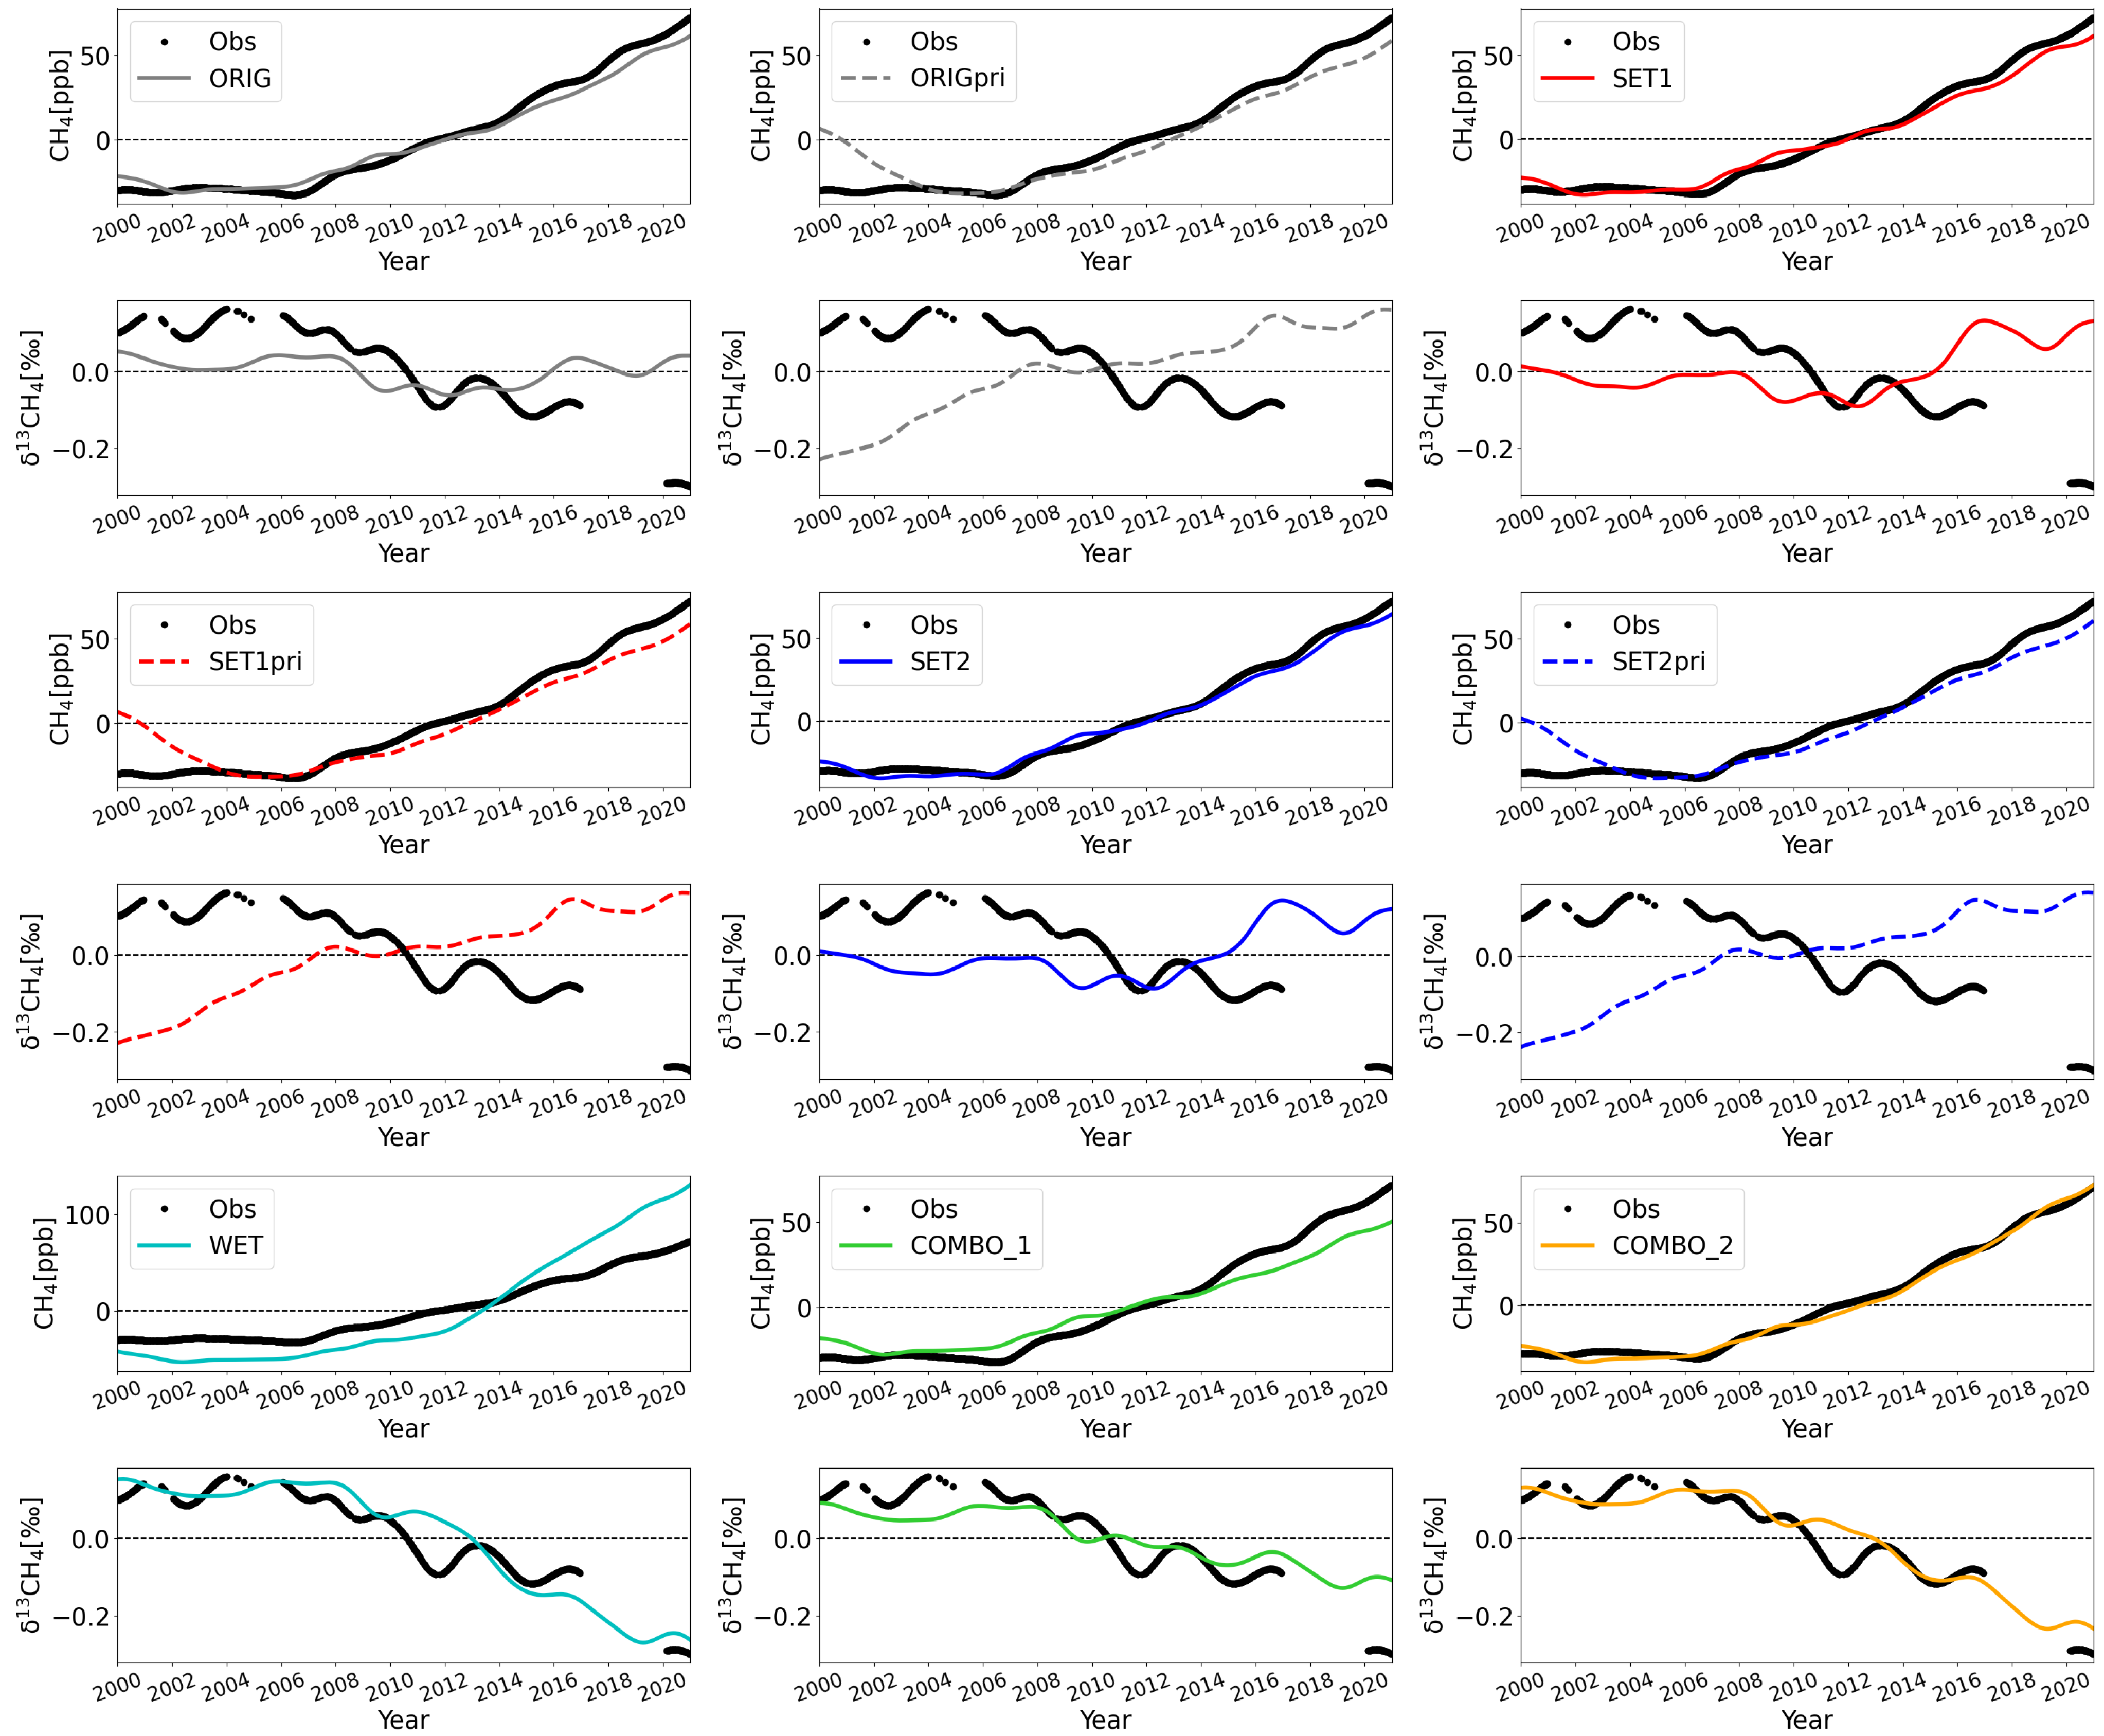
At almost all stations, the modeled CH 4 trends were in agreement with the observations, except for the WET simulation, which was not in agreement at any station. However, there were large differences in the modeled δ 13 CH 4 trends between simulations but not between stations (Figure 6, Figure 7, Figure 8 and Figure 9 and Figures S8–S16). In general, the inversions were in better agreement with the observed δ 13 CH 4 trend from 2000 to 2012 than the priors; however, after 2012, all inversions showed no trend or an increasing trend, while the observations showed a decreasing trend. However, the COMBO_2 run with modified fossil and biogenic emissions agreed well with the observed δ 13 CH 4 trend. Here, we present a detailed analysis of the results for the four stations described in Section 2.3.2. The results from other stations are presented in the Supplementary Material (Figures S8–S16).
At BRW, anomalies for the modeled CH 4 differ from the observations (Figure 6). From 2012 to 2020, the modeled CH 4 trends in the anomalies are similar to the observations in all simulations except WET, but they start from a lower level. The simulated CH 4 anomalies in 2005 and 2010–2012 show a strong decrease, which is not seen in the observations. The modeled trends in δ 13 CH 4 show a similar behavior to that observed from 2000 to 2010, but the timing is different, so the modeled peaks and dips occur earlier.
At MHD, the modeled and observed trends in the CH 4 anomaly are similar (Figure 7), except for WET. In addition, ORIG/SET1pri and SET2pri differ from observations before 2003. The modeled δ 13 CH 4 trends in WET and COMBO_2 are similar to the observations. The δ 13 CH 4 anomaly in the unmodified priors and posteriors shows increasing trends, despite the decreasing trend in the observations. The δ 13 CH 4 trend in COMBO_1 does not decrease as much as observations suggest after 2015.
At NWR, the modeled trends in the CH 4 anomaly are stronger in WET, but in other simulations, the trend agrees well with the observations, except for priors until 2002 (Figure 8). In contrast, the modeled δ 13 CH 4 trends in WET and COMBO_2 agree well with observations. The COMBO_1 simulation also has a similar trend to the observations, but the trend is weaker. Other simulations do not agree with the observations.
At SPO, the modeled and observed trends in the CH 4 anomaly are similar, except for WET. The priors are also different before 2003 (Figure 9). The observed trend in δ 13 CH 4 is similar to the observations in WET and COMBO_2 (Figure 9). The trend in COMBO_1 is decreasing but still weaker than the observations. Other simulations show an increasing trend in δ 13 CH 4 , which is opposite to the observations.

4. Discussion

The TM5 results in this paper demonstrate the importance of initial emissions. We acknowledge that there are differences between emission inventories. Coal and oil and gas emissions in EDGARv6.0 differ from GAINS emissions in magnitude and trend in latitudinal bands. The total global emissions for coal and oil and gas in GAINS are 3.4 TgCH 4 yr 1 and 5.5 TgCH 4 yr 1 higher than in EDGAR v6.0, respectively. However, the global increasing trend for oil and gas from 2000–2006 to 2014–2020 is almost 50% smaller than for EDGAR v6.0. For coal, the increasing trend from 2000–2006 to 2007–2020 is similar to EDGAR v6.0. For example, at the latitudes EQ–30 N, the oil and gas emissions are 6.6 TgCH 4 yr 1 lower in GAINS, but coal emissions are 1.7 TgCH 4 yr 1 higher. Emissions from coal and oil and gas also vary between the EDGAR v6.0, v5.0 [48], and v4.3.2 [47].
The global trend of oil and gas emissions in GAINS according to our COMBO_2 results are consistent with the observed trends, as the results now suggest that oil and gas emissions are overestimated. However, the magnitude of oil and gas emissions in GAINS is larger compared to EDGAR v6.0 or the ORIG posterior. The global increasing trends in agricultural (including EFMM, LWW, and rice) and fossil (including coal and oil and gas) emissions are consistent with other bottom-up estimates by Stavert et al. [61], although different prior emissions were used. However, the total magnitude of fossil emissions in bottom-up estimates is larger than the top-down estimates in Stavert et al. [61], but in this study, the estimated global fossil emissions are, on average, 0.8–1.43 TgCH 4 yr 1 smaller. The estimated agricultural emissions in this study are higher than prior emissions, contradicting the results of Stavert et al. [61].
Lan et al. [15] found that the increasing trend in EDGAR v4.3.2 anthropogenic fossil emissions did not match with the observed δ 13 CH 4 trend when simulated. Similarly, in this study, using EDGAR v6.0, the increasing CH 4 trend in anthropogenic fossil emissions did not match the observed δ 13 CH 4 trend in the simulation. The demonstration by Lan et al. [15] of changing partitioning of fossil and microbial emissions is consistent with our COMBO_2 scenario, where anthropogenic fossil emissions are reduced by 9% and anthropogenic biogenic emissions are increased by 8%. We also performed a TM5 simulation by increasing rice, LWW, and EFMM emissions, such that the biogenic and fossil ratio would increase by 2% (results not shown). However, such an increase would imply an increase of 18% (43.5 Tg yr 1 ) in these emissions, which is outside the uncertainty range [1].
The inversions performed in this study were able to decrease the global coal emissions compared to priors throughout the years (on average 0.8–4.7 TgCH 4 yr 1 ). However, the inversions were unable to decrease global oil and gas emissions, which were 5.88 TgCH 4 yr 1 higher than priors between 2014 and 2020. LWW and EFMM emissions were estimated to be larger tan priors, as suggested by the TM5 results. The inversions were unable to reduce fossil-based emissions enough, nor could they increase the agricultural emissions enough after 2012, but this can be explained by the inversion model’s ability when the prior fluxes used are estimated wrongly, e.g., in magnitude or in spatial distribution. The TM5 results indicate that wetland CH 4 emissions should be optimized separately, as previously carried out by (e.g., [30,31]), and not together with agricultural emissions, as was carried out in this study. Furthermore, the TM5 results indicate that the contributions from biogenic sources to recent CH 4 trends need to be larger, which is consistent with Basu et al. [62]. In this study, we assimilated only CH 4 in the inversion, but there are studies that suggest it could be beneficial to simultaneously assimilate the δ 13 CH 4 and CH 4 [62].
We further acknowledge that temporal changes in isotopic signatures are important to consider when analyzing long-term trends. Seasonal variations have been reported for biogenic sources, such as wetlands [63,64] as well as rice cultivation [65,66,67,68]. Zazzeri et al. [69] reported that the coal source signatures vary depending on coal type, depth, coalification process, mining method, and coal rank. In addition, Liu et al. [70] reported that the δ 13 CH 4 signature changed in four stages during shale gas release. However, only limited data are available, and the signatures used in the study by Feinberg et al. [9] may be misreported.
We can assume that the time-invariant δ 13 CH 4 signatures used in this study are reasonable, since the modeled δ 13 CH 4 trend in the COMBO_2 simulation agrees with the observations. However, we cannot exclude the possibility that the time-invariant signatures could potentially lead to a misinterpretation of the modeled δ 13 CH 4 trend, as previously reported by Ganesan et al. [8] and Kangasaho et al. [44] in seasonal cycle analysis. There are limited studies on source-specific isotopic signatures changing over time (e.g., [71,72]). We did not consider isotopic signatures changing over time, but we acknowledge that this kind of variation may affect trends. We also acknowledge that including δ 2 HCH 3 isotopes would provide additional information for source separation (e.g., [73]). However, there are not enough data available for δ 2 HCH 3 isotopes to be used in this kind of modeling at present.

5. Conclusions

We performed global atmospheric inversions for CH 4 using CarbonTracker-Europe-CH 4 with different optimized emissions for 2000–2020. In addition, we performed a global atmospheric forward modeling analysis for CH 4 and δ 13 CH 4 using the inversion results to investigate which inversions corresponds best with observations.The results of the inversion simulations performed in this study suggest larger LWW and EFMM and lower coal emissions than reported in EDGAR v6.0. This is supported by the results obtained with TM5 when analyzing the δ 13 CH 4 trends at different stations.
The results for TM5 indicate that the inversion obtained using EDGAR v6.0 emissions after 2012 is not able to reproduce the correct trend, in line with observations. The results of this study indicate that fossil-based emissions (coal, oil and gas, and residential) are overestimated by approximately 9% (approx. 12.31 Tg yr 1 ), and biogenic emissions (rice, LWW, and EFMM) emissions are underestimated by approximately 8% (approx. 19.52 Tg yr 1 ), after 2012 in the inversion using EDGAR v6.0. Interestingly, the modification of only CH 4 wetland emissions to produce a stronger decreasing δ 13 CH 4 trend, similar to observation results, in a CH 4 trend that is inconsistent with the observed CH 4 trend. This suggests that other emission sources, in addition to wetland emissions, should be modified despite the large uncertainty range of the wetland emissions. This study shows that the contribution of biogenic emissions needs to be larger after 2012 than what is in EDGAR v6.0. Furthermore, this study emphasizes the crucial role of the grouping of the optimized CH 4 emissions in atmospheric inversions to reproduce the observed δ 13 CH 4 trends from the CH 4 inversion results.
Despite the different optimized categories for CH 4 inversions, the modeled trend in TM5 for CH 4 did not differ much between simulations. However, there were differences in the modeled δ 13 CH 4 trends. When agricultural emissions are not included in the optimized biospheric CH 4 emissions, the modeled CH 4 and δ 13 CH 4 trends in TM5 agree better with the observations. Therefore, based on this study, it is recommended that CH 4 biospheric emissions are optimized with wetland emissions only, emission components are optimized individually, or, alternatively, the relationship between the emission components is traced to produce realistic trends for CH 4 and δ 13 CH 4 . The results also show how sensitive the δ 13 CH 4 trend is to the correct CH 4 emissions, highlighting the importance of the CH 4 emissions used for simulations.
More research regarding δ 13 CH 4 signatures that possibly vary over time (periodically, seasonally or intermittently) would improve the understanding of the global CH 4 budget. In the future, more comprehensive research is needed on emissions inventories and how they match with the observed δ 13 CH 4 trend. As shown by this study, the emission inventories may be inconsistent with the observed δ 13 CH 4 trend, despite agreeing with the CH 4 trend. In the future, it would be worth investigating what additional information on source separation could be attained by simultaneously assimilating CH 4 and δ 13 CH 4 in inversion. In addition, it would be fruitful to investigate the reasons behind the observed trends of CH 4 and δ 13 CH 4 in more detail.

Supplementary Materials

The following supporting information can be downloaded at: https://www.mdpi.com/article/10.3390/atmos14071121/s1, Figure S1: 90° S–30° S prior and posterior CH 4 emissions by sector; Figure S2: 30° S–EQ prior and posterior CH 4 emissions by sector. Figure S3: EQ–30° N prior and posterior CH 4 emissions by sector; Figure S4: 30° N–60° N prior and posterior CH 4 emissions by sector; Figure S5: 60° N–90° N prior and posterior CH 4 emissions by sector; Figure S6: Difference in prior and posterior emissions at 90° S–30° S from three different inversions compared to years 2000–2006; Figure S7: Difference in prior and posterior emissions at 60° N–90° N from three different inversions compared to years 2000–2006; Figure S8: Anomalies in the CH 4 and δ 13 CH 4 trend at Alert, Canada; Figure S9: Anomalies in the CH 4 and δ 13 CH 4 trend at Terceira Island, Azores, Portugal; Figure S10: Anomalies in the CH 4 and δ 13 CH 4 trend at Tae-ahn Peninsula, Republic of Korea; Figure S11: Anomalies in the CH 4 and δ 13 CH 4 trend at Mt. Waliguan, Peoples Republic of China; Figure S12: Anomalies in the CH 4 and δ 13 CH 4 trend at Cape Kumukahi, Hawaii, United States; Figure S13: Anomalies in the CH 4 and δ 13 CH 4 trend at Mauna Loa, Hawaii, United States; Figure S14: Anomalies in the CH 4 and δ 13 CH 4 trend at Ascension Island, United Kingdom; Figure S15: Anomalies in the CH 4 and δ 13 CH 4 trend at Tutuila, American Samoa; Figure S16: Anomalies in the CH 4 and δ 13 CH 4 trend at Cape Grim, Tasmania, Australia; Table S1: List of stations; Table S2: Annual mean CH 4 emissions for 30° latitudinal bands during 2000–2020; Table S3: Posterior mean emissions for 30 degree latitudinal bands for different time periods.

Author Contributions

V.M., A.T. and T.A. designed the experiments. V.M. and A.T. developed the model code with help from L.B., S.H., A.S. and M.K. V.M. performed the simulations. V.M., A.T., L.B. and T.A. performed the analysis. X.L., E.J.D., S.M. and J.W.C.W. provided the observational data. M.S., B.P. and Z.Z. provided processed emissions inputs. V.M. prepared the manuscript with contributions from all co-authors. All authors have read and agreed to the published version of the manuscript.

Funding

We would like to thank Magnus Ehrnrooth Foundation, Academy of Finland (307331 UPFORMET), and EU-H2020 VERIFY. The VERIFY project has received funding from the European Union’s Horizon 2020 research and innovation program under grant agreement No. 776810. Maarten Krol is supported by funding from the European Research Council (ERC) under the European Union’s Horizon 2020 research and innovation program under grant agreement No. 742798.

Institutional Review Board Statement

Not applicable.

Informed Consent Statement

Not applicable.

Data Availability Statement

The atmospheric CH 4 and δ 13 C measurements are available from the NOAA/GML data Server accessed on 1 April 2023 https://www.esrl.noaa.gov/gmd/dv/data/ (accessed on 22 April 2023).

Acknowledgments

We acknowledge obspack_ch4_1_GLOBALVIEWplus_v5.0_2022-10-17 providers fo their valuable work: Kenneth N. Schuldt, Tuula Aalto, Arlyn Andrews, Shuji Aoki, Francesco Apadula, Jgor Arduini, Bianca Baier, Jakub Bartyzel, Peter Bergamaschi, Tobias Biermann, Sebastien C. Biraud, Harald Boenisch, Gordon Brailsford, Willi A. Brand, Huilin Chen, Aurelie Colomb, Sébastien Conil, Cedric Couret, Paolo Cristofanelli, Emilio Cuevas, Bruce Daube, Kenneth Davis, Martine De Mazière, Marc Delmotte, Ankur Desai, Joshua P. DiGangi, Ed Dlugokencky, James W. Elkins, Lukas Emmenegger, Marc L. Fischer, Grant Forster, Luciana V. Gatti, Torsten Gehrlein, Christoph Gerbig, Emanuel Gloor, Daisuke Goto, László Haszpra, Juha Hatakka, Martin Heimann, Michal Heliasz, Daniela Heltai, Ove Hermanssen, Eric Hintsa, Antje Hoheisel, Jutta Holst, Viktor Ivakhov, Dan Jaffe, Armin Jordan, Warren Joubert, Hui-Yun Kang, Anna Karion, Victor Kazan, Ralph Keeling, Petri Keronen, Bert Kers, Jooil Kim, Tobias Kneuer, Mi-Young Ko, Katerina Kominkova, Eric Kort, Elena Kozlova, Paul Krummel, Dagmar Kubistin, Casper Labuschagne, Xin Lan, Ray Langenfelds, Olivier Laurent, Tuomas Laurila, Thomas Lauvaux, Jost Lavric, Choong-Hoon Lee, Haeyoung Lee, John Lee, Irene Lehner, Kari Lehtinen, Reimo Leppert, Ari Leskinen, Markus Leuenberger, Matthias Lindauer, Zoe Loh, Morgan Lopez, David Lowry, Chris R. Lunder, Toshinobu Machida, Ivan Mammarella, Giovanni Manca, Michal V. Marek, Melissa Y. Martin, Giordane A. Martins, Hidekazu Matsueda, Kathryn McKain, Frank Meinhardt, Malika Menoud, Natasha Miles, Charles E. Miller, John B. Miller, Vanessa Monteiro, Fred Moore, Heiko Moossen, Eric Morgan, Shinji Morimoto, David Munro, Cathrine L. Myhre, Meelis Mölder, Jenifer Müller-Williams, Jaroslaw Necki, Sylvia Nichol, Euan Nisbet, Yosuke Niwa, Simon O’Doherty, Florian Obersteiner, Salvatore Piacentino, Jean M. Pichon, Joseph Pitt, Jasna Pittman, Christian Plass-Duelmer, Stephen M. Platt, Maria E. Popa, Steve Prinzivalli, Michel Ramonet, Scott Richardson, Pedro P. Rivas, Michael Rothe, Thomas Röckmann, Kazuyuki Saito, Greg Santoni, Motoki Sasakawa, Bert Scheeren, Martina Schmidt, Tanja Schuck, Marcus Schumacher, Thomas Seifert, Mahesh K. Sha, Paul Shepson, Christopher D. Sloop, Paul Smith, Mila Stanisavljević, Martin Steinbacher, Britton Stephens, Colm Sweeney, Lise L. Sørensen, Kirk Thoning, Helder Timas, Margaret Torn, Pamela Trisolino, Jocelyn Turnbull, Kjetil Tørseth, Brian Viner, Gabriela Vitkova, Andrew Watson, Ray Weiss, Steve Wofsy, Justin Worsey, Doug Worthy, Sönke Zaehle, Andreas Zahn, Giulia Zazzeri, Rodrigo A. de Souza, Marcel de Vries, Alcide G. di Sarra, Carina van der Veen; Multi-laboratory compilation of atmospheric methane data for the period 1983–2021; obspack_ch4_1_GLOBALVIEWplus_v5.0_2022-10-17; NOAA Earth System Research Laboratory, Global Monitoring Laboratory. https://doi.org/10.25925/20221001. (Server accessed on 1 April 2023) We also acknowledge the Stable Isotopic Composition of Atmospheric Methane (13C) from the NOAA GML Carbon Cycle Cooperative Global Air Sampling Network, 1998–2021 (Michel, S.E., Clark, J.R., Vaughn, B.H., Crotwell, M., Madronich, M., Moglia, E., Neff, D., Mund, J. (2022), University of Colorado, Institute of Arctic and Alpine Research (INSTAAR). Stable Isotopic Composition of Atmospheric Methane (13C) from the NOAA GML Carbon Cycle Cooperative Global Air Sampling Network, 1998–2021. Version: 2022-12-15 https://doi.org/10.15138/9p89-1x02 (Server accessed on 1 April 2023).

Conflicts of Interest

The authors declare no conflict of interest. The funders had no role in the design of the study; in the collection, analyses, or interpretation of data; in the writing of the manuscript; or in the decision to publish the results.

Abbreviations

The following abbreviations are used in this manuscript:
CTE-CHCH 4 CarbonTracker-Europe-CH 4
EnKFEnsemble Kalman Filter
ECMWFEuropean Centre for Medium-Range Weather Forecasts
KIEKinetic isotopic effect
EDGAREmissions Database for Global Atmospheric Research
LWWLandfills and waste water treatment
EFMMEnteric Fermentation and Manure Managemnt
GFEDGlobal Fire Emissions Database
IPCCIntergovernmental Panel on Climate Change
NOAA/GMLNational Oceanic and Atmospheric Administration Global Monitoring Laboratory
INSTAARInstitute of Arctic and Alpine Research
BRWBarrow
MHDMace Head
NWRNiwot Ridge
SPOSouth Pole

References

  1. Saunois, M.; Stavert, A.R.; Poulter, B.; Bousquet, P.; Canadell, J.G.; Jackson, R.B.; Raymond, P.A.; Dlugokencky, E.J.; Houweling, S.; Patra, P.K.; et al. The Global Methane Budget 2000–2017. Earth Syst. Sci. Data 2020, 12, 1561–1623. [Google Scholar] [CrossRef]
  2. Bergamaschi, P.; Karstens, U.; Manning, A.J.; Saunois, M.; Tsuruta, A.; Berchet, A.; Vermeulen, A.T.; Arnold, T.; Janssens-Maenhout, G.; Hammer, S.; et al. Inverse modelling of European CH4 emissions during 2006–2012 using different inverse models and reassessed atmospheric observations. Atmos. Chem. Phys. 2018, 18, 901–920. [Google Scholar] [CrossRef] [Green Version]
  3. Tsuruta, A.; Aalto, T.; Backman, L.; Krol, M.C.; Peters, W.; Lienert, S.; Joos, F.; Miller, P.A.; Zhang, W.; Laurila, T.; et al. Methane budget estimates in Finland from the CarbonTracker Europe-CH4 data assimilation system. Tellus B Chem. Phys. Meteorol. 2019, 71, 1565030. [Google Scholar] [CrossRef] [Green Version]
  4. Dlugokencky, E.J.; Nisbet, E.G.; Fisher, R.; Lowry, D. Global atmospheric methane: Budget, changes and dangers. Philos. Trans. R. Soc. A Math. Phys. Eng. Sci. 2011, 369, 2058–2072. [Google Scholar] [CrossRef] [PubMed] [Green Version]
  5. Nisbet, E.G.; Dlugokencky, E.J.; Manning, M.R.; Lowry, D.; Fisher, R.E.; France, J.L.; Michel, S.E.; Miller, J.B.; White, J.W.C.; Vaughn, B.; et al. Rising atmospheric methane: 2007–2014 growth and isotopic shift. Glob. Biogeochem. Cycles 2016, 30, 1356–1370. [Google Scholar] [CrossRef] [Green Version]
  6. Sherwood, O.A.; Schwietzke, S.; Arling, V.A.; Etiope, G. Global Inventory of Gas Geochemistry Data from Fossil Fuel, Microbial and Burning Sources, version 2017. Earth Syst. Sci. Data 2017, 9, 639–656. [Google Scholar] [CrossRef] [Green Version]
  7. Schwietzke, S.; Sherwood, O.A.; Bruhwiler, L.M.P.; Miller, J.B.; Etiope, G.; Dlugokencky, E.J.; Michel, S.E.; Arling, V.A.; Vaughn, B.H.; White, J.W.C.; et al. Upward revision of global fossil fuel methane emissions based on isotope database. Nature 2016, 538, 88–91. [Google Scholar] [CrossRef]
  8. Ganesan, A.L.; Stell, A.C.; Gedney, N.; Comyn-Platt, E.; Hayman, G.; Rigby, M.; Poulter, B.; Hornibrook, E.R.C. Spatially Resolved Isotopic Source Signatures of Wetland Methane Emissions. Geophys. Res. Lett. 2018, 45, 3737–3745. [Google Scholar] [CrossRef]
  9. Feinberg, A.I.; Coulon, A.; Stenke, A.; Schwietzke, S.; Peter, T. Isotopic source signatures: Impact of regional variability on the δ13CH4 trend and spatial distribution. Atmos. Environ. 2018, 174, 99–111. [Google Scholar] [CrossRef]
  10. Etiope, G.; Ciotoli, G.; Schwietzke, S.; Schoell, M. Gridded maps of geological methane emissions and their isotopic signature. Earth Syst. Sci. Data 2019, 11, 1–22. [Google Scholar] [CrossRef] [Green Version]
  11. Brownlow, R.; Lowry, D.; Fisher, R.E.; France, J.L.; Lanoisellé, M.; White, B.; Wooster, M.J.; Zhang, T.; Nisbet, E.G. Isotopic Ratios of Tropical Methane Emissions by Atmospheric Measurement: Tropical Methane δ13 C Source Signatures. Glob. Biogeochem. Cycles 2017, 31, 1408–1419. [Google Scholar] [CrossRef] [Green Version]
  12. Houweling, S.; Krol, M.; Bergamaschi, P.; Frankenberg, C.; Dlugokencky, E.J.; Morino, I.; Notholt, J.; Sherlock, V.; Wunch, D.; Beck, V.; et al. A multi-year methane inversion using SCIAMACHY, accounting for systematic errors using TCCON measurements. Atmos. Chem. Phys. 2014, 14, 3991–4012. [Google Scholar] [CrossRef] [Green Version]
  13. Thompson, R.L.; Nisbet, E.G.; Pisso, I.; Stohl, A.; Blake, D.; Dlugokencky, E.J.; Helmig, D.; White, J.W.C. Variability in Atmospheric Methane from Fossil Fuel and Microbial Sources Over the Last Three Decades. Geophys. Res. Lett. 2018, 45, 11499–11508. [Google Scholar] [CrossRef] [Green Version]
  14. Monteil, G.; Houweling, S.; Dlugockenky, E.J.; Maenhout, G.; Vaughn, B.H.; White, J.W.C.; Rockmann, T. Interpreting methane variations in the past two decades using measurements of CH4 mixing ratio and isotopic composition. Atmos. Chem. Phys. 2011, 11, 9141–9153. [Google Scholar] [CrossRef] [Green Version]
  15. Lan, X.; Basu, S.; Schwietzke, S.; Bruhwiler, L.M.P.; Dlugokencky, E.J.; Michel, S.E.; Sherwood, O.A.; Tans, P.P.; Thoning, K.; Etiope, G.; et al. Improved Constraints on Global Methane Emissions and Sinks Using δ13C-CH4. Glob. Biogeochem. Cycles 2021, 35, e2021GB007000. [Google Scholar] [CrossRef]
  16. Saueressig, G.; Crowley, J.N.; Bergamaschi, P.; Brühl, C.; Brenninkmeijer, C.A.M.; Fischer, H. Carbon 13 and D kinetic isotope effects in the reactions of CH4 with O(1D) and OH: New laboratory measurements and their implications for the isotopic composition of stratospheric methane. J. Geophys. Res. Atmos. 2001, 106, 23127–23138. [Google Scholar] [CrossRef]
  17. Cantrell, C.A.; Shetter, R.E.; McDaniel, A.H.; Calvert, J.G.; Davidson, J.A.; Lowe, D.C.; Tyler, S.C.; Cicerone, R.J.; Greenberg, J.P. Carbon kinetic isotope effect in the oxidation of methane by the hydroxyl radical. J. Geophys. Res. Atmos. 1990, 95, 22455–22462. [Google Scholar] [CrossRef] [Green Version]
  18. Allan, W.; Struthers, H.; Lowe, D.C. Methane carbon isotope effects caused by atomic chlorine in the marine boundary layer: Global model results compared with Southern Hemisphere measurements. J. Geophys. Res. Atmos. 2007, 112, D04306. [Google Scholar] [CrossRef]
  19. Hossaini, R.; Chipperfield, M.P.; Saiz-Lopez, A.; Fernandez, R.; Monks, S.; Feng, W.; Brauer, P.; Glasow, R.v. A global model of tropospheric chlorine chemistry: Organic versus inorganic sources and impact on methane oxidation. J. Geophys. Res. Atmos. 2016, 121, 14271–14297. [Google Scholar] [CrossRef] [Green Version]
  20. Gromov, S.; Brenninkmeijer, C.A.M.; Jöckel, P. A very limited role of tropospheric chlorine as a sink of the greenhouse gas methane. Atmos. Chem. Phys. 2018, 18, 9831–9843. [Google Scholar] [CrossRef] [Green Version]
  21. Lassey, K.; Ragnauth, S. Balancing the global methane budget: Constraints imposed by isotopes and anthropogenic emission inventories. J. Integr. Environ. Sci. 2010, 7, 97–107. [Google Scholar] [CrossRef] [Green Version]
  22. Zhang, Y.; Jacob, D.J.; Lu, X.; Maasakkers, J.D.; Scarpelli, T.R.; Sheng, J.X.; Shen, L.; Qu, Z.; Sulprizio, M.P.; Chang, J.; et al. Attribution of the accelerating increase in atmospheric methane during 2010–2018 by inverse analysis of GOSAT observations. Atmos. Chem. Phys. 2021, 21, 3643–3666. [Google Scholar] [CrossRef]
  23. Milkov, A.V.; Schwietzke, S.; Allen, G.; Sherwood, O.A.; Etiope, G. Using global isotopic data to constrain the role of shale gas production in recent increases in atmospheric methane. Sci. Rep. 2020, 10, 4199. [Google Scholar] [CrossRef] [Green Version]
  24. Yin, Y.; Chevallier, F.; Ciais, P.; Bousquet, P.; Saunois, M.; Zheng, B.; Worden, J.; Bloom, A.A.; Parker, R.J.; Jacob, D.J.; et al. Accelerating methane growth rate from 2010 to 2017: Leading contributions from the tropics and East Asia. Atmos. Chem. Phys. 2021, 21, 12631–12647. [Google Scholar] [CrossRef]
  25. Schaefer, H.; Fletcher, S.E.M.; Veidt, C.; Lassey, K.R.; Brailsford, G.W.; Bromley, T.M.; Dlugokencky, E.J.; Michel, S.E.; Miller, J.B.; Levin, I.; et al. A 21st-century shift from fossil-fuel to biogenic methane emissions indicated by 13CH4. Science 2016, 352, 80–84. [Google Scholar] [CrossRef] [PubMed]
  26. Fujita, R.; Morimoto, S.; Maksyutov, S.; Kim, H.S.; Arshinov, M.; Brailsford, G.; Aoki, S.; Nakazawa, T. Global and Regional CH4 Emissions for 1995–2013 Derived From Atmospheric CH4, δ13C-CH4, and δD-CH4 Observations and a Chemical Transport Model. J. Geophys. Res. Atmos. 2020, 125, e2020JD032903. [Google Scholar] [CrossRef]
  27. Zhang, Z.; Poulter, B.; Knox, S.; Stavert, A.; McNicol, G.; Fluet-Chouinard, E.; Feinberg, A.; Zhao, Y.; Bousquet, P.; Canadell, J.G.; et al. Anthropogenic emission is the main contributor to the rise of atmospheric methane during 1993–2017. Natl. Sci. Rev. 2021, 9, nwab200. [Google Scholar] [CrossRef]
  28. Bousquet, P.; Ringeval, B.; Pison, I.; Dlugokencky, E.J.; Brunke, E.G.; Carouge, C.; Chevallier, F.; Fortems-Cheiney, A.; Frankenberg, C.; Hauglustaine, D.A.; et al. Source attribution of the changes in atmospheric methane for 2006–2008. Atmos. Chem. Phys. 2011, 11, 3689–3700. [Google Scholar] [CrossRef] [Green Version]
  29. Dlugokencky, E.J.; Bruhwiler, L.; White, J.W.C.; Emmons, L.K.; Novelli, P.C.; Montzka, S.A.; Masarie, K.A.; Lang, P.M.; Crotwell, A.M.; Miller, J.B.; et al. Observational constraints on recent increases in the atmospheric CH4 burden. Geophys. Res. Lett. 2009, 36, L18803. [Google Scholar] [CrossRef] [Green Version]
  30. Tsuruta, A.; Aalto, T.; Backman, L.; Hakkarainen, J.; Laan-Luijkx, I.T.v.d.; Krol, M.C.; Spahni, R.; Houweling, S.; Laine, M.; Dlugokencky, E.; et al. Global methane emission estimates for 2000–2012 from CarbonTracker Europe-CH4 v1.0. Geosci. Model Dev. 2017, 10, 1261–1289. [Google Scholar] [CrossRef] [Green Version]
  31. Bergamaschi, P.; Segers, A.; Brunner, D.; Haussaire, J.M.; Henne, S.; Ramonet, M.; Arnold, T.; Biermann, T.; Chen, H.; Conil, S.; et al. High-resolution inverse modelling of European CH4 emissions using the novel FLEXPART-COSMO TM5 4DVAR inverse modelling system. Atmos. Chem. Phys. 2022, 22, 13243–13268. [Google Scholar] [CrossRef]
  32. Peters, W.; Miller, J.B.; Whitaker, J.; Denning, A.S.; Hirsch, A.; Krol, M.C.; Zupanski, D.; Bruhwiler, L.; Tans, P.P. An ensemble data assimilation system to estimate CO2 surface fluxes from atmospheric trace gas observations. J. Geophys. Res. Atmos. 2005, 110, D24304. [Google Scholar] [CrossRef] [Green Version]
  33. Van der Laan-Luijkx, I.T.; van der Velde, I.R.; van der Veen, E.; Tsuruta, A.; Stanislawska, K.; Babenhauserheide, A.; Zhang, H.F.; Liu, Y.; He, W.; Chen, H.; et al. The CarbonTracker Data Assimilation Shell (CTDAS) v1.0: Implementation and global carbon balance 2001–2015. Geosci. Model Dev. 2017, 10, 2785–2800. [Google Scholar] [CrossRef] [Green Version]
  34. Krol, M.; Houweling, S.; Bregman, B.; Broek, M.v.d.; Segers, A.; Velthoven, P.v.; Peters, W.; Dentener, F.; Bergamaschi, P. The two-way nested global chemistry-transport zoom model TM5: Algorithm and applications. Atmos. Chem. Phys. 2005, 5, 417–432. [Google Scholar] [CrossRef] [Green Version]
  35. Tenkanen, M.; Tsuruta, A.; Rautiainen, K.; Kangasaho, V.; Ellul, R.; Aalto, T. Utilizing Earth Observations of Soil Freeze/Thaw Data and Atmospheric Concentrations to Estimate Cold Season Methane Emissions in the Northern High Latitudes. Remote Sens. 2021, 13, 5059. [Google Scholar] [CrossRef]
  36. Spivakovsky, C.M.; Logan, J.A.; Montzka, S.A.; Balkanski, Y.J.; Foreman-Fowler, M.; Jones, D.B.A.; Horowitz, L.W.; Fusco, A.C.; Brenninkmeijer, C.a.M.; Prather, M.J.; et al. Three-dimensional climatological distribution of tropospheric OH: Update and evaluation. J. Geophys. Res. Atmos. 2000, 105, 8931–8980. [Google Scholar] [CrossRef]
  37. Huijnen, V.; Williams, J.; van Weele, M.; van Noije, T.; Krol, M.; Dentener, F.; Segers, A.; Houweling, S.; Peters, W.; de Laat, J.; et al. The global chemistry transport model TM5: Description and evaluation of the tropospheric chemistry version 3.0. Geosci. Model Dev. 2010, 3, 445–473. [Google Scholar] [CrossRef] [Green Version]
  38. Jöckel, P.; Tost, H.; Pozzer, A.; Brühl, C.; Buchholz, J.; Ganzeveld, L.; Hoor, P.; Kerkweg, A.; Lawrence, M.n.G. The atmospheric chemistry general circulation model ECHAM5/MESSy1: Consistent simulation of ozone from the surface to the mesosphere. Atmos. Chem. Phys. 2006, 6, 5067–5104. [Google Scholar] [CrossRef] [Green Version]
  39. Zhao, Y.; Saunois, M.; Bousquet, P.; Lin, X.; Berchet, A.; Hegglin, M.I.; Canadell, J.G.; Jackson, R.B.; Hauglustaine, D.A.; Szopa, S.; et al. Inter-model comparison of global hydroxyl radical (OH) distributions and their impact on atmospheric methane over the 2000–2016 period. Atmos. Chem. Phys. 2019, 19, 13701–13723. [Google Scholar] [CrossRef] [Green Version]
  40. Turner, A.J.; Frankenberg, C.; Kort, E.A. Interpreting contemporary trends in atmospheric methane. Proc. Natl. Acad. Sci. USA 2019, 116, 2805–2813. [Google Scholar] [CrossRef] [Green Version]
  41. Rowlinson, M.J.; Rap, A.; Arnold, S.R.; Pope, R.J.; Chipperfield, M.P.; McNorton, J.; Forster, P.; Gordon, H.; Pringle, K.J.; Feng, W.; et al. Impact of El Niño–Southern Oscillation on the interannual variability of methane and tropospheric ozone. Atmos. Chem. Phys. 2019, 19, 8669–8686. [Google Scholar] [CrossRef] [Green Version]
  42. Crowley, J.N.; Saueressig, G.; Bergamaschi, P.; Fischer, H.; Harris, G.W. Carbon kinetic isotope effect in the reaction CH4+Cl: A relative rate study using FTIR spectroscopy. Chem. Phys. Lett. 1999, 303, 268–274. [Google Scholar] [CrossRef] [Green Version]
  43. Spahni, R.; Wania, R.; Neef, L.; van Weele, M.; Pison, I.; Bousquet, P.; Frankenberg, C.; Foster, P.N.; Joos, F.; Prentice, I.C.; et al. Constraining global methane emissions and uptake by ecosystems. Biogeosciences 2011, 8, 1643–1665. [Google Scholar] [CrossRef] [Green Version]
  44. Kangasaho, V.; Tsuruta, A.; Backman, L.; Mäkinen, P.; Houweling, S.; Segers, A.; Krol, M.; Dlugokencky, E.J.; Michel, S.; White, J.W.C.; et al. The Role of Emission Sources and Atmospheric Sink in the Seasonal Cycle of CH4 and δ;13-CH4: Analysis Based on the Atmospheric Chemistry Transport Model TM5. Atmosphere 2022, 13, 888. [Google Scholar] [CrossRef]
  45. Snover, A.K.; Quay, P.D. Hydrogen and carbon kinetic isotope effects during soil uptake of atmospheric methane. Glob. Biogeochem. Cycles 2000, 14, 25–39. [Google Scholar] [CrossRef]
  46. De Laeter, J.R.; Böhlke, J.K.; Bièvre, P.D.; Hidaka, H.; Peiser, H.S.; Rosman, K.J.R.; Taylor, P.D.P. Atomic weights of the elements. Review 2000 (IUPAC Technical Report). Pure Appl. Chem. 2003, 75, 683–800. [Google Scholar] [CrossRef]
  47. Janssens-Maenhout, G.; Crippa, M.; Guizzardi, D.; Muntean, M.; Schaaf, E.; Dentener, F.; Bergamaschi, P.; Pagliari, V.; Olivier, J.G.J.; Peters, J.A.H.W.; et al. EDGAR v4.3.2 Global Atlas of the three major greenhouse gas emissions for the period 1970–2012. Earth Syst. Sci. Data 2019, 11, 959–1002. [Google Scholar] [CrossRef] [Green Version]
  48. Crippa, M.; Solazzo, E.; Huang, G.; Guizzardi, D.; Koffi, E.; Muntean, M.; Schieberle, C.; Friedrich, R.; Janssens-Maenhout, G. High resolution temporal profiles in the Emissions Database for Global Atmospheric Research. Sci. Data 2020, 7, 121. [Google Scholar] [CrossRef] [Green Version]
  49. Giglio, L.; Randerson, J.T.; van der Werf, G.R. Analysis of daily, monthly, and annual burned area using the fourth-generation global fire emissions database (GFED4). J. Geophys. Res. Biogeosci. 2013, 118, 317–328. [Google Scholar] [CrossRef] [Green Version]
  50. Weber, T.; Wiseman, N.A.; Kock, A. Global ocean methane emissions dominated by shallow coastal waters. Nat. Commun. 2019, 10, 4584. [Google Scholar] [CrossRef] [Green Version]
  51. Contribution of Working Group I to the Sixth Assessment Report of the Intergovernmental Panel on Climate Change. In Climate Change 2021: The Physical Science Basis; Masson-Delmotte, V.; Zhai, P.; Pirani, A.; Connors, S.; Péan, C.; Berger, S.; Caud, N.; Chen, Y.; Goldfarb, L.; Gomis, M.; et al. (Eds.) Cambridge University Press: Cambridge, UK; New York, NY, USA, 2021. [Google Scholar] [CrossRef]
  52. Schuldt, K.N.; Aalto, T.; Andrews, A.; Aoki, S.; Apadula, F.; Arduini, J.; Baier, B.; Bartyzel, J.; Bergamaschi, P.; Biermann, T.; et al. Multi-Laboratory Compilation of Atmospheric Carbon Dioxide Data for the Period 1957–2022: Data Set; NOAA: Boulder, CO, USA, 2022. [Google Scholar] [CrossRef]
  53. Stable Isotopic Composition of Atmospheric Methane (13C) from the NOAA GML Carbon Cycle Cooperative Global Air Sampling Network, 1998–2021; Version: 2022-12-15, University of Colorado, Institute of Arctic and Alpine Research (INSTAAR) Data Set; NOAA: Boulder, CO, USA, 2021. [CrossRef]
  54. Guidelines for the Measurement of Methane and Nitrous Oxide and their Quality Assurance; WMO/TD-No. 1478, GAW Report No. 185; WMO: Geneva, Switzerland, 2009.
  55. Miller, J.B.; Mack, K.A.; Dissly, R.; White, J.W.C.; Dlugokencky, E.J.; Tans, P.P. Development of analytical methods and measurements of 13C/12C in atmospheric CH4 from the NOAA Climate Monitoring and Diagnostics Laboratory Global Air Sampling Network. J. Geophys. Res. Atmos. 2002, 107, ACH 11-1–ACH 11-15. [Google Scholar] [CrossRef]
  56. Bruhwiler, L.; Dlugokencky, E.; Masarie, K.; Ishizawa, M.; Andrews, A.; Miller, J.; Sweeney, C.; Tans, P.; Worthy, D. CarbonTracker-CH4: An assimilation system for estimating emissions of atmospheric methane. Atmos. Chem. Phys. 2014, 14, 8269–8293. [Google Scholar] [CrossRef] [Green Version]
  57. Thoning, K.W.; Tans, P.P.; Komhyr, W.D. Atmospheric carbon dioxide at Mauna Loa Observatory: 2. Analysis of the NOAA GMCC data, 1974–1985. J. Geophys. Res. Atmos. 1989, 94, 8549–8565. [Google Scholar] [CrossRef]
  58. Still, C.J.; Berry, J.A.; Collatz, G.J.; DeFries, R.S. Global distribution of C3 and C4 vegetation: Carbon cycle implications. Glob. Biogeochem. Cycles 2003, 17, 6-1–6-14. [Google Scholar] [CrossRef]
  59. Sherwood, O.; Schwietzke, S.; Arling, V.; Etiope, G. Global Inventory of Fossil and Non-fossilMethane δ13C Source Signature Measurements for Improved Atmospheric Modeling. Available online: https://gml.noaa.gov/ccgg/arc/index.php?id=134 (accessed on 1 April 2023).
  60. Bakkaloglu, S.; Lowry, D.; Fisher, R.E.; Menoud, M.; Lanoisellé, M.; Chen, H.; Röckmann, T.; Nisbet, E.G. Stable isotopic signatures of methane from waste sources through atmospheric measurements. Atmos. Environ. 2022, 276, 119021. [Google Scholar] [CrossRef]
  61. Stavert, A.R.; Saunois, M.; Canadell, J.G.; Poulter, B.; Jackson, R.B.; Regnier, P.; Lauerwald, R.; Raymond, P.A.; Allen, G.H.; Patra, P.K.; et al. Regional trends and drivers of the global methane budget. Glob. Chang. Biol. 2022, 28, 182–200. [Google Scholar] [CrossRef]
  62. Basu, S.; Lan, X.; Dlugokencky, E.; Michel, S.; Schwietzke, S.; Miller, J.B.; Bruhwiler, L.; Oh, Y.; Tans, P.P.; Apadula, F.; et al. Estimating emissions of methane consistent with atmospheric measurements of methane and δ13C of methane. Atmos. Chem. Phys. 2022, 22, 15351–15377. [Google Scholar] [CrossRef]
  63. Fisher, R.E.; France, J.L.; Lowry, D.; Lanoisellé, M.; Brownlow, R.; Pyle, J.A.; Cain, M.; Warwick, N.; Skiba, U.M.; Drewer, J.; et al. Measurement of the 13C isotopic signature of methane emissions from northern European wetlands. Glob. Biogeochem. Cycles 2017, 31, 605–623. [Google Scholar] [CrossRef] [Green Version]
  64. Sriskantharajah, S.; Fisher, R.E.; Lowry, D.; Aalto, T.; Hatakka, J.; Aurela, M.; Laurila, T.; Lohila, A.; Kuitunen, E.; Nisbet, E.G. Stable carbon isotope signatures of methane from a Finnish subarctic wetland. Tellus B Chem. Phys. Meteorol. 2012, 64, 18818. [Google Scholar] [CrossRef]
  65. Tyler, S.C.; Brailsford, G.W.; Yagi, K.; Minami, K.; Cicerone, R.J. Seasonal variations in methane flux and δl3CH4 values for rice paddies in Japan and their implications. Glob. Biogeochem. Cycles 1994, 8, 1–12. [Google Scholar] [CrossRef] [Green Version]
  66. Bergamaschi, P. Seasonal variations of stable hydrogen and carbon isotope ratios in methane from a Chinese rice paddy. J. Geophys. Res. Atmos. 1997, 102, 25383–25393. [Google Scholar] [CrossRef]
  67. Zhang, G.; Ma, J.; Yang, Y.; Yu, H.; Shi, Y.; Xu, H. Variations of Stable Carbon Isotopes of CH4 Emission from Three Typical Rice Fields in China. Pedosphere 2017, 27, 52–64. [Google Scholar] [CrossRef]
  68. Marik, T.; Fischer, H.; Conen, F.; Smith, K. Seasonal variations in stable carbon and hydrogen isotope ratios in methane from rice fields. Glob. Biogeochem. Cycles 2002, 16, 41-1–41-11. [Google Scholar] [CrossRef]
  69. Zazzeri, G.; Lowry, D.; Fisher, R.E.; France, J.L.; Lanoisellé, M.; Kelly, B.F.J.; Necki, J.M.; Iverach, C.P.; Ginty, E.; Zimnoch, M.; et al. Carbon isotopic signature of coal-derived methane emissions to the atmosphere: From coalification to alteration. Atmos. Chem. Phys. 2016, 16, 13669–13680. [Google Scholar] [CrossRef] [Green Version]
  70. Liu, Y.; Liang, F.; Shang, F.; Wang, Y.; Zhang, Q.; Shen, Z.; Su, C. Carbon isotope fractionation during shale gas release: Experimental results and molecular modeling of mechanisms. Gas Sci. Eng. 2023, 113, 204962. [Google Scholar] [CrossRef]
  71. Chang, J.; Peng, S.; Ciais, P.; Saunois, M.; Dangal, S.R.S.; Herrero, M.; Havlík, P.; Tian, H.; Bousquet, P. Revisiting enteric methane emissions from domestic ruminants and their δ 13 C CH4 source signature. Nat. Commun. 2019, 10, 3420. [Google Scholar] [CrossRef] [Green Version]
  72. Oh, Y.; Zhuang, Q.; Welp, L.R.; Liu, L.; Lan, X.; Basu, S.; Dlugokencky, E.J.; Bruhwiler, L.; Miller, J.B.; Michel, S.E.; et al. Improved global wetland carbon isotopic signatures support post-2006 microbial methane emission increase. Commun. Earth Environ. 2022, 3, 159. [Google Scholar] [CrossRef]
  73. Takriti, M.; Ward, S.E.; Wynn, P.M.; McNamara, N.P. Isotopic characterisation and mobile detection of methane emissions in a heterogeneous UK landscape. Atmos. Environ. 2023, 305, 119774. [Google Scholar] [CrossRef]
Figure 1. Global prior and posterior CH 4 emissions by sector. Solid lines are SET1, dash–dot lines are SET2, and dotted lines are ORIG. Posterior emission are bolded, and prior emissions are presented in gray. For emissions from residential and fires, please note that priors (SET1, SET2 and ORIG) are the same as posteriors for SET1 and SET2.
Atmosphere 14 01121 g001
Figure 2. Difference in prior and posterior emissions globally from three different inversions compared to the years 2000–2006.
Atmosphere 14 01121 g002
Figure 3. Difference in prior and posterior emissions at 30 S–EQ from three different inversions compared to the years 2000–2006.
Atmosphere 14 01121 g003
Figure 4. Difference in prior and posterior emissions at 30 N–60 N from three different inversions compared to the years 2000–2006.
Atmosphere 14 01121 g004
Figure 5. Difference in prior and posterior emissions at EQ–30 N from three different inversions compared to the years 2000–2006.
Atmosphere 14 01121 g005
Figure 6. Anomalies in the CH 4 and δ 13 CH 4 trends at Barrow, Alaska, USA. Different simulations are shown with different colors. Simulations with prior emissions are shown as dashed lines. Note that ORIGpri and SET1pri are the same.
Atmosphere 14 01121 g006
Figure 7. Anomalies in the CH 4 and δ 13 CH 4 trends at Mace Head, Ireland. Different simulations are shown with different colors. Simulations with prior emission are shown as dashed lines. Note that ORIGpri and SET1pri are the same.
Atmosphere 14 01121 g007
Figure 8. Anomalies in the CH 4 and δ 13 CH 4 trends at Niwot Ridge, Colorado, USA. Different simulations are shown with different colors. Simulations with prior emissions are shown as dashed lines. Note that ORIGpri and SET1pri are the same.
Atmosphere 14 01121 g008
Figure 9. Anomalies in the CH 4 and δ 13 CH 4 trends at the South Pole, Antarctica. Different simulations are shown with different colors. Simulations with prior emissions are shown as dashed lines. Note that ORIGpri and SET1pri are the same.
Atmosphere 14 01121 g009
Table 1. List of stations.
StationStation CodeCountryLatitudeLongitudeElevation [m a.s.l.]Intake Height [m a. g.]
BarrowBRWAlaska, USA71.32° N156.61° W11.005–16.5
Mace HeadMHDIreland53.33° N9.9° W5.0021
Niwot RidgeNWRColorado, USA40.05° N105.59° W35263
South PoleSPOAntarctica89.98° S24.8° W2821.33–11.3
Table 2. Isotopic signatures used to convert CH 4 flux fields to 13 CH 4 fields. For spatially varying global values, the ranges of values are shown. Please see Kangasaho et al. [44] for spatial distributions. Isotopic signatures from Monteil et al. [14] are also presented for comparison.
Emission SourceSignature Value (‰)Signature Value (‰)
 (Used in This Study)[14]
Enteric Fermentation and Manure Management (EFMM)[−67.9,−54.5] 1, −66.8 2−62
Landfills and Waste Water Treatment (LWW)−55.6 2−55
Rice (RICE)−62.1 2−63
Coal[−64.1, −36.1] 1, −40 2−35
Oil and Gas[−56.6, −29.1] 1, −40 2−40
Residential−40 2−38
Wetlands[−74.9, −50] 3, −61.3 2−59
Fires[−25, −12] 1, −22.2 2 −21.8
Ocean−47 2−59
Termites−65.2 2−57
Geological[−68, −24.3] 4 , −40 2−40
1 Feinberg et al. [9], 2 Thompson et al. [13], 3 Ganesan et al. [8], 4 Etiope et al. [10].
Table 3. Model setup.
SimulationOptimised (categ1)Optimised (categ2)Not Optimised (categ3)
ORIGcoalwetlandsgeological
 oil and gassoil sinktermites
 agriculture * ocean
 residential  
 fires  
SET1coalagriculture *residential
 oil and gassoil sinkfires
  wetlandsgeological
   termites
   ocean
SET2coalagriculture *residential
 oil and gas fires
   geological
   termites
   ocean
   wetlands
   soil sink
* Agriculture emissions include emissions from rice cultivations, enteric fermentation and manure management (EFMM) and landfills and wastewater treatment (LWW).
Table 4. Different TM5 simulations. Emission sources and modifications to emissions are shown.
SimulationEmissionsModifications
ORIGORIG posteriors 
ORIGpriORIG priors 
SET1SET1 posteriors 
SET1priSET1 priors 
SET2SET2 posteriors 
SET2priSET2 priors 
WETORIG posteriorsAfter 2012: Wetland emissions +29%
COMBO_1ORIG posteriorsAfter 2012: Oil and gas, coal and residential −9%
  EFMM, LWW and Rice +2%
COMBO_2ORIG posteriorsAfter 2012: Oil and gas, coal and residential −9%
  EFMM, LWW and Rice +8%
Disclaimer/Publisher’s Note: The statements, opinions and data contained in all publications are solely those of the individual author(s) and contributor(s) and not of MDPI and/or the editor(s). MDPI and/or the editor(s) disclaim responsibility for any injury to people or property resulting from any ideas, methods, instructions or products referred to in the content.