Article

Study of the Intense Meteorological Event Occurred in September 2022 over the Marche Region with WRF Model: Impact of Lightning Data Assimilation on Rainfall and Lightning Prediction

1
National Research Council of Italy, Institute of Atmospheric Sciences and Climate (CNR-ISAC), Via del Fosso del Cavaliere 100, 00133 Rome, Italy
2
Department of Civil Engineering and Computer Science Engineering, University of Rome “Tor Vergata”, Via del Politecnico, 00133 Rome, Italy
*
Author to whom correspondence should be addressed.
Atmosphere 2023, 14(7), 1152; https://doi.org/10.3390/atmos14071152
Submission received: 5 June 2023 / Revised: 6 July 2023 / Accepted: 12 July 2023 / Published: 15 July 2023
(This article belongs to the Special Issue The Impact of Data Assimilation on Severe Weather Forecast)

Abstract

:
A destructive V-shaped thunderstorm occurred over the Marche Region, in Central Italy, on 15 September 2022. Twelve people died during the event, and damage to properties was extensive because the small Misa River flooded the area. The synoptic-scale conditions that caused this disastrous event are analysed and go back to the presence of tropical cyclone Danielle in the eastern Atlantic. The performance of the weather research and forecasting (WRF) model using lightning data assimilation (LDA) is studied in this case by comparing the forecast with the control forecast without lightning data assimilation. The forecast performance is evaluated for precipitation and lightning. The case was characterised by four intense 3-h (3 h) periods. The forecasts of these four 3-h phases are analysed in a very short-term forecast (VSF) approach, in which a 3 h data assimilation phase is followed by a 3 h forecast. A homemade 3D-Var is used for lightning data assimilation with two different configurations: ANL, in which the lightning is assimilated until the start of the forecasting period, and ANL-1H, which assimilates lightning until 1 h before the 3 h forecasting period. A sensitivity test for the number of analyses used is also discussed. Results show that LDA has a significant and positive impact on the precipitation and lightning forecast for this case.

1. Introduction

Severe precipitation events and flooding are a main concern for their environmental, societal and economic impacts. The IPCC (Intergovernmental Panel for Climate Change) AR6 (sixth assessment report) report [1] indicates that these events have been increasing over Europe since 1950 and will occur more often with the changing climate [2,3,4,5,6].
The Mediterranean area, and Italy in particular, is prone to severe weather events and flooding because of the orography and the presence of a warm sea. These disastrous events are often caused by cyclones, and, in the last decades, efforts have been made to better understand the Mediterranean cyclones not only from a physical and climatic point of view but also from their impacts. The MEDiterranean Experiment (MEDEX) [7] and Hydrological Cycle in the Mediterranean Experiment (HyMeX) [8] initiatives, in particular, were of great importance for the study and characterisation of the Mediterranean cyclones. A recent paper, issued by the COST (European Cooperation in Science and Technology) action 19109 (European network for Mediterranean cyclones in weather and climate (MEDCYCLONES)), reviewed the current knowledge and open questions on Mediterranean cyclones [9].
Heavy precipitation events can be associated with weak or intense synoptic-scale forcing. In the first case, precipitation is associated with deep convection developing in potentially unstable conditions, which occur especially in the summer and fall; in the second case, rainfall is more linked to frontal and synoptic scale development in association with Mediterranean cyclones. Flaounas et al. [10] showed that warm conveyor belt cyclones, characterised by a lower amount of deep convection but by a considerable amount of water vapour at low and mid-tropospheric levels, contribute more than twice the precipitation of deep convective events. A large amount of water vapour is required in heavy precipitation events in the Mediterranean, and sources of water vapour can be the Mediterranean Sea itself [11], but the tropical and extratropical Atlantic Ocean and tropical Africa have been identified as potential sources of moisture [12,13,14,15,16], whose transport may be organised in atmospheric rivers [17]. For example, Davolio et al. [18], showed the importance of the atmospheric river in determining one of the most severe precipitation events over Italy in the last century. In this paper, we highlight the importance of the remnants of tropical cyclone Danielle and the following reorganization of the water vapour given by the atmospheric systems acting over Europe.
Providing timely information about severe weather to take action is of paramount importance in this context, and rapid update cycles of analysis/forecast can be a useful tool to improve the precision of numerical weather prediction (NWP) models forecasts of deep convective and severe weather events [19,20,21].
Lightning data assimilation (LDA) has been widely used to improve the intense precipitation forecast worldwide because of the ability of lightning to precisely locate areas of deep convection. Different techniques have been used for LDA as follows: (a) The forcing of water vapour and other hydrometeors, with both nudging [22,23,24,25,26,27,28] and 3D-Var [21,29,30], (b) retrieving the convective precipitation and latent heat profile by lightning and adjusting the initial three-dimensional thermo-dynamic field of NWP models [31,32], (c) retrieving the radar reflectivity by lightning and assimilating it in NWP models [33,34,35,36], and (d) forcing convection through the adjustment of thermo-dynamical fields [37]. Attempts to suppress spurious convection through lightning data assimilation have also been reported in the literature [38]. All these studies showed different methods to assimilate lightning in NWP, and most of them improved the forecast of intense and/or abundant rainfall typical of convective and severe weather events. Moreover, and by far, most of these studies focus on the short term (0–6 h).
The widespread usage of lightning data assimilation over Italy shows a substantial impact on the precipitation forecast in the very short term (usually 0–3 h) using different NWP models and data assimilation techniques. Starting from the first work of Federico et al. [39], several other works followed [21,28,40], all showing a positive impact of LDA on the precipitation forecast. Among these papers, Torcasio et al. [40] showed the ability of LDA to improve the precipitation forecast not only over the land but also over the Mediterranean Sea. LDA was also used together with radar reflectivity data assimilation [21,41], showing the synergistic action of both data sources for the improvement of deep convective event forecasts.
In this work, the impact of LDA on the precipitation forecast is shown, similarly to previous studies; however, for the first time, we use the 3D-Var of Federico [42], already used to assimilate lightning into the Regional Atmospheric Modelling System (RAMS@ISAC) [21], with the weather research and forecasting (WRF) model.
Recently, Federico et al. [43] showed a successful experiment with lightning forecasting over the Central Mediterranean without performing LDA. In previous studies over the United States, Lynn et al. [44,45,46] showed the capability of LDA to improve the lightning forecast. In this paper, the impact of LDA on the lightning forecast is studied, for the first time, in the specific geographical context of Italy.
The paper is organised as follows: in Section 2 we introduce the synoptic scale on which the storm developed and the precipitation and lightning observations for the four most intense 3 h phases of the storm over the Marche Region. In Section 3, we describe the WRF model configuration and the 3D-Var used for data assimilation. Section 3 also contains a discussion of the methodology used to verify the model’s performance, while Section 4 shows the results. Discussion and conclusions are given in Section 5 and Section 6, respectively.

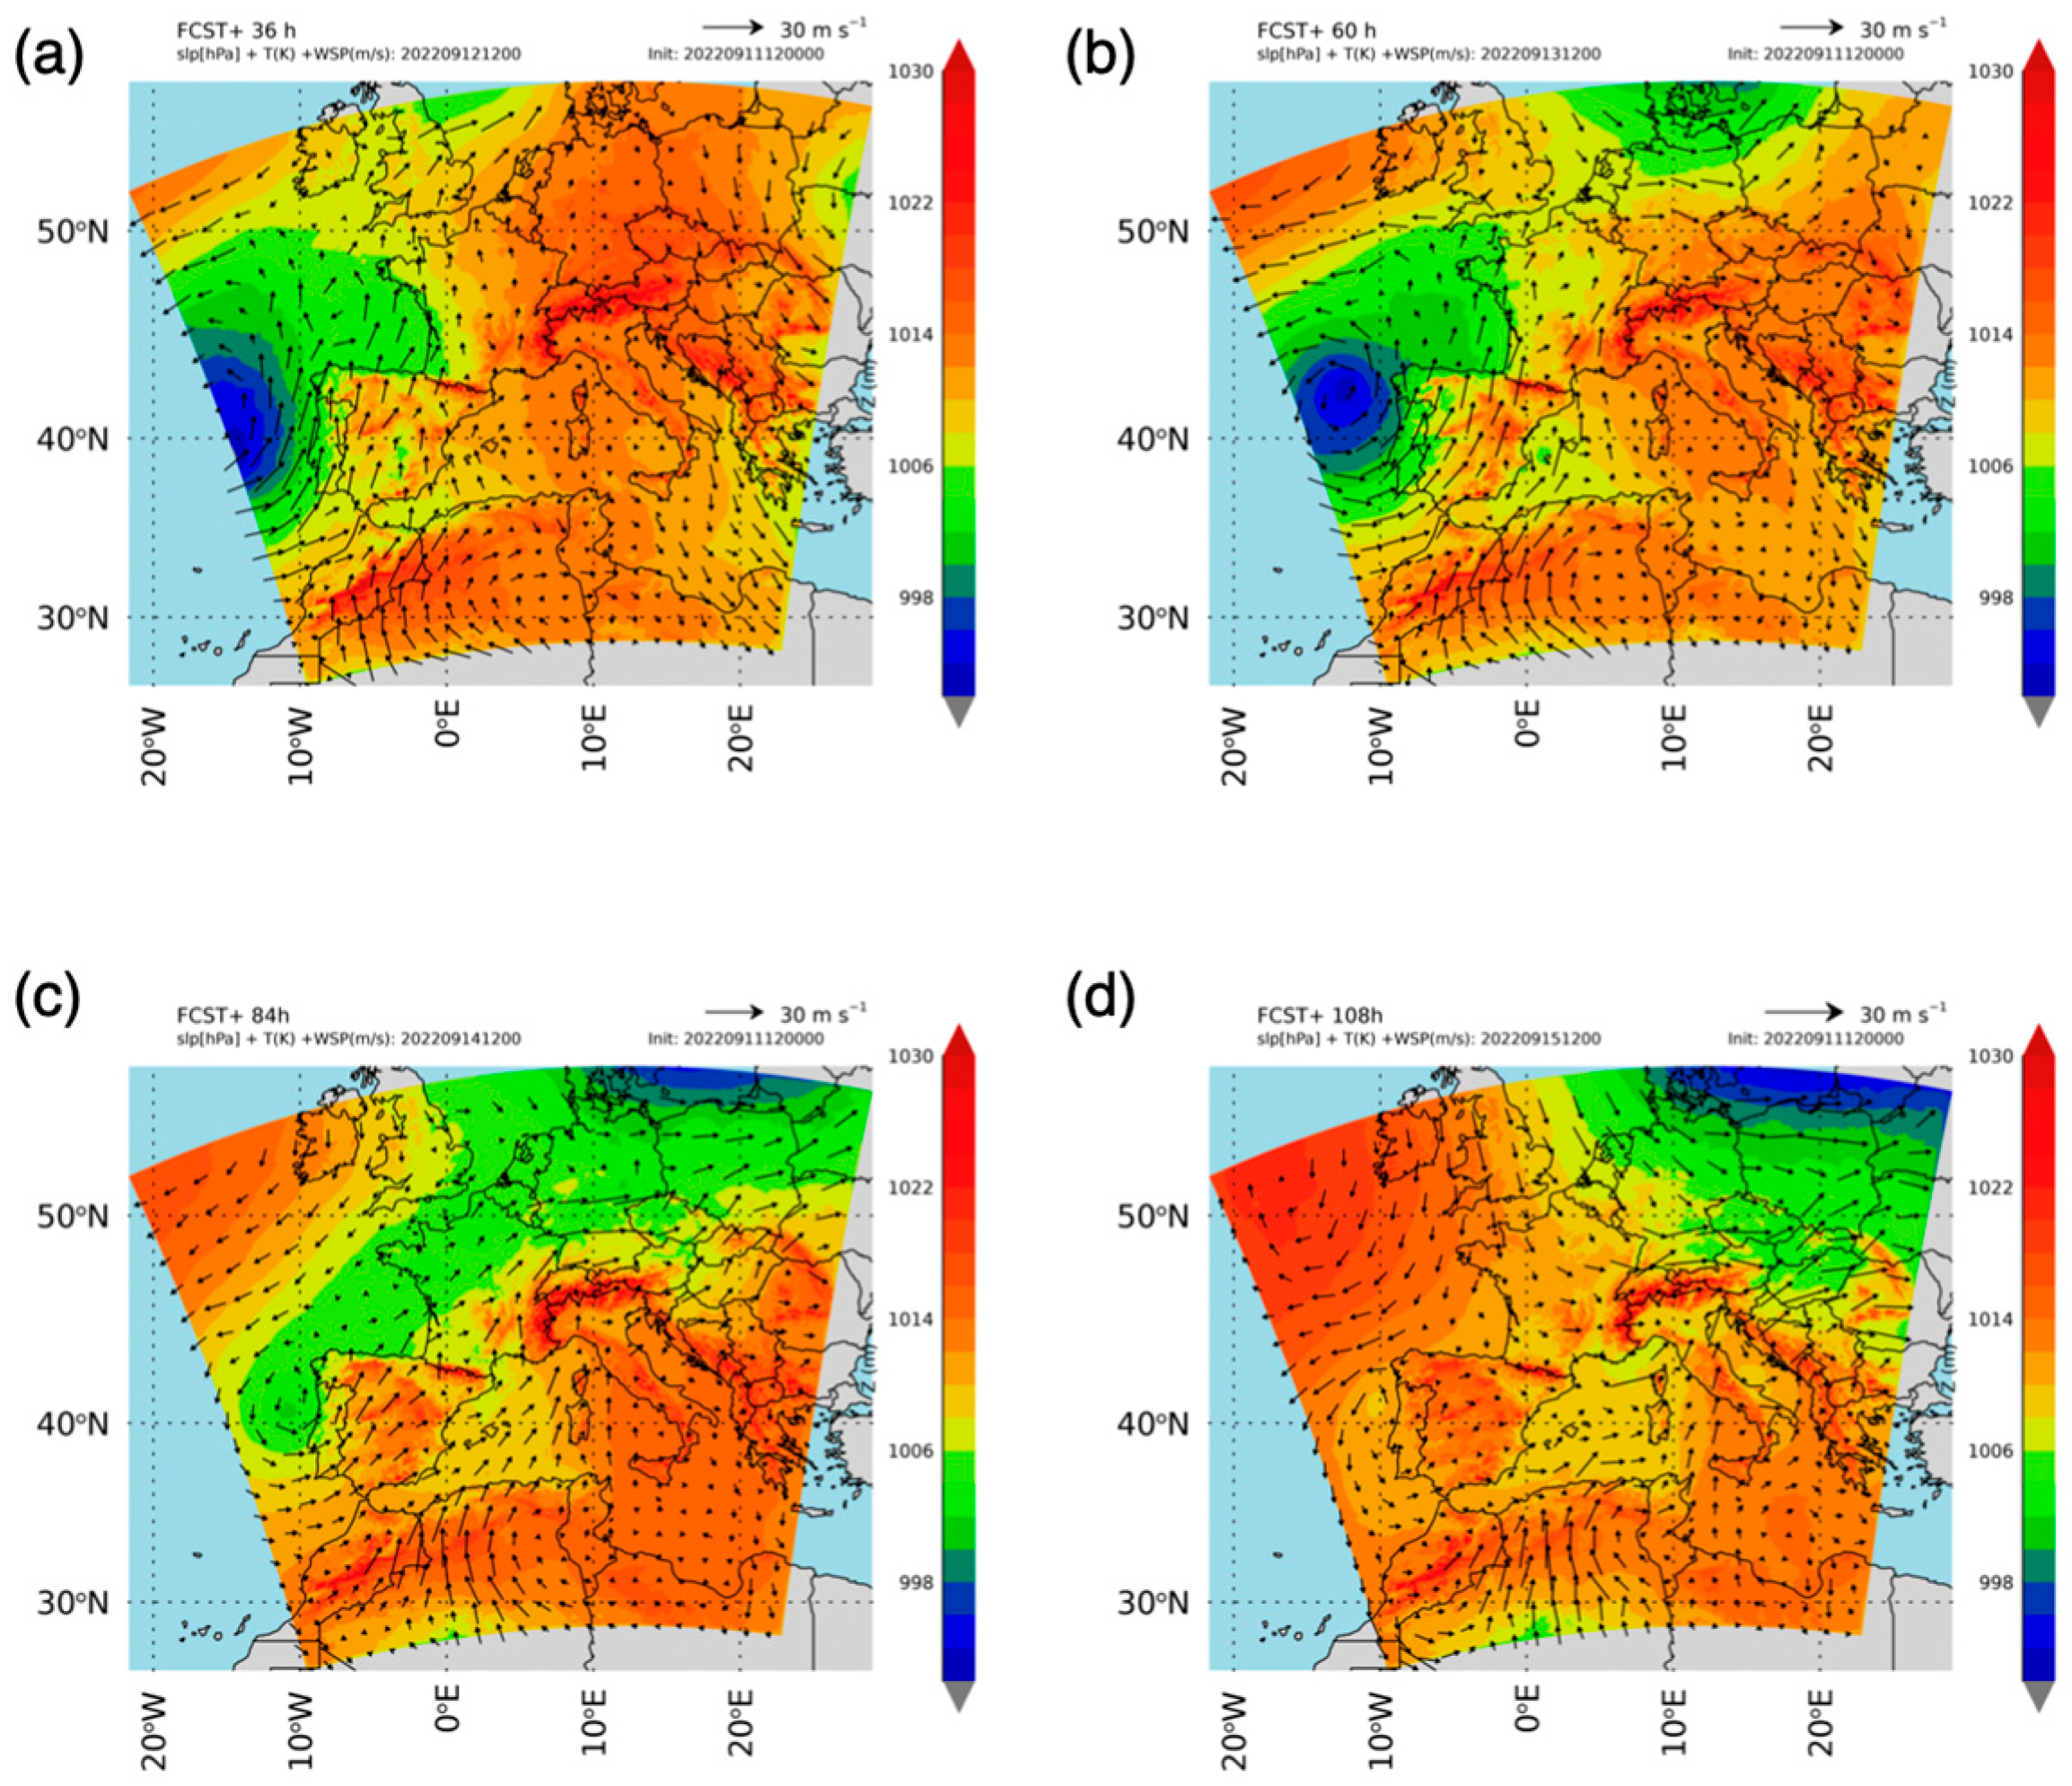
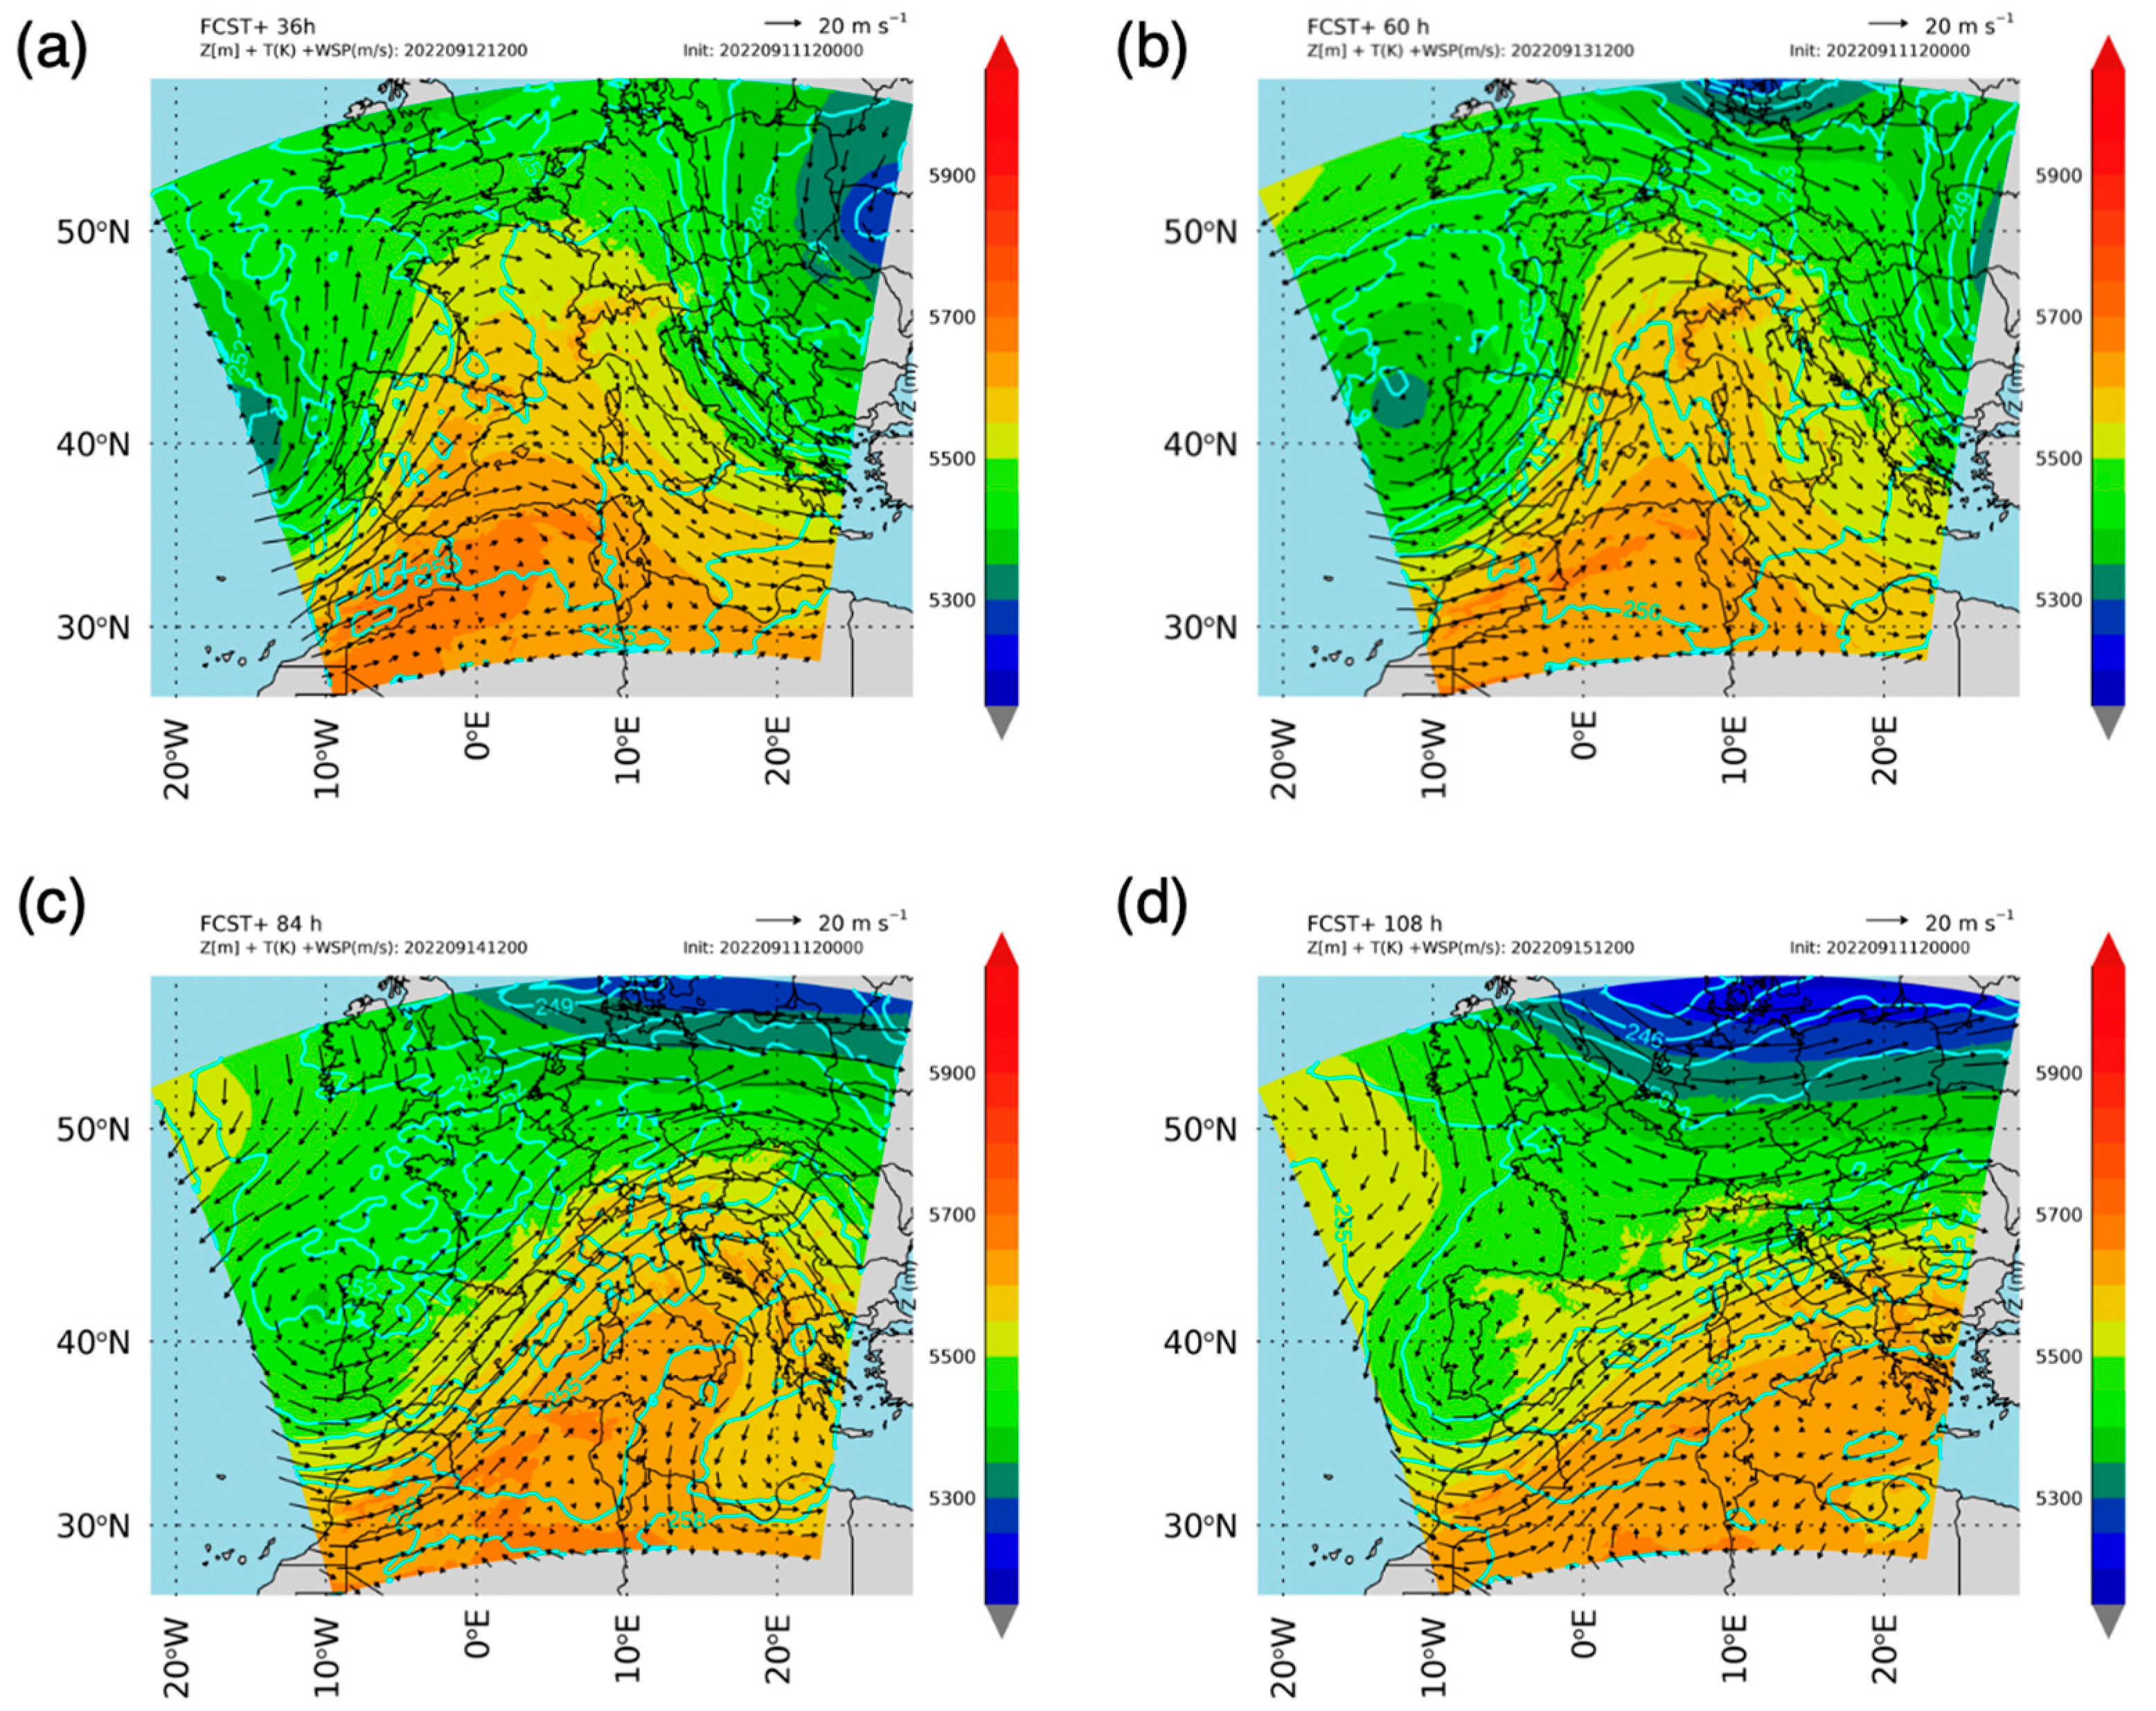
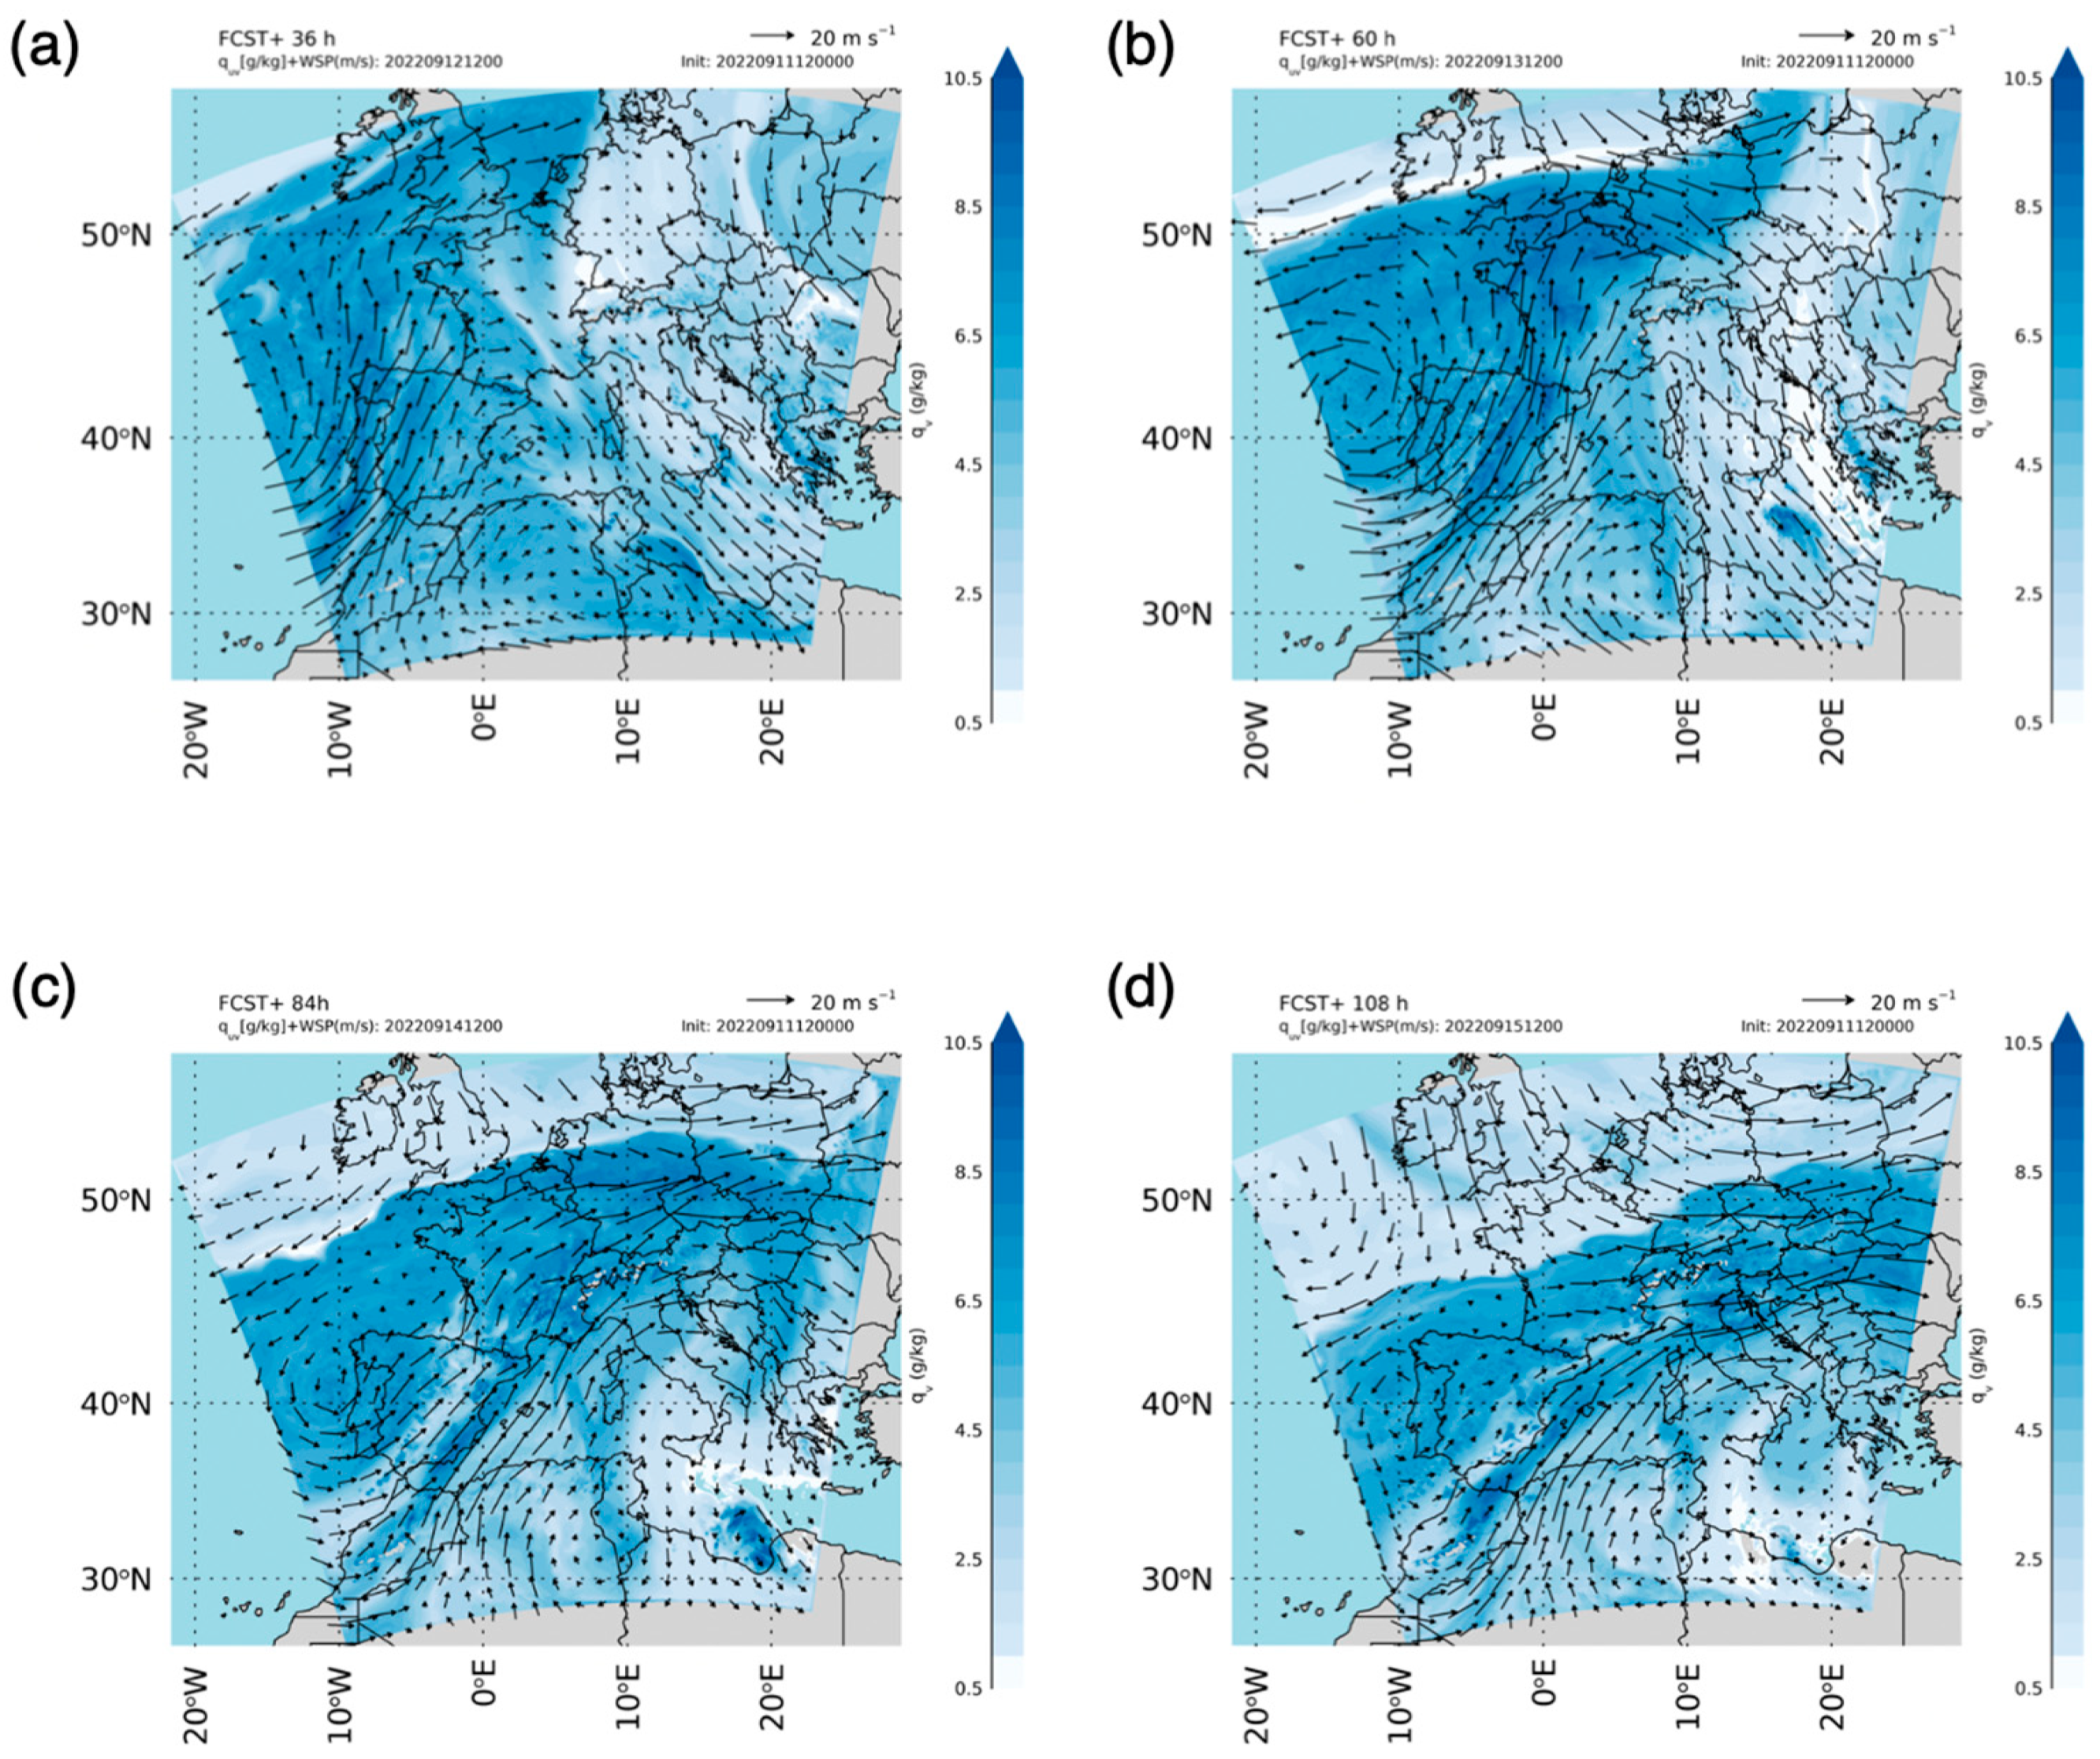
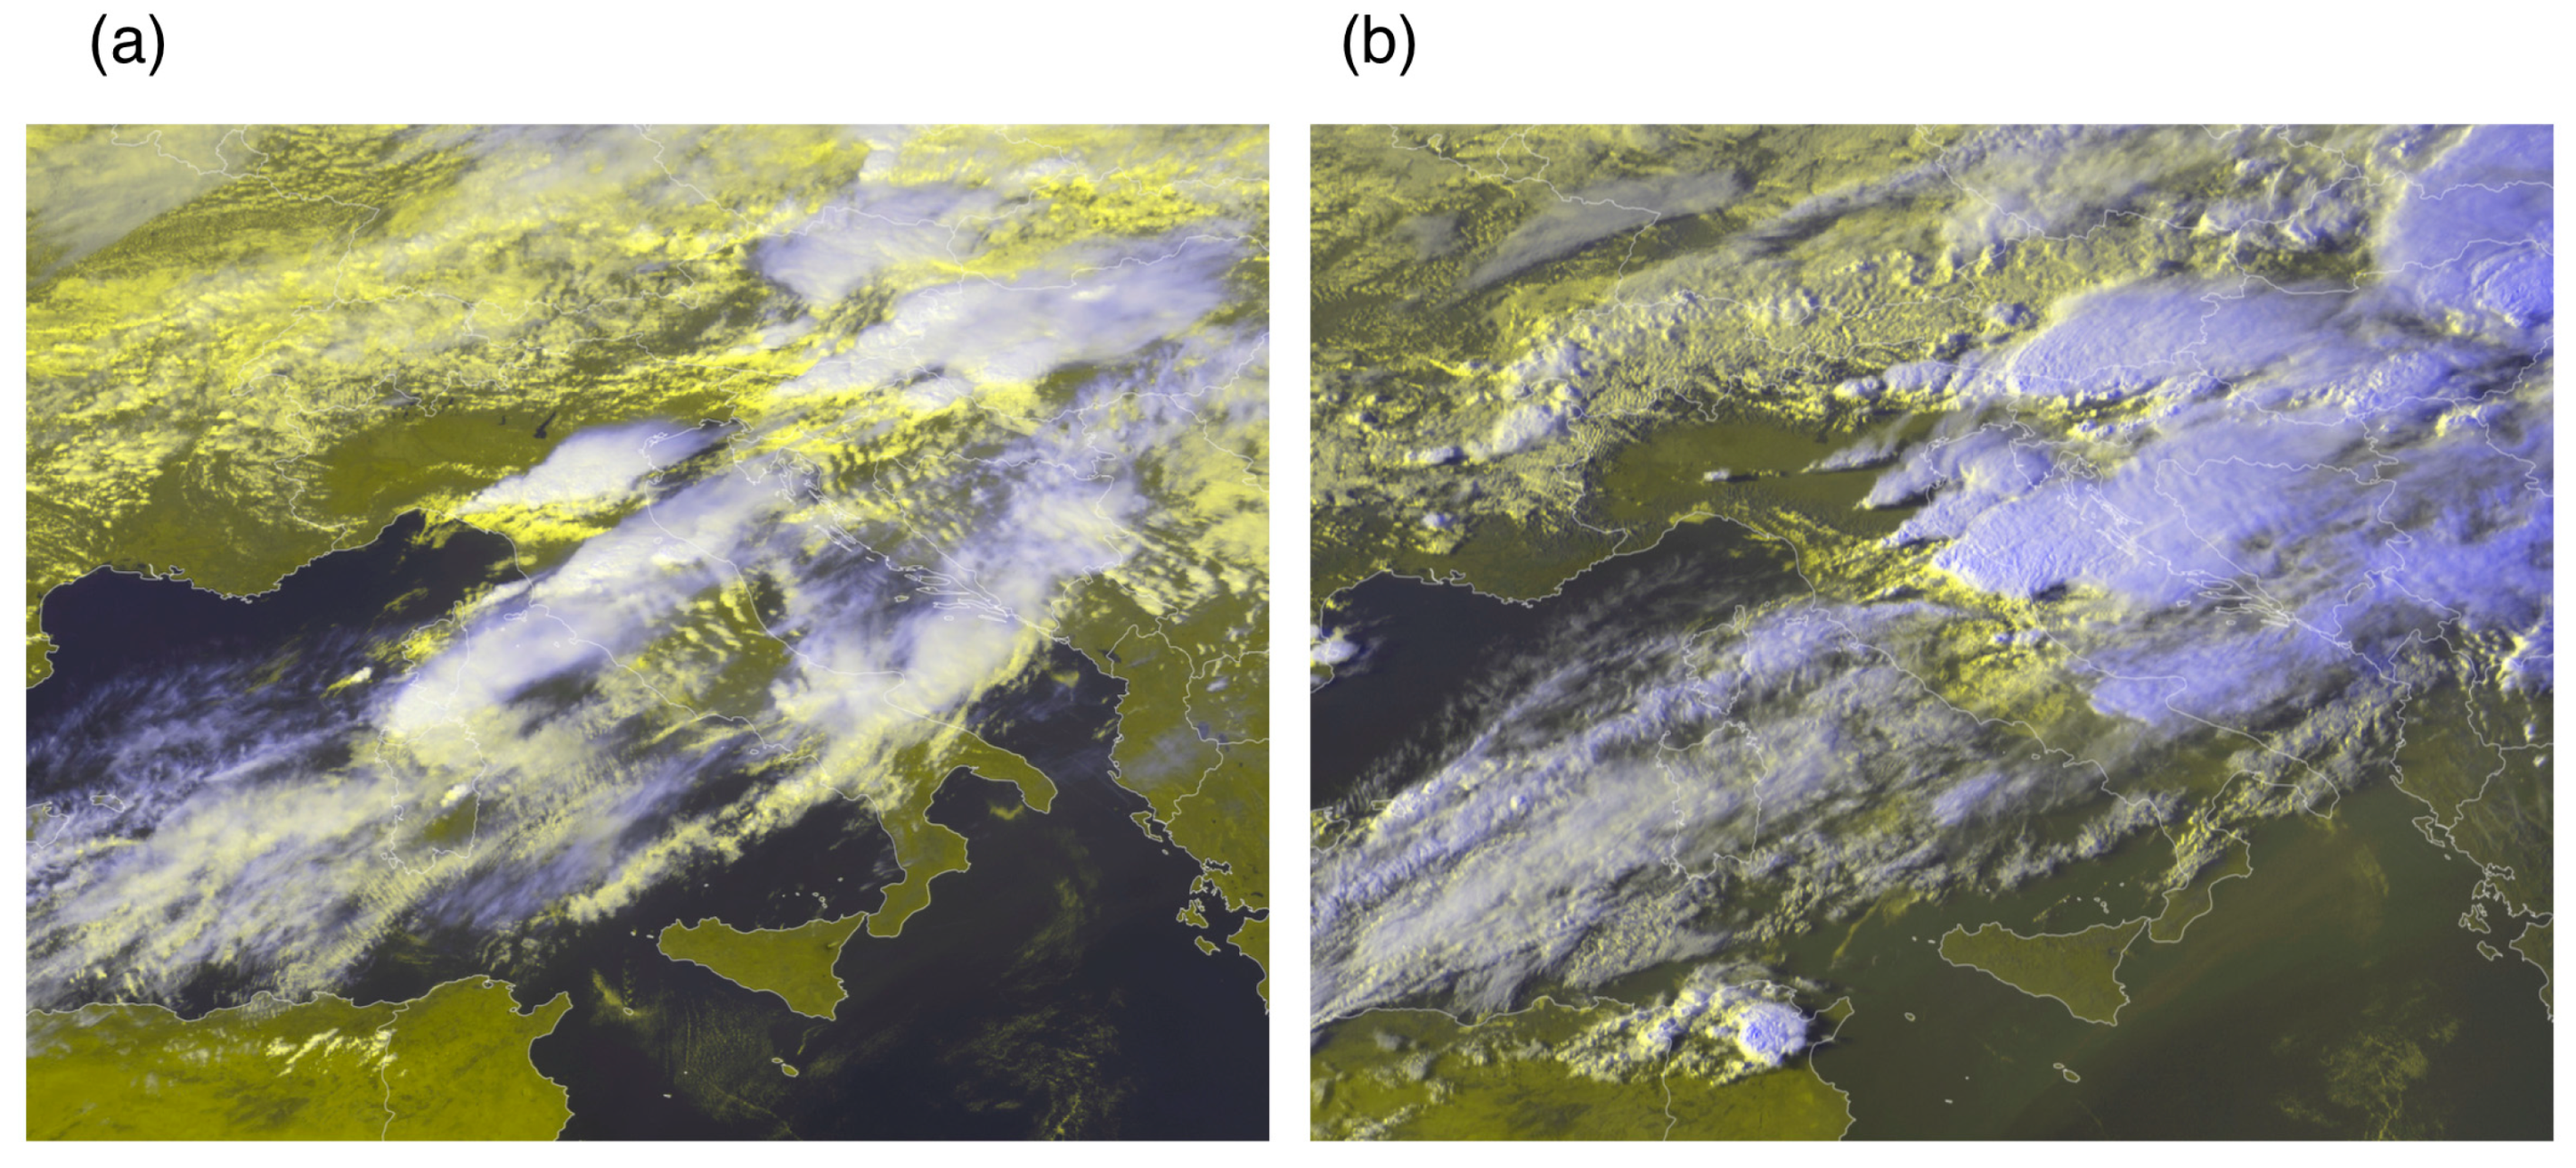
2. Large Scale Analysis

In this section, we analyse the synoptic conditions that led to the 15 September 2022 disastrous event using a WRF simulation at 5 km horizontal resolution lasting five days and starting at 12 UTC on 11 September 2022. Initial and boundary conditions are given by the ECMWF-IFS analysis/forecast cycle issued at 12 UTC on 11 September 2022 and the model grid has 600 grid points in both WE and NS directions and 50 vertical levels, with the model top at 50 hPa.
During the 12 and 13 September, the surface pressure pattern was dominated by tropical storm Danielle acting on the eastern Atlantic (Figure 1a,b). The minimum pressure is about 995 hPa, and the storm is advecting humid air masses into the Mediterranean Basin (see the water vapour analysis). The interaction between tropical cyclone Danielle and the Atlas Mountains generates a low pressure in the western Mediterranean that moves eastwards in the following days. In Figure 1b, a second low pressure centre is shown over Scandinavia that will play an important role in the following days. At 12 UTC on 14 September (Figure 1c), an elongated low-pressure area joins the two low-pressure minima. A low pressure in the western Mediterranean is apparent and was formed by the interaction between the atmospheric flow and the Atlas Mountains. At 12 UTC on 15 September, the low pressure that formed over the western Mediterranean approached Italy, advecting southern humid winds towards Northern and Central Italy (Figure 1d). Over Scandinavia, the low-pressure system is pushing air masses southwards.
The mid-tropospheric conditions are shown in Figure 2. At 12 UTC on 12 September, the minimum geopotential height associated with tropical storm Danielle is apparent in Figure 2a, as is the minimum geopotential height over Scandinavia. A ridge is well established over the Central Mediterranean, and as the whole system moves eastwards, the interaction between the Atlas Mountains and the main flow causes the deepening of the surface pressure in the western Mediterranean. On 14 September, the elongated trough from the eastern Atlantic towards Scandinavia caused southwestern advection at mid-levels over Northern and Central Italy. This pattern slowly moves southwards, and an intense southwestern flow is above Central Italy just before the start of the most intense phase of the event over the Marche Region (Figure 2d).
Another important factor that determined the intense weather event in the Marche Region was the organisation of the water vapour over Italy given by the large-scale circulation. This is shown by the analysis of the 700 hPa specific humidity in Figure 3. During 12 and 13 September (Figure 3a,b), the effect of tropical cyclone Danielle on the distribution of the water vapour is shown by the larger water vapour content over the western part of the domain. The moisture is conveyed towards England and Scandinavia. Water vapour is also advected into the Mediterranean by the circulation associated with Danielle. During the following two days, the action of the circulation induced by the low pressure over Scandinavia and by the high pressure west of the British Islands (about 2.5° W and 50° N) pushes the humid air southwards, increasing the water vapour availability for storms developing over Italy (Figure 3c,d).
The synoptic-scale organisation of the atmospheric circulation, i.e., the warm and humid marine air advected towards Central Italy, the vertical shear, and the advection of a considerable amount of water vapour at mid-tropospheric levels, were key ingredients for the development of this high-impact event. Local factors, however, were also important and can be better explained with the aid of the MSG-SEVIRI HRV (Meteosat Second Generation- Spinning Enhanced Visible and Infra red Imager High-resolution visible channel) cloud composite (Figure 4), whose aim is to monitor convection at high resolution. A band of clouds crossed Italy from southwest to northeast. Several thunderstorms developed over Central and Northern Italy (Figure 4a), triggered by the local orography. Some of the thunderstorms evolved into V-shaped thunderstorms (Figure 4b), and among them is the huge V-shaped self-generating storm over the Marche Region. These thunderstorms get their name from the pattern seen on a satellite image. The thunderstorm anvil is close to the tropopause, and the V-shape results from the advection of intense winds at these heights. To reach the tropopause, updrafts are intense, and the V-shaped thunderstorms have the potential to bring severe phenomena (precipitation, winds, hail, etc.).
In general, V-shaped thunderstorms are not uncommon over Italy, especially in the summer and fall when deep convection can develop over the country. Not all V-shaped thunderstorms result in floods or flash floods, as their duration is short. However, when V-shaped thunderstorms are stationary for several hours over a specific area, they result in floods or flash floods [41].
The storm of Figure 4 was triggered by the Apennines, running along the Italian peninsula, and remained anchored to this orographic feature for several hours because air masses descending from the cumulus clouds and moving backward towards the west were constrained to rise again over the Apennines by the orography.

3. Data and Methods

3.1. WRF-Model and 3D-Var

In this study, we used the WRF model [47], version 4.1.3. The model has been run over 1 grid with 850 grid points in both NS and WE directions and a horizontal grid spacing of 2 km. The model grid is shown in Figure 5. Fifty vertical levels were employed, reaching a height of 50 hPa.
The main physical parameterizations employed are the following: the Thompson [48] microphysics scheme, the Mellor–Yamada–Janjic (Eta) TKE scheme for the boundary layer [49] and Dudhia [50], and the rapid radiative transfer model (RRTM, [51]) as shortwave and longwave radiative schemes, respectively.
Initial and boundary conditions from the European Centre for Medium range Weather Forecast (ECMWF) Integrated Forecast System (IFS) operational analysis/forecast cycle at 0.25° starting at 12 UTC on 14 September 2022, are employed for WRF initialisation. The boundary conditions are updated every 3 h.
Simulations were run for 4 time periods on 15 September 2022, following a very short-term forecast (VSF) approach, in which cycles of analyses and short-term forecasts are repeated every few hours in order to follow the evolution of convective phenomena. These features have small spatial and temporal scales, are difficult to predict, and the quality of their forecast decreases rapidly with forecasting time [21,41]. To improve their forecast, the analyses must take into account local conditions, and we use lightning observations to tackle this issue. However, the deterministic forecast of convection rapidly decreases its performance, and the restoration of actual convection is needed every few hours. A balance between computational time and the need to re-initialise convection must be reached, which, in our case, results in a 3 h forecast after an analysis phase, and the cycle repeats every 3 h.
The four time periods and the simulations considered for the case are summarised in Table 1. To use a warm start, we first run the control simulation (BCKG) lasting 36 h, with the simulation starting at 12 UTC on 14 September, and without lightning data assimilation. Three types of model configurations are considered for each time period: BCKG, without lightning data assimilation; ANL (with a 3 h-long lightning data assimilation); and ANL-1H (with a 2 h-long lightning data assimilation). All simulations assimilating lightning started from the control simulation using the restart option (warm start). Moreover, a sensitivity test to the number of analyses is discussed in Section 4.4.
It is important to clarify the times of forecast availability in this VSF approach. The configuration used for this work takes 5 min to predict one hour, using 256 cores, and 10 min for the analysis, using 25 cores. Considering that the lightning data are obtained with a one-minute delay, the whole process takes 26 min for a 3 h forecast. So, the forecast for ANL is available half an hour inside the time interval to forecast, while the forecast for ANL-1H is available half an hour before the time interval to forecast (see Table 1). In Section 4.4, we show the results of a sensitivity test (ANL-1H_4) in which four analyses are made, as in the ANL configuration, but the starting time is 1 h before ANL so that the forecast is available half an hour before the forecast period (as ANL-1H).
The idea behind running ANL and ANL-1H is to better investigate event predictability. In an operational context, ANL forecast would have been available half an hour after the beginning of the first hour to forecast, while ANL-1H would have been available half an hour before the beginning of the first hour to forecast. For example, for the run starting at 12 UTC and ending at 18 UTC, whose forecast refers to the 15–18 UTC phase, the ANL forecast would have been available at 15:30 UTC, while the ANL-1H would have been available at 14:30 UTC. In both ANL and ANL-1H, an analysis is performed every hour for the assimilation phase. In addition, the comparison between BCKG and ANL/ANL-1H shows the added value of LDA compared to the previous day’s forecast.
Lightning data are assimilated by 3D-Var, using a 3D-Var package developed at CNR-ISAC. This package was originally developed for the RAMS@ISAC model [42] for assimilating temperature and wind profiles. It was then extended to assimilate different observations, and it is applied in this paper for the first time with the WRF model. The variables that can be assimilated are the following:
-
lightning data [21];
-
radar reflectivity from ground-based radar [21,41] and from satellites [52];
-
Zenith Total Delay [53];
-
Satellite-derived rain-rate data [54].
For LDA, flashes are first remapped onto the model grid, and then a saturated pseudo-profile between the lifting condensation level (LCL) and the −25 °C isotherm is created for grid columns with observed lightning. Both the LCL and the −25 °C isotherm are estimated by the WRF background. This pseudo-profile is used in the 3D-Var, which minimises the cost function J(x) given by:
J x = 1 2 x x b T B 1 x x b + 1 2 H x y o T R 1 H x y o
In the above equation, x is the state vector, xb is the background state vector, B is the background error matrix, R is the observation error matrix, y o is the observations vector (saturated pseudo-profiles), and H is the forward observational operator, which transforms the state vector x in the observational space.
The cost function is minimised using the conjugate gradient method, while the B matrix is calculated using Gaussian functions in the horizontal and an eigenvalue–eigenvector decomposition in the vertical [42]. For the horizontal error decorrelation, a length scale of 15 km is used, while in the vertical, we use a length scale decorrelation of 250 m. The 15 km distance is used because it is a typical length scale for thunderstorms, while 250 m was taken following the results of Federico et al. [21] who successfully applied a vertical length scale between 100 m and 500 m for a deep convective case that occurred in Southern Italy. The observation error decreases with height, starting from the 3 g/kg value at the surface. The background error at each level is twice the observation error to give more credit to observations compared to the background.
The choice of horizontal and vertical length scales, while driven by the physics of the problem, is not optimal, and better results could be achieved with an optimisation of the 3D-Var data assimilation scheme using the NCM method [55].

3.2. Lightning Forecast

Lightning is forecast following the dynamic lightning scheme described by Lynn et al. [44].
The first step consists of the calculation of the Lightning Potential Index (LPI).
The LPI is computed between the isotherms of 0 °C and −20 °C and measures the kinetic energy of updrafts and downdrafts scaled by the potential of charge separation, the latter being a function of the hydrometeors mixing ratios (cloud, rain, snow, graupel and ice). LPI reaches its largest value when the graupel fraction is equal to that of water, ice and snow.
The electric potential is given by the LPI multiplied by the total mass of ice and divided by the charge of 1 C. The source term for this potential can be found in Lynn et al. [44] and depends on a parametrised current such that the appropriate amount of energy builds up over several model time steps. The simulated strokes depend on this parameter. Both cloud-to-ground (positive and negative) and intracloud strokes are simulated. According to the tripolar thunderstorm charge model of Williams [56], the different charge types are represented as follows: Negative lightning is assumed to develop in the lower portion of the cloud; positive lightning is supposed to start from the upper portion of the cloud; and finally, intracloud lightning is expected to start anywhere within the cloud. The total lightning, i.e., the sum of positive, negative, and intracloud lightning, is considered for comparison with observations.
Federico et al. [43] showed an extensive application of the Lynn et al. [44] lightning scheme to the central Mediterranean area (162 cases). Among their results, a considerable sensitivity of the number of lightning strikes predicted by the scheme to the parameterised current was shown, and, for a resolution of 3 km, the configuration with a parametrised current of 0.75 × 10⁻⁴ A was found to be the best setting. The application of LDA in this paper showed an overestimation of the strokes number predicted by the scheme when the parametrised current was set to 0.75 × 10⁻⁴ A, likely for the different horizontal resolution used here (2 km) and in Federico et al. ([21], i.e., 3 km). Moreover, using LDA, it turned out that 0.75 × 10⁻⁴ A predicted too many strokes, and a different setting must be used for LDA compared to the control simulation without LDA.
Finding the best setting of the parametrised current when LDA is applied is out of the scope of this paper because it considers only one case. However, we performed a gross optimisation of the scheme for strokes simulated by the lightning scheme in the different phases of the storm, finding that 0.5 × 10⁻⁴ A was the best setting for the control simulation and 0.3 × 10⁻⁴ A was the best setting when using LDA. Again, it is stressed that this is not a general setting of the lightning scheme but rather a trial-and-error optimisation for the case.

3.3. Lightning and Precipitation Data

For lightning data assimilation and forecast verification, we used the lightning detection network (LINET) data [57]. This network observes both intracloud (IC) and cloud-to-ground (CG) strokes, making use of the time of arrival (TOA) method [58]. LINET provides the time of occurrence, the amperage and position for each stroke, and the heights for IC strokes. For data assimilation, only information regarding the date and time (in milliseconds) and the position (latitude and longitude) of each stroke is used. Furthermore, all strokes recorded in a time range of 1 s and in a spatial range of 10 km are considered a single flash [59]. All lightning recorded in a 30 min time interval, centred at the analysis time, is used for data assimilation and is assumed to occur at the analysis time.
For rainfall verification, we used precipitation data from the Italian rain gauge network. This network accounts for about 4000 rain gauges spread across the Italian territory. Data come from the regional administrations and are collected nationwide at the Department of Civil Protection [60].

3.4. Forecast Verification Procedure

For precipitation and lightning forecast verification, two different methods are applied. Observed precipitation and forecast data are compared using the nearest neighbour method. For each rain gauge, we considered all model grid points with a distance of 3 Δ x 2 8.5 km from the rain gauge (with Δ x  model grid spacing, i.e., 2 km). Among these points, we then selected the grid point with the rainfall value closest to the observed one.
For lightning forecast verification, we upscaled the model output from 2 km to 24 km, following the procedure discussed in [43]. In particular, we considered 12 grid cells in both horizontal directions, and we remapped both observed and predicted strokes onto this grid, verifying the results on a 24 24   k m 2 grid. Importantly, the area used to verify the lightning forecast spans longitudes 6–19° E and latitudes 36.5–47° N.
For both parameters, we then calculated the following scores: Frequency bias (FBIAS), probability of detection (POD), threat score (TS) and false alarm rate (FAR). To calculate these scores, 2 × 2 contingency tables for dichotomous events (i.e., events that can assume only two values, in this case “yes” or “no”) are considered for different precipitation or number of strokes thresholds. The events to verify are “precipitation above or equal to a certain threshold” for precipitation and “number of strokes above or equal to a certain threshold” for strokes. The contingency tables account for four possibilities: hits (a), false alarms (b), misses (c) and no forecast (d). The above-mentioned scores are then defined as:
F B I A S = a + b a + c
P O D = a a + c
T S = a a + b + c
F A R = b a + b
FBIAS spans the interval 0 , + , 1 being the best value. POD, TS and FAR vary in the interval [0, 1], with 1 being a perfect score for POD and TS and 0 being a perfect score for FAR.
These scores are finally summarised in the performance diagram [61]. The x and y axes in this diagram represent the success ratio (SR), defined as 1-FAR, and the POD, respectively. FBIAS is represented by the straight lines starting from the origin of the axes, while TS is represented by hyperbole branches.

4. Results

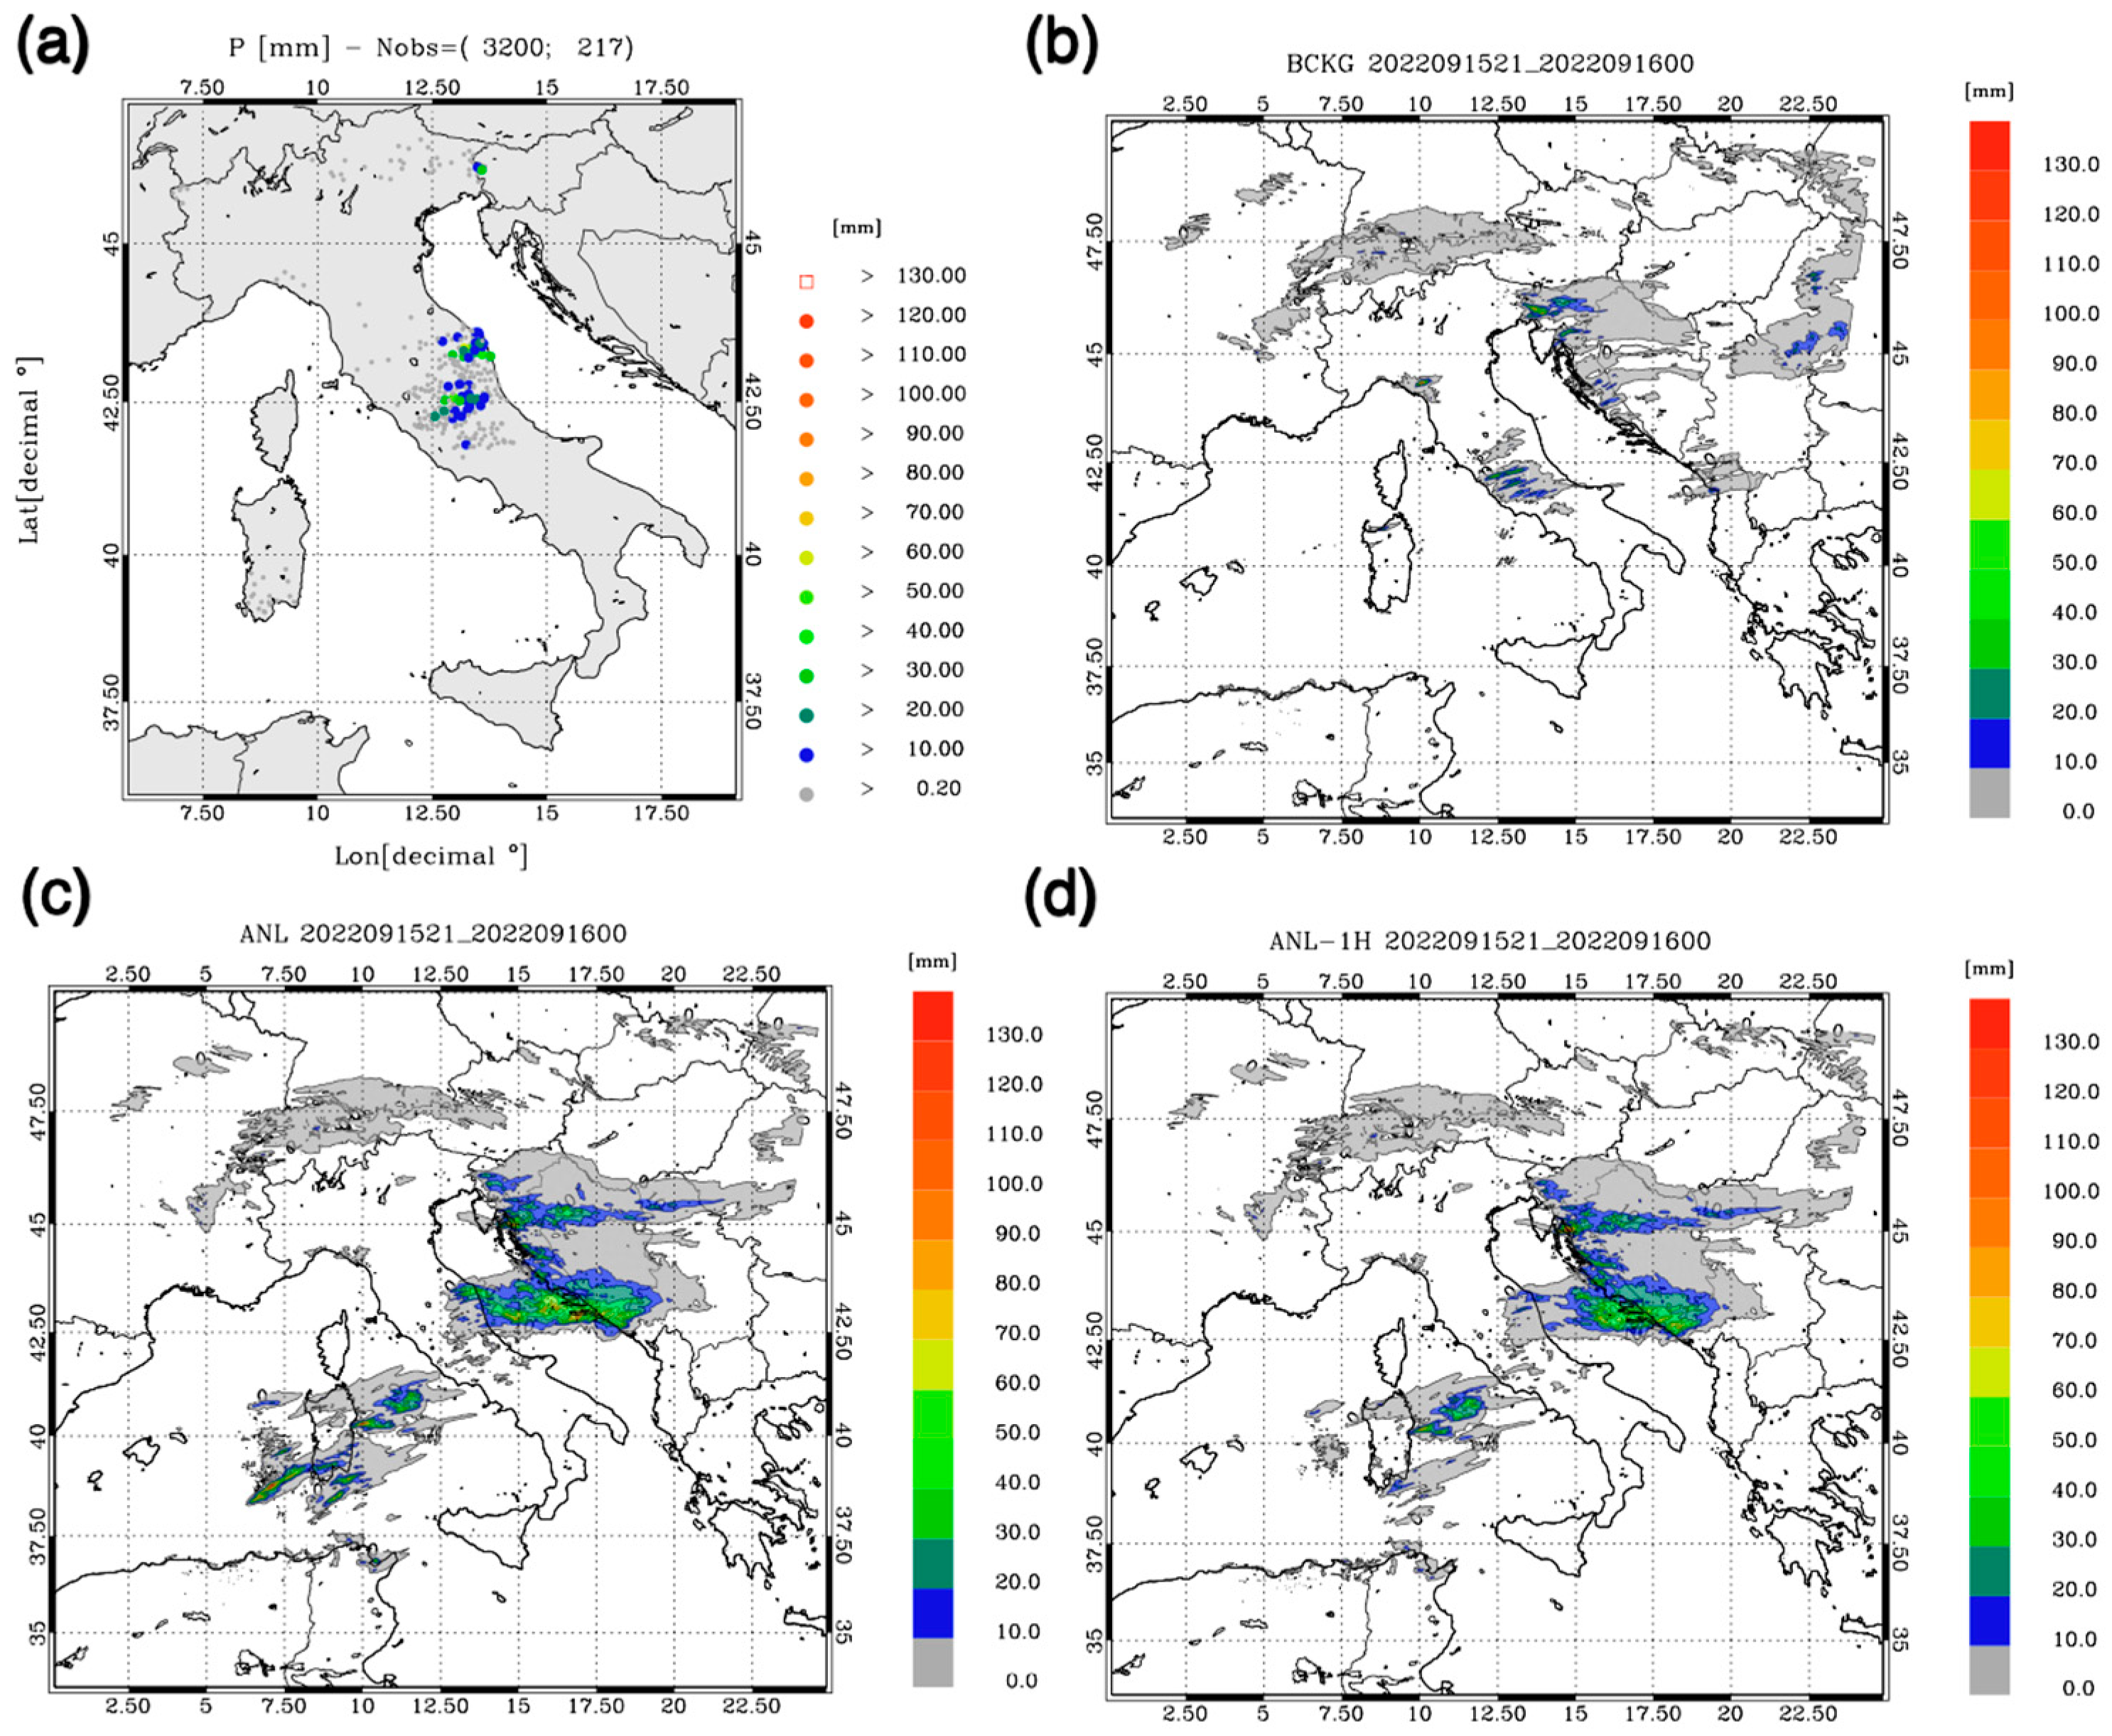
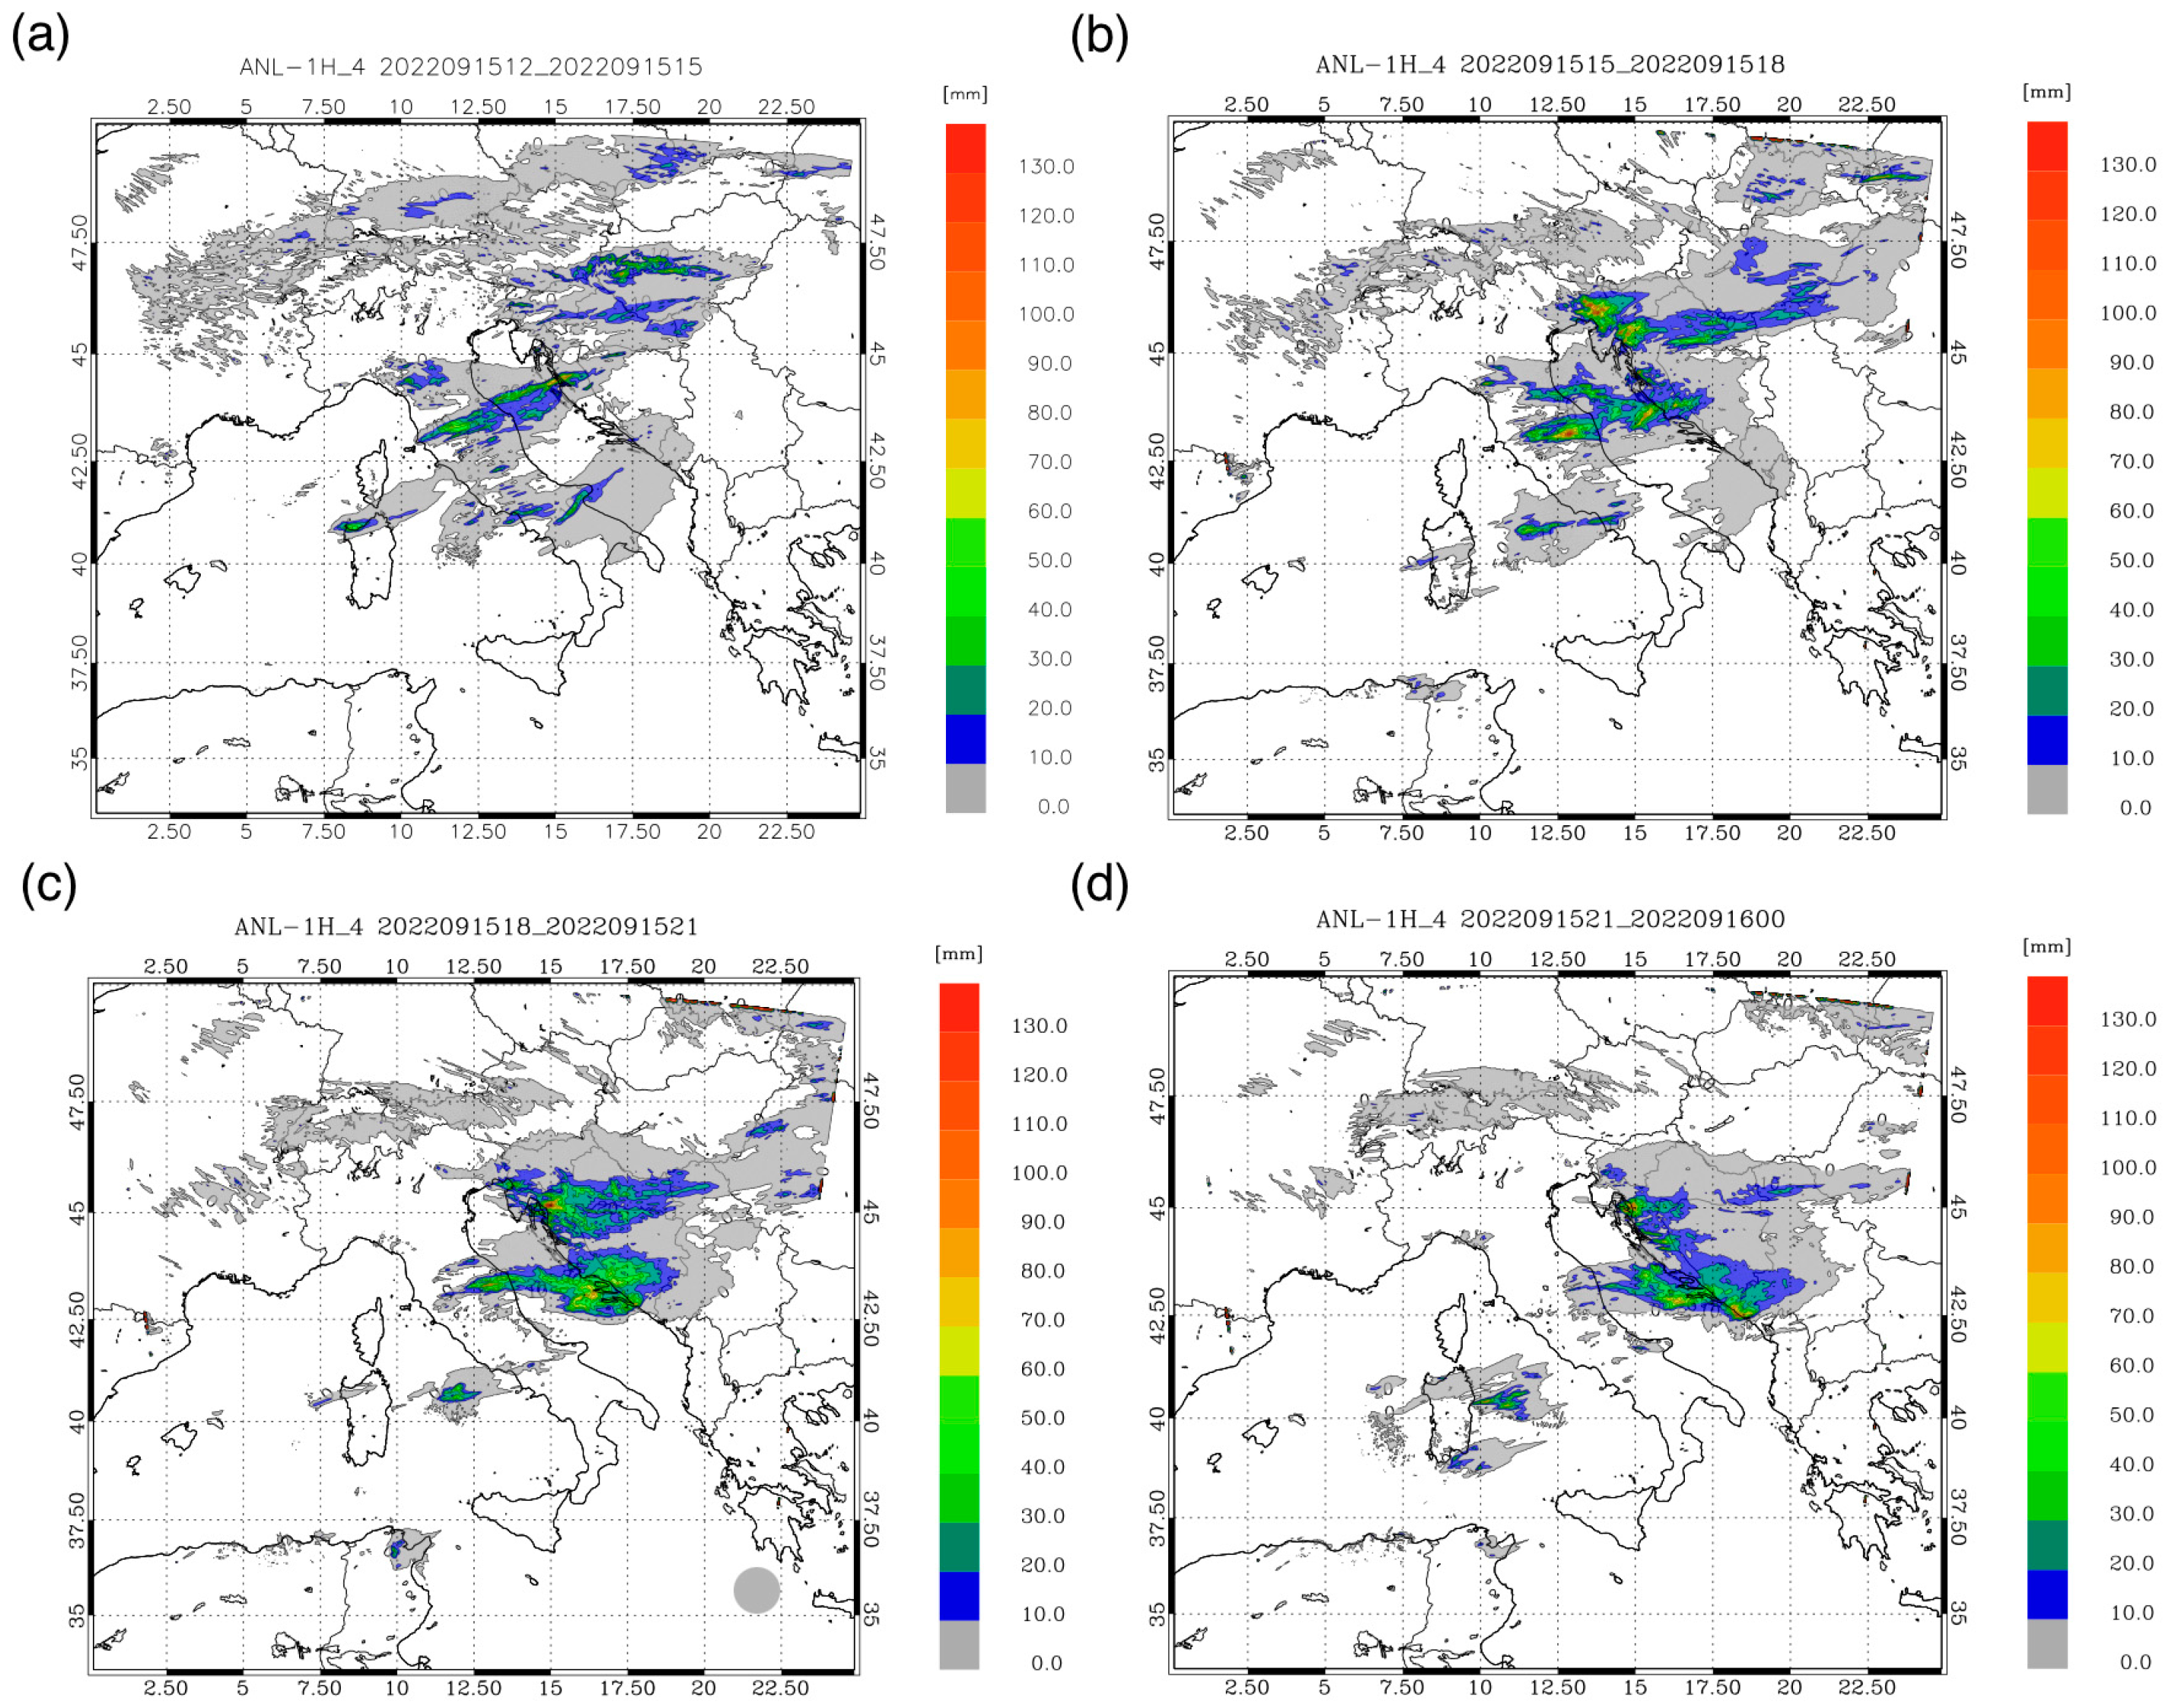
4.1. Precipitation Analysis

In this section, we show the analysis of the impact of LDA on the precipitation forecast for the four most intense phases of the event. The corresponding observations, from about 4000 rain gauges distributed over Italy, for the four phases are shown in panels (a) of Figure 6, Figure 7, Figure 8 and Figure 9.
The analysis of the precipitation accumulated in 3 h reveals four phases of heavy precipitation over Central Italy from 12 UTC on 15 September to 00 UTC on 16 September. The precipitation extends from Tuscany to Marche between 12 and 15 UTC (Figure 6a) and then over the Marche Region for the other phases (Figure 7a, Figure 8a and Figure 9a), approaching the Adriatic coast as the system moves from West to East. Summing the rainfall over the four phases, more than 400 mm were recorded in one rain gauge (419 mm in Cantiano), more than 350 mm in another rain gauge (373 mm, Fonte Avellana), more than 100 mm were reported in 21 rain gauges, and more than 50 mm in 34 rain gauges. Most of this rainfall occurred in less than 12 h causing a catastrophic event because the area was flooded by the small Misa River.
During the first phase (12–15 UTC, Figure 6), the BCKG simulation, available since the day before the event, shows some thunderstorms occurring on the west side of the Apennines, over Tuscany. The highest rainfall predicted is of the order of 40–50 mm/3 h, showing the occurrence of moderate-intense thunderstorms. The ANL forecast, available at 12:30 UTC, i.e., half an hour inside the period, gives a much better forecast of the rainfall position, which is correctly predicted in the central and eastern side of the Apennines, over the Umbria and Marche Regions; also, the shape of the precipitation swath is better represented and resembles the V-shaped footprint. The precipitation intensity is also improved, with maxima around 70 mm/3 h. The results for the ANL-1H forecast, available at 11:30 UTC, show a significant improvement over the BCKG forecast, but the intensity is lower and the pattern has shifted to the west compared to the ANL forecast. It is finally noted that both ANL and ANL-1H forecasts overestimate the precipitation in Southern Italy.
The second phase (15–18 UTC, Figure 7) was the most intense. The control forecast (Figure 7b) shows again the occurrence of intense precipitation (70 mm/3 h) on the west side and central part of the Apennines, and the pattern is shifted to the west of the real occurrence (Figure 7a). The ANL forecast gives a significant improvement to the precipitation forecast both for the rainfall intensity (180 mm/3 h) and position of the event, even if it overestimates the rainfall in the western part of the precipitation swath and the observed maximum precipitation (250 mm/3 h) is underestimated. The ANL-1H forecast gives a significant improvement to the control forecast because the position of the rainfall swath is to the east of the Apennines; the maximum rainfall forecast is about 80 mm/3 h, which underestimates the observed maximum.
For the third phase (18–21 UTC, Figure 8), the positive impact of LDA on the precipitation forecast is apparent. The BCKG forecast predicts intense thunderstorms (50 mm/3 h) in the west and central parts of the Apennines, while observations (Figure 8a) show that precipitation occurred mainly on the east side of the Apennines, close to the Adriatic Sea. The ANL forecast is better than the ANL-1H, but the latter still gives a substantial improvement over the BCKG forecast.
The fourth period, between 21 UTC on 15 September 2022 and 00 UTC on 16 September 2022 (Figure 9), is characterised by two main precipitation centres of about 50 mm/3 h (Figure 9a), one in the Marche Region, close to the Adriatic Sea, and the second in Central Italy. The BCKG forecast predicts well the rainfall over Central Italy with intensities of the order of 30–40 mm/3 h, but it misses the rainfall over the Marche Region. The ANL forecast well predicts the precipitation over the Marche Region but misses the rainfall over Central Italy. The ANL-1H underestimates substantially the rainfall over the Marche Region, with precipitation amounts of the order of 10–20 mm/3 h, while missing the precipitation over Central Italy. In addition, both ANL and ANL-1H forecasts overestimate the precipitation over Sardinia. This overestimation will be more apparent for the lightning prediction (Section 4.2).
All in all, the results of this section show that LDA has a significant and positive impact on the precipitation forecast when a very short-term approach is used. The decrease in rainfall prediction performance with forecasting time is apparent, especially in the dissipating phase of the storm, and ANL has a better forecast compared to ANL-1H. Nevertheless, the improvement given by ANL-1H to the BCKG forecast is significant, especially in the most intense phase of the storm. These results are in line with previous studies in Italy conducted with a different NWP [21].

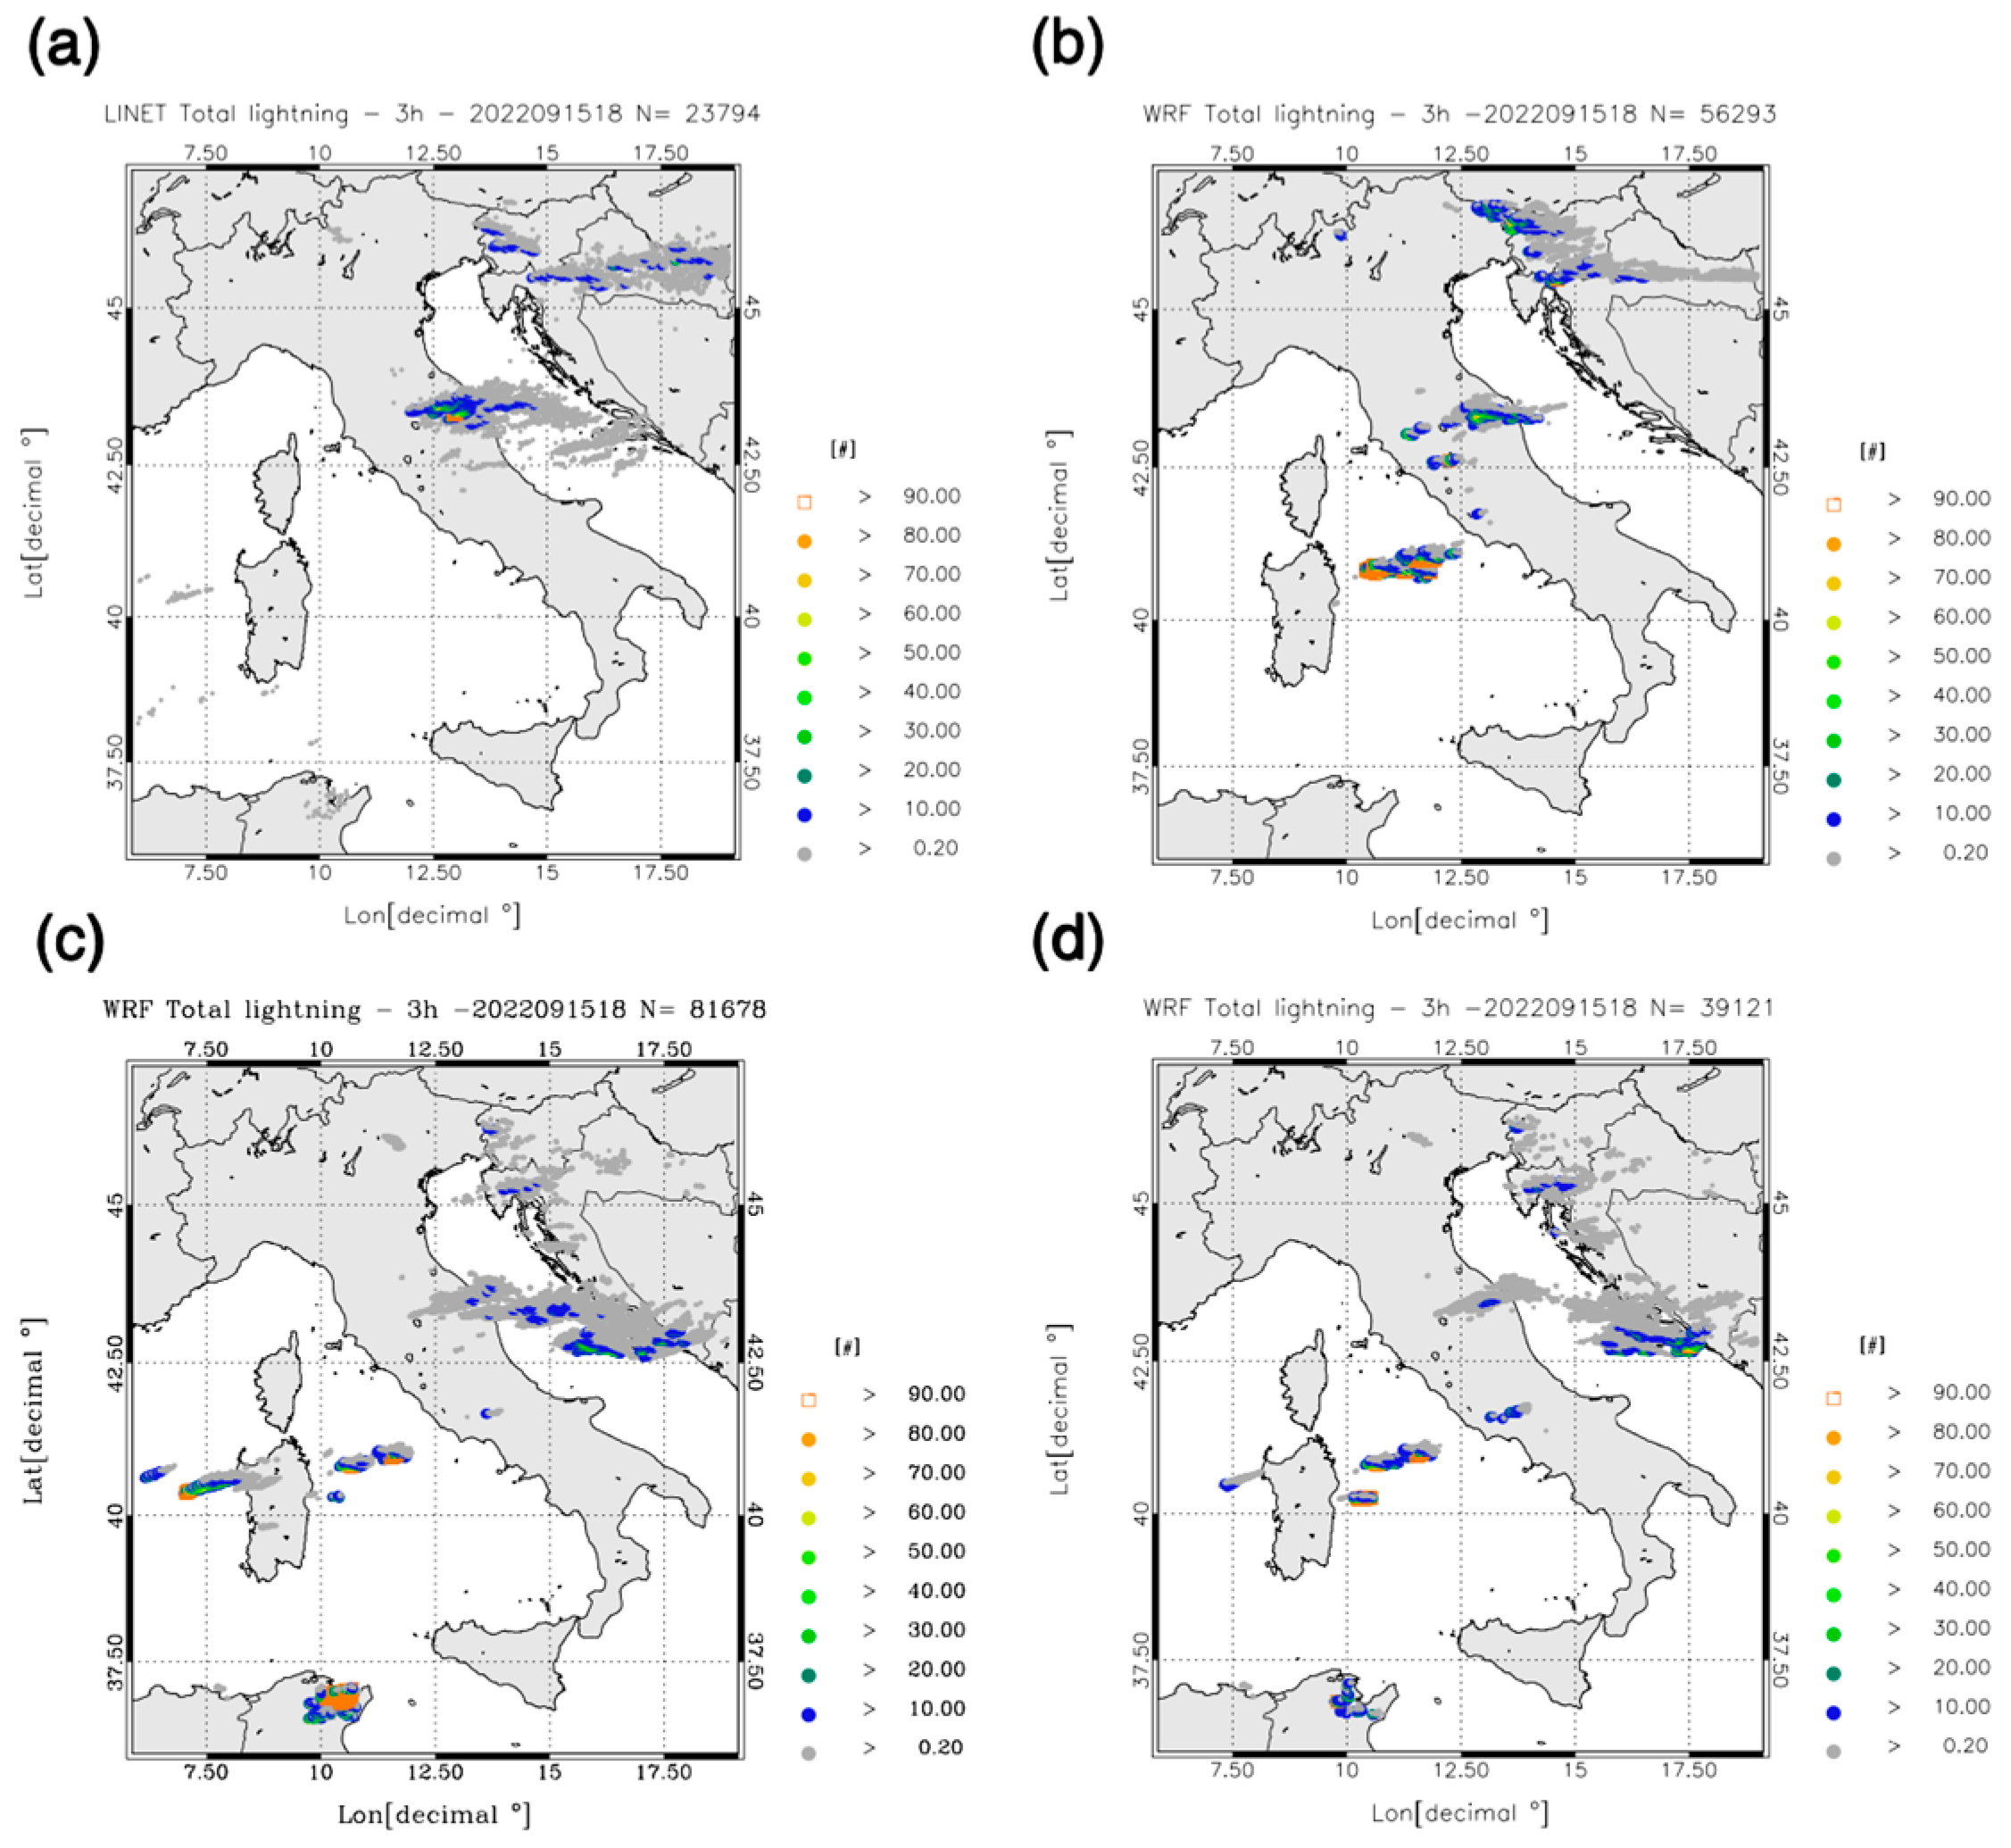
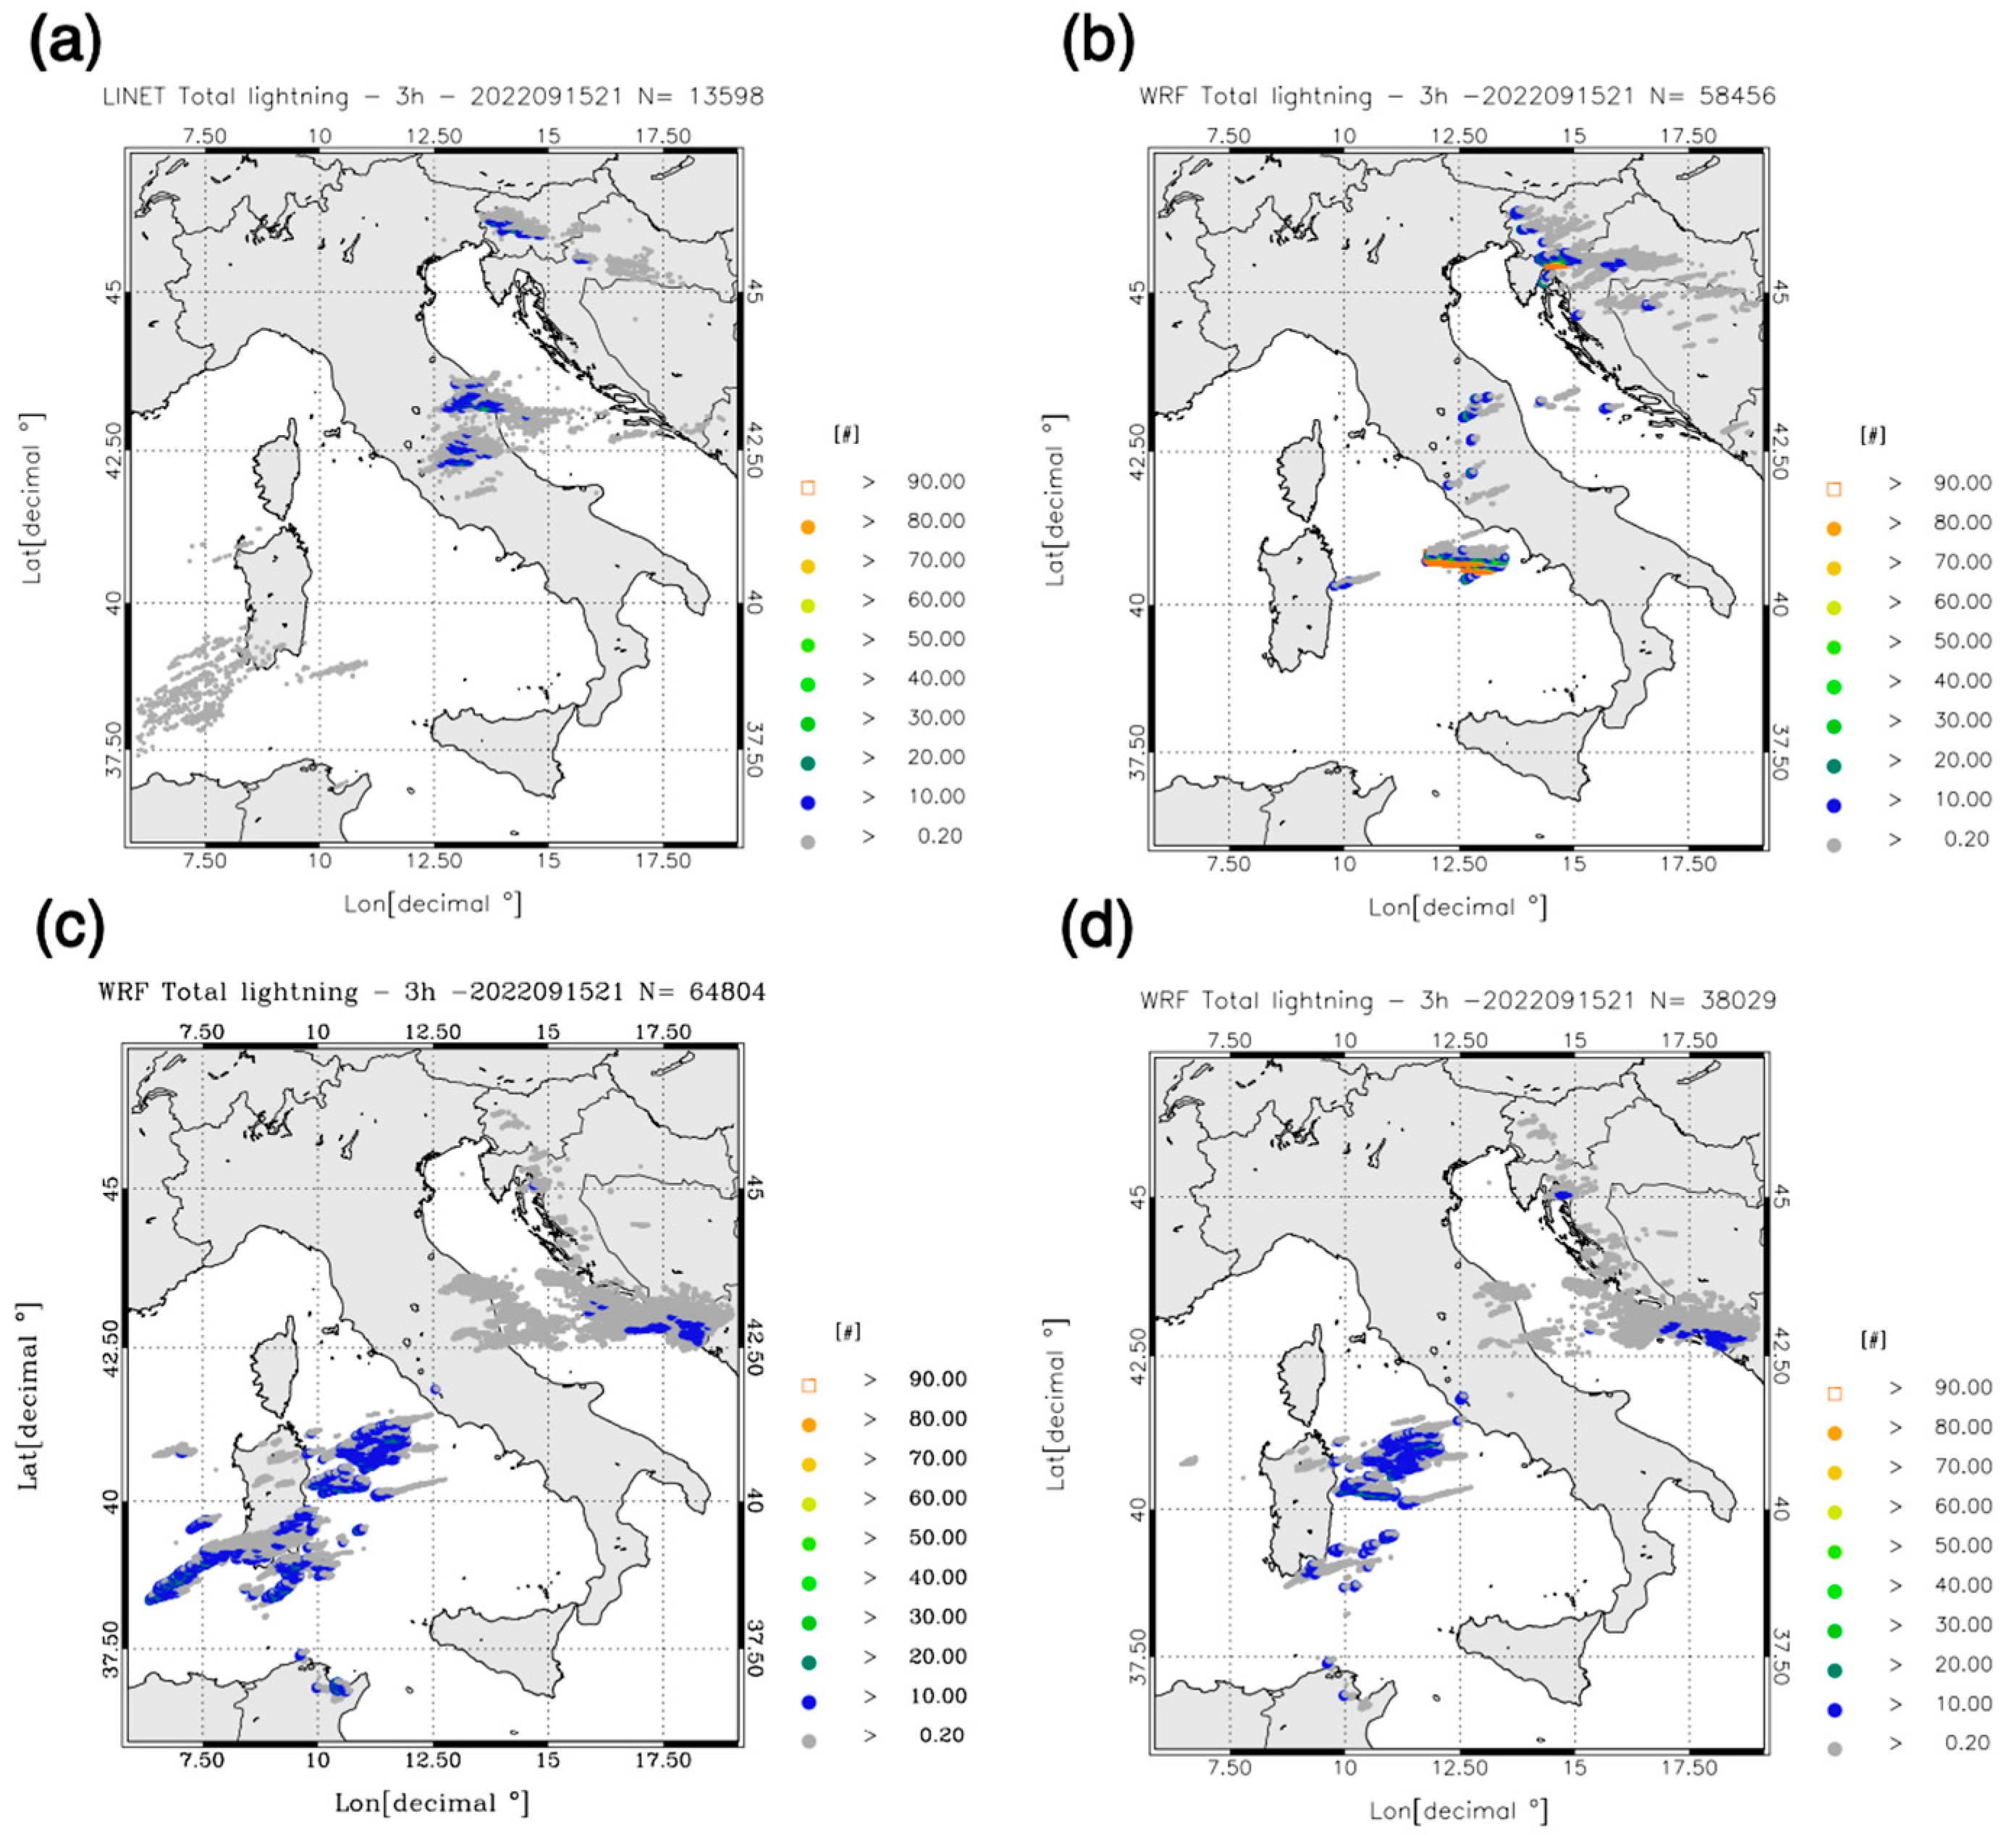
4.2. Lightning Analysis

In this section, we show the impact of LDA on the lightning forecast for the four phases of the storm.
A considerable amount of lightning was recorded during the event by the LINET Network. The total number of strokes varies from 62,767 between 12 and 15 UTC on 15 September to 13,598 between 21 UTC on 15 September and 00 UTC on 16 September. Flashes were recorded mainly over the Tuscany, Umbria and Marche Regions and over the Adriatic Sea.
In the phase between 12 and 15 UTC (Figure 10), the lightning pattern forecast of BCKG reveals clearly that the storm was simulated to the west of its real occurrence. The number of forecasted strokes (30,299) is about half of the observed number (62,767), showing that convection was underestimated by BCKG. The ANL forecast clearly improves the strokes pattern forecast over Central Italy; nevertheless, there is an overestimation of the convective activity in Southern Italy, as for the precipitation forecast (Figure 10c). The total number of lightning strikes is underestimated by the ANL forecast (39,752) for this phase of the event, but the lightning pattern over Central Italy is well represented. The ANL-1H forecast shows the lowest strokes number (27,747); nevertheless, their pattern is well forecast over Central Italy, showing that the improvement in the prediction of the lightning pattern can last after 1–2 h from the latest analysis.
Considering the most intense phase of the storm (15–18 UTC, Figure 11), we note again that convection is predicted by the control forecast to the left of its real occurrence, with some superposition with the real storm. The ANL forecast gives a better positioning of the strokes, while the ANL-1H performance is between those of BCKG and ANL. All simulations show a false alarm of electrical activity over the Tyrrhenian Sea, and all forecasts overestimate the number of strokes. This is especially apparent for the ANL forecast. It is remarked, however, that the forecast of the strokes’ pattern is improved by LDA.
During the third phase (18–21 UTC, Figure 12), the BCKG gives a good prediction of the strokes over the Marche Region, but it misses the strokes over the Adriatic Sea. The latter pattern is well predicted by the ANL and ANL-1H forecasts, which improve the strokes forecast compared to BCKG. All forecasts overestimate the number of strokes.
The forecast of the electrical activity in the last phase of the storm (Figure 13) is not well predicted by any of the forecasts. The BCKG does not represent the electrical activity over the Marche and Adriatic Seas. The ANL and ANL-1H have a better prediction over the Marche and Adriatic Seas; nevertheless, they overestimate by far the electrical activity over Sardinia and the Tyrrhenian Sea.
To better understand the impact of LDA on both the precipitation and lightning forecasts, Figure 14 shows the longitude–height cross-section, along the red line of Figure 5, of the electric potential for all types of strokes (i.e., the sum of the positive, negative and intracloud potential) and the hydrometeor distribution at 16 UTC, i.e., for an intense phase of the storm. In correspondence with the Italian peninsula (10.5–14° E), the control simulation shows some rain occurring over the western and central parts of the Apennines. The convection is not very strong, and the total electric potential is less than 60 MJ. The situation is completely different for the ANL and ANL-1H forecasts. In both cases, the electric potential is much higher and extends from the Apennines to the Adriatic Sea, in line with strokes observations, and the hydrometeor concentration is much higher compared to BCKG. Figure 14 shows that LDA increases the hydrometeor’s abundance, which, in turn, produces a higher electric potential and strokes’ number, as well as more precipitation. The difference between ANL and ANL-1H is also remarkable, and ANL has the highest hydrometeor concentrations and the highest lightning potential. At the same time, it is remarkable that the LDA effects on simulations are well apparent after two hours since the last assimilation.

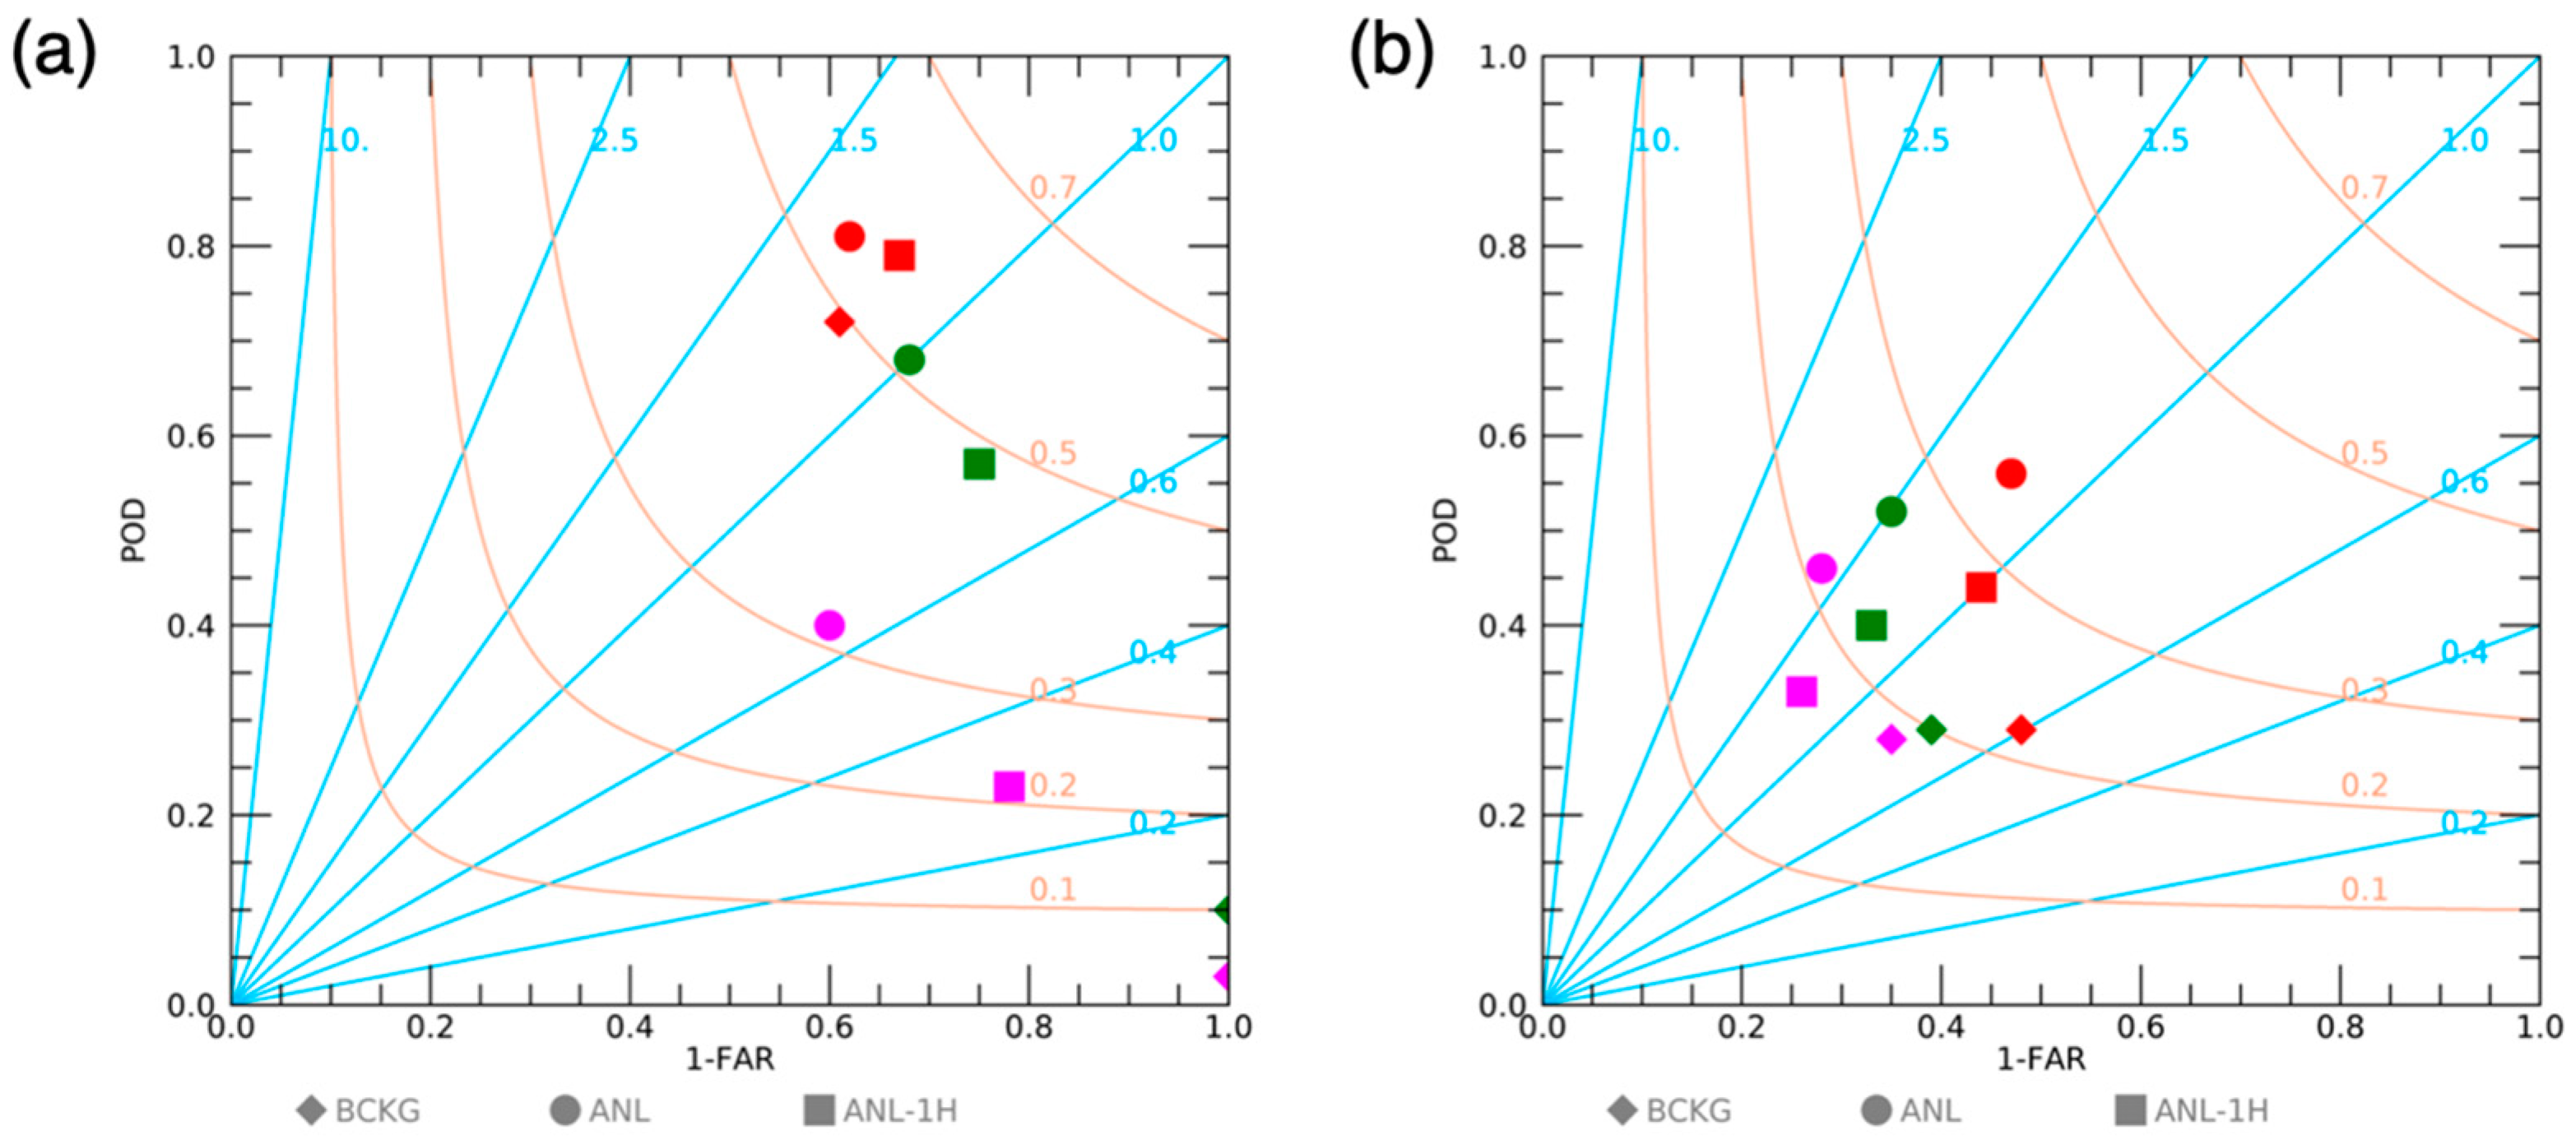
4.3. Performance Diagrams

This section shows the statistical analysis for the precipitation and strokes forecast to summarise the impact of LDA on the case. As regards the precipitation forecast, the statistical scores are presented with the performance diagram for the 1 mm/3 h, 30 mm/3 h and 60 mm/3 h precipitation thresholds (Figure 15a). For the 1 mm/3 h threshold, the scores are similar for all forecasts, with a small improvement for ANL and ANL-1H compared to the BCKG. The POD is high (>70%), and the FAR is about 40%. For the 30 mm/3 h (intense precipitation) threshold, the difference among the simulations is apparent. The BCKG has low performance, as discussed in the previous two sections. The LDA improves substantially the forecast: the POD of ANL is about 70% and that of ANL-1H is about 60%, while the FAR is 30% and 25% for ANL and ANL-1H, respectively.
For the 60 mm/3 h rainfall (very intense events), the performance of all forecasts decreases; nevertheless, the difference between the forecasts assimilating lightning compared to the control forecast is still apparent. The performance difference between ANL and ANL-1H is greater for this threshold compared to 30 mm/3 h, showing that the decrease in performance with forecasting times is larger for higher precipitation thresholds.
Figure 15b shows the performance diagram for the strokes forecast. The performance of the forecast decreases as the strokes’ threshold increases, showing larger errors for deeper convection forecasts. The best performance is for ANL, followed by ANL-1H and BCKG. This result shows that LDA improves not only the precipitation forecast but also the strokes forecast. As for the precipitation forecast, the LDA increases both the POD and the FAR compared to BCKG. An important difference arises when comparing the ANL and ANL-1H forecasts. While for precipitation, ANL has a larger POD and a larger FAR compared to ANL-1H, the strokes’ forecast shows that ANL has a larger POD and a lower FAR compared to ANL-1H. This behaviour is mainly determined by the forecast of the last phase of the storm (Figure 13b–d), when the ANL-1H has false alarms both over the Tyrrhenian Sea, over Croatia and over Bosnia-Herzegovina. These false alarms are less apparent in the ANL forecast, which also has a better POD, as shown, for example, by the strokes correctly predicted southwest of Sardinia. The higher FAR and lower POD of ANL-1H compared to ANL cause a lower TS for ANL-1H, and for the highest threshold (30 strokes/3 h in 24 × 24 km2), the TS of ANL-1H is even lower than the TS of the BCKG.

4.4. A Sensitivity Test

In this section, we show the results of a sensitivity test (simulations ANL-1H_4) that uses the same number of analyses as ANL but starts one hour before, so that it is available at the same time as ANL-1H. Table 1 shows the details of the setting for this simulation. The analysis is limited to the precipitation forecast, as similar comments apply to the lightning forecast. The rainfall predicted for the four phases is shown in Figure 16. From this figure, it is apparent that the forecast of the most intense phase (15–18 UTC) is better predicted by ANL-1H_4 (maximum around 180 mm/3 h) compared to ANL-1H (maximum around 80 mm/3 h). This is an important result because an alert for a very intense thunderstorm in the next three hours could be issued half an hour before its occurrence. The position of the maximum is very well predicted by ANL-1H_4, as it happens for ANL-1H and ANL. Considering the phase between 18 and 21 UTC, the result of ANL-1H_4 is even better than ANL because the rainfall predicted is slightly larger and the position is better represented. The rainfall maximum is between 70 and 80 mm/3 h in ANL-1H_4, similar to that observed, while it is between 50 and 60 mm/3 h for ANL-1H and ANL. However, the ANL-1H_4 configuration was unable to improve the forecast of the last phase, and its prediction remains of the same quality as that of ANL-1H. It is finally noted that no specific differences arise for the first phase between ANL-1H and ANL-1H_4, as ANL-1H_4 predicts the storm to the west of its real position.
Overall, the results of this sensitivity test show that the ANL-1H_4 has better performances than the ANL-1H forecast for two out of the four phases, and it is available at the same time. This makes the ANL-1H_4 configuration preferable.

5. Discussion

We consider the analysis of a severe V-shaped thunderstorm that occurred over Central Italy between 12 UTC on 15 September 2022 and 00 UTC on 16 September 2022. The analysis was made at large and local scales.
The large-scale analysis highlighted the main factors leading to this event. Tropical cyclone Danielle advected humid air masses into the Mediterranean, and the interaction of the circulation induced by the tropical cyclone and the Atlas Mountains generated a new cyclone in the western Mediterranean. This low-pressure system moved eastwards and favoured the advection of humid air masses towards Italy at low tropospheric levels. During 14 and 15 September, a low pressure over Scandinavia and a high pressure over the British Islands acted synergically to focus humid air masses brought by Danielle towards the Mediterranean over the Central Mediterranean and Central Italy, setting the stage for a severe convective event.
Local orographic features, mainly the Apennines, played a fundamental role in triggering and anchoring the thunderstorm to local orographic features. In particular, the intense, self-inducing V-shaped storm lasted over the Marche Region for 12 h, causing heavy rainfall and triggering the flooding of the Misa River.
The study at the local scale is carried out with a WRF model used with homemade 3D-Var software for lightning data assimilation. The forecasting approach is the very short-term forecast at 3 h (VSF-3h), in which a data assimilation phase is followed by a 3 h forecast, and the forecast is updated every 3 h.
Both the ANL and ANL-1H forecasts improve the control forecast, the latter being made without LDA and available the day before the occurrence of the event. The control forecast was not able to catch the bulk of the event over the Marche Region, even if it was able to represent some of the precipitation that occurred over Central Italy, especially over Tuscany, which is located west of the Marche Region. The LDA improves the strokes forecast because the pattern of the observed strokes is much better represented in ANL and ANL-1H simulations compared to the control forecast. This is apparent over the Adriatic Sea, where considerable lightning activity is observed but not simulated by the control forecast, while this lightning activity is correctly predicted by the ANL and ANL-1H forecasts. However, the performance of the lightning scheme and the positive impact of LDA on the strokes forecast decrease for larger strokes intensities.
The above results show the possibility of refining the previous day’s forecast of intense convective events through lightning data assimilation to predict more realistically their intensity and position at the local scale. Of course, the short time of availability of the forecast before the occurrence of the event limits its usefulness, and efforts must be put in this direction to improve the prediction of convective events, giving more time to take actions to mitigate their impacts. The ANL-1H has a worse performance than the ANL, which is in line with previous studies and confirms that the positive impact of LDA on the model forecast decreases rapidly with forecasting time. This is apparent in the last phase of the forecast (between 21 UTC on 15 September and 00 UTC on 16 September), when the ANL forecast has a good performance while the ANL-1H forecast gives a negligible improvement to the control forecast.
A sensitivity test was conducted to show the impact of the number of analyses on the rainfall forecast. We compared the forecasts of two simulations using three (ANL-1H) or four analyses (ANL-1H_4). The latter starts one hour before, and the forecast of the two simulations would be available at the same time. Results show that using four analyses and starting the simulation one hour before has a substantial improvement for the most intense phase and is preferable.
Because the impact of LDA on the lightning forecast is analysed here for the first time over Italy, the effects of LDA in the simulations of the electric potential were shown for the most intense phase of the storm (16 UTC). LDA increases the potential instability of air masses by adding moist static energy, while atmospheric dynamics and physics transform this potential energy, increasing the convection intensity and the hydrometeor concentration (both solid and liquid), which, in turn, increases the electric potential and strokes’ number.
The sensitivity of the Lynn lightning scheme to the intensity of the current (an a priori fixed parameter of the scheme) has an impact on the configuration of the lightning scheme when LDA is used together with the lightning prediction scheme. We used a current of 0.5 × 10⁻⁴ A for the control forecast and a current of 0.3 × 10⁻⁴ A for simulations using LDA. These values were determined after comparing the results of a set of simulations using different current values with LINET observations for this case. The dependency of the strokes simulation on the current parameter was anticipated in Federico et al. [43], who showed the considerable sensitivity of the scheme to the current parameter, which must be tuned for the specific configuration of the NWP model. Because the representation of the convection in the model changes with the model’s horizontal resolution and with LDA, different settings of this parameter are needed.

6. Conclusions

In this paper, we showed the analysis of a recent heavy precipitation event that occurred in Central Italy on 15 September 2022. This event was caused by both large-scale and local-scale ingredients that resulted in a disastrous event with losses of lives and damage to the environment, properties and infrastructure.
The event was analysed at both synoptic and local scales by the WRF model with ECMWF-IFS initial and boundary conditions. The V-shaped thunderstorm acted over Central Italy for about 12 h and precipitation was abundant, with more than 100 mm reported in 21 rain gauges over the area in the 12 h between 12 UTC on 15 September and 00 UTC on 16 September. Because of this heavy rain, the Misa River flooded the area, increasing the impact of the storm.
The role of the lightning data assimilation on the forecast of this event at the short range was examined for precipitation and, for the first time over Italy, for lightning prediction. Results show that for three of the four 3 h phases when the storm was very intense over the Marche Region, LDA helped to improve the control forecast. This improvement is both for the location and intensity of the precipitation and for strokes density fields. The forecast was available 30 min before the 3 h phase, leaving some time to take immediate action. For the last phase, only the simulation assimilating lightning until 21 UTC and available half an hour inside the forecasted phase was able to catch the intensity of the event over the Adriatic coast. LDA is useful to improve the strokes forecast, especially for the location of the area impacted by strokes, while the number of forecasted strokes is overestimated in the second phase of the event.
Finally, it is noted the different behaviour of the performance of the lightning and precipitation forecasts. For the strokes forecast, the simulation assimilating lightning until the start of the forecast phase (ANL) has a larger POD and a lower FAR compared to the simulation assimilating lightning until 1 h before the forecast phase (ANL-1H). For the precipitation forecast, ANL has a larger POD but also a larger FAR than ANL-1H. The result for precipitation was already set in many previous studies and is robust, while the result for the strokes forecast needs further studies to be confirmed. However, if this result is confirmed, it will show a larger degradation of the strokes forecast compared to the precipitation forecast as the forecasting time increases.
This result shows that even if precipitation and lightning forecasts are related, their behaviour is not identical because the two parameters are different. Lightning is a manifestation of deep convection, while rainfall also occurs in stratiform environments, as may have occurred in some parts of the domain in this case. Moreover, lightning can be easily verified over the sea, while this is more complicated, yet possible [40], for precipitation. The different behaviour of the scores between lightning and precipitation is partially caused by the fact that the former is also verified over the sea.
A sensitivity test (ANL-1H_4) is presented in which the simulation starts one hour before ANL-1H and has one more analysis. Results show that the ANL-1H_4 forecast has a better performance than ANL-1H for two out of the four phases, and for this reason, it is preferable.
Overall, this study shows that LDA can improve both precipitation and lightning forecasts in the short range (0–3 h). Future works, however, should consider the possibility of suppressing spurious convection by LDA as well as the possibility of improving precipitation and lightning prediction for longer time ranges.

Author Contributions

Conceptualization, R.C.T., S.F. and S.D.; methodology, R.C.T. and S.F.; software, R.C.T. and F.E.T.; validation, R.C.T., F.E.T., M.P. and S.F.; investigation, R.C.T. and S.F.; resources, S.D., S.F. and F.D.F.; data curation, F.E.T.; writing—original draft preparation, R.C.T., F.E.T. and S.F.; writing—review and editing, R.C.T., F.E.T., M.P., F.D.F. and S.D.; funding acquisition, F.D.F. and S.F. All authors have read and agreed to the published version of the manuscript.

Funding

This work was realised in the project AEROMET (AERO spatial data assimilation for METeorological weather prediction) funded by the Lazio Region—FESR Fondo Europeo di Sviluppo Regionale Programma Operativo regionale del Lazio. Contract number A0375-2020-36588.

Data Availability Statement

The WRF data presented in this study are available on request from the corresponding author. The 3D-Var software can be requested to the corresponding author. The observed data cannot be redistributed by the authors.

Acknowledgments

ECMWF is acknowledged for providing part of the computational resources for the project AEROMET through the SPITFEDE special project and for providing initial and boundary conditions for the simulation of the WRF model. LINET data can be acquired from Nowcast GmbH. Simulated flash data can be requested from the corresponding author.

Conflicts of Interest

The authors declare no conflict of interest.

References

  1. Masson-Delmotte, V.; Zhai, P.A.; Pirani, S.; Péan, C.; Berger, S.; Caud, N.; Chen, Y.; Goldfarb, L.; Gomis, M.; Huang, M.; et al. IPCC, 2021: Climate Change 2021: The Physical Science Basis. In Contribution of Working Group I to the Sixth Assessment Report of the Intergovernmental Panel on Climate Change; Cambridge University Press: Cambridge, UK, 2021. [Google Scholar]
  2. Rädler, A.T.; Groenemeijer, P.H.; Faust, E.; Sausen, R.; Púčik, T. Frequency of severe thunderstorms across Europe expected to increase in the 21st century due to rising instability. NPJ Clim. Atmos. Sci. 2019, 2, 30. [Google Scholar] [CrossRef] [Green Version]
  3. Hoeppe, P. Trends in weather related disasters—Consequences for insurers and society. Weather Clim. Extrem. 2016, 11, 70–79. [Google Scholar] [CrossRef] [Green Version]
  4. Púčik, T.; Groenemeijer, P.; Rädler, A.T.; Tijssen, L.; Nikulin, G.; Prein, A.F.; van Meijgaard, E.; Fealy, R.; Jacob, D.; Teichmann, C. Future changes in European severe convection environments in a regional climate model ensemble. J. Clim. 2017, 30, 6771–6794. [Google Scholar] [CrossRef] [Green Version]
  5. Van Delden, A. The synoptic setting of thunderstorms in western Europe. Atmos. Res. 2001, 56, 89–110. [Google Scholar] [CrossRef]
  6. Rädler, A.T.; Groenemeijer, P.; Faust, E.; Sausen, R. Detecting severe weather trends using an additive regressive convective hazard model (AR-CHaMo). J. Appl. Meteorol. Climatol. 2018, 57, 569–587. [Google Scholar] [CrossRef] [Green Version]
  7. Jansa, A.; Alpert, P.; Arbogast, P.; Buzzi, A.; Ivancanpicek, B.; Kotroni, V.; Llasat, M.C.; Ramis, C.; Richard, E.; Romero, R.; et al. MEDEX: A general overview. Nat. Hazards Earth Syst. Sci. 2014, 14, 1965–1984. [Google Scholar] [CrossRef] [Green Version]
  8. Ducrocq, V.; Braud, I.; Davolio, S.; Ferretti, R.; Flamant, C.; Jansá, A.; Kalthoff, N.; Richard, E.; Taupier-Letage, I.; Ayral, P.-A.; et al. HyMeX-SOP1: The Field Campaign Dedicated to Heavy Precipitation and Flash Flooding in the Northwestern Mediterranean. Bull. Am. Meteorol. Soc. 2014, 95, 1083–1100. [Google Scholar] [CrossRef] [Green Version]
  9. Flaounas, E.; Davolio, S.; Raveh-Rubin, S.; Pantillon, F.; Miglietta, M.M.; Gaertner, M.A.; Hatzaki, M.; Homar, V.; Khodayar, S.; Korres, G.; et al. Mediterranean cyclones: Current knowledge and open questions on dynamics, prediction, climatology and impacts. Weather Clim. Dynam. 2022, 3, 173–208. [Google Scholar] [CrossRef]
  10. Flaounas, E.; Kotroni, V.; Lagouvardos, K.; Gray, S.L.; Rysman, J.-F.; Claud, C. Heavy rainfall in Mediterranean cyclones. Part I: Contribution of deep convection and warm conveyor belt. Clim. Dynam. 2018, 50, 2935–2949. [Google Scholar] [CrossRef] [Green Version]
  11. Federico, S.; Avolio, E.; Pasqualoni, L.; Bellecci, C. Atmospheric patterns for heavy rain events in Calabria. Nat. Hazards Earth Syst. Sci. 2008, 8, 1173–1186. [Google Scholar] [CrossRef] [Green Version]
  12. Winschall, A.; Sodemann, H.; Pfahl, S.; Wernli, H. How important is intensified evaporation for Mediterranean precipitation extremes? J. Geophys. Res. Atmos. 2014, 119, 5240–5256. [Google Scholar] [CrossRef]
  13. Chazette, P.; Flamant, C.; Raut, J.-C.; Totems, J.; Shang, X. Tropical moisture enriched storm tracks over the Mediterranean and their link with intense rainfall in the Cevennes-Vivarais area during HyMeX. Q. J. R. Meteorol. Soc. 2016, 142, 320–334. [Google Scholar] [CrossRef]
  14. Lee, K.-O.; Flamant, C.; Ducrocq, V.; Duffourg, F.; Fourrié, N.; Delanoë, J.; Bech, J. Initiation and development of a mesoscale convective system in the Ebro River Valley and related heavy precipitation over north-eastern Spain during HyMeX IOP 15a. Q. J. R. Meteor. Soc. 2017, 143, 942–956. [Google Scholar] [CrossRef] [Green Version]
  15. Raveh-Rubin, S.; Wernli, H. Large-scale wind and precipita-tion extremes in the Mediterranean: Dynamical aspects of five selected cyclone events. Q. J. R. Meteorol. Soc. 2016, 142, 3097–3114. [Google Scholar] [CrossRef]
  16. Duffourg, F.; Lee, K.O.; Ducrocq, V.; Flamant, C.; Chazette, P.; Di Girolamo, P. Role of moisture patterns in the backbuilding formation of HyMeX IOP13 Heavy Precipi-tating Systems. Q. J. R. Meteor. Soc. 2018, 144, 291–303. [Google Scholar] [CrossRef]
  17. Krichak, S.O.; Feldstein, S.B.; Alpert, P.; Gualdi, S.; Scoccimarro, E.; Yano, J.-I. Discussing the role of tropical and subtropical moisture sources in cold season extreme precipitation events in the Mediterranean region from a climate change perspective. Nat. Hazards Earth Syst. Sci. 2016, 16, 269–285. [Google Scholar] [CrossRef] [Green Version]
  18. Davolio, S.; Della Fera, S.; Laviola, S.; Miglietta, M.M.; Levizzani, V. Heavy Precipitation over Italy from the Mediterranean Storm “Vaia” in October 2018: Assessing the Role of an Atmospheric River. Mon. Weather Rev. 2020, 148, 3571–3588. [Google Scholar] [CrossRef]
  19. Benjamin, S.G.; Dévényi, D.; Weygandt, S.S.; Brundage, K.J.; Brown, J.M.; Grell, G.A.; Manikin, G.S. An Hourly Assimilation–Forecast Cycle: The RUC. Mon. Weather Rev. 2004, 132, 495–518. [Google Scholar] [CrossRef]
  20. Lagasio, M.; Silvestro, F.; Campo, L.; Parodi, A. Predictive Capability of a High-Resolution Hydrometeorological Forecasting Framework Coupling WRF Cycling 3DVAR and Continuum. J. Hydrometeor. 2019, 20, 1307–1337. [Google Scholar] [CrossRef]
  21. Federico, S.; Torcasio, R.C.; Puca, S.; Vulpiani, G.; Comellas Prat, A.; Dietrich, S.; Avolio, E. Impact of Radar Reflectivity and Lightning Data Assimilation on the Rainfall Forecast and Predictability of a Summer Convective Thunderstorm in Southern Italy. Atmosphere 2021, 12, 958. [Google Scholar] [CrossRef]
  22. Papadopoulos, A.; Chronis, T.G.; Anagnostou, E.N. Improving Convective Precipitation Forecasting through Assimilation of Regional Lightning Measurements in a Mesoscale Model. Mon. Weather Rev. 2005, 133, 1961–1977. [Google Scholar] [CrossRef] [Green Version]
  23. Fierro, A.O.; Mansell, E.R.; Ziegler, C.L.; MacGorman, D.R. Application of a Lightning Data Assimilation Technique in the WRF-ARW Model at Cloud-Resolving Scales for the Tornado Outbreak of 24 May 2011. Mon. Weather Rev. 2012, 140, 2609–2627. [Google Scholar] [CrossRef]
  24. Fierro, A.O.; Wang, Y.; Gao, J.; Mansell, E.R. Variational Assimilation of Radar Data and GLM Lightning-Derived Water Vapor for the Short-Term Forecasts of High-Impact Convective Events. Mon. Weather Rev. 2019, 147, 4045–4069. [Google Scholar] [CrossRef]
  25. Qie, X.; Zhu, R.; Yuan, T.; Wu, X.; Li, W.; Liu, D. Application of total-lightning data assimilation in a mesoscale convective system based on the WRF model. Atmos. Res. 2014, 145–146, 255–266. [Google Scholar] [CrossRef]
  26. Mansell, E.R. Storm-Scale Ensemble Kalman Filter Assimilation of Total Lightning Flash-Extent Data. Mon. Weather Rev. 2014, 142, 3683–3695. [Google Scholar] [CrossRef]
  27. Chen, Z.; Qie, X.; Liu, D.; Xiong, Y. Lightning data assimilation with comprehensively nudging water contents at cloud-resolving scale using WRF model. Atmos. Res. 2019, 221, 72–87. [Google Scholar] [CrossRef]
  28. Comellas Prat, A.; Federico, S.; Torcasio, R.C.; Fierro, A.O.; Dietrich, S. Lightning data assimilation in the WRF-ARW model for short-term rainfall forecasts of three severe storm cases in Italy. Atmos. Res. 2021, 247, 105246. [Google Scholar] [CrossRef]
  29. Wang, Y.; Yang, Y.; Liu, D.; Zhang, D.; Yao, W.; Wang, C. A Case Study of Assimilating Lightning-Proxy Relative Humidity with WRF-3DVAR. Atmosphere 2017, 8, 55. [Google Scholar] [CrossRef] [Green Version]
  30. Fierro, A.O.; Gao, L.; Ziegler, C.L.; Calhoun, K.M.; Mansell, E.R.; MacGorman, D.R. Assimilation of Flash Ex-tent Data in the Variational Framework at Convection-Allowing Scales: Proof-of-Concept and Evaluation for the Short-Term Forecast of the 24 May 2011 Tornado Outbreak. Mon. Weather Rev. 2016, 144, 4373–4393. [Google Scholar] [CrossRef]
  31. Alexander, G.D.; Weinman, J.A.; Karyampudi, V.M.; Olson, W.S.; Lee, A.C.L. The Effect of Assimilating Rain Rates Derived from Satellites and Lightning on Forecasts of the 1993 Superstorm. Mon. Weather Rev. 1999, 127, 1433–1457. [Google Scholar] [CrossRef]
  32. Pessi, A.T.; Businger, S. Relationships among Lightning, Precipitation, and Hydrometeor Characteristics over the North Pacific Ocean. J. Appl. Meteorol. Clim. 2009, 48, 833–848. [Google Scholar] [CrossRef]
  33. Wang, Y.; Yang, Y.; Wang, C. Improving forecasting of strong convection by assimilating cloud-to-ground lightning data using the physical initialization method. Atmos. Res. 2014, 150, 31–41. [Google Scholar] [CrossRef]
  34. Chen, Y.; Yu, Z.; Han, W.; He, J.; Chen, M. Case Study of a Retrieval Method of 3D Proxy Reflectivity from FY-4A Lightning Data and Its Impact on the Assimilation and Forecasting for Severe Rainfall Storms. Remote Sens. 2020, 12, 1165. [Google Scholar] [CrossRef] [Green Version]
  35. Vendrasco, E.P.; Machado, L.A.T.; Araujo, C.S.; Ribaud, J.F.; Ferreira, R.C. Potential use of the GLM for nowcasting and data assimilation. Atmos. Res. 2020, 242, 105019. [Google Scholar] [CrossRef]
  36. Zhang, Y.; Chen, Z.; Xiao, X.; Qie, X.; Chen, M.; Lu, J.; Wang, D.; Yuan, S.; Lyu, H.; Feng, J.; et al. Combined assimilation of radar and lightning data for the short-term forecast of severe convection system. Atmos. Res. 2023, 283, 106562. [Google Scholar] [CrossRef]
  37. Marchand, M.; Fuelberg, H. Assimilation of lightning data using a nudging method involving low-level warming. Mon. Weather Rev. 2014, 142, 4850–4871. [Google Scholar] [CrossRef]
  38. Erdmann, F.; Caumont, O.; Defer, E. Assimilation of Meteosat Third Generation (MTG) Lightning Imager (LI) observations in AROME-France—Proof of Concept, EGUsphere. Comput. Chem. Eng. 2022, 166, 107898. [Google Scholar] [CrossRef]
  39. Federico, S.; Petracca, M.; Panegrossi, G.; Dietrich, S. Improvement of RAMS precipitation forecast at the short- range through lightning data assimilation. Nat. Hazards Earth Syst. Sci. 2017, 17, 61–76. [Google Scholar] [CrossRef] [Green Version]
  40. Torcasio, R.C.; Federico, S.; Comellas Prat, A.; Panegrossi, G.; D’Adderio, L.P.; Dietrich, S. Impact of lightning data assimilation on the short-term precipitation forecast over the Central Mediterranean Sea. Remote Sens. 2021, 13, 682. [Google Scholar] [CrossRef]
  41. Federico, S.; Torcasio, R.C.; Avolio, E.; Caumont, O.; Montopoli, M.; Baldini, L.; Vulpiani, G.; Dietrich, S. The impact of lightning and radar reflectivity factor data assimilation on the very short-term rainfall forecasts of RAMS@ISAC: Application to two case studies in Italy. Nat. Hazards Earth Syst. Sci. 2019, 19, 1839–1864. [Google Scholar] [CrossRef] [Green Version]
  42. Federico, S. Implementation of a 3D-Var system for atmospheric profiling data assimilation into the RAMS model: Initial results. Atmos. Meas. Tech. 2013, 6, 3563–3576. [Google Scholar] [CrossRef] [Green Version]
  43. Federico, S.; Torcasio, R.C.; Lagasio, M.; Lynn, B.H.; Puca, S.; Dietrich, S. A Year-Long Total Lightning Forecast over Italy with a Dynamic Lightning Scheme and WRF. Remote Sens. 2022, 14, 3244. [Google Scholar] [CrossRef]
  44. Lynn, B.H.; Yair, Y.; Price, C.; Kelman, G.; Clark, A.J. Predicting cloud-to-ground and intracloud lightning in weather forecast models. Weather Forecast. 2012, 27, 1470–1488. [Google Scholar] [CrossRef]
  45. Lynn, B.H.; Kelman, G.; Ellrod, G. An evaluation of the efficacy of using observed lightning to improve convective lightning forecasts. Weather Forecast. 2015, 30, 405–423. [Google Scholar] [CrossRef]
  46. Lynn, B.H. The Usefulness and Economic Value of Total Lightning Forecasts Made with a Dynamic Lightning Scheme Coupled with Lightning Data Assimilation. Weather Forecast. 2017, 32, 645–663. [Google Scholar] [CrossRef]
  47. Skamarock, W.C.; Klemp, J.B.; Dudhia, J.; Gill, D.O.; Liu, Z.; Berner, J.; Wang, W.; Powers, J.G.; Duda, M.G.; Barker, D.M.; et al. A Description of the Advanced Research WRF, Version 4; No. NCAR/TN-556+STR, NCAR Technical Note; National Center for Atmospheric Research: Boulder, CO, USA, 2019; 145p. [Google Scholar] [CrossRef]
  48. Thompson, G.; Field, P.R.; Rasmussen, R.M.; Hall, W.D. Explicit Forecasts of Winter Precipitation Using an Improved Bulk Microphysics Scheme. Part II: Implementation of a New Snow Parameterization. Mon. Weather Rev. 2008, 136, 5095–5115. [Google Scholar] [CrossRef]
  49. Janjic, Z.I. The step-mountain eta coordinate model: Further developments of the convection, viscous sublayer, and turbulence closure schemes. Mon. Weather Rev. 1994, 122, 927–945. [Google Scholar] [CrossRef]
  50. Dudhia, J. Numerical study of convection observed during the Winter Monsoon Experiment using a mesoscale two-dimensional model. J. Atmos. Sci. 1989, 46, 3077–3107. [Google Scholar] [CrossRef]
  51. Mlawer, E.J.; Taubman, S.J.; Brown, P.D.; Iacono, M.J.; Clough, S.A. Radiative transfer for inhomogeneous atmospheres: RRTM, a validated correlated-k model for the longwave. J. Geophys. Res.-Space 1997, 102, 16663–16682. [Google Scholar] [CrossRef] [Green Version]
  52. Marra, A.C.; Federico, S.; Montopoli, M.; Avolio, E.; Baldini, L.; Casella, D.; D’Adderio, L.P.; Dietrich, S.; Sanò, P.; Torcasio, R.C.; et al. The Precipitation Structure of the Mediterranean Tropical-Like Cyclone Numa: Analysis of GPM Observations and Numerical Weather Prediction Model Simulations. Remote Sens. 2019, 11, 1690. [Google Scholar] [CrossRef] [Green Version]
  53. Mascitelli, A.; Federico, S.; Fortunato, M.; Avolio, E.; Torcasio, R.C.; Realini, E.; Mazzoni, A.; Transerici, C.; Crespi, M.; Dietrich, S. Data assimilation of GNSS-ZTD into the RAMS model through 3D-Var: Preliminary results at the regional scale. Meas. Sci. Technol. 2019, 30, 055801. [Google Scholar] [CrossRef] [Green Version]
  54. Federico, S.; Torcasio, R.C.; Mascitelli, A.; Del Frate, F.; Dietrich, S. Preliminary Results of the AEROMET Project on the Assimilation of the Rain-Rate from Satellite Observations. In Proceedings of the Computational Science and Its Applications—ICCSA 2022 Workshops, Malaga, Spain, 4–7 July 2022; Proceedings, Part IV. Springer Nature: Cham, Switzerland; pp. 527–539. [Google Scholar] [CrossRef]
  55. Parrish, D.F.; Derber, J.C. The National Meteorological Center’s Spectral Statistical Interpolation analysis system. Mon. Weather Rev. 1992, 120, 1747–1763. [Google Scholar] [CrossRef]
  56. Williams, E.R. The tripole structure of thunderstorms. J. Geophys. Res. 1989, 94, 13151–13167. [Google Scholar] [CrossRef]
  57. Betz, H.D.; Schmidt, K.; Laroche, P.; Blanchet, P.; Oettinger, W.P.; Defer, E.; Dziewit, Z.; Konarski, J. LINET—An international lightning detection network in Europe. Atmos. Res. 2009, 91, 564–573. [Google Scholar] [CrossRef]
  58. Betz, H.-D.; Schmidt, K.; Oettinger, P.; Wirz, M. Lightning detection with 3D-discrimination of intracloud and cloud-to-ground discharges. J. Geophys. Res. Lett. 2004, 31, L11108. [Google Scholar] [CrossRef]
  59. Federico, S.; Avolio, E.; Petracca, M.; Panegrossi, G.; Sanò, P.; Casella, D.; Dietrich, S. Simulating lightning into the RAMS model: Implementation and preliminary results. Nat. Hazards Earth Syst. Sci. 2014, 14, 2933–2950. [Google Scholar] [CrossRef] [Green Version]
  60. Davolio, S.; Ferretti, R.; Baldini, L.; Casaioli, M.; Cimini, D.; Ferrario, M.E.; Gentile, S.; Loglisci, N.; Maiello, I.; Manzato, A.; et al. The role of the Italian scientific community in the first HyMeX SOP: An outstanding multidisciplinary experience. Meteorol. Z. 2015, 24, 261–267. [Google Scholar] [CrossRef]
  61. Roebber, P.J. Visualizing multiple measures of forecast quality. Weather Forecast. 2009, 24, 601–608. [Google Scholar] [CrossRef] [Green Version]
Figure 1. Analysis at the surface: sea level pressure (filled contours) and surface winds (10 m, reference vector in the upper right corner of each panel) at: (a) 12 UTC on 12 September; (b) 12 UTC on 13 September; (c) 12 UTC on 14 September, and (d) 12 UTC on 15 September. FCST stands for forecast.
Atmosphere 14 01152 g001
Figure 2. Analysis at mid-tropospheric levels 500 hPa: geopotential height (filled contours), temperature (cyan contours) and winds (reference vector in the upper right corner of each panel) at: (a) 12 UTC on 12 September; (b) 12 UTC on 13 September; (c) 12 UTC on 14 September, and (d) 12 UTC on 15 September.
Atmosphere 14 01152 g002
Figure 3. Analysis at 700 hPa: specific humidity (filled contours) and winds (reference vector in the upper right corner of each panel) at: (a) 12 UTC on 12 September; (b) 12 UTC on 13 September; (c) 12 UTC on 14 September, and (d) 12 UTC on 15 September.
Atmosphere 14 01152 g003
Figure 4. MSG-SEVIRI HRV cloud composite at 12 UTC (a) and 16 UTC (b). Copyright Eumetsat. Images are from https://view.eumetsat.int/productviewer?v=msg_fes:rgb_eview (last access 4 July 2023).
Atmosphere 14 01152 g004
Figure 5. Orography of the WRF model at 2 km horizontal resolution. The red line shows the latitude–height cross-section of Figure 14.
Atmosphere 14 01152 g005
Figure 6. Rainfall observed by rain gauges (a) and forecasted by BCKG (b), ANL (c) and ANL-1H (d) between 12 and 15 UTC on 15 September. The numbers in the title of panel (a) show the number of reporting rain gauges (first number in parentheses) and the number of rain gauges with precipitation larger than 0.2 mm (second number in parentheses).
Atmosphere 14 01152 g006
Figure 7. Rainfall observed by rain gauges (a) and forecasted by BCKG (b), ANL (c) and ANL-1H (d) between 15 and 18 UTC on 15 September. The numbers in the title of panel (a) show the number of reporting rain gauges (first number in parentheses) and the number of rain gauges with precipitation larger than 0.2 mm (second number in parentheses).
Atmosphere 14 01152 g007
Figure 8. Rainfall observed by rain gauges (a) and forecasted by BCKG (b), ANL (c) and ANL-1H (d) between 18 and 21 UTC on 15 September. The numbers in the title of panel (a) show the number of reporting rain gauges (first number in parentheses) and the number of rain gauges with precipitation larger than 0.2 mm (second number in parentheses).
Atmosphere 14 01152 g008
Figure 9. Rainfall observed by rain gauges (a) and forecasted by BCKG (b), ANL (c) and ANL-1H (d) between 21 UTC on 15 September and 00 UTC on 16 September. The numbers in the title of panel (a) show the number of reporting rain gauges (first number in parentheses) and the number of rain gauges with precipitation larger than 0.2 mm (second number in parentheses).
Atmosphere 14 01152 g009
Figure 10. Strokes observed (a) and forecasted by BCKG (b), ANL (c) and ANL-1H (d) between 12 and 15 UTC on 15 September. The total number of strokes in each time interval is shown in the title of each panel. The symbol # stands for number.
Atmosphere 14 01152 g010
Figure 11. Strokes observed (a) and forecasted by BCKG (b), ANL (c) and ANL-1H (d) between 15 and 18 UTC on 15 September. The total number of strokes in each time interval is shown in the title of each panel.
Atmosphere 14 01152 g011
Figure 12. Strokes observed (a) and forecasted by BCKG (b), ANL (c) and ANL-1H (d) between 18 and 21 UTC on 15 September. The total number of strokes in each time interval is shown in the title of each panel.
Atmosphere 14 01152 g012
Figure 13. Strokes observed (a) and forecasted by BCKG (b), ANL (c) and ANL-1H (d) between 21 UTC on 15 September and 00 UTC on 16 September. The total number of strokes in each time interval is shown in the title of each panel.
Atmosphere 14 01152 g013
Figure 14. Longitude–height cross-section in correspondence with the red line of Figure 5 for rain + cloud (red contours from 0.5 g/kg every 1 g/kg), for graupel (blue contours from 0.5 g/kg every 1 g/kg) and for snow + ice (black contours from 0.5 g/kg every 1 g/kg). Filled contours show the electric potential (sum of the positive, negative and intracloud electric potential in MJ). (a) is for CTRL forecast; (b) is for ANL forecast; and (c) is for ANL-1H forecast.
Atmosphere 14 01152 g014
Figure 15. Performance diagrams for the precipitation (a) and lightning (b) forecasts. BCKG is shown with a filled diamond, ANL is shown with a filled circle, and ANL-1H is shown with a filled square. For precipitation, the 1 mm/3 h (red symbols), 30 mm/3 h (green symbols) and 60 mm/3 h thresholds (magenta symbols) are shown; for lightning, the 1 stroke for 24 km grid spacing and 3 h time interval (red symbol), the 10 strokes for 24 km grid spacing and 3 h time interval (green symbol) and the 30 strokes for 24 km grid spacing and 3 h time interval (magenta symbol) are shown.
Atmosphere 14 01152 g015
Figure 16. Rainfall forecast for the ANL-1H_4: (a) between 12 and 15 UTC on 15 September; (b) between 15 and 18 UTC on 15 September; (c) between 18 and 21 UTC on 15 September; (d) between 21 UTC on 15 September and 00 UTC on 16 September.
Atmosphere 14 01152 g016
Table 1. Simulation types and ranges considered. All times are in UTC.
Simulation Start TimeEnd TimeLightning Data Assimilation (Every 1 h)Assimilation Time RangeForecast Verification Time Range
1 BCKG12 on 14 September 00 on 16 SeptemberNo-12–15 on 15 September
ANL09 on 15 September15 on 15 September Yes at 09, 10,
11, 12
09–12 on 15 September12–15 on 15 September
ANL-1H09 on 15 September15 on 15 SeptemberYes at 09, 10,
11
09–11 on 15 September12–15 on 15 September
ANL-1H_408 on 15 September15 on 15 SeptemberYes at 08, 09, 10, 1108–11 on 15 September12–15 on 15 September
2BCKG12 on 14 September 00 on 16 SeptemberNo-15–18 on 15 September
ANL12 on 15 September18 on 15 SeptemberYes at 12, 13,
14, 15
12–15 on 15 September15–18 on 15 September
ANL-1H12 on 15 September18 on 15 SeptemberYes at 12, 13
14
12–14 on 15 September15–18 on 15 September
ANL-1H_411 on 15 September18 on 15 SeptemberYes at 11, 12, 13,
14
11–14 on 15 September15–18 on 15 September
3BCKG12 on 14 September00 on 16 September No-18–21 on 15 September
ANL15 on 15 September21 on 15 SeptemberYes at 15, 16,
17, 18
15–18 on 15 September18–21 on 15 September
ANL-1H15 on 15 September21 on 15 SeptemberYes at 15, 16
17
15–17 on 15 September18–21 on 15 September
ANL-1H_414 on 15 September21 on 15 SeptemberYes at 14, 15, 16
17
14–17 on 15 September18–21 on 15 September
4BCKG12 on 14 September 00 on 16 SeptemberNo-21 on 15 September–00 on 16 September
ANL18 on 15 September00 on 16 SeptemberYes at 18, 19,
20, 21
18–21 on 15 September21 on 15 September–00 on 16 September
ANL-1H18 on 15 September00 on 16 SeptemberYes at 18, 19,
20
18–20 on 15 September21 on 15 September–00 on 16 September
ANL-1H_417 on 15 September00 on 16 SeptemberYes at 17, 18, 19,
20
17–20 on 15 September21 on 15 September–00 on 16 September
Disclaimer/Publisher’s Note: The statements, opinions and data contained in all publications are solely those of the individual author(s) and contributor(s) and not of MDPI and/or the editor(s). MDPI and/or the editor(s) disclaim responsibility for any injury to people or property resulting from any ideas, methods, instructions or products referred to in the content.

