Abstract
Here, we investigate the characteristics of spider lightning analyzing individual lightning flashes as well as the overall electric storm system. From July to November 2022, optical camera systems captured the visually spectacular spider lightning in Southwest Florida. The aspects and activities of the discharges were analyzed by merging the video images with lightning flash data from the National Detection Lightning Network (NLDN) and the Geostationary Lightning Mapper (GLM). Spider lightning discharges primarily occurred during the later stages of the overall lightning activity when there was a decrease in the flash count and flash locations were drifting apart. The propagation path of the spider discharge was predominantly luminous and exhibited an extended duration, ranging from 300 ms to 1720 ms, with most of the path remaining continuously illuminated. Occasionally, observed discharges produced cloud-to-ground flashes (CG) along their propagation paths. This study represents the first attempt to utilize video images, NLDN, and GLM data to investigate the correlation between visual observed spider lightning events and detection networks. These combined datasets facilitated the characterization of the observed spider lightning discharges.
1. Introduction
Lightning is a fascinating, beautiful, and dangerous natural phenomenon. Florida’s peninsula extends nearly 800 km from its northern border, with the Gulf of Mexico and the Atlantic Ocean separated by ~260 km of land. This unique landform combined with its location gives rise to ideal lifting conditions for thunderstorms, followed by storm decay, and meteorological conditions that include warm air temperatures and high moisture. Consequently, an abundance of lightning activity, and furthermore, a variety of lightning discharge types, can be observed in Florida.
Approximately 75% of lightning activity consists of cloud discharges (ICs). The remaining 25% consists of cloud-to-ground discharges (CGs). Downward negative lightning transports a negative charge from the cloud to the ground and accounts for over 90% of all CG discharges [1]. A typical cloud charge configuration involves a tripolar structure consisting of upper main positive, lower main negative, and lower positive charge regions [2,3]. In Florida, during summer storms, the main positive and negative charges have similar magnitudes, with vertical displacements at heights of around 12 km and 7 km, respectively [4]. The lower positive charge region is at a height of approximately 2 km [1]. The temperature in the negative region ranges from −10 °C to −20 °C, and the upper positive charge region has a temperature below −20 °C during summer storms in Florida [1].
IC flashes typically initiate at the upper boundary of the negative charge and discharge between the main negative and positive charge regions [5]. In contrast, positive/negative CG flashes are typically associated with the main positive/negative charge regions [6,7]. IC flashes may manifest as extensive horizontal channels, commonly referred to as “spider lightning”. The term “spider lightning” comes from the branched nature of its discharge path resembling a spider web, and its gradual development that resembles the crawling motion of a spider [8]. Spider lightning is a visually observable, horizontally stratified discharge that exhibits multiple branches (positive/negative leaders have variable behavior [9]) and propagates along the cloud base [10,11]. The propagation path of spider discharges extends tens to hundreds of kilometers and lasts for tens to hundreds of milliseconds [8]. The sustained luminosity observed in spider lightning is attributed to the continuing current along the discharge path. During the dissipating stage of storms, a significant accumulation of space charge occurs within thunderclouds, leading to the thickening of the sub-cloud space charge layer. This stratified space charge layer has a significant influence on the discharge path [12,13]. Additionally, in this stage, the rate of lightning discharges is low [12]. Spider lightning discharges are occasionally observed in conjunction with positive CG lightning flashes [14]. In the study conducted near NASA Kennedy Space Center, Florida [15], extensive horizontal discharges were observed, removing the positive charge from a layer in close to the 0 ℃ isotherm. The study conducted in Orlando, Florida [10,11], reported that a significant number of horizontal discharges were visually observed near the base of the clouds, and these discharges facilitated the transfer of the positive charge from the cloud base to the ground. Furthermore, observations of spider lightning discharges have been documented both during [16] and towards the end of storms [17] in Florida. In the study in [16], for the horizontal discharge that was observed during a thunderstorm near Gaisenville, FL, the propagation speed ranged from 5.6 × 10³ m/s to 1.1 × 10⁴ m/s. The discharge occurred at a height of 4.5 km, where the temperature was near the freezing level. The study in [17] reported that the horizontal discharge propagation speed was 1–4 × 10⁴ m/s. According to the study in [8], the average propagation speed of the horizontal negative leader was approximately 2–4 × 10⁵ m/s. The studies in [12,18] have reported that the propagation speed of the negative leader was approximately 1 × 10⁵ m/s, while the speed of the positive leader ranged from 1.2 to 4.2 × 10⁴ m/s.
In this study, we examine the characteristics of spider lightning using video camera recordings of lightning discharges between July and November 2022, and by analyzing the lightning activity data reported by the NLDN and the GLM.
2. Materials and Methods
Observations were conducted in Bonita Springs in South Florida, from July to November 2022. Figure 1a displays a map of South Florida, indicating the location of Bonita Springs. Camera 1, Nikon D5300 HDSLR (Nikon, Lake Forest, IL, USA), operated at 50 frames per second and recorded images with a resolution of 1920 × 1080 pixels. This camera was positioned on the third floor of Station 1 (coordinates: 26.3° N, 81.8° W). Camera 2, an iPhone 13 ProMax camera (Apple, Naples, FL, USA), was utilized at Station 2 (coordinates: 26.4° N, 81.8° W). This camera operated at a rate of 24 to 240 frames per second with a resolution of 3840 × 2160 pixels. To correlate with the lightning location system data, each camera was equipped with GPS timestamping. Camera 1 and Camera 2 were not used simultaneously. Camera 1 was utilized for the observations on 13 July, 23 July, and 16 October, while Camera 2 was used for the observation on 16 September. Figure 1b illustrates the cameras’ locations on a map and their respective fields of view at each station. The red dots on the map represent the locations of the cameras, with numbers 1 and 2 indicating Camera 1 and Camera 2, respectively. The light blue triangles show the field of view of each camera. Figure 1c shows the view captured by Camera 1, as well as a photograph depicting the camera’s setting and the surrounding outside view.
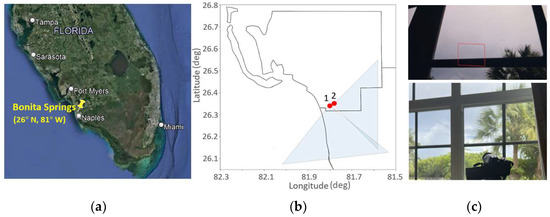
Figure 1.
(a) Location of Bonita Springs (26.3° N, 81.8° W) on a map of South Florida. (b) Locations of Camera 1 (26.3° N, 81.8° W) and Camera 2 (26.4° N, 81.8° W) and their fields of view. The red dots on the map represent the locations of the cameras, with numbers 1 and 2 indicating Camera 1 and Camera 2, respectively. The light blue triangles show the field of view of each camera. (c) View captured by Camera 1 (upper panel) and photograph depicting the camera’s setting and outside view (lower panel).
The lightning location system data used for comparison with video observations included the National Lightning Detection Network (NLDN), operated by Vaisala, and the Geostationary Lightning Mapper (GLM) in space, operated by the National Oceanic and Atmospheric Administration (NOAA). The NLDN is a ground-based lightning location system (LLS) and relies on radiofrequency (RF) instruments on the ground throughout the Continental United States to geolocate the large fluctuations in electromagnetic radiation emitted by lightning discharges and triangulate the event location and associated metadata [19]. The GLM is the first geostationary-orbiting satellite LLS and uses a near-infrared (near-IR) sensor to detect optic emissions of ICs, CGs, and CCs (cloud-to-cloud) [20]. The NLDN is capable of classifying lightning into CG flashes and IC flashes [21]. On the other hand, the GLM is able to observe around 70–90% of all lightning events but classifies all as flashes [21]. The NLDN data were used to examine the lightning location, count, peak current, flash classification (IC or CG), and polarity (positive or negative) for lightning flashes that occurred during the recording times. The GLM data were utilized to analyze and identify specific discharges captured in the recording times, to view the entire propagation path, and to view the total propagation distance. To compensate for the absence of millisecond-level timestamps in the video image, GLM data were utilized to gather supplementary information regarding the recorded time for each frame. By comparing the recorded time and position of a discharge in each frame with scatter plots of lightning locations reported by the GLM data, it is possible to estimate the millisecond-level time information and the location of the discharge propagation. However, depending solely on one LLS network results in even lower accuracy when attempting to locate the spider discharges within the large dataset. We found that using the NLDN and the GLM and cross-referencing these networks with the recorded times and locations of the visually observed spider discharges verified our results and these data selections. Many spider discharges also have associated CGs, and by additionally using the NLDN’s classification of IC versus CG, we can use this classification to verify the timing and location of the visually observed CGs. In such cases, the horizontal propagation path can be determined using the camera’s pixel size and focal length, allowing for the derivation of the propagation speed based on the duration and length of the horizontal discharge propagation path. These parameters serve to verify the classification of spider lightning. In our study, the main criteria for classifying flashes as “spider lightning” was to determine if the recorded discharge exhibited a horizontally propagating path below the cloud, typically lasting from tens to hundreds of milliseconds. We also considered the discharge’s leader’s behavior, with common exhibited behavior including branching or crawling along. The trajectory of the lightning locations based on the GLM enabled us to estimate the propagation distance and total duration of the spider lightning discharge, providing validation for the classification of spider lightning. By integrating the NLDN data, as mentioned earlier, a comprehensive analysis of the specific frame could be performed to verify the characteristics of spider lightning. We selected data of lightning flashes that occurred within the coordinates ranging from 25° N to 27° N and from 81° W to 82° W, which sufficiently covered the field of view captured by the cameras from the two stations.
3. Results
3.1. Events on 13 July 2022
On 13 July 2022, multiple lightning events were captured during the video recording, ranging from 21:10:00 UTC to 22:54:28 UTC, resulting in a total duration of 1 h 44 min 28 s. Within this time frame, a total of 20 individual spider discharges occurred within the camera’s field of view. Figure 2a illustrates the plotted lightning locations using the NLDN data, from 21:00:00 UTC to 23:00:00 UTC, covering the recording time, with a color scale indicating intensity, from red to violet, for the 15 min time window.
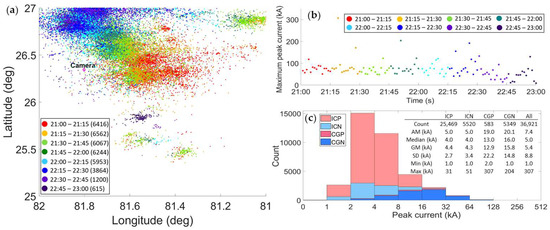
Figure 2.
(a) Lightning locations reported by the NLDN on 13 July 2022 from 21:00:00 UTC to 23:00:00 UTC, in a view of the coordinate of 25.2° N–27° N and 81° W–82° W, with a color scale from red to violet in the 15 min time window. The range in the box represents the time frame in hours and minutes (UTC), and the numbers in brackets indicate the flash counts that occurred within each time frame. (b) The maximum peak current per minute within the time interval. (c) Histogram of the peak current distribution of the flashes occurring during the time interval, color-coded by ICP, ICN, CGP, and CGN. The quantities presented are the flash count, arithmetic mean (AM), median, geometric mean (GM), standard deviation (SD), minimum (Min), and maximum (Max) peak current.
The numbers within brackets displayed at the bottom left of Figure 2a indicate the flash count occurring within each time window. During the time interval, there were a total of 103,575 flashes detected by the GLM, and 36,921 flashes detected by the NLDN. Out of the NLDN flashes, 25,469 were positive intracloud (ICP), 5520 were negative intracloud (ICN), 583 were positive cloud-to-ground (CGP), and 5349 were negative cloud-to-ground (CGN). Remarkably, a majority of ICPs were detected, and over time, the number of flashes during each time window decreased, with a northward shift in the locations of flashes. Figure 2b displays the maximum peak current per minute within the time interval. Figure 2c presents a histogram of the peak current distribution for the 31,908 flashes, color-coded by ICP, ICN, CGP, and CGN. The table in Figure 2c provides details including the count, arithmetic mean (AM), median, geometric mean (GM), standard deviation (SD), minimum (Min), and maximum (Max) peak current. The median peak current for all flashes was 5.0 kA, ranging from 1.0 kA to 307 kA. The medians for ICP and ICN were both 4.0 kA, while for CGP and CGN, they were 13 kA and 16 kA, respectively. The medians of CGP and CGN were three and four times higher than the medians of ICP and ICN, respectively. Comparatively, the maximum peak currents for ICP and ICN were 31 kA and 51 kA, respectively, while those for CGP and CGN were 307 kA and 204 kA, respectively. During the time frame, four spider discharges were captured within the field of view. Out of these four events, three were selected for analysis in the following section.
3.1.1. Event on 13 July 2022 at 22:15:56 UTC
The discharge occurred at 22:15:56 UTC, with a total duration of approximately 680 ms. Figure 3a displays selected frames capturing the observed discharge, and Figure 3b represents the lightning locations reported by the GLM from 22:15:56.25 UTC to 22:15:57.30 UTC. Both figures utilize a time color scale, ranging from red to violet for a 150 ms time window. This time interval covers the entire duration of the observed discharge displayed in Figure 3a and includes flashes that proceeded and followed the observed discharge. The right panel in Figure 3b represents a zoomed-in plot of the bottom left box illustrated in Figure 3b. From the initial luminosity, several branches propagated left, right, and upward, generating multiple sub-branches. These sub-branches exhibited varying intensities of luminosity during propagation until a certain time. During this interval and within the selected view shown in Figure 3b, the GLM reported a total of 286 flashes, and the NLDN reported 38 flashes. Among the flashes reported by the NLDN, 20 were identified as ICP, 11 ICN, 2 as CGP, and 4 as CGN. The maximum peak current recorded during this time interval was 35 kA. Based on the discharge’s image and the corresponding lightning locations reported by the GLM, it can be estimated that the discharge became visible at approximately 22:15:56.50 UTC. The entire duration of the discharge, 680 ms, aligns with the color scale representation ranging from yellow to violet in Figure 3b. Once the dot shown on the map passed to the region within the camera’s field of view in Figure 3b, the discharge was observed by the camera, as shown in Figure 3a. The dots ranging from light green to violet in Figure 3b represent the observed discharge. The trajectory of the dots, extending beyond the camera’s location, suggests the upward and rightward propagation of the discharge, as illustrated in the frame at 440 ms in Figure 3a. Interestingly, the trajectory of the red and yellow dots aligns with the river structure located below, and the dots shown in the left panel of Figure 3b display spiral structures that primarily propagate along the same trigonometric pattern. These spiral structures follow the path of the two river waterways located below, within the camera’s field of view, specifically towards the south. The right panel of Figure 3b provides a zoomed-in view of the bottom left box in Figure 3b. There was an event that exhibited a similar image to this discharge, which occurred at 22:19:47 UTC. The discharge’s image and lightning locations reported by the GLM are presented in Figure A1 in Appendix A. In the case of this discharge, no CG flashes were detected by the NLDN during the corresponding time interval of the discharge observation. In addition to the similarity of the image between the discharge at 22:19:47 UTC (Appendix A) and the one at 22:15:56 UTC (Section 3.1.1), the discharge followed a similar trajectory, which is displayed on the GLM map as depicted in Figure A1b and Figure 3b. As previously mentioned, the path extended beyond the camera’s location and displayed a trigonometric pattern after passing the camera’s location.
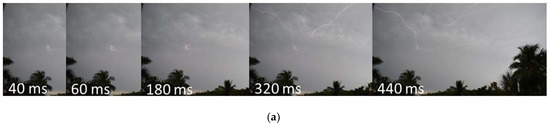
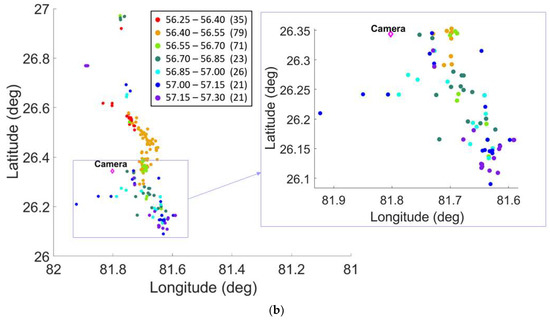
Figure 3.
(a) Discharge development recorded on 13 July 2022, at 22:15:56 UTC. Specific video frames are selected. The video recording has a frame rate of 50 frames per second, corresponding to approximately 20 ms per frame. Photo courtesy of G. Green. (b) Lightning locations reported by the GLM data on 13 July 2022, from 22:15:56.25 UTC to 22:15:57.30 UTC. The map displays a view of the coordinates of 26° N–27° N and 81° W–82° W, with a color scale ranging from red to violet in a 150 ms time window. The range in the box represents the time frame in seconds, and the numbers in brackets indicate the flash counts within each time frame. The right panel shows a zoomed-in view of the box displayed in the left panel.
3.1.2. Event on 13 July 2022 at 22:22:58 UTC
At 22:22:58 UTC, a discharge occurred with a total duration of 740 ms. The lower section of the main vertical leader extended downward and left, while another leader propagated upward, with a changing direction from the middle portion of the main leader at the beginning of the discharge, shown in frames from 20 ms to 60 ms in Figure 4a. At 100 ms, a strong luminous channel, corresponding to a CG flash, became visible. Simultaneously, the upper portion of the main channel (referred to as “w”) exhibited strong luminosity at 100 ms and 180 ms, as shown in Figure 4a. The time and location of this image matched the event recorded in the NLDN data. Specifically, it corresponded to a CGP flash, represented as a square dot in the pink box in the zoomed-in plot shown in Figure 4b. The CGP occurred at 22:22:58.65 UTC, with coordinates of 26.3° N and 81.8° W, approximately 5.0 km from Camera 1. The peak current of the CGP flash was +35 kA. The downward leader of the CGP exhibited variations in luminous intensity, lasting about 300 ms, during which a horizontal propagation extended to the right. Figure 4b illustrates lightning locations reported by the GLM on 13 July 2022, with a time frame ranging from 22:22:58.4 UTC to 22:22:59.8 UTC, covering the observation time of the discharge, as shown in Figure 4b. During this interval and within the selected view, the GLM reported a total of 511 flashes, while the NLDN reported 39 flashes. Among the flashes reported by the NLDN, 23 were ICP, 7 were ICN, 3 were CGP, and 6 were CGN. The maximum peak current recorded during this time interval was +74 kA. Based on the time and location of the CGP, the discharge became visible in the frame at approximately 22:22:58.55 UTC, and considering that the discharge duration was 740 ms, the time interval of the discharge corresponds to the lightning location presented by the color scale ranging from yellow to light blue in Figure 4b. The trajectory of the dots in Figure 4b shows a similarity to the spiral structure observed in the right panel of Figure 3b in Section 3.1.1, indicating a consistent propagating pattern along the trigonometric path. Additionally, the locations of trajectory shown in Figure 3b and Figure 4b are almost identical, covering the locations of the two river waterways.
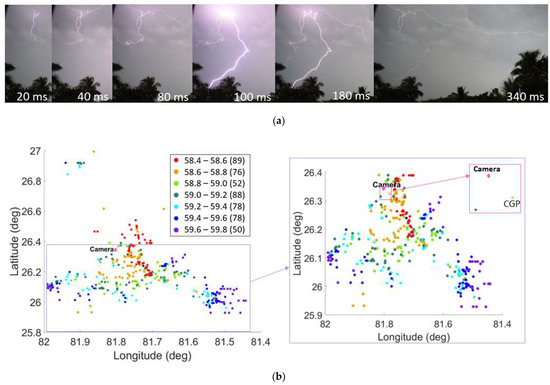
Figure 4.
(a) Discharge development recorded on 13 July 2022, at 22:22:58 UTC. Specific video frames are selected. The video recording has a frame rate of 50 frames per second, corresponding to approximately 20 ms per frame. Photo courtesy of G. Green. (b) Lightning locations reported by the GLM data on 13 July 2022, from 22:22:58.4 UTC to 22:22:59.8 UTC. The map displays a view of the coordinates of 25.8° N–27° N and 81.4° W–82° W, with a color scale ranging from red to violet in a 200 ms time window. The range in the box represents the time frame in seconds, and the numbers in brackets indicate the flash counts within each time frame. The right panel shows a zoomed-in view of the box displayed in the left panel.
3.1.3. Event on 13 July 2022 at 22:30:11 UTC
In the recorded frame, several branches appeared in the upper right corner, believed to be extensions of the branches propagating to the left. The total duration of the recorded discharge was 500 ms. The branches accelerated along their paths during the first 200 ms, and at 220 ms, the horizontal propagation path and two main branches became visible in the frame, as seen in the top frame of Figure 5a. At 360 ms, two branching points with multiple sub-branches were visible, preceding the right end of the horizontal discharge path. The horizontal path on the right side of the discharge and the branches on the left side extended to the left, with changes in brightness. At 460 ms, the two main branches with sub-branches extending to the left were visible in the frame. The horizontal path and extended branches exhibited varying luminosity until 500 ms. The position of the tip of the propagation path and its corresponding time based on the frame time are illustrated in Figure 5b. The illustration in the figure suggests that as the leader branches extended, the speed of the leader decreased. Scatter plots were created using the datasets reported by the GLM and the NLDN within the same interval, ranging from 22:30:10.00 UTC to 22:30:11.75 UTC, with a color scale in each 250 ms time window ranging from red to violet, as illustrated in Figure 5c. Just prior to the time of the observed discharge, a GCP flash was detected by the NLDN, at 22:30:10.91 UTC and positioned at coordinates 26.3° N and 81.9° W, approximately 6.81 km away from Camera 1, which was beyond the camera’s field of view. This location of the CGP is represented as a square dot in the pink box in Figure 5c. The peak current of this CGP flash was +27 kA. Based on the time and location of the CGP, the estimation indicates that the discharge became visible in the frame at approximately 22:30:11.00 UTC. Considering that the duration of the discharge was 500 ms, this time interval corresponds to the lightning location presented by the color scale ranging from light blue to violet in Figure 5c. The distribution of dots in Figure 5c is primarily horizontal, indicating the horizontal propagation of the discharge, and this pattern aligns with the discharge path captured within the frame, as shown in Figure 5a,b.
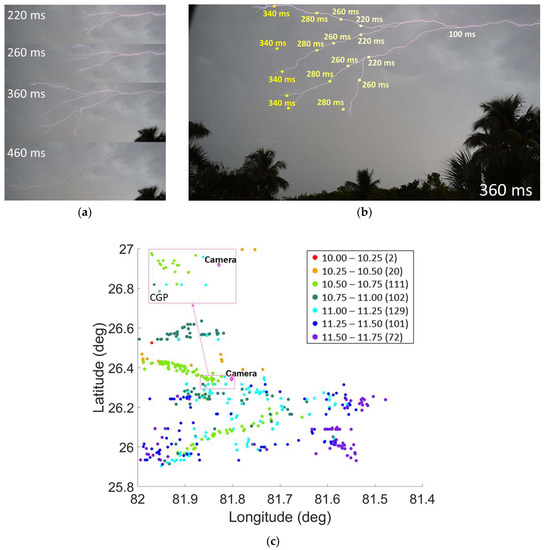
Figure 5.
(a) Discharge development recorded on 13 July 2022, at 22:25:11 UTC. Specific video frames are selected. The recording has a frame rate of 50 frames per second, corresponding to approximately 20 ms per frame. Photo courtesy of G. Green. (b) A zoomed-in frame of 360 ms of (a) and a position of each branch’s tip at different times (220 ms, 260, ms, 280 ms, and 340 ms) are displayed. (c) Lightning locations reported by the GLM data on 13 July, from 22:30:10.00 UTC to 22:30:11.75 UTC, in a view of the coordinates of 25.8° N–27° N and 81.4° W–82° W, with a color scale from red to violet in each 250 ms time window in the time interval. The range in the box represents the time frame in seconds, and the numbers in brackets indicate the flash counts within each time frame.
During the interval and within the selected view, as shown in Figure 5c, the GLM reported a total of 537 flashes, while the NLDN reported 33 flashes. Among the flashes reported by the NLDN, 17 were ICP, 9 were ICN, 2 were CGP, and 5 were CGN. The maximum peak current recorded during this time interval was +133 kA.
3.2. Event on 13 July 2022
This event, which included multiple discharges with strong luminosity, was recorded by Camera 1 at Station 1 on 23 July 2022, from approximately 00:50:00 UTC to 02:20:00 UTC. A total of seven individual spider discharges were observed within the camera’s field of view between 01:55:00 UTC and 02:10:00 UTC, which is the latter part of the recording time. The lightning location, reported by the NLDN data, and covering a time frame from 00:45:00 UTC to 02:30:00 UTC, is illustrated in Figure 6a. The total number of events during this time interval was 63,912 according to the GLM and 14,760 according to the NLDN. Out of the 14,760 flashes reported by the NLDN, 9832 were ICP, 2534 were ICN, 242 were cloud-to-ground positive (CGP), and 2152 were CGN. Notably, there was a high occurrence of ICPs, and the number of flashes per time window decreased throughout the entire time interval. Furthermore, the decrease in the maximum peak current per minute, as shown in Figure 6b, was significant. As can be seen in Figure 6c, the median peak current for all flashes was 5.0 kA, with a range from 1.0 kA to 254 kA. Specifically, the median peak currents were 5.0 kA for ICP, 4.0 kA for ICN, 25 kA for CGP, and 18 kA for CGN. The maximum peak currents for ICP and ICN were 32 kA and 38 kA, respectively, while those for CGP and CGN were 156 kA and 254 kA, respectively.
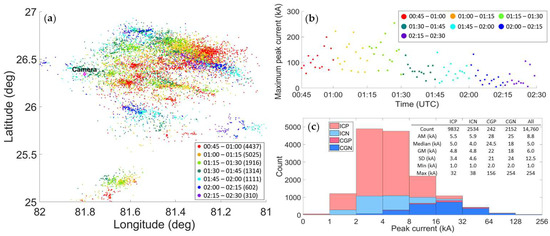
Figure 6.
(a) Lightning locations reported by the NLDN on 23 July 2022 from 00:45:00 UTC to 02:30:00 UTC, in a view of the coordinates of 25° N–27° N and 81° W–82° W, with a color scale from red to violet in each time window. The range in the box represents the time frame in hours and minutes (UTC), and the numbers in brackets indicate the flash counts that occurred within a 15 min time frame. (b) The maximum peak current per minute within the time interval. (c) Histogram of the peak current distribution of the flashes occurring during the time interval, color-coded by ICP, ICN, CGP, and CGN. The quantities presented are the flash count, arithmetic mean (AM), median, geometric mean (GM), standard deviation (SD), minimum (Min), and maximum (Max) peak current.
The propagation of the discharge was observed in the image at 02:08:57 UTC, with a total duration of the discharge path estimated to be around 1140 ms. Figure 7a illustrates samples of the images captured during the main discharge. Prior to the main event, other flashes were recorded on the left side of the field of view, and their locations are represented by the red and orange points on the map in Figure 7b. The main discharge shown in Figure 7a corresponds to the points with colors from ranging from yellow to violet in Figure 7b. Based on the correlation between the discharge’s image and the lightning locations, it can be estimated that the discharge became visible in the frame at approximately 02:08:57.56 UTC. At 20 ms, a brightness appeared on the right side of the field of view, and about 60 ms later, multiple branches became visible in the frame, continuing to propagate horizontally and upward, as seen at 200 ms. The branches continued to propagate and develop more branches, as observed in the frame at 440 ms. The right discharge path increased in brightness at 480 ms, and another discharge path adjacent to it increased in brightness at 500 ms. At 660 ms, the middle section of the path continued to propagate with high luminosity, with numerous tiny branches observed at the tips of the main branches that developed from the main discharge path. The main discharge continued to propagate, exhibiting developing branches on both the right and left sides. From 960 ms to 1100 ms, there was especially strong luminosity on the frame. After the wide upward path with branches appeared in the field of view at 1120 ms, it continued to exhibit changes in brightness for approximately 320 ms until it faded out. During the observed discharge period, a total of five flashes were detected by the NLDN. Among these, four flashes were identified as ICP, while one flash was classified as CGN. The CGN flash, displayed in the right panel of Figure 7b, occurred at 00:08:58.63 UTC, during the last 200 ms of the time interval of the discharge. The brightness observed in Figure 7a at 960 ms, 980 ms, and 1120 ms could correspond to the CGN flash. Following this brightness, the main channel and the branches sustained luminosity for several hundred milliseconds. Figure 7b shows the lightning count sample using the GLM data on 23 July 2022 from 22:08:57.2 UTC to 22:08:58.8 UTC, within the coordinates ranging from 25.9° N to 26.4° N and 81.6° W to 81.9° W. During this interval and within the selected view, the total flash count was 159 according to the GLM and 11 according to the NLDN. Among the flashes reported by the NLDN, 5 were ICP, 4 were ICN, and 2 were CGN. There was no CGP. The maximum peak current recorded among all the flashes was +6.0 kA.
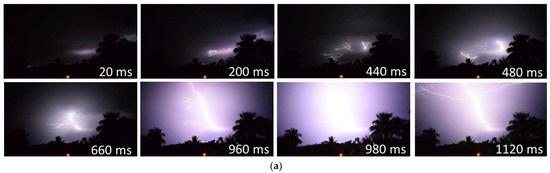
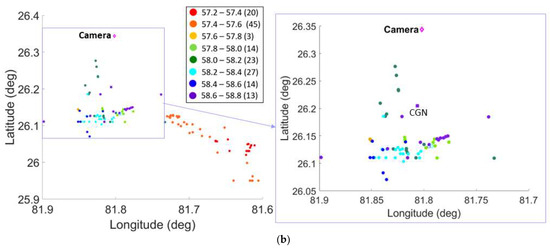
Figure 7.
(a) Discharge development recorded on 23 July 2022, at 02:08:57 UTC. Specific video frames are selected. The recording has a frame rate of 50 frames per second, corresponding to approximately 20 ms per frame. Photo courtesy of G. Green. (b) Lightning locations reported by the GLM data on 23 July 2022 from 22:08:57.2 UTC to 22:08:58.8 UTC. The map displays the coordinates of 25.9° N–26.4° N and 81.6° W–81.9° W, with a color scale ranging from red to violet in the 200 ms time window. The range in the box represents the time frame in seconds, and the numbers in brackets indicate the count of flashes within each time frame. The right panel shows a zoomed-in view of the box displayed in the left panel.
3.3. Event on September 8
On 8 September 2022, 20 days before Hurricane Ian, a series of spectacular discharges occurred, which were visually the most remarkable in the recorded video. Additionally, Hurricane Kay (Pacific, Category 2) and Hurricane Earl (Atlantic, Category 1) were both approaching the respective US Coastlines. A strong and prominent horizontal discharge propagated throughout the entire field of view and was captured in the frame from 00:31:06 UTC to 01:06:22 UTC, lasting approximately 40 min of the video recording. During the recording time, a total of 56 classifiable spider discharges were observed, along with numerous CGs and ICs. Figure 8a shows the lightning location plotted using the NLDN data from 00:30:00 UTC to 01:10:00 UTC, covering the entire recording time. The maximum peak current per minute, as shown in Figure 8b, exhibited an increase during the latter part of the time frame. Figure 8c represents a histogram of the peak current for all flashes occurring during the entire time frame. The median peak current for all flashes was 8.0 kA, ranging from 1.0 kA to 231 kA. The total number of events during this time interval was 34,669 according to the GLM and 3420 according to the NLDN. Out of the 3420 flashes reported by the NLDN, 1910 were ICP, 456 were ICN, 84 were CGP, and 970 were CGN. Most flashes were ICP, and the maximum peak current recorded among all the flashes was 231 kA. Additionally, the median peak currents for ICP and ICN were 6.0 kA and 5.0 kA, respectively, while those for CGP and CGN were 25 kA and 20 kA, respectively. Notably, the peak currents for CGP and CGN were approximately four times higher than those for ICP and ICN, respectively.
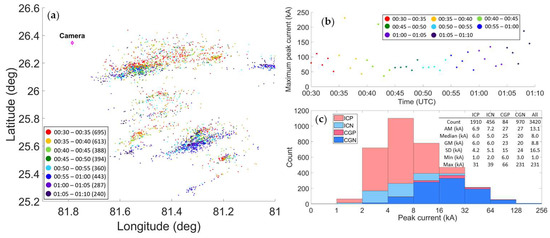
Figure 8.
(a) Lightning locations reported by the NLDN on 8 September 2022 from 00:30:00 UTC to 01:10:00 UTC, in a view of the coordinates of 25.2° N–26.6° N and 81.0° W–81.9° W, with a color scale from red to violet in the 5 min time window. The range in the box represents the time frame in hours and minutes (UTC), and the numbers in brackets indicate the flash counts that occurred within the 5 min time frame. (b) The maximum peak current per minute within the time interval. (c) Histogram of the peak current distribution of the flashes occurring during the time interval, color-coded by ICP, ICN, CGP, and CGN. The quantities presented are the flash count, arithmetic mean (AM), median, geometric mean (GM), standard deviation (SD), minimum (Min), and maximum (Max) peak current.
During the recording time, a long-lasting visible spider discharge was observed at 00:57:50 UTC. Figure 9a exhibits selected images of the specific observed discharge. The luminous discharge appeared at 17 ms, and three visible discharges spread to the left, right, and upward from that point, branching out and extending. This long-duration discharge can be classified into three stages based on the propagation features: (1) The upward branches mainly developed in an upward direction, as shown in the frames of 257 ms, 457 ms, and 657 ms in Figure 9a, and continued their propagation. Based on the image of the discharge path shown in Figure 9a and the corresponding dots on the map in Figure 9b, the duration of this stage was estimated to be from 00:57:50.60 UTC to 00:57:51.03 UTC. (2) At 557 ms, the horizontal propagation speed of the left discharge increased, and its path continued upward while extending horizontally. The duration of this stage was estimated to be from 00:57:51.05 UTC to 00:57:51.15 UTC. (3) At 697 ms, several upward branches disappeared, except for one, which appeared with a changing brightness at each frame until its disappearance. After 857 ms, the horizontal discharge continued to propagate until 1717 ms. The duration of this stage was estimated to be from 00:57:51.16 UTC to 00:57:51.99 UTC. Figure 9b shows the location of flashes occurring during the time of the discharge propagation, from 00:57:50.8 UTC to 00:57:52.2 UTC. Based on the estimated three stages’ actual times, the stages (1), (2), and (3) correspond to the yellow dots, the scattered light green dots in the bottom area, and the vertical distribution of light green and dark green dots, respectively, as shown in Figure 9b. Comparing the discharge’s image and LLS lightning locations, the discharge started approximately at 00:57:50.60 UTC. During this interval and within the selected view, the total flash count was 198 according to the GLM and 4 according to the NLDN. Among the flashes reported by the NLDN, two were ICP, and two were ICN. There were no CG flashes. The maximum peak current recorded among all the flashes was +19 kA. There were two discharges, occurring at 00:55:34 UTC and 01:01:29 UTC. The discharges’ images and lightning locations reported by the GLM are presented in Figure A2 and Figure A3 in Appendix A. For the discharge occurring at 00:55:34 UTC, no CG flashes were detected by the NLDN during the corresponding time interval of the discharge observation. For the discharge occurring at 01:01:29 UTC, a total of six CGs were detected by the NLDN during the time interval of the discharge observation. However, the locations of these CGs were outside the field of view of the camera, so the CGs’ locations are not illustrated in Figure A3b. These two discharges and the discharge occurring at 00:57:50 UTC have similarities in both the images and the trajectory of events displayed on the GLM map, as depicted in Figure A2b, Figure A3b and Figure 9b. The horizontal discharge observed from right to left in the image corresponds to the trajectory of the event locations, shifting approximately from the south to the north on the map for all three discharges. In addition to their common features, these three events also had the absence of CGs in the recorded images and on the map.
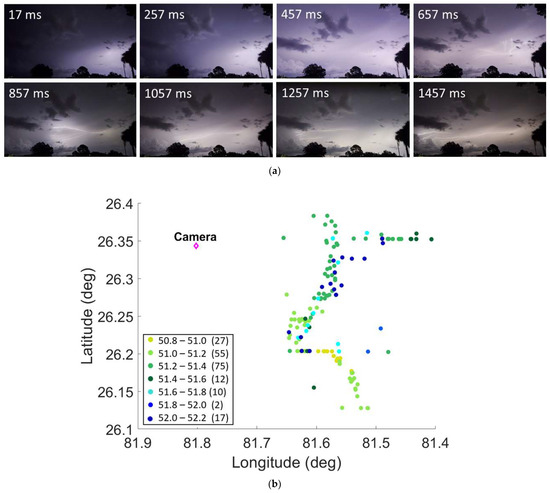
Figure 9.
(a) Discharge development recorded on 8 September 2022, at approximately 00:57:50.60 UTC. Specific video frames are selected. The recording has a frame rate of 60 frames per second, corresponding to approximately 17 ms per frame. Photo courtesy of G. Green. (b) Lightning locations reported by the GLM data on 8 September 2022 from 00:57:50.8 UTC to 00:57:52.2 UTC, in a view of the coordinates of 26.1° N–26.35° N and 81.4° W–81.9° W, with a color scale from red to violet in each 200 ms time window. The range in the box represents the time frame in seconds, and the numbers in brackets indicate the count of flashes within each time frame.
3.4. Event on 16 October 2022
A powerful and brilliant luminous discharge propagation occurred in a clear sky 17 days after Hurricane Ian. Two linear and parallel rain bands emerged over South Florida. The bands dissociated from a large atmospheric system that extended from the US–Canada border to Cuba. It is important to note that during the recording time, there was no storm or rain observed in the area (see Appendix B). The view was captured by Camera 1 at Station 1 on 16 October 2022, from 02:05:56 UTC to 02:55:31 UTC, with a recording duration of approximately 49 min and 35 s. It is noteworthy that no flashes were reported by either the GLM or the NLDN after 02:46:00 UTC. Consequently, the analysis of this event focused on the time interval from 02:00:00 UTC to 02:46:00 UTC, as exhibited in Figure 10a. Only one spider discharge was observed in the camera’s field of view during this time frame, specifically at 02:45:51 UTC, toward the end of the time period. During this time interval, there were a total of 5405 events reported by the GLM and 201 events reported by the NLDN. Among the 201 flashes reported by the NLDN, 27 were ICP, 19 were ICN, 1 was CGP, and 156 were CGN during the selected time interval. Most of the flashes were CGN during the entire time frame. The maximum peak current per minute for the time interval was below 70 kA, and the missing dots in Figure 10b indicate that no flashes were recorded during that time interval. Figure 10c displays a histogram of the peak currents of the flashes occurring during this time interval. The median peak current for all flashes was 15 kA, ranging from 6.0 kA to 68 kA. The median peak current for CGN flashes was 16 kA, which is approximately twice that of the 8.0 kA for ICP and 9.0 kA for ICN. The maximum peak current recorded for CGN flashes was 68 kA, which is approximately three times higher than that of the 24 kA for ICP and 22 kA for ICN.
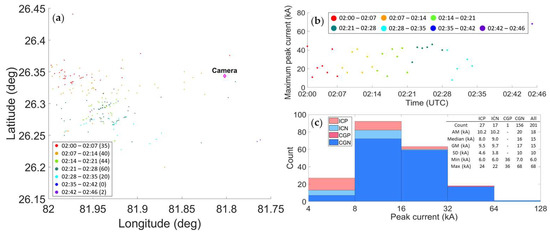
Figure 10.
(a) Lightning locations reported by the NLDN on 16 October 2022 from 02:00:00 UTC to 02:49:00 UTC, in a view of the coordinate boundaries of 26.2° N–26.5° N and 81.8° W–82.0° W, with a color scale from red to violet in the 7 min time window. The range in the box represents the time frame in hours and minutes (UTC), and the numbers in brackets indicate the count of flashes that occurred within the 7 min time frame. (b) The maximum peak current every minute within the time interval. (c) Histogram of the peak current distribution of the flashes occurring during the time interval, color-coded for ICP, ICN, CGP, and CGN. The quantities presented are the count, arithmetic mean (AM), median, geometric mean (GM), standard deviation (SD), minimum (Min), and maximum (Max) peak current.
During the recording time, two CGs with spider lightning were captured by the camera at approximately 02:45:51 UTC. The total event lasted approximately 600 ms. The leader’s propagation initiated in a westward and overhead direction, with the origin of propagation not being visible. It is most likely that the propagation originated to the north of the camera location. The leader entered the field of view at 20 ms in the first frame shown in Figure 11a, and propagated downward to the left, crossing roughly half of the right side of the frame. A lower leader path, as shown at 460 ms in Figure 11a, could be to extend from the upper leader after it entered and descended inside the cloud. The lower part of the leader visible beneath the cloud continued to propagate horizontally and extend upward to the left. The upper and lower parts of the leader were visible between 300 ms and 460 ms, with one visible while the other was barely visible. Assuming they were on the same discharge path, electric charges were expected to be transferred to the upper path when it was bright and to the lower extending path when it was bright. As illustrated in Figure 11a, at 460 ms, a downward discharge path appeared, and simultaneously, a lower leader path extending to the left with branching and the downward discharge path propagating from the right end of the lower leader were visible at 460 ms and 500 ms. Figure 11b illustrates the location of flashes that occurred during the time of the discharge propagation, from 02:45:50.0 UTC to 02:45:52.0 UTC. During this interval and within the selected view, the total number of flashes was 44 according to the GLM and 2 according to the NLDN. The two flashes reported by the NLDN were CGN, and the maximum peak current of the flashes was −68 kA.
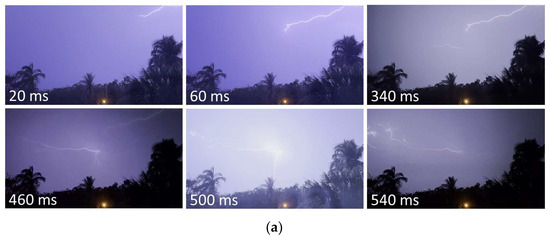
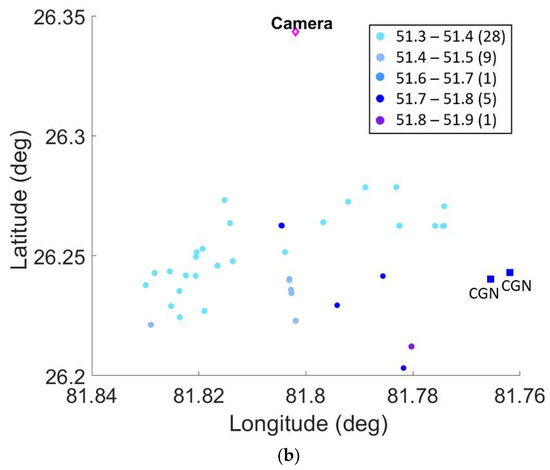
Figure 11.
(a) Discharge development recorded on 16 October 2022 at 02:45:51 UTC. Specific video frames are selected. The recording has a frame rate of 50 frames per second, corresponding to approximately 20 ms per frame. Photo courtesy of G. Green. (b) Lightning locations reported by the GLM data on 16 October 2022 from 02:45:50.0 UTC to 02:45:52.0 UTC, in a view of the coordinates of 26.20° N–26.35° N and 81.84° W–81.76° W, with a color scale from red to violet in each 100 ms time window. The range in the box represents the time frame in seconds, and the numbers in brackets indicate the count of flashes within each time frame.
4. Discussion
The lightning events on 13 July exhibited a decrease in the number of flashes over time. Furthermore, the location of flashes shifted northward during these events, indicating a change in the spatial distribution of the lightning activity. Additionally, the maximum peak current per minute exhibited a decreasing trend in the latter part of the time interval as the lightning events drifted away. The events on 23 July showed a similarity in the trend of both the number of flashes and the maximum peak current when compared to the events on 13 July. Especially, the maximum peak rapidly decreased during the latter part of the time interval. This rapid decrease can indicate that the intensity of the lightning strikes diminished more quickly during the later stage of the events on 23 July. In contrast, for the events on 8 September, the flash count decreased over time, while the maximum peak current increased in the later part of the interval. On the three days, the maximum peak current for many flashes was approximately 100 kA or higher, and the flash rate was higher during that time. Regarding the events on 16 October, they exhibited distinct characteristics compared to the previous three days. There were fewer flashes occurring in a smaller area within a shorter time period. Additionally, the maximum peak current per minute remained relatively constant, with peak currents of less than 70 kA throughout the entire time interval. This suggests that the lightning activity on 16 October was less frequent, more localized, and generally had a lower intensity compared to the previous three days.
The lightning events on 13 July, 23 July, and 8 September shared a common characteristic: most flashes were IC flashes, particularly ICPs. Specifically, the ICPs accounted for 68%, 67%, and 56% of the total flashes observed on 12 July, 23 July, and 8 September, respectively. In contrast, the event on 16 October exhibited a high rate of CGNs, which comprised 78% of the total count. One intriguing observation, according to the precipitation map corresponding to the observation time for the four days, as shown in Appendix B, was that the precipitation was absent at the selected coordinates during the recording time on 16 October, whereas precipitation was present during the first three days mentioned above. The occurrence of CGP flashes was notably low across the four days’ events, constituting only 1.6%, 1.6%, 2.5%, and 0.50% of the total count for the events on 13 July, 23 July, 8 September, and 16 October, respectively. The median and maximum peak currents for CGN flashes on the four days were higher compared to those for ICP, ICN, and CGP flashes. Spider discharges were observed during the latter part of the recording time for the four days of observation. Furthermore, the spider discharge on 16 October specifically occurred at the end of the recording time. It is notable that the spider discharges occurred during the later stages of the overall lightning activity when flashes were drifting away.
The height and temperature of the luminous point and horizontal propagation for the observed spider discharges were determined using a specific method. Appendix C provides an explanation of how the actual height and the temperature at that height are determined. In the case of the discharge on 13 July at 22:15:56 UTC, indicated in Section 3.1.1, the height of the luminous dot observed in the frame of 40 ms in Figure 3a was determined to be 3.99 km, with a corresponding temperature of 5.94 °C. As for the discharge that occurred on 13 July at 22:22:58 UTC in Section 3.1.2, it exhibited a CGP, as shown in the frames of 100 ms and 180 ms in Figure 4a. The height of the top of the vertical channel of the CGP was estimated to be 3.76 km, with a temperature of 7.59 °C at that height. However, the estimated location corresponding to the image of the discharge remains inadequate for obtaining a more precise determination of the leader speed for the two events. For the event on 13 July 2022 at 22:30:11 UTC in Section 3.1.3, assuming that the discharge path observed in the frame of Figure 5a,b propagated from the mentioned CGP flash, the actual vertical height of the path was determined to be 5.21 km above sea level, and the temperature at that height was estimated to be −3.11 °C. The speed of the horizontal propagation path of the spider discharge was calculated to be 2.38 × 10⁴ m/s. The total distance (in latitude/longitude) of the spider discharge and the duration of the discharge via the GLM was used to calculate these results. This speed is within the range of propagation speeds for a horizontal positive leader, which is between 1.2 and 4.2 × 10⁴ m/s, as reported in [12,18]. The similarity between the determined speed and the reported range suggests that the observed propagation path of the spider discharge is likely a positive leader. During the observation time of the three discharges, the height of 0 °C was determined to be 4.79 km, corresponding to a pressure range of 550–600 mb. The height of −10 °C was determined to be 6.42 km, corresponding to a pressure range of 450–500 mb, within a radius of approximately 10 km from Camera 1, covering the area where the flashes occurred within the field of view of the camera. Based on this estimated vertical height, the propagation speed of the horizontal discharge, and the 0 °C height, it can be hypothesized that the positive leader propagates through a negatively charged region within the cloud.
For the observed discharges on 23 July 2022 at 22:08:58 UTC and 8 September 2022 at 00:57:50 UTC, the wide range of determined locations corresponding to the images makes it insufficient to rely on the vertical height range for examining the leader speed. On 23 July 2022 at 22:08:58 UTC, the height of 0 °C was determined to be 4.67 km, accompanied by a pressure range of 550–660 mb. Similarly, the height of −10 °C was determined to be 6.31 km, with a corresponding pressure range of 450–500 mb, within the camera’s field of view. On 8 September 2022 at 00:57:50 UTC, the height of 0 °C was determined to be 4.75 km, within a pressure range of 550–600 mb. Furthermore, the height of −10 °C was determined to be 6.47 km, with a corresponding pressure range of 450–500 mb, also within the camera’s field of view.
For the discharge on 16 October 2022 at 02:45:51 UTC, two CGN flashes were detected by the NLDN. The first CGN occurred at 02:45:51.76 UTC, with coordinates of 26.2° N and 81.8° W, 12.0 km from Camera 1, with a peak current of −68 kA. The second CGN occurred at 25.5 ms at 02:45:51 822 UTC, with coordinates of 26.2° N and 81.8° W, 11.9 km from Camera 1, with a peak current of –32 kA. If the first CGN was assumed to correspond to the strong luminosity shown in the frame of 500 ms in Figure 11a, and considering that the upper and lower paths had the same distance from the camera as the CG, the estimated height of the left tip of the upper path in the frame of 60 ms in Figure 11a was 7.92 km above sea level, with a temperature of –28.3 °C. Similarly, the height of the lower path was determined to be 6.04 km above sea level, with a temperature of –13.5 °C. The height of 0 °C was determined to be 4.34 km, corresponding to a pressure of 600 mb, and the height of −10°C was determined to be 5.60 km, corresponding to a pressure range of 500–550 mb, within a radius covering the area where this discharge occurred within the field of view of the camera. Based on the estimation of the upper and lower discharge locations, the average propagation speed of the upper discharge path was determined to be approximately 1.73 × 10⁵ m/s, while the lower discharge path exhibited a speed of approximately 1.16 × 10⁴ m/s. As reported in [12,18], the propagation speed of the negative leader is approximately 1 × 10⁵ m/s, while the speed of positive leader ranges from 1.2 to 4.2 × 10⁴ m/s. Comparing the reported speeds with the determined speeds of the upper and lower leaders, it can be concluded that the upper propagation path corresponds to the negative leader, while the lower path corresponds to the positive leader. Based on the determined height of the upper leader and the lower leader, it can be hypothesized that the upper negative leader propagates through a positively charged layer, while the lower positive leader propagates through the upper region of a negatively charged layer. Considering the calculated heights, temperatures, and polarity of the charged layers, it is suggested that the region where the discharge propagated could involve a structure consisting of an upper main positive charge region and a lower main negative charge region within the cloud. The 0 °C height on October 16 was approximately 400 m lower than the heights observed on the other three days, and similarly, the −10 °C height was 800 m lower than the heights observed on the other three days. In addition, the vertical width of the layer between the 0 °C and −10 °C heights, which was 1.26 km, was 400 m shorter than that on October 16 compared to the other days. As mentioned in Section 3.4 and illustrated in Figure A4d in Appendix B, there was no precipitation in the camera’s field of view during the recording time. According to this condition, less updraft may create a thinner cloud layer located at a lower height.
The horizontal discharges on 13 July at 22:22:58 UTC and at 22:30:11 UTC had CGP during the duration of the discharge. For the 8 September horizontal discharge, there were no CG flashes during the time interval. The horizontal discharge on 16 October had two CGNs during the discharge. Based on the observations, it can be concluded that spider lightning discharges are capable of producing CG flashes, which can be either positive or negative.
As mentioned in Section 3.1.1 and Section 3.1.2, there was a similarity in the trajectory of the discharge paths, which followed a spiral structure along the river waterways. Appendix D provides additional information on the observation area, highlighting the presence of multiple rivers and canals and scatter plots of lightning flashes occurring at 22:22:58 UTC on 13 July (Figure A6a,b). The proximity of these water features can influence the path and behavior of lightning discharges, and the observed spiral structure in the flash locations aligned with the layout of the rivers in the area, suggesting a correlation between the propagation path of the spider lightning and features of the landscape. The hypothesis regarding the features observed in multiple spider discharges and the interesting characteristics of lightning flashes in Bonita Springs, South Florida, is related to the specific meteorological and atmospheric conditions influenced by the area’s geographical features. The presence of multiple rivers and canals, along with its location near the Gulf Coast and the ocean, may create unique meteorological patterns and atmospheric conditions that contribute to the occurrence of spider discharges and the distinct behavior of lightning flashes in the region. Detailed meteorological analysis and additional information about the local conditions would be necessary to provide a more comprehensive understanding of the observed spider discharge and the overall lightning activity.
5. Conclusions
We observed spectacular spider lightning in South Florida during the summer season, as well as before and after Hurricane Ian occurring in the fall. The utilization of video images, NLDN, and GLM data in this study provided valuable insights into the correlations between the visual aspects of lightning and the detected lightning locations. Furthermore, these combined datasets facilitated the characterization of the observed spider lightning discharges. By analyzing the recorded images from the events that occurred on 13 July, 23 July, 8 September, and 16 October, we examined the characteristics of lightning flashes and unique aspects of the spider lightning. Throughout the entire video-recording period, a high rate of ICP flashes, ranging from 56% to 68%, was observed on 13 July, 23 July, and 8 September. On the other hand, during the event on 16 October, there was a high occurrence of CGN flashes, accounting for 77% of the total number of flashes.
The observed spider lightning discharges exhibited a horizontal propagation path and had a long duration, ranging from 300 ms to 1720 ms, with the entire discharge path along the cloud base showing sustained luminosity over the full duration. The recorded images of spider lightning displayed branching or a combination of branching and crawling behavior along the discharge path. The trajectory of lightning locations reported by the GLM consistently aligned with the visually observed propagation path of the spider lightning, providing confirmation for the classification of these flashes as spider lightning. The analysis of the NLDN data indicated that spider lightning discharges typically occurred during the later stages of overall lightning activity, when the flash count decreased, and the flash sites were drifting away. Based on our observation and analysis, it can be said that spider discharges tend to occur in conjunction with CGP, CGN, or in cases where no CG flash is present.
To gain a more comprehensive understanding of the observed spider discharge and the overall lightning activity, conducting a detailed meteorological analysis and gathering additional information about the local conditions, including factors such as precipitation, temperature, and cloud location, are necessary and valuable.
Supplementary Materials
The following supporting information can be downloaded at: https://www.mdpi.com/article/10.3390/atmos14071191/s1, Video S1: Geostationary Lightning Mapper (GLM) National Lightning Detection Network (NLDN), and Optical Recording Video Comparisons.
Author Contributions
Data collection, G.G.; conceptualization, N.W.; methodology, G.G.; software, G.G.; formal analysis, G.G. and N.W.; funding acquisition, N.W.; writing—original draft, G.G. and N.W.; investigation, G.G. and N.W.; writing—review and editing, N.W. All authors have read and agreed to the published version of the manuscript.
Funding
This research was in part supported by FGCU.
Institutional Review Board Statement
Not applicable.
Informed Consent Statement
Not applicable.
Data Availability Statement
The data are contained within the article.
Acknowledgments
All authors thank Florida Gulf Coast University (USA) and the PDF grant for covering the publication cost. All authors thank Vaisala for providing excellent NLDN datasets. All authors thank NOAA for providing excellent GLM dataset.
Conflicts of Interest
The authors declare no conflict of interest.
Appendix A
Figure A1a, Figure A2a and Figure A3a exhibit selected images of a specific observed spider discharge, and Figure A1b, Figure A2b and Figure A3b illustrate lightning locations reported by the GLM data, covering the time interval of the discharges.

Figure A1.
(a) Discharge development recorded on 13 July 2022 at approximately 22:19:47 UTC. Specific video frames are selected. The recording has a frame rate of 50 frames per second, corresponding to approximately 20 ms per frame. Photo courtesy of G. Green. (b) Lightning locations reported by the GLM data on 13 July 2022, from 22:19:47.00 UTC to 22:19:49.00 UTC. The map displays a view of the coordinates of 26° N–27° N and 81° W–82° W, with a color scale ranging from red to violet in the 250 ms time window. The range in the box represents the time frame in seconds, and the numbers in brackets indicate the flash counts within each time frame. The right panel shows a zoomed-in view of the box displayed in the left panel.


Figure A2.
(a) Discharge development recorded on 8 September 2022, at 00:55:34 UTC. Specific video frames are selected. The recording has a frame rate of 60 frames per second, corresponding to approximately 17 ms per frame. Photo courtesy of G. Green. (b) Lightning locations reported by the GLM data on 8 September 2022, from 00:55:34.40 UTC to 00:55:35.10 UTC, in a view of the coordinates of 26.10° N–26.45° N and 81.4° W–81.8° W, with a color scale from red to violet in the 100 ms time window. The range in the box represents the time frame in seconds, and the numbers in brackets indicate the count of flashes within each time frame.


Figure A3.
(a) Discharge development recorded on 8 September 2022, at 01:01:29 UTC. Specific video frames are selected. The recording has a frame rate of 60 frames per second, corresponding to approximately 20 ms per frame. Photo courtesy of G. Green. (b) Lightning locations reported by the GLM data on 8 September 2022, from 01:01:29.00 UTC to 01:01:29.84 UTC, in a view of the coordinates of 26.10° N–26.35° N and 81.2° W–81.8° W, with a color scale from red to violet in the 120 ms time window. The range in the box represents the time frame in seconds, and the numbers in brackets indicate the count of flashes within each time frame.


Appendix B
The snapshots of the precipitation rate in the specific time frame on 13 July, 23 July, 8 September, and 16 October are illustrated in Figure A4a–d, respectively.

Figure A4.
Snapshots of the NCEP North American Regional Reanalysis Precipitation Composition (kg/m2/s) mean, from the NOAA Physical Science Laboratory, on (a) 13 July 2022, (b) 23 July 2022, (c) 8 September 2022, and (d) 16 October 2022.
Figure A4.
Snapshots of the NCEP North American Regional Reanalysis Precipitation Composition (kg/m2/s) mean, from the NOAA Physical Science Laboratory, on (a) 13 July 2022, (b) 23 July 2022, (c) 8 September 2022, and (d) 16 October 2022.

Appendix C
The real vertical height, denoted as h1, corresponding to the location of the discharge on the image, can be determined using Equation (A1):
where h represents the distance between the camera and the lightning location, along the ground, y represents the pixel size of the camera, f represents the focal length of the camera, and n represents the number of pixels of the vertical height on the image.
h1 = (dy/f) n
The temperature at the event location was found by using the NCEP North American Regional Reanalysis Air Temperature Composition mean data provided by the NOAA Physical Science Laboratory. Figure A5b presents snapshots of the air temperature for 23 July 2022, with a two-hour time span starting from 02:00 UTC. To find the temperature range at the flash location, the map was examined at various pressure levels, such as 450 mb, 500 mb, 550 mb, and 600 mb (Figure A5a–e). The temperature range at each of these pressure levels was averaged, and using the average temperature at each pressure level, the height, h2, at that temperature was calculated using the Hypsometric formula, shown in Equation (A2):
where P0 represents the sea level pressure, P represents the pressure at the specific level, and T represents the corresponding temperature.
h2 = [(P0/P)1/5.257 − 1] (T + 273.15)/0.0065
The determined heights, h2, at each pressure level’s temperature were plotted, and a linear fit line was generated to find the relationship between height and temperature (Figure A5f). The equation describing this relationship was determined based on the linear fit line. Using this equation, the temperature at the vertical height, h1, corresponding to the discharge’s location, was calculated. This method was applied to find the vertical height at other specific discharges that occurred on 13 July, 8 September, and 16 October. By applying the temperature–height relationship obtained from the linear fit line, the temperature at the desired vertical height, h1, for each of these events was estimated.

Figure A5.
Snapshots of the NCEP North American Regional Reanalysis Air Temperature (°C) Composition mean, from the NOAA Physical Science Laboratory, at the pressure levels: (a) 450 mb, (b) 500 mb, (c) 550 mb, and (d) 600 mb. (e) A zoomed-in view of the yellow box shown in the panel (a). (f) The plot of the relationship between height and temperature, which was used to estimate the temperature at specific vertical heights.

Appendix D

Figure A6.
(a) Locations of canals and rivers in Southwest Florida from the canal network of South Florida. Adapted from sfwnd.gov, reported on June 2020. (b) Scatter plot of the locations of flashes occurring on 13 July at 22:22:58 UTC.
Figure A6.
(a) Locations of canals and rivers in Southwest Florida from the canal network of South Florida. Adapted from sfwnd.gov, reported on June 2020. (b) Scatter plot of the locations of flashes occurring on 13 July at 22:22:58 UTC.

References
- Rakov, V.A.; Uman, M.A. Lightning: Physics and Effects; Cambridge University Press: Cambridge, UK, 2003. [Google Scholar]
- Williams, E.R. The tripole structure of thunderstorms. J. Geophys. Res. Atmos. 1989, 30, 13151–13167. [Google Scholar] [CrossRef]
- MacGorman, D.R.; Burgess, D.W.; Mazur, V.; Rust, W.D.; Taylor, W.L.; Johnson, B.C. Lightning rates relative to tornadic storm evolution on 22 May 1981. J. Atmos. Sci. 1989, 46, 221–251. [Google Scholar] [CrossRef]
- Krehbiel, P.R. The Electrical Structure of Thunderstorms, in the Earth’s Electrical Environment; National Academy Press: Washington, DC, USA, 1986; pp. 90–113. [Google Scholar]
- Shao, X.M.; Krehbiel, P.R. The spatial and temporal development of intracloud lightning. J. Geophys. Res. Atmos. 1986, 101, 26641–26668. [Google Scholar] [CrossRef]
- Krehbiel, P.R.; Brook, M.; McCrory, R.A. An analysis of the charge structure of lightning discharges to ground. J. Geophys. Res. Oceans 1979, 84, 2432–2456. [Google Scholar] [CrossRef]
- Williams, E.; Mkrtchyan, H.; Mailyan, B.; Karapetyan, G.; Hovakimyan, S. Radar diagnosis of the thundercloud electron accelerator. J. Geophys. Res. Atmos. 2002, 127, e2021JD035957. [Google Scholar] [CrossRef]
- Mazur, V.; Shao, X.M.; Krehbiel, P.R. “Spider” lightning in intracloud and positive cloud-to-ground flashes. J. Geophys. Res. Atmos. 1998, 103, 19811–19822. [Google Scholar] [CrossRef]
- Williams, E.R. Problems in lightning physics—The role of polarity asymmetry. Plasma Sources Sci. Technol. 2006, 15, S91. [Google Scholar] [CrossRef]
- Williams, E.; Zhang, R.; Boccippio, D. Microphysical growth state of ice particles and large-scale electrical structure of clouds. J. Geophys. Res. Atmos. 1994, 99, 10787–10792. [Google Scholar] [CrossRef]
- Boccippio, D.J. The Electrification of Stratiform Anvils. Doctoral Dissertation, Massachusetts Institute of Technology, Cambridge, MA, USA, 1996. [Google Scholar]
- Williams, E.R.; Cooke, C.M.; Wright, K.A. Electrical discharge propagation in and around space charge clouds. J. Geophys. Res. Atmos. 1985, 90, 6059–6070. [Google Scholar] [CrossRef]
- Mazur, V. Physical processes during development of lightning flashes. C. R. Phys. 2002, 3, 1393–1409. [Google Scholar] [CrossRef]
- Moore, C.B.; Vonnegut, B. The Thundercloud. In Lightning, Physics of Lightning; Golde, R.H., Ed.; Academic Press: New York, NY, USA, 1997; Volume 1, pp. 51–98. [Google Scholar]
- Krehbiel, P.R. An Analysis of the Electric Field Change Produced by Lightning. Doctoral Dissertation, The University of Manchester, Manchester, UK, 1981. [Google Scholar]
- Brantley, R.D.; Tiller, J.A.; Uman, M.A. Lightning properties in Florida thunderstorms from video tape records. J. Geophys. Res. Atmos. 1975, 80, 3402–3406. [Google Scholar] [CrossRef]
- Krider, E.P.; Orville, R.; Noggle, R.; Uman, M. Lightning and the Apollo 17/Saturn V exhaust plume. J. Spacecr. Rocket. 1974, 11, 72–75. [Google Scholar] [CrossRef]
- Lalande, P.; Bondiou-Clergerie, A.; Bacchiega, G.; Gallimberti, I. Observations and modeling of lightning leaders. C. R. Phys. 2002, 3, 1375–1392. [Google Scholar] [CrossRef]
- Cummins, K.L.; Murphy, M.J. An overview of lightning locating systems: History, techniques, and data uses, with an in-depth look at the US NLDN. IEEE Trans. Electromagn. Compat. 2009, 51, 499–518. [Google Scholar] [CrossRef]
- Goodman, S.J.; Blakeslee, R.J.; Koshak, W.J.; Mach, D.; Bailey, J.; Buechler, D.; Carey, L.; Schultz, C.; Bateman, M.; McCaul, E., Jr.; et al. The GOES-R geostationary lightning mapper (GLM). Atmos. Res. 2013, 125–126, 34–49. [Google Scholar] [CrossRef]
- Nag, A.; Murphy, M.J.; Schulz, W.; Cummins, K.L. Lightning locating systems: Insights on characteristics and validation techniques. Earth Space Sci. 2015, 4, 65–93. [Google Scholar] [CrossRef]


Disclaimer/Publisher’s Note: The statements, opinions and data contained in all publications are solely those of the individual author(s) and contributor(s) and not of MDPI and/or the editor(s). MDPI and/or the editor(s) disclaim responsibility for any injury to people or property resulting from any ideas, methods, instructions or products referred to in the content. |
© 2023 by the authors. Licensee MDPI, Basel, Switzerland. This article is an open access article distributed under the terms and conditions of the Creative Commons Attribution (CC BY) license (https://creativecommons.org/licenses/by/4.0/).