Abstract
Germany’s increasing temperatures and droughts are significantly impacting the hydrological realm. This study examines the implications of climate change on future droughts in a representative catchment within Germany’s low mountain range. Findings of this research shed light on potential impacts on future seasonal water availability, aiding decision makers and stakeholders in managing regional climate change risks. Climate and drought indices, as well as the climatic water balance, are computed and analyzed until 2100, relative to a reference period. A high emission scenario (RCP8.5) and a climate protection scenario (RCP2.6) are considered to address uncertainties. Results reveal above-average warming in the study area compared to the national average. Under the RCP8.5 scenario, the far future exhibits an average of 44 annual heat days. Despite wetter winters, extended droughts persist. Water stress intensifies in summer and autumn, with a projected 68% increase in dry period duration. The findings emphasize the necessity of adaptation strategies, as even ambitious global warming mitigation efforts require regional adaptation. The study represents the first application of a Germany-wide, bias-adjusted, and regionalized dataset at catchment level. It contributes novel insights for regional water resources management and advances understanding of climate change impacts in German low mountain range regions.
1. Introduction
In recent decades, anthropogenic activities have led to increasing concentrations of greenhouse gases in the atmosphere, resulting in a warming of the global average temperature and changes in meteorological variables [1]. These climate alterations have given rise to hydroclimatic extremes, including droughts, which have significant implications for water scarcity and dry conditions [2]. Understanding the regional manifestations of climate change is crucial for effective adaptation and mitigation strategies at the local level [3]. While climate change impacts vary regionally, countries such as Germany, located in central and northern Europe with moderate climatic conditions, have not traditionally been the focus of attention when it comes to drought research [4]. However, based on the Global Climate Risk Index, Germany was ranked as the third most impacted country worldwide in 2018, primarily due to the effects of heat waves and droughts [5].
Numerous studies investigate the increasing trends in drought frequency and magnitude in Germany, primarily based on historical data at the federal state level [6,7]. Advancements in global and regional climate models now offer opportunities to anticipate future meteorological developments. These models have been used to project climate change at national levels or in large river basins [8,9]. Despite these advancements, limited attention has been given to studying the projected developments of drought at smaller scales within the country, particularly at the catchment level. This emphasizes the need to investigate drought evolution and the effects of climate change in small to medium-sized watersheds, taking into account the varying climate change sensitivity and manifestations, as tailored adaptation strategies are necessary to address the specific challenges posed by climate change at local scales [10,11]. The research conducted in the Gersprenz River catchment in central Germany demonstrates a significant contribution in the field. Since its establishment as a research basin by the Chair of Engineering Hydrology and Water Management at the Technical University of Darmstadt in 2016, the Gersprenz catchment has been the location for numerous scientific studies [10,12,13,14,15,16].
This current study builds upon the existing research in the Gersprenz catchment and aims to investigate the future development of drought events, climate extremes, and the resulting implications for seasonal water availability. To this end, projected temperature and precipitation time series as well as climate and drought indices, were analyzed for trends and corresponding extreme values. The impact of the meteorological development on the climatic water balance was observed. In order to address climate variability and prevent over-interpretation of decadal climate fluctuations, results were considered for the present and near future (2011–2040), intermediate future (2041–2070), and far future (2071–2100), relative to a reference period (1971–2000). The uncertainties of the future development are accounted for by a core ensemble provided by the German Weather Service [17]. The climate projection data was recently regionalized and bias-adjusted from a 12.5 km resolution to a 5 km resolution by the German Federal Ministry of Transport and Digital Infrastructure in collaboration with the German Weather Service [18]. This study is the first to use this dataset in the context of hydroclimatological investigations at the catchment level, offering novel insights for regional water resources management in the German low mountain ranges. By investigating two representative concentration pathways (RCPs), including a high emission scenario (RCP 8.5) and a climate protection scenario (2.6), this study examines the regional effects of global efforts to reduce greenhouse gas emissions on drought and water availability at the catchment level.
Overall, this research addresses the limited attention given to projected developments of drought at smaller scales within Germany. By focusing on a representative catchment within Germany’s low mountain range, it provides valuable insights into the specific impacts of climate change at the regional level, thereby making a significant contribution to regional impact studies. The findings enhance our understanding of how global climate change manifests in the low mountain range and its impacts on the hydrological realm, providing valuable insights for developing targeted adaptation strategies to reduce climate-related risks and mitigate the impacts of hydroclimatic extremes [19].
Moreover, the findings offer practical guidance to decision-makers and stakeholders in addressing climate change challenges and reducing water stress, not only in the German low mountain range but also in similar regions. This research highlights the importance of studying localized effects of climate change and provides essential knowledge for formulating effective strategies to cope with climate-related challenges in these areas.
2. Research in the Gersprenz Catchment and Its Contextualization
The Gersprenz river catchment measures 500 km2 and is located in southern Germany, specifically in the federal state of Hesse. It extends from the crystalline Odenwald to the lower Main River plain, with a length of 62 km and elevations ranging from 600 masl to 100 masl (Figure 1). The land-use composition of the Gersprenz catchment is approximately 48% agricultural land, 36% forests, and 13% settlements. The basin exhibits typical characteristics of a German low mountain range catchment, with a mix of crystalline basement and tertiary deposits. The mean temperature in the basin is 10.2 °C, with a mean annual precipitation of 641.7 mm [15]. The catchment area, which is part of the Rhine River basin district, is recognized as a region particularly vulnerable to drought [8,10,20,21,22], making it a valuable area for studying the regional impacts of climate change. Through the comprehensive analysis of climate and drought indices, as well as the water balance, this research can provide insights into how climate change affects hydrometeorological processes and water availability dynamics in the catchment in the long term and on a seasonal scale. These insights directly support local water management and adaptation strategies. The findings of this study have broader applicability, offering transferable knowledge to other low mountain range catchments with similar characteristics. By providing valuable data, it enhances our understanding of climate change effects in Hesse, supporting water management, planning, and policy development initiatives specific to the region.
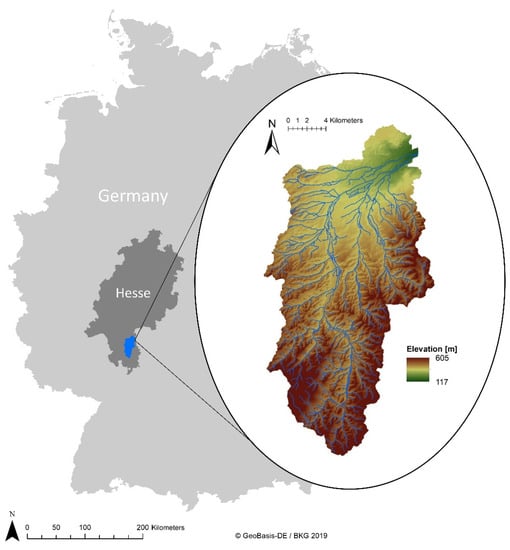
Figure 1.
The location of the Gersprenz research catchment in Germany.
This study utilizes bias-adapted, regionalized climate change projection data from the German Weather Service. It is this first application of this national dataset at the catchment scale. Additionally, the results allow for the contextualization of regional results within the national context, aiding informed decision-making processes. In general, the research contributes to understanding climate change impacts on water resources and ecosystems. It informs policymakers and stakeholders through regional scale studies, aligning with the objectives of the EU Water Framework Directive. The research supports integrated river basin management and sustainable water resource planning across Europe. In summary, research in the Gersprenz catchment yields crucial insights into climate change impacts at the river basin level, benefiting local water management and adaptation strategies. The transferability of knowledge, implications at the state, national, and European levels, and alignment with relevant policies justify the significance of this study.
3. Methods
3.1. Climate Change Projections and Analyses
Climate projections can help us gain an understanding of how the climate will develop in the future. As future climate is subject to great uncertainty, scenarios to approximate possible future pathways exist. The RCPs estimate the increase in radiative forcing until the year 2100, compared to a pre-industrial baseline, resulting from certain greenhouse gas concentrations [23]. In this study, a high emission scenario (RCP8.5) and a climate protection scenario (RCP2.6) were used to anticipate the future climatic development. This approach leads to a display of an upper bound and a lower bound while assessing the regional impacts of global mitigation measures. Using the RCPs as drivers, global climate projections have been produced as part of the World Climate Research Program (WCRP) coupled model intercomparison project 5 (CMIP5) [24]. The global CMIP5 climate projections were downscaled as part of the WCRP’s coordinated regional climate downscaling experiment (CORDEX) initiative to allow for higher spatial resolutions for regional observations. Regional climate projections related to Europe are coordinated by EURO-CORDEX. They are available in two spatial resolutions (50 km and 12.5 km) [25]. In addition, the number of available regional climate projections at a spatial resolution of 12.5 km was increased for Germany for the RCP2.6 and RCP8.5 scenarios as part of the ReKliEs-De project [26]. The available 12.5 km climate projections for Germany were further regionalized to a 5 km resolution and bias-adjusted in a research project promoted by the German Federal Ministry of Transport and Digital Infrastructure to increase the accuracy of the projections and to minimize systematic errors [18,27,28]. To create a core ensemble, the German Weather Service excluded very similar projections to reduce the redundancy of a reference ensemble [29]. To enable comparability and classifiability with similar studies, this study uses the mentioned core ensemble [17]. Table 1 lists the ensemble members of the core ensemble for each emission scenario. The given abbreviations are used hereafter.

Table 1.
Core ensemble adapted from the German Weather Service [17,29].
The projected data were provided in network common data format (NetCDF). Simulated historic data were provided for the time period 1971 to 2000 in daily intervals for Germany. The projected data were also provided in daily intervals for the time period 2006 to 2100 for Germany. The meteorological variables used in this study include air temperature (TAS) at 2 m altitude, minimum temperature (TASmin), and maximum temperature (TASmax) in °C, as well as precipitation (PR) in mm/d. Data processing and analysis was performed using climate data operators (CDO) [30]. As climate variability is a major source of uncertainty in monitoring climate change impacts, projected data were analyzed not only as annual time series, but also in time slices of 30 years. This is in accordance with Kreienkamp et al. (2012) and the World Meteorological Organization (WMO), who suggest that over-interpretation of decadal climate variability can be avoided by using 30-year analysis periods [31,32]. The reference period (1971 to 2000) was adopted as recommended by the WMO [32]. The examined time period was divided into present and near future (2011–2040), intermediate future (2041–2070), and far future (2071–2100). Based on these periods, TAS averages and means of annual PR were determined for the Gersprenz catchment as absolute values as well as anomalies. With a size of about 500 km2, the catchment is covered by about 20 pixels in the climate change projection data, which form the basis for spatial averages. To complement the assessment of the climate projections, climate change signals were computed to assess the maximum changes in climate variables for both emission scenarios. The change signals of TAS and PR were plotted as thermopluviograms. To process annual means for a time series trend analysis, annual averages were calculated for TAS and annual sums were calculated for PR for the period 2011 to 2100. Hot and dry days were determined to estimate future water availability and the development of water scarcity in the Gersprenz catchment in the coming decades. A hot day is defined as a day during which TASmax ≥ 30 °C [33]. A dry day is a day on which the total PR < 1 mm/d. The threshold of 1 mm/d is set to avoid the light rain (“drizzle”) produced by some climate models [34]. Further, maximum periods of consecutive hot and dry days were determined to observe the evolution of the extent of dry and hot periods. The evolvement of these variables over time was assessed by means of a trend analysis. To depict the seasonal development of hot and dry periods trend analyses were performed for winter (December–January–February), spring (March–April–May), summer (June–July–August), and autumn (September–October–November). All trends were investigated using a simple linear regression analysis. The significance of the observed trends was evaluated using Student’s t-test with a significance level of 5% (α = 0.05) after conducting the Kolmogorov–Smirnov Test to confirm a normal distribution of the dataset [35]. Furthermore, the study examined the changes in the total number of hot and dry days, as well as the duration of heat and dry periods, compared to the reference period. These analyses were conducted for each of the three investigation periods. To quantify these changes, the average annual and seasonal values of the total number of hot and dry days, as well as the length of consecutive hot or dry days, were calculated. The resulting values were then used to determine the change factor, representing the relative change in these variables between the reference period and the respective investigation periods.
3.2. Drought Indices
Drought indices help to identify and classify droughts. With the aim of diagnosing the future development of drought events in the Gersprenz catchment, the standardized precipitation evaporation index (SPEI) was computed for the period 2011–2100. Although the standardized precipitation index (SPI) is more widely used according to the German Weather Service [36], a conscious decision was made to use the SPEI instead, as the SPI does not account for evapotranspiration. This limits its ability to capture climate-change-induced increases in TAS and its effect on moisture demand and availability [37].
The SPEI takes into account potential evapotranspiration (PET) based on TASmin and TASmax on a monthly scale for a certain location. Using Hargreaves’ equation, PET can be determined:
where RA is the mean extra-terrestrial radiation [mm/a], ∆T is the difference between the mean monthly TASmax and the mean monthly TASmin for the corresponding month [°C], and T is the mean air temperature [°C] [38]. The final input parameter for determining the SPEI is total monthly PR [mm]. The drought projections were determined using the R-Studio package SPEI [39]. The index classifies drought into various categories, providing information about the severity and probability of recurrence of the event. Extreme droughts are indicated by SPEI values ≤ −2, which have a 1 in 50 years probability of recurrence. Severe droughts range between SPEI values of−2 and −1.5 and have a 1 in 20 years probability in recurrence. Depending on the number of previous months included in the calculation, different types of droughts can be assessed [37]. In this study, SPEI was determined considering 2, 3, 6, and 12 months of antecedent conditions. SPEI2 and SPEI3 reflect short-term changes in PR, TAS, and evapotranspiration. Taking into account more months indicates medium- to long-term changes in the input variables. Thus, effects of the drought on the hydrological realm are more likely. While SPEI6 accounts for seasonal trends, which are likely to impact stream flow and reservoir levels, droughts indicated by SPEI12 may hint at changes in the groundwater levels [37].
3.3. Climatic Water Balance
The climatic water balance (CWBAL) can be used to show climate-related deficits or surpluses in the water budget [40]. It is suitable for the hydroclimatic characterization of sites, areas, or time periods in the context of water management and hydrology. The CWBAL describes the hydroclimatic conditions based on the water balance components PR and PET in mm (CWBAL = PR − PET). Thereby, it takes on positive or negative values, depending on whether PR or PET predominates in the period under consideration. The analysis of the CWBAL can improve the knowledge on the effects of climate change on hydrological catchments, as it indicates how the water budget will develop under changing climatic conditions [41].
Based on the projected climate data, where PET was derived by Hargreaves’ equation, the CWBAL was determined on an annual and seasonal basis for the present and near future, intermediate future, and far future, in order to assess the changing water budget under the high- and low-emission scenario in the Gersprenz catchment.
4. Results
4.1. Temperature and Precipitation
Figure 2 illustrates the evolution of TAS in the study area under the high- and low-emission scenarios. For RCP8.5, the ensembles project an average increase in TAS of 1 °C to 1.5 °C in the near future, 1.5 °C to 3 °C in the intermediate future, and 3 °C to 5 °C in the far future. Under the low-emission scenario, TAS increases are projected to be 0.5 °C to 1.5 °C in the near future and around 1 °C to 1.5 °C in the intermediate and far future compared to the reference period. The high-emission scenario shows a potential increase of up to 3.4 °C compared to the low-emission scenario. The projected PR anomalies are less conclusive. Some simulations indicate positive trends, while others show a decrease in PR. Figure 3 displays the percentage changes in total medium PR compared to the reference period. For the RCP8.5 scenario, changes range from −3% to 5% in the near future, −5% to 11% in the intermediate future, and −12% to 11% in the far future. In the RCP2.6 scenario, changes range from 0% to 9% in the near future, −2% to 10% in the intermediate future, and −3% to 8% in the far future.
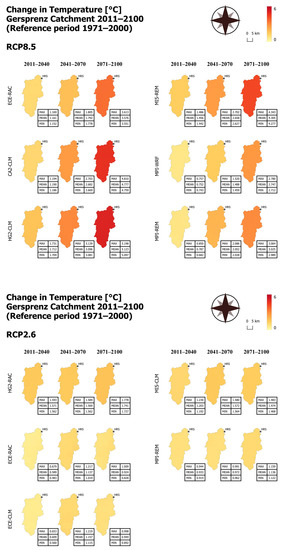
Figure 2.
Projected changes in TAS in the Gersprenz catchment are summarized for three time periods compared to the reference period. The tables display the maximum, mean, and minimum changes in area-averaged values for each period under RCP8.5 and RCP2.6.
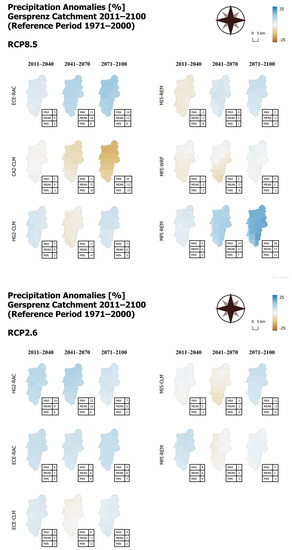
Figure 3.
Projected changes in PR in the Gersprenz catchment are summarized for three time periods compared to the reference period. The tables display the maximum, mean, and minimum changes in area-averaged values for each period under RCP8.5 and RCP2.6.
A combined analysis of TAS and the PR projections is presented in thermopluviograms (Figure 4). The high-emission scenario shows pronounced changes in both variables, with a clear migration of the point cloud. TAS changes are distinct and relatively uniform, while PR changes exhibit larger variability. The spread of the point cloud increases with longer time periods, reflecting growing uncertainties. In contrast, the point cloud for the low emission scenario is denser, indicating a more confined change signal.
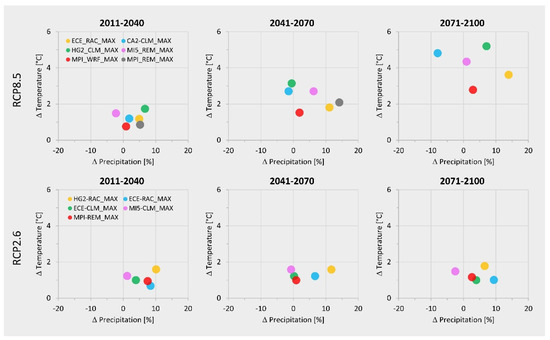
Figure 4.
Climate change signals for three time periods vs. the baseline. The points indicate the maximum projected changes for the variables TAS and PR.
4.2. Hot and Dry Days
The total annual number of hot days in the Gersprenz catchment exhibit a significant positive trend in the RCP8.5 scenario, with some ensemble members projecting more than 100 days per year with TASmax ≥ 30 °C in the far future. This trend is mitigated in the RCP2.6 scenario, with extreme heat occurring on fewer than 50 days per year in most cases. No significant trends are observed in the annual number of dry days with PR < 1 mm/d, reflecting the variability in projected precipitation. Seasonal analyses reveal significant increases in hot days during summer and autumn in the RCP8.5 scenario, and a few ensemble members also project an increase in spring (Figure 5). No significant trends are detected in the RCP2.6 scenario. The total number of hot days per year is projected to quadruple in the far future under the RCP8.5 scenario and double under the RCP2.6 scenario compared to the baseline scenario. The highest factors of change occur in autumn, where the number of hot days increases by a factor of 18 on average in the far future under RCP8.5. Spring also features notable changes, with an average increase in hot days by factor seven. Even in the RCP2.6 scenario, significant changes are projected for autumn and spring, with an increase in hot days by a factor of three and four, respectively.
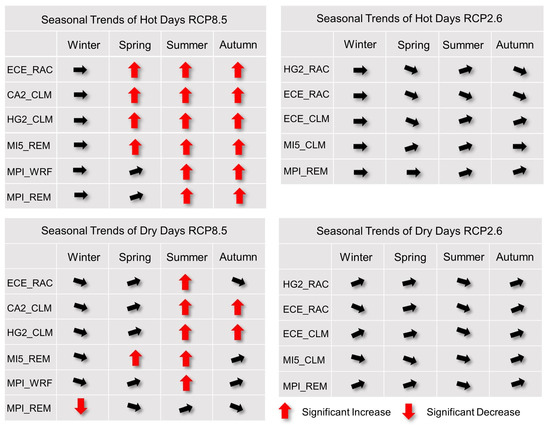
Figure 5.
The upper figures show the seasonal trends of hot days [TASmax ≥ 30 °C], the bottom two the seasonal trends of dry days [PR < 1 mm/d], for RCP8.5 (left) and RCP 2.6 (right) from 2011 to 2100. The direction of the arrow indicates whether a trend is positive or negative. Red arrows indicate significant trends.
Dry days were also analyzed, and the change factors were examined in percentages compared to the reference period. The increase in dry days is smaller compared to hot days. The maximum increase in dry days occurs in the summer months of the RCP8.5 scenario, with a 22% increase in the far future.
In the low-emission scenario, the maximum increase in summer dry days is 12%. In winter, the ensembles project an average 4% decrease for the high-emission scenario and a 2% decrease for the low-emission scenario in the far future compared to the baseline.
To estimate how the duration of dry and hot periods will evolve under climate change, the annual maxima of consecutive hot and dry days were determined. Under the RCP8.5 scenario, significant positive trends in the longest duration of consecutive hot days are detected. In the far future, the core ensemble projects that the longest hot periods may last up to two weeks on average, with some extreme projections exceeding 50 consecutive days. Under the low-emission scenario, no significant changes are observed in the length of hot spells, with a maximum of six days in the distant future.
Some ensemble members show positive trends for the maximum lengths of consecutive dry days in the RCP8.5 scenario, with the ensemble member CA2-CLM projecting extreme periods of over 100 days in the far future. No significant trends are observed for the low-emission scenario. A seasonal analysis reveals significant increases in the maximum duration of hot spells in summer, spring, and autumn under the RCP8.5 scenario (Figure 6). Autumn shows the strongest positive trends. No trends are identified in the RCP2.6 scenario.
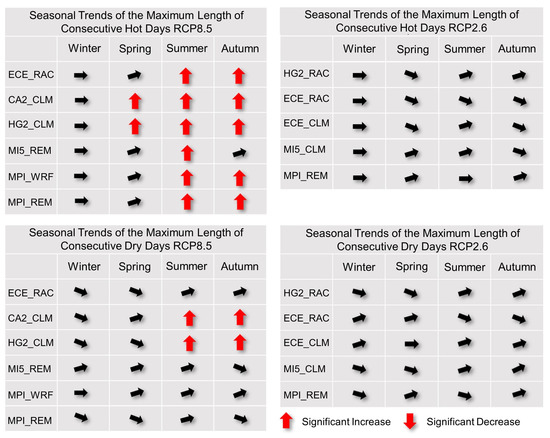
Figure 6.
The upper figures show seasonal trends of the longest period of consecutive hot days [TASmax ≥ 30 °C], the bottom two the seasonal trends of the longest period of consecutive dry days [PR < 1 mm/d] for RCP8.5 (left) and RCP2.6 (right) from 2011 to 2100. The direction of the arrow indicates whether a trend is positive or negative. Red arrows indicate significant trends.
Regarding the duration of consecutive dry days, all ensemble members predict an increase in the maximum duration of dry episodes in the summer and autumn months for the RCP8.5 scenario—two of them show a significant increase. No trends or tendencies are observed for the RCP2.6 scenario. Regarding the maximum number of consecutive hot and dry days, the change factors are significantly different from those of the total number of hot and dry days. Seasonally, autumn shows the highest change factors, followed by spring. The increase in the maximum length of hot spells is particularly striking. As projected for the average increase in annual hot days, the maximum number of consecutive hot days is also projected to increase by a maximum of factor seven in the far future of the RCP8.5 scenario. The maximum duration of hot spells increases significantly in autumn, with a projected average factor of 22 in the high-emission scenario and a factor of 7 in the low-emission scenario for the far future. The increase in the average annual maximum duration of dry spells is shown to be greater than the increase in the total number of projected dry days, with an average increase of 50% in the RCP8.5 scenario. In autumn, the maximum sequential amount of dry days increases by almost four. Under the RCP2.6 scenario, the maximum length of dry periods increases by an average of 22% to 26%, with a projected decrease in winter for both emissions scenarios.
4.3. Drought Indices
To observe the development of drought events and their magnitudes throughout the investigation period, the standardized precipitation evaporation index (SPEI) was used. The results reveal significant variations in the projected development of drought indices among different ensemble members and scenarios. For the drought indices reflecting the short-term development of water resources (SPEI2 and SPEI3), an increase in drought magnitudes is observed for both emission scenarios. An increase is also observed in the SPEI6 results—here the peaks appear more pronounced for RCP8.5 compared to RCP2.6. The drought index SPEI12, which reflects long-term water resource evolution and groundwater levels, shows significantly higher drought magnitudes under the high-emission scenario compared to the low-emission scenario. Drought periods also last longer, with ensemble member CA2_CLM projecting an extreme scenario of continuous drought for the last decade of the study period. Even under the low-emission scenario, drought magnitudes increase, although they are more frequently interrupted by wet phases. Overall, the severity of drought events increases with the number of months considered in the SPEI calculation, suggesting that long-term drought effects are expected to worsen in the future.
A general upward trend of drought magnitudes within both emission scenarios becomes apparent. To investigate the development of severe and extreme droughts specifically in both scenarios, the changes in the total quantities were analyzed for the three periods in reference to the baseline. The results in Figure 7 show that extreme droughts with an index below −2 are projected to increase significantly in the far future, more than tripling in number compared to the reference period. Severe droughts (−2 < SPEI < −1.5) will increase by slightly over half. In the high-emission scenario, the largest increase in severe events is observed for SPEI2, with 58% compared to the reference period. Increases for SPEI3, SPEI6, and SPEI12 are 40%, 27%, and 43%, respectively. In the low-emission scenario, there is also an increase in severe drought events, but the increases are significantly lower, ranging from 5% to 16% for SPEI2, SPEI3 and SPEI6. Only for the long-term drought index SPEI12 does the number of severe drought events projected in the low-emission scenario closely match those in the high-emission scenario.
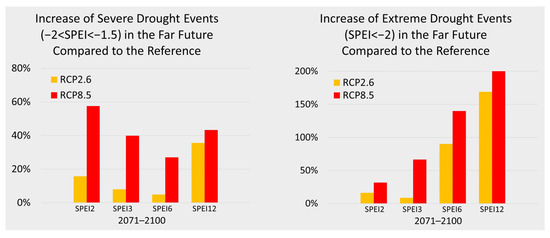
Figure 7.
Increase in percentage of severe (left) and extreme drought e4vents (SPEI < −2) in the far future compared to the reference.
Significant increases in extreme drought events are projected in the distant future for both emissions scenarios. The number of months considered in the calculation of SPEI correlates with the projected increase, with a higher increase in the RCP8.5 scenario than in the RCP2.6 scenario. This is especially true for the SPEI3 indicator. Here, the increase in extreme events is 9% for RCP2.6 and 67% for RCP8.5. In the intermediate future, the trend in drought events is more ambiguous, with some ensembles projecting an increase and others a decrease. Under RCP2.6, SPEI3, SPEI6 and SPEI12 indicate increases ranging from 22% to 134% between 2041 and 2070. Under RCP8.5, only SPEI12 shows an increase of about 67%, while SPEI2, SPEI3, and SPEI6 experience minimal changes. The development of severe drought events in the medium future remains uncertain, except for a noticeable increase of 38% for SPEI3 under the RCP2.6 scenario.
In the present and near future, the projected changes in the number of extreme drought events are small compared to the reference. Surprisingly, a negative trend in severe drought events occurs in both scenarios, reaching a 44% decrease relative to the baseline. Seasonal trends were also analyzed for droughts, as shown in Figure 8. In the summer months of the far future, more than ten drought events are projected in the high-emission scenario, reflecting short-term variations. In the autumn months, there are ten extreme or severe drought events for SPEI3 and SPEI6. For the low-emission scenario, the number of extreme or severe drought events varies less across the three time periods, but the number of drought events is higher in the present and near future than for the high-emission scenario. In particular, the high-emission scenario projects more severe or extreme droughts in the winter and spring months in the near future than the low-emission scenario. Short-term droughts are found to be more common, while long-term dynamics are found to drive drought events in the far future.
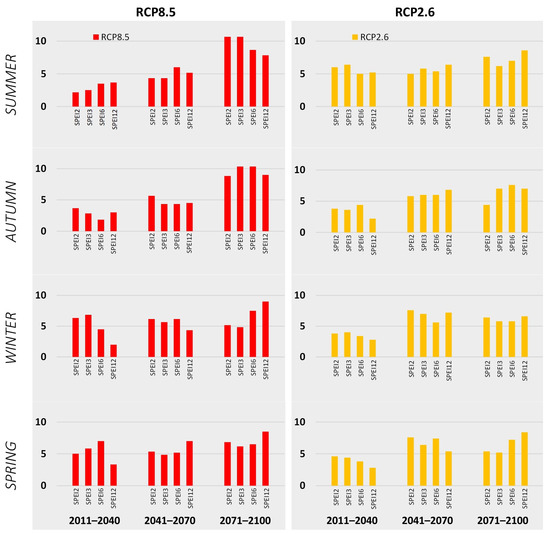
Figure 8.
Total number of severe or extreme droughts (SPEI < −1.5) for each season of the present and near future, intermediate future and far future.
4.4. Climatic Water Balance
The CWBAL exhibits high temporal and regional variability. This variability is primarily driven by fluctuations in PR depths over time, reflecting in the analysis of the CWBAL for the Gersprenz catchment across the three time slices. Under the RCP8.5 scenario, the average annual CWBAL slightly increases in the near future compared to the reference period. It rises from approximately 6 mm to about 13 mm. However, in the intermediate future, the CWBAL decreases to around 2 mm, and in the far future, it drops significantly to −40 mm. Individual annual water balances vary greatly over these periods. The low-emission scenario projects higher average annual CWBAL values compared to the baseline. A peak occurs in the near future, reaching approximately 52 mm, declining to 22 mm and 26 mm in the intermediate and far future, respectively.
As already noted in prior analysis, no clear trend is discernable in the time series of the annual sums of projected PR or related indices. However, significant seasonal fluctuations in PR are detected. To verify the variation in inter-annual water balance, changes in CWBAL levels for the three time periods compared to the reference period were examined. Figure 9 illustrates the CWBAL of the reference period as 100%, with an increase indicating higher average seasonal CWBAL and a decrease indicating lower seasonal water balance.
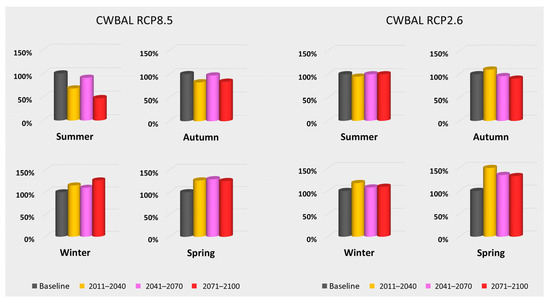
Figure 9.
Annual climatic water balance in the Gersprenz catchment, smoothed using the moving average of three years for the RCP8.5 (left) and RCP2.6 (right) emission scenarios for the present and near future, intermediate future, and far future.
Observing the absolute average CWBALs, it is shown that the projected values are negative in the summer and spring months. Under the high-emission scenario RCP8.5, the CWBAL decreases further in the summer months, becoming more negative, with a net balance of up to −274 mm in the far future. Even though the absolute CWBAL stays positive in the autumn months, it decreases by 16% compared to the baseline. These results indicate lower future water availability in the summer and autumn months of the high-emission scenario.
In the future, the CWBAL in spring increases by up to 27% in the RCP8.5 scenario, while in winter it reaches 202 mm compared to 160 mm in the baseline. This suggests greater water availability in the spring and winter months for the high-emission scenario. In the low-emission scenario, the changes are less pronounced. The CWBAL shows a slight decrease in summer, reaching −188 mm in the near future. However, it returns to −179 mm in the middle and far future. In autumn, there is a slight increase in the near future (about 10%), followed by a decrease in the middle and far future. In winter and spring, the net water balance increases. Interestingly, the increment in the low-emission scenario is more significant than in the high-emission scenario, with an increase of 56% in the near future compared to the baseline, decreasing to 35% and 33% in the intermediate and far future, respectively.
5. Discussion
In the following section, a comprehensive discussion of the results obtained from this study is presented. The results are contextualized and analyzed in relation to larger-scale developments over the same study period. The discussion further aims at providing a deeper understanding of the implications and uncertainties associated with the findings.
5.1. Temperature and Precipitation
The changes in TAS observed in this study align with previous research. Among others, the BMDV Network of Experts, the LFU, and the previous climate impact assessment report projected increasing temperatures for Germany under the RCP8.5 scenario [3,18,20]. In the near future, the projected temperature increases are relatively consistent between the low- and high-emission scenarios. For the Gersprenz river basin, TAS increase ranges from approximately 1 °C to 1.5 °C during 2011–2040 compared to the reference period 1971–2000 under the RCP8.5 scenario. In the RCP2.6 scenario, the increase ranges from 0.5 °C to 1.5 °C for the same period.
In the far future, the projections of the two scenarios are significantly further apart. With a projected increase in mean annual temperature in the far future of between approximately 3 °C and 5 °C, the increase for the Gersprenz catchment is slightly higher than for Germany as a whole, where an average increase of between 3 °C and 4.2 °C is expected for the far future within the high-emission scenario. This finding indicates that warming in the Gersprenz catchment is higher than the German average, underscoring the region’s vulnerability to climate change. In agreement with the German Weather Service, a greater warming of temperatures is expected in southern Germany compared to northern Germany [20,42]. Therefore, the projected results for the variable TAS for the south-lying Gersprenz catchment are considered plausible. The increasing evolution of TAS is significantly weakened in the RCP2.6 scenario. Here, the maximum increase for the far future measures 1.5 °C.
Unlike TAS, PR is much more variable in time and space, and its alterations due to climate change vary [43]. Generally, the annual PR over Germany is distributed fairly homogeneously over the seasons. The average PR in Germany during the reference period of 1971–2000 was approximately 774 mm [18]. In this study, the ensembles project an annual PR of 807 mm in the Gersprenz basin, slightly above the German mean for the same period. This aligns with the expected higher mean annual PR in low mountain ranges. Brienen et al. (2020) found that the relative changes in mean PR between the individual regions in Germany are, with some exceptions, rather marginal. In the low mountain ranges the change signals are mostly smaller on a relative basis [18]. This is confirmed by the findings in this study that identifies no statistically significant developments for PR for the projection period. Examining global studies, it is evident that while the hydrological cycle is likely to change and intensify, there may not be a significant change in average PR. Instead, an increase in the frequency and intensity of extreme events, such as prolonged dry and wet periods, is expected [44,45,46,47]. In general, the core ensemble used in this study reveals larger ranges of change signals for PR compared to TAS projections. The thermopluviogram of change signals within the RCP2.6 scenario exhibit a considerably denser point cloud than that of the RCP8.5 scenario. Within the high-emission scenario, a clear migration of the point cloud is observed due to the rising temperatures.
The projections of the meteorological variables TAS and PR provide valuable insights into the region’s vulnerability towards climate change, aligning with previous research and emphasizing the importance of localized assessments to achieve a better understanding of region-specific impacts.
5.2. Hot and Dry Days
A significant increase in hot days, in which TASmax ≥ 30 °C, is projected for the Gersprenz basin within the RCP8.5 scenario. This aligns with previous research indicating that climate warming leads to a shift in the temperature distribution towards warmer values, resulting in a decrease in cold days and an increase in hot days [48]. Furthermore, recent studies suggest that climate change will not only cause a distribution shift but also greater variability and more extreme events, leading to an increase in hot days across most regions of Germany [49]. As a result, the number of frost and ice days will also continue to decline in all regions [50].
For the Gersprenz catchment, the RCP8.5 scenario’s ensemble members indicate an average of approximately 10 hot days per year during the reference period. This is slightly higher than the German average number of hot days of eight days per year, but consistent with the other findings for the Frankfurt region and the Rhine region, where 10 to 12 hot days are measured [18,20]. The findings indicate a significant increase in hot days for the coming decades. The annual total number of hot days in the research catchment is projected to rise to up to 44 days per year in the far future of the RCP8.5 scenario. This finding is supported by Brienen et al., 2020, who state that in large parts of Germany, more than 40 hot days per year are to be expected in the far future [18].
In the RCP2.6 scenario, the projected average number of annual hot days for the far future is 18, as confirmed for Frankfurt, where hot days are expected to range from 10 to 20 per year [18]. Therefore, even under the low-emission scenario, an increase in hot days is projected, although no significant trends are found in the trend analysis. Within the study area, a slight gradient in the total number of hot days is expected to occur from north to south, as the number decreases with increasing elevation. A significant increase in hot days in the autumn months of up to factor 18 is projected in the far future of RCP8.5. This increase in autumn temperatures is expected to be the most pronounced, with TASmin also showing a significant rise. The RCP8.5 scenario also indicates the second highest increase in hot days during spring, with a seven-fold rise in the total annual count compared to the baseline. Brienen et al. (2020) similarly projected a significant increase in hot days during both autumn and spring within the RCP8.5 scenario [18]. Also, for the summer months, the increase in hot days is shown to be significant with a factor of four. Even within the low-emission scenario, a four-fold increase in hot days is expected for the autumn months of the far future. Furthermore, the number of hot days nearly triples in spring and doubles in summer. However, the trends for the total annual count of hot days are not significant under the low-emission scenario, unlike the RCP8.5 scenario, where all ensemble members project significant increases in summer and autumn hot days. Four out of six ensemble members also indicate a significant increase in hot days during spring.
While Germany as a whole counted about 236 dry days for the reference period, the total number measured 238 dry days in the research basin. The Germany-wide total number of dry days was projected to slightly increase on an annual basis for the present and near future, intermediate future, and the far future for the RCP8.5 scenario [18]. The same is shown for the research basin where the total number of dry days amounts to 249 annually in the far future of the high-emission scenario. In the reference period, the number of dry days is more or less evenly distributed among the seasons with 57 in winter to 62 dry days in summer. For the projected period from 2011 to 2100, a slight decrease to a moderate increase in dry days is shown for the entire year, depending on the range of the climate model ensemble and climate scenario. A more differentiated picture is shown for the individual seasons:
Dry days are projected to increase on average for summer (up to 22% in the far future) and autumn (up to 14% in the far future), while for the winter and spring months, there is a slight reduction in the total number of dry days in the far future of the RCP8.5 scenario (up to a 16% reduction in winter and a 7% reduction in spring). Also in the low-emission scenario, the tendencies of these developments are reflected within the given seasons. However, the changes in dry days are considerably smaller than in the RCP8.5 scenario: e.g., the increase in dry days in the autumn and summer months measure 4% and 2%, respectively. The trends detected for the development of total annual dry days are projected to be significant in the summer months by five out of six ensemble members of the high-emission scenario. On the other hand, the development of the total number of dry days in winter is projected to be negative within the RCP8.5 scenario. One ensemble member projects a significant decrease in dry days in winter.
Given the results of this study, it may be presumed that winter and spring seem to become slightly wetter, while autumn and summer seem to become drier in the catchment of the Gersprenz river. The findings are consistent with studies conducted throughout Germany, which project increases in PR for winter and spring and a significant decrease in mean PR by the end of the 21st century in summer [18,20,51,52]. Furthermore, they found that for both emission scenarios, PR increases in the winter months especially in regions that are higher elevated, such as the low mountain ranges. For the region of Frankfurt, they specifically project decreasing PR for the summer months. Also, a study by LFU (2020) projected a decrease in PR in the summer months for German low mountain ranges and an increase in PR in winter and spring [3]. The studies verify the results of this paper.
Besides observing the development of the total number of hot and dry days, the evolution of the maximum annual lengths of consecutive hot and dry days was also analyzed. All ensemble members project significant increases in the length of future hot spells in the Gersprenz catchment for the high-emission scenario. For the far future of the RCP8.5 scenario, the core ensemble projects that the longest heat periods could last an average of two weeks. This accounts to an average increase in the length of heat periods by factor of 3.5 in the far future of the RCP8.5 scenario compared to the reference period. Within the RCP2.6 scenario, an increase of 1.5 in the average length of dry spells is projected for the far future.
In terms of seasonal changes, the most significant developments are observed during autumn, with a maximum increase in consecutive hot days per year by a factor of 22. For the high-emission scenario, three out of six ensemble members project a significant increase in the longest period of consecutive dry days. In winter, there is a slight decrease in dry period length for both emission scenarios. The low-emission scenario does not show significant changes in the remaining seasons, whereas in the RCP8.5 scenario, the maximum length of dry periods almost quadruples in autumn and nearly doubles in summer. This aligns with Germany-wide studies in which significant increases in events with consecutive dry days during summer and autumn were detected under the RCP8.5 scenario [18,20]. This implies that shorter dry spells in summer and autumn have the potential to evolve into more prolonged periods of dryness. In winter, a slight decrease in dry days is predominantly expected across all altitudes.
In conclusion, the study’s findings underscore the need for regional adaptation strategies to combat seasonal water availability risks and an overall significant increase in temperature extremes and prolonged heat periods.
5.3. Drought Indices
The study’s findings clearly demonstrate an increasing frequency of drought events and longer durations of drought. This follows up with the findings of Grosser and Schmalz (2021), who observed a rise in droughts in the Gersprenz region from 1980 to 2018 [10]. For the high-emission scenario, the projected increase in drought durations and magnitudes in general is more pronounced than for the low-emission scenario, attributed to greater warming and extreme PR changes. Spinoni et al. (2020) support these findings, showing a slight but notable increase in droughts, especially extreme ones, under higher RCPs [53]. Nevertheless, even under the low-emission scenario, a very clear increase in drought frequency and duration was shown to take place [54]. Also, Grillakis (2019) showed that, even under strong emission mitigations, drought occurrences will increase throughout Europe [55]. Additionally, Cook et al. (2020) demonstrated drying and increased extreme droughts even under stringent climate protection pathways [56]. Ruosteenoja et al. (2017) found similar spatial drying patterns in Europe under low- and high-emission scenarios, with slightly higher drought intensities in the latter [57]. These findings align with this study’s results, suggesting that despite emission reduction efforts, droughts are inevitably increasing, including within the RCP2.6 scenario.
Moreover, it is interesting to note that while short-term meteorological droughts increase by a similar degree in both emission scenarios, long-term droughts intensify, especially in the RCP8.5 scenario. Within the high-emission scenario, the results show that the drought magnitude is dependent on the number of months taken into account in the computation of the SPEI. It is shown that when more months are considered, the drought magnitudes increase. In other words, the more antecedent conditions taken into account, the more severe the droughts become. These results hint at a future increase in long-term droughts, as indicated by the SPEI12, especially under the high-emission scenario, which will affect not only stream flow levels but also groundwater tables.
Seasonally, severe or extreme drought events show clear increases, especially in summer and autumn for the high-emission scenario, aligning with the Helmholtz Climate Initiative’s findings on increasing summer droughts [58]. However, the results in this paper supplement that also in winter and spring, a significant increase is depicted for long-term droughts indicated by SPEI12. These results stem from the inclusion of drier conditions from the preceding 12 months in the indicator. Even within the RCP2.6 scenario, slight increases in summer drought events are observed. Much more apparent, however, are the increases in drought events in spring, winter, and autumn for the far future compared to the near future in the low-emission scenario.
The significant increases in drought durations and magnitudes found in this study have also been depicted within a report by the German Federal Environmental Agency that shows that the German Rhine Main area, which encompasses the major part of the Gersprenz catchment, will be one of the regions within the country most affected by droughts [59]. These findings demonstrate that climate change has already heightened drought occurrence and magnitudes in the Gersprenz River catchment. As the likelihood of the high-emission scenario increases, drought consequences will become more severe. Long-term adaptation to a drier baseline and reconsideration of drought classification based on available indicators will be necessary.
5.4. Climatic Water Balance
The computed CWBAL values presented in this paper needs to be interpreted with care, as they reflects the relation between PR and the PET. The PET, in contrast to the actual evapotranspiration, is based on the assumption that the water availability for the evaporation process is non-limiting. Thus, it is important to bear in mind that, in reality, water resources will eventually deplete, and evapotranspiration rates are heavily influenced by factors such as region, landscape, and land use. However, the indicator can be used as a proxy for the availability of water resources and can help to anticipate climate change impacts on hydroclimatology as well as on the security of water supply to plants and habitats [40,60]. Its utilization in numerous climate change studies is attributed to its efficiency and minimal data requirements [41,60,61].
This study reveals decreased water availability in future summer and autumn months, alongside increased water availability in winter and spring, particularly within the high-emission scenario. A related study by LUBW (2022) observed similar patterns in Baden-Württemberg, a neighboring federal state to Hesse, with water decreasing between June and October and increasing between November and May in the far future [60]. Within the low-emission scenario, on the other hand, water availability increases in the winter and spring months for the future compared to the baseline. Summer water availability decreases only in the near future. Autumn water availability initially increases in the present and near future, then decreases in the intermediate and far future. These trends align with the characteristics of the low-emission scenario as a “peak scenario” [62].
Finally, it is important to note that the long-term average yearly water balances in the Gersprenz catchment area have typically been positive [40]. The projected net negative CWBAL for the far future under the high-emission scenario carries significant implications for the hydrological realm. The shift towards negative water balances underscores the challenges that lie ahead regarding the water availability in the region.
5.5. Uncertainties
As with all projections of the future, the presented results are subject to uncertainties. Each ensemble member consists of a GCM and a RCM. These models differ from each other given their developers, their model components, spatial and temporal resolutions, number of vertical layers, etc. [63,64,65,66]. This results in a wide range of models covered by the core ensemble. A study of the Bavarian State Office for the Environment examined the simulations of the DWD reference ensemble in more detail and identified their differences. Although this investigation took place before the bias correction by the BMDV Network of Experts, the results illustrate the differences that arise in the model results and highlight the uncertainties that must be taken into account in the interpretation of these results [3]. Four indicators were developed to quantify the deviation of the considered climate projections from the reference dataset (1971–2000). Indicator I is a quantity indicator, which describes the deviation of the annual average value. Indicator II is a quantity indicator with seasonality reference, which gives the deviation of the monthly average value. Indicator III describes the deviation of the annual cycle of the average monthly values and is, thus, a seasonality indicator. Finally, indicator IV is a sample indicator, based on the deviation of the spatial distribution of the annual average values. In this evaluation key, points between 0 and 10 were assigned to the indicators in eleven equally sized classes. The smaller the deviation from the reference dataset, the more points were assigned to the projection. Thereby, the plausible change signals for the future were taken into account as bias. Only 30 year means of the time series were compared for four regions. For further details refer to LfU (2020) [3]. In the following, the evaluations of the results for the ensemble members used in this study are presented for the German low mountain range area. Table 2 shows the evaluations for the variables PR and TAS. It can be seen that the ensemble members show small deviations in PR annual and monthly sums. As for the deviation in the annual cycle of the average monthly values (indicator III) and the deviation in the spatial distribution of the annual average values (indicator IV), the deviations are larger, particularly in the RCP8.5 scenario. Regarding the spatial distribution of PR, the Luv–Lee effect is a known problem of the REMO2009 projections and has not been fixed for the REMO2015 projections either [67]. Ensemble members CA2-CLM and HG2-CLM receive zero points in mapping the correct annual cycle of PR.
Table 2.
Evaluation of the bias indicators for PR (top) and TAS (bottom) in the low mountain range area for the ensembles used in this study. A score of 10 points indicates a very high agreement between the reference data and the projected data, while 0 points indicate a very high deviation. The ensembles of RCP8.5 are shown on the left, those of RCP2.6 on the right (modified according to LfU, 2020 [3]).
The spatial distribution of TAS and the deviation in the annual cycle of the average monthly values are better met in both emission scenarios. Here, however, larger deviations occur for indicators I and II. In the RCP8.5 scenario, ensemble member ECE-RAC receives only 1 point, while HG2-RAC scores 0 points within the low-emission scenario. In agreement with LfU (2020), in general, projections based on the RCM KNMI Racmo (RAC) have a temperature bias and are, therefore, colder than they should be [3]. Although the projections were subsequently bias-adjusted and regionalized by the BMDV Network of Experts [18], extreme deviations may have been challenging to completely eliminate, given the magnitude of the corrective intervention. Nevertheless, when examining the long-term developments and considering the Gersprenz catchment as a whole, these deviations carry relatively less weight in interpreting the results and trends of this study. The utilization of the core ensemble helps mitigate the influence of potential outliers, while incorporating ensemble members representing a range of future scenarios acknowledges the uncertainties associated with future development.
Additionally, the uncertainties in the study’s results stem not only from variations in the climate models but also from the scenarios used to project future pathways. By using a high- and low-emission scenario, this study aims to cover a range of possible paths for the future development of climate. The RCP2.6 scenario, also referred to as the Paris Agreement scenario, has become increasingly unlikely in recent years, as achieving the 1.5 °C target is considered highly improbable [1]. At the other extreme, the RCP8.5 scenario, which was originally developed as a “worst-case scenario,” has come to be referred to as a “business-as-usual” scenario in several scientific studies, while others even state that the RCP8.5 scenario is underestimating future concentrations of atmospheric carbon [68]. Since future developments are highly uncertain and there is no consensus in the scientific community which RCP is the most likely to describe the current development, this study has largely refrained from using descriptive terms for the RCPs. Nevertheless, it is important to keep in mind the background against which the two scenarios have been developed and their implications. Furthermore, it should be borne in mind that the two scenarios are intended to take account of the uncertainties of future development by means of an upper and a lower limit, but that the achievement of this lower limit is becoming increasingly unlikely, while the upper limit is becoming increasingly probable.
To effectively address the presented uncertainties, it is crucial to implement regionally tailored adaptation strategies based on scientific data and thorough analysis. These strategies should be flexible, taking into account changing conditions, and include measures such as sustainable water management and comprehensive strategies. By ensuring so, we can proactively mitigate the potential impacts and ensure long-term resilience in the face of an uncertain future.
6. Summary and Conclusions
This study investigates the implications of climate change on drought and water availability in the Gersprenz River catchment, located in the German low mountain range. A thorough analysis of climate and drought indices, as well as the climatic water balance was performed to project hydroclimatic extremes in the region. Two scenario ensembles, RCP8.5 and RCP2.6, were utilized to provide a comprehensive understanding of the potential impacts of climate change. By considering these scenarios, the study offers valuable insights into the future hydrological conditions and aids in informing adaptation strategies to address the challenges posed by changing climate patterns specific to the region.
The following key findings summarize the principal results of this study:
- Regional impact: The projected maximum warming in the Gersprenz catchment under the RCP8.5 scenario exceeds the German average by 0.8 °C. With 44 heat days per year in the far future of the RCP8.5 scenario, the study area is in the upper range of the German-wide average projections;
- Water scarcity: Despite wetter winters, long-term water deficits are expected to persist in the catchment. The study highlights that increased precipitation during winter months will be insufficient to offset the growing water deficits, exacerbating water availability challenges in the long term;
- Seasonality: In the far future of the RCP8.5 scenario, there will be about seven times more hot days and six times longer heat spells in spring and about four times more hot days and three times more heat spells in summer. The number of dry days will on average increase by maximum of 22% compared to the reference period. The maximum length of dry periods will increase by 31%;
- Autumn droughts: Climate change is projected to amplify the risk of extreme droughts in autumn, once more emphasizing the seasonal impact of changing climatic conditions. In the far future, the length of dry periods in autumn is projected to increase by approximately 68%, accompanied by an average of 18 times more hot days and 22 times longer heat periods;
- Scenario differences: Under both RCP8.5 and RCP2.6 scenarios, the magnitude and frequency of droughts increases in the future, with a more severe increase in the RCP8.5 scenario. While short-term meteorological droughts increase at about the same rate in both scenarios, long-term droughts are significantly exacerbated in the high-emission scenario;
- Water availability challenges: The study emphasizes potential issues with water availability in the region. Particularly in summer and autumn of the far future, the climatic water balance indicates substantial deficits.
This study pioneers the use of a recently bias-adjusted and regionalized set of projected climate data at the catchment level, providing a unique contribution to the scientific understanding of climate change impacts in the German low mountain range regions. Using the RCP8.5 and the RCP2.6 scenarios, the upper and lower limits of climate change possibilities are explored, highlighting the importance of global climate change mitigation. However, even with substantial emissions reduction efforts, the study demonstrates that the magnitude and frequency of drought events in the Gersprenz catchment will continue to increase, necessitating a re-evaluation of current approaches and the implementation of adaptation strategies.
Projected temperature increases, particularly in summer and autumn, are expected to escalate water demands and exert additional pressures on water resources in the area. Rising temperatures and water shortages will adversely affect ecosystems in the Gersprenz River basin. The RCP8.5 scenario projects very high stresses on water resources, emphasizing the need for effective water deficit adaptation strategies. It is crucial to address these challenges and consider the long-term implications of intensified drought events and the evolving baseline for water availability.
The findings from this study are applicable beyond the Gersprenz catchment, as it represents a typical case for German low mountain ranges. These results can be adapted and transferred to similar catchments or regions with comparable characteristics in Germany or Europe, providing valuable guidelines for water governance and management decision-making. The study also emphasizes the significance of analyzing mesoscale watersheds such as the Gersprenz catchment, as they offer valuable insights into developing targeted adaptation strategies specific to localized conditions. By focusing on the localized analysis of the Gersprenz catchment, this study enhances understanding of the region’s unique challenges and opportunities in water resource management. Contributing to the broader scientific understanding of regional climate change impacts, it aids stakeholders with knowledge to better comprehend and mitigate the effects of future climate change in German low mountain range regions.
In summary, this study provides valuable insights into the specific impacts of climate change on the occurrence of hydroclimatic extremes in the Gersprenz catchment, contributing to the scientific understanding of regional-scale climate change impacts. Additionally, the study offers transferable knowledge and methodologies for an overarching assessment of these extremes and their consequences in similar regions.
Author Contributions
Conceptualization, P.F.G. and B.S.; methodology, P.F.G.; software, P.F.G.; validation, P.F.G. and B.S.; investigation, P.F.G.; resources, B.S.; data curation, P.F.G. and B.S.; writing—original draft preparation, P.F.G.; writing—review and editing, P.F.G. and B.S.; visualization, P.F.G.; supervision, B.S. All authors have read and agreed to the published version of the manuscript.
Funding
We acknowledge support by the Deutsche Forschungsgemeinschaft (DFG, German Research Foundation) and the Open Access Publishing Fund of Technical University of Darmstadt.
Institutional Review Board Statement
Not applicable.
Informed Consent Statement
Not applicable.
Data Availability Statement
The original dataset can be requested from the German Weather Service. The datasets generated and analyzed in this study are available on reasonable request from the corresponding author.
Acknowledgments
Our research activities are only possible through good cooperation. We would like to express our sincere thanks to the German Weather Service for providing us with the data. In particular, we would like to thank Nora Leps for her enthusiastic support and technical expertise.
Conflicts of Interest
The authors declare no conflict of interest.
References
- IPCC. Climate Change 2022: Mitigation of Climate Change. Contribution of Working Group III to the Sixth Assessment Report of the Intergovernmental Panel on Climate Change; Cambridge University Press: Cambridge, UK; New York, NY, USA, 2022. [Google Scholar]
- Arnone, E.; Cucchi, M.; Gesso, S.D.; Petitta, M.; Calmanti, S. Droughts Prediction: A Methodology Based on Climate Seasonal Forecasts. Water Resour. Manag. 2020, 34, 4313–4328. [Google Scholar] [CrossRef]
- LfU. Bayrisches Landesamt für Umwelt: Das Bayerische Klimaprojektionsensemble Audit und Ensemblebildung; LfU: Augsburg, Germany, 2020. [Google Scholar]
- Christensen, J.; Hewitson, B.; Busuioc, A.; Chen, A.; Gao, X.; Held, I.; Jones, R.; Kolli, R.K.; Kwon, W.T.; Laprise, R.; et al. Regional Climate Projections. In Climate Change 2007: The Physical Science Basis. Contribution of Working Group I to the Fourth Assessment Report of the Intergovernmental Panel on Climate Change; Cambridge University Press: Cambridge, UK; New York, NY, USA, 2007. [Google Scholar]
- Eckstein, D.; Künzel, V.; Schäfer, L.; Winge, M. Global Climate Risk Index 2020 Who Suffers Most from Extreme Weather Events? Weather-Related Loss Events in 2018 and 1999 to 2018; Germanwatch eV: Bonn, Germany, 2019. [Google Scholar]
- Ihinegbu, C.; Ogunwumi, T. Multi-criteria modelling of drought: A study of Brandenburg Federal State, Germany. Model. Earth Syst. Environ. 2022, 8, 2035–2049. [Google Scholar] [CrossRef]
- KLIWA, Klimaveränderung und Wasserwirtschaft. Niedrigwasser in Süddeutschland. Analysen, Szenarien und Handlungsempfehlungen. In KLIWA-Berichte, Heft 23; Landesanstalt für Umwelt BadenWürttemberg (LUBW), Bayerisches Landesamt für Umwelt (BLfU); Landesamt für Umwelt Rheinland-Pfalz (LfU): Mainz, Germany, 2018. [Google Scholar]
- Huang, S.; Krysanova, V.; Hattermann, F. Projections of climate change impacts on floods and droughts in Germany using an ensemble of climate change scenarios. Reg. Environ. Chang. 2015, 15, 461–473. [Google Scholar] [CrossRef]
- Roers, M.; Wechsung, F. Reassessing the climate impact on the water balance of the Elbe River basin. Hydrol. Wasserbewirtsch. 2015, 59, 109–119. [Google Scholar] [CrossRef]
- Grosser, P.; Schmalz, B. Low Flow and Drought in a German Low Mountain Range Basin. Water 2021, 13, 316. [Google Scholar] [CrossRef]
- Diller, C.; Hebecker, J. Klimawandel in Deutschland: Handlungsmöglichkeiten der Regionalplanung. Angew. Geogr. 2008, 32, 62–70. [Google Scholar] [CrossRef]
- David, A.; Schmalz, B. A Systematic Analysis of the Interaction between Rain-on-Grid-Simulations and Spatial Resolution in 2D Hydrodynamic Modeling. Water 2021, 13, 2346. [Google Scholar] [CrossRef]
- David, A.; Schmalz, B. Flood Hazard Analysis in Small Catchments: Comparison of Hydrological and Hydrodynamic Approaches by the Use of Direct Rainfall. J. Flood Risk Manag. 2020, 13, e12639. [Google Scholar] [CrossRef]
- Kissel, M.; Schmalz, B. Comparison of Baseflow Separation Methods in the German Low Mountain Range. Water 2020, 12, 1740. [Google Scholar] [CrossRef]
- Schmalz, B.; Kruse, M. Impact of Land Use on Stream Water Quality in the German Low Mountain Range Basin Gersprenz. Landsc. Online 2019, 72, 1–17. [Google Scholar] [CrossRef]
- Scholand, D.; Schmalz, B. Deriving the Main Cultivation Direction from Open Remote Sensing Data to Determine the Support Practice Measure Conturing. Land 2021, 10, 1279. [Google Scholar] [CrossRef]
- DWD. Deutscher Wetter Dienst. 2018. Available online: https://www.dwd.de/ref-ensemble (accessed on 23 July 2023).
- Brienen, S.; Walter, A.; Brendel, C.; Fleischer, C.; Ganske, A.; Haller, M.; Helms, M.; Höpp, S.; Jensen, C.; Jochumsen, K.; et al. Klimawandelbedingte Änderungen in Atmosphäre und Hydrosphäre. In Schlussbericht des Schwerpunktthemas Szenarienbildung (SP-101) im Themenfeld 1 des BMVI-Expertennetzwerks; Verkehr und Infrastruktur an Klimawandel und extreme Wetterereignisse anpassen; 2020; p. 157. [Google Scholar] [CrossRef]
- Brunner, M.I.; Slater, L.; Tallaksen, L.M.; Clark, M. Challenges in modeling and predicting floods and droughts: A review. Wiley Interdiscip. Rev. Water 2021, 8, e1520. [Google Scholar] [CrossRef]
- Buth, M.; Kahlenborn, W.; Savelsberg, J.; Becker, N.; Bubeck, P.; Kabisch, S.; Kind, C.; Tempel, A.; Tucci, F.; Greiving, S.; et al. Germany’s vulnerability to Climate Change—Summary. In Climate Change; Umweltbundesamt: Dessau-Roßlau, Germany, 2015. [Google Scholar]
- Kahlenborn, W.; Porst, L.; Voß, M.; Fritsch, U.; Renner, K.; Zebisch, M.; Wolf, M.; Schonthaler, K.; Schauser, I. Climate Impact and Risk Assessment 2021 for Germany—Summary. In Climate Change; Federal Environment Agency: Dessau-Roßlau, Germany, 2021. [Google Scholar]
- Crespi, A.; Renner, K.; Zebisch, M.; Schauser, I.; Leps, N.; Walter, A. Analysing spatial patterns of climate change: Climate clusters, hotspots and analogues to support climate risk assessment and communication in Germany. Clim. Serv. 2023, 30, 100373. [Google Scholar] [CrossRef]
- IPCC. Climate Change 2014: Synthesis Report. Contribution of Working Groups I, II and III to the Fifth Assessment Report of the Intergovernmental Panel on Climate Change; Core Writing Team; Pachauri, R.K., Meyer, L.A., Eds.; IPCC: Geneva, Switzerland, 2014. [Google Scholar]
- Taylor, K.E.; Stouffer, R.J.; Meehl, G.A. An Overview of CMIP5 and the Experiment Design. Bull. Am. Meteorol. Soc. 2012, 93, 485–498. [Google Scholar] [CrossRef]
- EURO-CORDEX. EURO-CORDEX Within the CORDEX Initiative. 2021. Available online: https://euro-cordex.net/060374/index.php.en (accessed on 15 October 2021).
- Hübener, H.; Bülow, K.; Fooken, C.; Früh, B.; Hoffmann, P.; Höpp, S.; Keuler, K.; Menz, C.; Mohr, V.; Radtke, K.; et al. ReKliEs-De Ergebnisbericht. ReKliEs-De 2017. [Google Scholar] [CrossRef]
- Krähenmann, S.; Walter, A.; Klippel, L. Statistische Aufbereitung von Klimaprojektionen: Downscaling und multivariate Bias-Adjustierung—Im Rahmen des BMVI-Expertennetzwerkes entwickelte Verfahren zum Postprocessing von Klimamodelldaten. In Berichte des Deutschen Wetterdienstes 254; Selbstverlag des Deutschen Wetterdienstes: Offenbach am Main, Germany, 2021. [Google Scholar]
- Krähenmann, S.; Haller, M.; Walter, A. A new combined statistical method for bias adjustment and downscaling making use of multi-variate bias adjustment and PCA-driven rescaling. Meteorol. Z. 2021, 30, 391–411. [Google Scholar] [CrossRef]
- Dalelane, C.; Früh, B.; Steger, C.; Walter, A. A Pragmatic Approach to Build a Reduced Regional Climate Projection Ensemble for Germany Using the EURO-CORDEX 8. 5 Ensemble. J. Appl. Meteorol. Climatol. 2017, 57, 477–491. [Google Scholar] [CrossRef]
- Schulzweida, U. CDO User Guide. In MPI for Meteorology; 2020. [Google Scholar]
- Kreienkamp, F.; Huebener, H.; Linke, C.; Spekat, A. Good practice for the usage of climate model simulation results—A discussion paper. Environ. Syst. Res. 2012, 1, 1–13. [Google Scholar] [CrossRef]
- WMO. Guide to climatological practices. In Technical Report; WMO-No. 100; World Meteorological Organization: Geneva, Switzerland, 2010. [Google Scholar]
- DWD. Deutscher Wetter Dienst. Wetter- und Klimalexikon. 2021. Available online: www.dwd.de/lexikon (accessed on 23 July 2023).
- Tebaldi, C.; Hayhoe, K.; Arblaster, J.M.; Meehl, G.A. Going to the extremes. An intercomparison of model-simulated historical and future changes in extreme events. Clim. Chang. 2006, 79, 185–211. [Google Scholar] [CrossRef]
- IKSR. Bestandsaufnahme zu den Niedrigwasserverhältnissen am Rhein. In Bericht Nr. 248; Internationale Kommission zum Schutz des Rheins: Koblenz, Germany, 2018. [Google Scholar]
- DWD. Dokumentation: Standardized Precipitation Index SPI. In DWD; Deutscher Wetterdienst: Offenbach, Germany, 2015. [Google Scholar]
- WMO. Standardized Precipitation Index User Guide; World Meteorological Organization: Geneva, Switzerland, 2012. [Google Scholar]
- Hargreaves, G.H.; Samani, Z.A. Reference Crop Evapotranspiration from Temperature. Appl. Eng. Agric. 1985, 1, 96–99. [Google Scholar] [CrossRef]
- Čadro, S.; Uzunović, M. How to Use: Package ‘SPEI’ for Basic Calculations. 2013. Available online: https://www.researchgate.net/publication/299971042_HOW_TO_USE_Package_%27SPEI%27_For_BASIC_CALCULATIONS (accessed on 15 June 2023). [CrossRef]
- bafg. Geoportal. 10 05 2022. Available online: https://geoportal.bafg.de/dokumente/had/214ClimaticWaterBalance.pdf (accessed on 23 July 2023).
- Bandoc, G.; Pravalie, R. Climatic water balance dyna mics over the last fivedecades in Romania’s most arid region, Dobrogea. J. Geogr. Sci. 2015, 25, 1307–1327. [Google Scholar] [CrossRef]
- DWD. Deutscher Wetter Dienst. 2023. Available online: https://www.dwd.de/DE/klimaumwelt/klimaatlas/klimaatlas_node.html (accessed on 23 July 2023).
- Martel, J.L.; Mailhot, A.; Brissette, F.; Caya, D. Role of Natural Climate Variability in the Detection of Anthropogenic Climate Change Signal for Mean and Extreme Precipitation at Local and Regional Scales. J. Clim. 2018, 31, 4241–4263. [Google Scholar] [CrossRef]
- Westra, S.; Fowler, H.J.; Evans, J.P.; Alexander, L.V.; Berg, P.; Johnson, F.; Kendon, E.J.; Lenderink, G.; Roberts, N.M. Future changes to the intensity and frequency of short-duration extreme rainfall. Rev. Geophys. 2014, 52, 522–555. [Google Scholar] [CrossRef]
- Westra, S.; Alexander, L.V.; Zwiers, F.W. Global Increasing Trends in Annual MaximumDaily Precipitation. J. Clim. 2013, 26, 3904–3918. [Google Scholar] [CrossRef]
- Huntington, T. Evidence for Intensification of the Global Water Cycle: Review and Synthesis. J. Hydrol. 2006, 319, 83–95. [Google Scholar] [CrossRef]
- Heinrich, G.; Gobiet, A. The future of dry and wet spells in Europe: A comprehensive study based on the ENSEMBLES regional climate models. Int. J. Climatol. 2012, 32, 1951–1970. [Google Scholar] [CrossRef]
- Diffenbaugh, N.S.; Singh, D.; Mankin, J.S. Unprecedented climate events: Historical changes, aspirational targets, and national commitments. Sci. Adv. 2018, 4, eaao3354. [Google Scholar] [CrossRef] [PubMed]
- Donat, M.G.; Alexander, L.V.; Yang, H.; Durre, I.; Vose, R.; Dunn, R.J.H.; Willett, K.M.; Aguilar, E.; Brunet, M.; Caesar, J.; et al. Updated analyses of temperature and precipitation extreme indices since the beginning of the twentieth century: The HadEX2 dataset. J. Geophys. Res. Atmos. 2013, 118, 2098–2118. [Google Scholar] [CrossRef]
- Meehl, G.A.; Tebaldi, C.; Nychka, D. Changes in frost days in simulations of twentyfirst century climate. Clim. Dyn. 2004, 23, 495–511. [Google Scholar] [CrossRef]
- KLIWA, Klimaveränderung und Wasserwirtschaft. Klimawandel in Süddeutschland: Veränderungen von meteorologischen und hydrologischen Kenngrößen. In Klimamonitoring im Rahmen der Kooperation KLIWA; Monitoringbericht 2021; Mainz, Augsburg, Karlsruhe: Offenbach, Germany, 2021. [Google Scholar]
- Kunz, M.; Mohr, S.; Werner, C.P.; Niederschlag, P.W. Klimawandel in Deutschland: Entwicklung, Folgen, Risiken und Perspektiven; Springer: Berlin/Heidelberg, Germany, 2017; pp. 57–66. [Google Scholar]
- Spinoni, J.; Vogt, J.V.; Naumann, G.; Barbosa, P.; Dosio, A. Will drought events become more frequent and severe in Europe? Int. J. Climatol. 2020, 38, 1718–1736. [Google Scholar] [CrossRef]
- Spinoni, J.; Naumann, G.; Vogt, J.; Dosio, A. High-resolution meteorological drought projections for Europe using a single combined indicator. Geophys. Res. Abstr. 2016, 18, EGU2016-12361. [Google Scholar]
- Grillakis, M.G. Increase in severe and extreme soil moisture droughts for Europe under climate change. Sci. Total Environ. 2019, 660, 1245–1255. [Google Scholar] [CrossRef]
- Cook, B.I.; Mankin, J.S.; Marvel, K.; Williams, A.P.; Smerdon, J.E.; Anchukaitis, K.J. Twenty-First Century Drought Projections in the CMIP6 Forcing scenarios. Earth’s Future 2020, 8, e2019EF001461. [Google Scholar] [CrossRef]
- Ruosteenoja, K.; Markkanen, T.; Venäläinen, A.; Räisänen, P.; Peltola, H. Seasonal soil moisture and drought occurrence in Europe in CMIP5 projections for the 21st century. Clim. Dyn. 2017, 50, 1177–1192. [Google Scholar] [CrossRef]
- Helmholtz Climate Initiative. Nehmen Dürre und Starkregen zu? 2022. Available online: https://www.helmholtz-klima.de/faq/nehmen-duerre-und-starkregen-zu (accessed on 17 May 2022).
- Federal Environment Agency. Monitoringbericht 2019: Zur Deutschen Anpassungsstrategie an den Klimawandel; UBA: Bonn, Germany, 2019. [Google Scholar]
- LUBW. Landesanstalt für Umwelt Baden-Württemberg. Weitere Klimaparameter: Klimatische Wasserbilanz. 2022. Available online: https://www.lubw.baden-wuerttemberg.de/klimawandel-und-anpassung/weitere-klimaparameter (accessed on 23 July 2023).
- Bradford, J.B.; Schlaepfer, D.R.; Lauenroth, W.K.; Palmquist, K.A. Robust ecological drought projections for drylands in the 21st century. Glob. Chang. Biol. 2020, 26, 3906–3919. [Google Scholar] [CrossRef] [PubMed]
- Van Vuuren, D.P.; Stehfest, E.; den Elzen, M.G.J.; Kram, T.; van Vliet, J.; Deetman, S.; Isaac, M.; Goldewijk, K.K.; Hof, A.; Beltran, A.M.; et al. RCP2.6: Exploring the possibility to keep global mean temperature increase below 2 °C. Clim. Chang. 2011, 109, 95. [Google Scholar] [CrossRef]
- Watanabe, M.; Suzuki, T.; O’ishi, R.; Komuro, Y.; Watanabe, S.; Emori, S.; Takemura, T.; Chikira, M.; Ogura, T.; Sekiguchi, M.; et al. Improved Climate Simulation by MIROC5: Mean States, Variability, and Climate Sensitivity. J. Clim. 2010, 23, 6312–6335. [Google Scholar] [CrossRef]
- Christian, J.R.; Arora, V.K.; Boer, G.J.; Curry, C.L.; Zahariev, K.; Denman, K.L.; Flato, G.M.; Lee, W.G.; Merryfield, W.J.; Roulet, N.T.; et al. The global carbon cycle in the Canadian Earth system model (CanESM1): Preindustrial control simulation. J. Geophy. Res. (Biogeosci.) 2010, 115, G03014. [Google Scholar] [CrossRef]
- IMAU. Institute for Marine and Atmospheric research Utrecht. 2022. Available online: https://www.projects.science.uu.nl/iceclimate/models/racmo-model.php (accessed on 23 July 2023).
- CLMcom. CLMcom CORDEX Data for Europe (EUR-11) Based on CCLM4-8-17 Model Simulations. 2016. Available online: http://cera-www.dkrz.de/WDCC/ui/Compact.jsp?acronym=CXEU11CLCL (accessed on 23 July 2023).
- Göttel, H. Einfluss der nichthydrostatischen Modellierung und der Niederschlagsverdriftung auf die Ergebnisse regionaler Klimamodellierung. In Berichte zur Erdsystemforschung 60; Hamburg, Germany, 2009. [Google Scholar]
- Christensen, P.; Gillingham, K.; Nordhaus, W. Uncertainty in forecasts of long-run economic growth. Econ. Sci. 2018, 115, 5409–5414. [Google Scholar] [CrossRef] [PubMed]


Disclaimer/Publisher’s Note: The statements, opinions and data contained in all publications are solely those of the individual author(s) and contributor(s) and not of MDPI and/or the editor(s). MDPI and/or the editor(s) disclaim responsibility for any injury to people or property resulting from any ideas, methods, instructions or products referred to in the content. |
© 2023 by the authors. Licensee MDPI, Basel, Switzerland. This article is an open access article distributed under the terms and conditions of the Creative Commons Attribution (CC BY) license (https://creativecommons.org/licenses/by/4.0/).