
Diffuse and Direct UV Index Experimental Values

1
Solar Radiation Group, Departament de Matemàtiques per a l’Economia i l’Empresa, Universitat de València, 46022 València, Spain
2
Solar Radiation Group, Departament de Física de la Terra i Termodinàmica, Universitat de València, 46100 Burjassot, Spain
3
Consiglio Nazionale delle Ricerche, Istituto Scienze dell’Atmosfera e del Clima, 00133 Rome, Italy
*
Author to whom correspondence should be addressed.
Atmosphere 2023, 14(8), 1221; https://doi.org/10.3390/atmos14081221
Submission received: 29 June 2023
/
Revised: 25 July 2023
/
Accepted: 26 July 2023
/
Published: 28 July 2023
(This article belongs to the Special Issue Solar UV Radiation)
Abstract
:In this work, we study the different components of the UV Index, direct, diffuse, and global, for seven years of UV erythemal measurements in a Mediterranean locality at Burjassot AtmoSpheric Station (BASS). The measurements have been taken with three YES-UVB-1 radiometers: one provided with a shadow disk on a Sun tracker; a radiometer to measure the global horizontal radiation; and a Sun-tracking radiometer to measure the direct radiation with an especially designed radiance collimator. It is known that diffuse UV irradiance represents at least 50% of total UV irradiance on a horizontal plane, which means being able to obtain a high UV Index even under shade. Our study aims to establish the relationship between the UV Index at noon and the maximum daily UV erythemal irradiance in the mid-latitude area, as well as the potential erythemal effects of exposure to solar UV radiation on different skin phototypes (skin phototypes I–IV) for both direct and diffuse components.
1. Introduction
The most common effect of overexposure to UV solar radiation is sunburn or erythema, which appears within a few hours after exposure to natural sunlight. The CIE (Commission Internationale de l’Éclairage) adopted in 1998 a standard erythema action spectrum [1], which is recommended for determining UV erythemal radiation (UVER). The UVER is the spectrally integrated weighted solar irradiance at ground level with the spectral erythemal action curve proposed by the CIE. The MED (Minimum Erythemal Dose) is the minimum dose of UVER that produces a noticeable reddening of a specific skin type (phototype) not previously exposed to solar radiation. Following COST Action 713 [2], the European countries have adopted four skin types. The CIE also defined a Standard Erythemal Dose (SED) that corresponds to 100 J/m2 and does not depend on the skin type [1].
The global solar UV Index [3] is a recommendation of the International Commission on Non-Ionizing Radiation Protection (ICNIRP) in collaboration with the WHO (World Health Organization), the WMO (World Meteorological Organization), and the UNEP (United Nations Environment Programme) to forecast and inform the population in a simple way about the UV doses that reach the ground. Specifically, the WMO [4] recommends that the UV Index be quantitatively obtained by multiplying the UVER value (expressed in W/m2) by 40.
The solar radiation is attenuated by absorption and scattering through the atmosphere. The scattered or diffuse radiation is an important part of the total since as much as 50% of the UV irradiance reaching the Earth’s surface comes from the scattering of solar radiation by air molecules and other particles in suspension in the atmosphere [5]. Direct and diffuse components of the incident irradiance in the broadband and in the UVER differ substantially. Considering the UVER range, diffuse radiation is a much larger fraction of the global radiation, and it behaves, in addition, in a more isotropic way. However, the UVER is less sensitive to cloudiness, particularly high clouds [6]. The diffuse component is only about 10% of the total radiation and, as a minimum, 62% of the global UVER under cloudless conditions [7]. The diffuse component provides a significant proportion of human UV exposures, as it is incident from all directions and difficult to reduce with the use of hats, tree shade, and shade structures. Although in the shade or under clouds, the UV dose is reduced compared to direct radiation, lower temperatures and less thermal discomfort could lead to overexposure to UV radiation [8].
We have used in this study a seven-year database (2016–2022) of minute measurements of UV erythemal irradiance with three Yankee UVB-1 radiometers (Yankee Environmental Systems, Turner Falls, MA, USA). One radiometer for the global irradiance, another one for the direct component, and one more for the diffuse one. We have analyzed the hourly and daily measured values. On the one hand, we have ensured the irradiance equality of direct plus diffuse is equal to global for the whole database, thus enabling the retrieval of the diffuse component from the global and direct irradiances for the UVER range. On the other hand, we have calculated the UV Index for global, direct, and diffuse components and compared the UV Index at noon and the daily maximum. To our knowledge, few studies have considered the diffuse UV [8,9], diffuse UVER [5,7,10], diffuse UV Index [7], or direct UV Index. In addition, diffuse UVER is not usually registered with a shadow disk; rather, they measure it with a shadow band [5,7,8,9] or a shadow ring [11], which entails a subsequent correction since it eliminates not only direct irradiance but also part of the diffuse component, or they retrieve diffuse UVER by means of semi-empirical models [10]. Finally, we have studied the accumulated erythemal dose for different phototypes and the standard erythemal dose for both direct and diffuse components.
2. Materials and Methods
Measurements of UVER were taken at Burjassot AtmoSpheric Station (BASS, 39°350” N; 0°250” W, 30 m.a.s.l.) from 1 January 2016 to 31 December 2022. We used three broadband YES UVB-1 radiometers located on the roof of the Faculty of Physics building: the first radiometer measured global horizontal UVER (UVERg); the second radiometer measured direct UVER (UVERb) by using a solar tracker Eppley SMT (The Eppley Laboratory, INC., Newport, Rhode Island) and a 6° FOV (field-of-view) radiance collimator (Figure 1). It was designed by our group [12,13] based on a model of the National Renewable Energy Laboratory [14]. The third radiometer measured diffuse UVER (UVERd) using a shadow disk placed on the Eppley SMT solar tracker. In previous studies, we obtained UVERd by means of a shadow band [5,7], but we showed that there is an excellent correlation between the one-minute sampling rate of diffuse UV with the two shading devices, a shadow band and a shadow disk [15], and the last one permits us to obtain measurements automatically and without correction.
The solar tracker was configured as a complete solar monitoring system with an optional top mounting plate and shading assembly. It does not require a computer or software for setup, and leveling is easily checked using the integrated bubble level on top. The rugged cast aluminum housing has an integrated tripod stand with leveling feet, tie-down bolts, and azimuth adjustment. The radiometer for the measurement of global radiation was calibrated at the INTA (National Institute for Aerospace Technology) [16]. The calibration is a matrix based on a standard indoor measurement of the spectral response of the radiometer and an outdoor comparison with a Brewer MKIII spectroradiometer [5]. The radiometers for the measurements of diffuse and direct radiation were calibrated by comparison with radiometer 1. We also considered a cut-off criterion of zenith angles below 70° based on previous results [5], which ensures an error lower than 10%.
3. Results
3.1. Diffuse and Direct UVER and UV Index
The annual evolution of the UVER monthly values, Figure 2, shows an asymmetry with respect to the maximum of solar radiation in Valencia, which is in June, due to the strong influence of ozone that presents the lowest values in summer and autumn [17]. This behavior of the stratospheric ozone influences UV by displacing the annual maximum to July [18].
The sum of horizontal direct UVER and diffuse UVER (calculated global) is always slightly greater than the measured global (yellow line vs. orange line in Figure 2). In the month of July, there is a maximum peak of diffuse UVER (blue line in Figure 2) that makes the difference between measured and calculated global UVER the maximum. The minimum difference occurs in August and January. We have fitted the monthly mean UVER values as follows:
with a r2 = 0.9990, and the percentage of discrepancy, 2.4%, is within the instrument’s accuracy.
UVERb cos (SZA)+ UVERd = (1.024 ± 0.010) UVERg + (0.5 ± 0.7)
In Equation (2), we represent all the data between 2016 and 2022 with a Solar Zenith Angle lower than 70°:
with a r2 = 0.990, and the percentage of discrepancy, 5.5%, is within the instrument’s accuracy and permits us to calculate a component (direct, diffuse, or global) from the other two.
UVERb cos (SZA) + UVERd = (1.055 ± 0.005) UVERg + (0.9 ± 0.6)
Monthly diffuse UVER values represent 71.3% of global UVER in average, and direct horizontal UVER represents 28.7% of the global erythemal irradiance. Monthly diffuse UVER values vary between 63.3% in June and 82.9% in December. On the contrary, monthly horizontal direct UVER has the maximum in summer (36.6% in June) and the minimum in winter (16.7% in December). The percentage of diffuse is similar to previous studies with a shadow band [5], where the corrected diffuse UVER was 62% for a clearness index, kt, close to 0.8 and 93% for a kt value of 0.2–0.3.
Figure 3 shows the occurrence of UV Index (UVI in %) at solar noon and the maximum daily UVI for the global, diffuse, and direct for the whole period 2016–2022. UVI are grouped into exposure categories according to WHO classification [3].
For both diffuse and direct irradiance, UVI reaches very high values (1.8 and 1.3% for diffuse and 0.5 and 0.4% for direct normal) and more than 27% for UVI global maximum daily and 21% for UVI global at noon, with 0.1% of extreme values. These results have been obtained using the instrumentation shown in Figure 1. For UVI greater than 3, category moderate, WHO recommends protection, and extra protection for UVI greater than 8 [3]. UVI moderate or more is reached in more than 40% of direct normal UVI, 50% of diffuse UVI, and 60% of global UVI. These results suggest that the recommended photoprotection measures should be updated because, for UVI 3, it is recommended to seek shade during the midday hours.
Note that diffuse UV Index is obtained for a horizontal plane, and information on diffuse component is essential for evaluation of irradiance on inclined surfaces, such as the majority of the human body unless sunbathing, but it is a multi-parameter dependence because it depends on geometry and Solar Zenith Angle.
Table 1 shows coincidences or differences in one unit between the UVI at solar noon and the maximum daily for the experimental measurements.
As we have already detected in previous studies, we can consider the UVI at 12 solar noon as representative of the maximum daily value in a high percentage of cases for the global UVI [19] because rounding of the index to a whole number can mean that a 1-unit difference in the UV Index could be the result of a real difference of less than 0.025 W/m2 in UVER. The percentage reaches more than 90% if you consider diffuse or direct components, so we will take the value of 12 solar noon as representative of the daily maximum for global, diffuse, and direct components.
Figure 4 shows the 12 solar noon values of the UVER for global and diffuse during the period 2016–2022, except for the year 2018, where there was less data due to a problem with the instrumentation. A very high global UV Index value is reached on several occasions every year, as is a high diffuse UV Index value.
To estimate the value of the diffuse UV Index at noon versus the global UVI, we have fitted a linear regression, Equation (3).
UVIg = (1.688 ± 0.018) UVId + (0.19 ± 0.06) r2 = 0.81
Despite not obtaining a very high correlation coefficient due to the dispersion of the data, these results allow us to estimate the diffuse UVI from the global UVI. For example, with a global UVI of 10, which is very high, the diffuse UV Index is 6, which is categorized as a high value. The relationship between diffuse and global UVI is similar to that found in Marín (2007) [20], with UVER data obtained with a shadow band for two years (UVIg = 1.7834 UVId).
Figure 5 shows the statistics of the monthly values of global (a) and diffuse UVI (b). In the boxplot, the lower and upper horizontal lines define the 25% and 75% percentiles, and the horizontal line dividing the box defines the median, or 50% percentile. The cross shows the mean value, and the whiskers represent the maximum and minimum values. The maximum monthly value was produced in June and July and corresponded to a UV Index of 8, classified as very high according to the WHO [3]. The diffuse UV Index in June and July was 6, categorized as high. The greatest dispersion between the 25 and 75 percentiles is registered in April and September, coinciding with the months of spring and autumn where there is more cloudiness. Note that for both global and diffuse UVI values of 11, they were reached for a few days in July.
3.2. Diffuse and Direct Erythemal Doses
The daily values of diffuse, direct, and global UVER were used to estimate the cumulative doses over an average year in the period 2016–2022. Dividing by the values corresponding to one SED and one MED, the cumulative annual doses were obtained for phototypes I to IV. Figure 6 shows the cumulative annual doses for diffuse and global UVER.
During an average year, we obtained 8516 SEDs (4258, 3407, 2433, and 1893 MEDS for phototypes I to IV, respectively) for global UVER. The results are similar to those registered by Utrillas et al. [19] in Valencia with a radiometer of the Spanish UVB radiometric network for ten years (2000–2009) (8087 SEDSs, 4044, 3235, 2310, and 1797 MEDS for phototypes I to IV, respectively). These values correspond to continuous and uninterrupted exposure to the sun in a horizontal position throughout the year.
We have obtained 6022 SEDs for diffuse UVER, representing 71% of the annual cumulative standard erythemal dose for global UVER. Regarding the direct component, there are 3829 SEDs on average per year, or 45% of the annual SED for global UVER.
Figure 6 shows a higher slope during the summer months. In summer, we obtained 45, 43, and 48% of annual erythemal doses for global, diffuse, and direct UVER, respectively. If we consider May, June, July, and August, the percentage reaches 59, 56, and 61%, respectively. Three-quarters of the annual doses occur during the spring and summer seasons. The results for global UVER are in the same order [19].
Figure 7 shows the erythemal dose differences in two consecutive months, since the first point in the plot shows the increase between February and January. There is an increase in the number of doses until the month of July, because the maximum of UVER occurs in July, and in the second half of the year there is a decrease in each month with respect to the previous one. The greatest increase occurs in May (the monthly mean value of the global UVI at solar noon goes from 5 to 7, and the diffuse UVI from 3 to 4; see Figure 5). The greatest decrease occurs in September, with a decrease of 2 units of global UVI from 7 to 5, and in autumn for diffuse UVI, with a decrease of 1 unit of UVI in September, October, and November (Figure 5). These data should be considered to send messages of photoprotection to the population since, in May, the monthly mean UVI increased from moderate to high [3].
Figure 8 is a box diagram representing the month statistics for the ratio between the cumulative daily SED for global and diffuse UVER. In the boxes, the lower and upper horizontal lines define the 25% and 75% percentiles, and the horizontal line dividing the box defines the median, or 50% percentile. The cross shows the mean value, and the whiskers represent the maximum and minimum values. The annual evolution shows a minimum value in summer and a maximum in winter, when the highest diffuse irradiance is registered. The greatest dispersion of data is registered in April–May and in September–October, coinciding with the months of spring and autumn where there is more cloudiness. The maximum median value is registered in December (93%), and the minimum in June (60%).
4. Discussion
A one-minute sampling rate of UV erythemal irradiance has been registered for global, diffuse with a shadow disk, and normal direct with a collimator, both placed on a solar tracker, for seven years, from 2016 to 2022.
We have compared the sum of horizontal direct and diffuse with the global UVER irradiance (one-minute sampling rate), and the percentage of discrepancy, 5.5%, is within the instrument’s accuracy. This value could be reduced by making the shadow disk area equal to the aperture of the collimator.
The UVI at solar noon is representative of the maximum daily UVI for the global, diffuse, and direct, with 90% of coincidences or discrepancies in one unit of UV Index.
The occurrence of the global UV Index at noon shows a value of low (1–2), moderate (3–5), high (6–7), and very high (8–10) in 34%, 28%, 17%, and 21%, respectively (Figure 3). A previous study showed 29, 30, 23, and 18%, respectively, for 2000–2009 in Valencia [19]. Satellite measurements seem to overestimate the UV Index if we compare our results with the local noon UV Index obtained from the Ozone Monitoring Instrument (OMI), on board NASA’s Aura satellite, for the period 2005–2013 in Valencia: 18, 32, 18, and 30% for low (1–2), moderate (3–5), high (6–7), and very high (8–10), and 2% for extreme (≥11) ([21] Table 6). The UV Index of moderate, high, or very high (three or more) is reached in more than 40% of cases of direct UVER and more than 50% of cases of diffuse UVER.
The maximum monthly value is produced in June and July and corresponds to a UV Index of 8, as expected for a coastal site in Spain [19]. The diffuse UV Index in June and July is 6, the same value found by the authors in a previous study with shadow bands [5]. Some extreme value is reached in both (UVI ≥ 11). These values are worrisome if adequate photoprotection measures are not taken. With a UVI of 10 and just 30 min of exposure, 54% of the population with phototype I suffers first-degree burns, and 27% with phototype II. With a UVI of 6, the percentage is similar with 50 min of exposure (53% phototype I and 21% phototype II) [22].
The mean daily erythemal dose for global UVER is 2333 J/m2. This value is on the order of 2000 J/m2 of that obtained for Novi Sad (Serbia) (45°33” N, 19°85” E, 84 m.a.s.l) in the period 2004–2012 [23]. These results, with 17% more erythemal dose than in BASS (39°350” N; 0°250” W, 30 m.a.s.l.), agree with Marín et al. [24], who show a latitudinal dependence (at sea level) of 3–4% per degree, with obviously more irradiance the closer to the Equator. The mean daily erythemal dose for diffuse UVER is 1650 J/m2, or 71% of the global daily dose, and for normal direct UVER, it is 1049 J/m2, or 45% of the global daily dose. Note that horizontal direct UVER dose is calculated as normal direct UVER dose multiplied by the cosinus of the Solar Zenith Angle, thus being less than normal direct.
Diffuse UVER in Valencia varied between 62% for a kt close to 0.8, i.e., for very clear sky conditions, and 93% for a kt value of 0.2–0.3 for very cloudy sky conditions, being kt the clearness index [5]. This must be considered because seeking shade, a photoprotection measure recommended by the WHO for UVIs of 3 (categorized moderate) or more, only protects you from direct irradiance, and even under a beach umbrella, at least 34% of the incident horizontal irradiance is not intercepted by it [25].
In conclusion, we think the UV Index for UVER global is not enough to protect the population from damage from solar UV radiation. It is necessary to implement information on diffuse UV Index.
Author Contributions
Conceptualization, M.J.M. and M.P.U.; Methodology, M.J.M. and V.E.; Validation, V.E. and J.L.G.-A.; Formal analysis, M.J.M., V.E. and J.L.G.-A.; Investigation, M.J.M.; Data curation, V.E. and M.P.U.; Writing—original draft, M.J.M.; Writing—review & editing, M.J.M. and M.P.U.; Project administration, M.J.M. and M.P.U.; Funding acquisition, V.E., J.L.G.-A. and M.P.U. All authors have read and agreed to the published version of the manuscript.
Funding
This work was financed jointly by the Spanish Ministry of Economy and Competitiveness (MINECO) and the European Regional Development Fund (FEDER) through projects RTI2018-096548-B-I00, PID2021-123881OB-I00, TED2021-129185BI00, and PID2022-138730OB-I00, and by the Valencia Autonomous Government through project AICO/2021/341.
Institutional Review Board Statement
Not applicable.
Informed Consent Statement
Not applicable.
Data Availability Statement
Not applicable.
Conflicts of Interest
The authors declare no conflict of interest.
References
- ISO 17166:1999/CIE S007-1998; Erythema Reference Action Spectrum and Standard Erythema Dose. CIE: Vienna, Austria, 1998. Available online: https://doi.org/10.1002/(SICI)1520-6378(199904)24:2<158::AID-COL11>3.0.CO;2-4 (accessed on 28 June 2023).
- Vanicek, K.; Frei, T.; Litynska, Z.; Schmalwieser, A. UV-Index for the Public. COST-713 Action (UV-B Forecasting); Office for Official Publications of the European Communities: Luxembourg, 2000; p. 27. Available online: https://op.europa.eu/en/publication-detail/-/publication/ed2d6032-860f-4237-bb16-c34a7daceb17 (accessed on 1 June 2023).
- World Health Organization (WHO); World Meteorological Organization (WMO); United Nations Environment Programme (UNEP); International Commission on Non-Ionizing Radiation Protection (ICNIRP). Global Solar UV Index: A Practical Guide; Watch No. 95, WMO/TD No. 625; World Health Organization: Geneva, Switzerland, 2002; p. 28. Available online: https://apps.who.int/iris/handle/10665/42459 (accessed on 1 June 2023).
- WMO. Report of the WMO–WHO Meeting of Experts on Standardization of UV Indices and Their Dissemination to the Public, WMO/TD-No. 921; Global Atmosphere Watch No. 127; WMO: Les Diablerets, Switzerland, 1998. Available online: https://library.wmo.int/index.php?lvl=notice_display&id=11059 (accessed on 1 June 2023).
- Utrillas, M.P.; Marín, M.J.; Esteve, A.R.; Tena, F.; Cañada, J.; Estellés, V.; Martínez-Lozano, J.A. Diffuse UV erythemal radiation experimental values. J. Geophys. Res. 2007, 112, D24207. [Google Scholar] [CrossRef] [Green Version]
- Esteve, A.R.; Marín, M.J.; Tena, F.; Utrillas, M.P.; Martínez-Lozano, J.A. The influence of cloudiness over the values of erythemal radiation in Valencia, Spain. Int. J. Climatol. 2009, 29, 2171–2182. [Google Scholar] [CrossRef]
- Utrillas, M.P.; Marín, M.J.; Esteve, A.R.; Estellés, V.; Tena, F.; Cañada, J.; Martínez-Lozano, J.A. Diffuse Ultraviolet Erythemal Irradiance on Inclined Planes: A Comparison of Experimental and Modeled Data. Photochem. Photobiol. 2009, 85, 1245–1253. [Google Scholar] [CrossRef]
- Parisi, A.V.; Sabburg, J.; Kimlin, M.G. Diffuse Ambient Solar UV. In Scattered and Filtered Solar UV Measurements. Advances in Global Change Research; Springer: Dordrecht, The Netherlands, 2004; Volume 17, pp. 27–51. [Google Scholar] [CrossRef]
- Parisi, A.V.; Green, A.; Kimlin, M.G. Diffuse Solar UV Radiation and Implications for Preventing Human Eye Damage. Photochem. Photobiol. 2001, 73, 135–139. [Google Scholar] [CrossRef]
- Silva, A.A. The diffuse component of erythemal ultraviolet radiation. Photochem. Photobiol. Sci. 2015, 14, 1941–1951. [Google Scholar] [CrossRef] [PubMed]
- Scaglione, D.; Giulietti, D.; Morelli, M. Evaluation of the impact of atmospheric ozone and aerosols on the horizontal global/diffuse UV Index at Livorno (Italy). J. Atmos. Sol. Terr. Phys. 2016, 146, 194–204. [Google Scholar] [CrossRef]
- Martínez-Lozano, J.A.; Utrillas, M.P.; Tena, F.; Pedros, R.; Cañada, J.; Boscá, J.V.; Lorente, J. Aerosol optical characteristics from a summer campaign in an urban coastal Mediterranean area. IEEE Trans. Geosci. Remote Sens. 2001, 39, 1573–1585. [Google Scholar] [CrossRef]
- Utrillas, M.P.; Cañada, J.; Tamayo, J.; Martínez-Lozano, J.A. Column-integrated aerosol optical properties in the free troposphere. Case study: Sierra Nevada, Spain. IEEE Trans. Geosci. Remote Sens. 2004, 42, 2268–2276. [Google Scholar] [CrossRef]
- Cannon, T.W. Spectral solar irradiance instrumentation and measurement techniques. Sol. Cells 1986, 18, 231–241. [Google Scholar] [CrossRef]
- Utrillas, M.P.; Pedrós, R.; Gandía, S.; Gómez-Amo, J.L.; Estellés, V.; Martínez-Lozano, J.A. Measurements of integrated direct, diffuse and global ultraviolet-B radiation. Energy 2015, 93, 1658–1662. [Google Scholar] [CrossRef]
- Vilaplana, J.M.; Cachorro, V.E.; Sorribas, M.; Luccini, E.; de Frutos, A.M.; Berjon, A.; de la Morena, B. Modified calibration procedures for a Yankee environmental system UVB-1 biometer based on spectral measurements with a Brewer spectrophotometer. Photochem. Photobiol. 2006, 82, 508–514. [Google Scholar] [CrossRef] [PubMed]
- Esteve, A.R.; Martínez-Lozano, J.A.; Marín, M.J.; Estellés, V.; Tena, F.; Utrillas, M.P. Influence of the ozone and the aerosols over experimental values of UV erythemal radiation a ground level, at Valencia. Int. J. Climatol. 2009, 29, 2171–2182. [Google Scholar] [CrossRef]
- Martínez-Lozano, J.A.; Utrillas, M.P.; Núnez, J.A.; Esteve, A.R.; Gómez-Amo, J.L.; Estellés, V.; Pedrós, R. Measurement and analysis of broadband UVB solar radiation in Spain. Photochem. Photobiol. 2012, 88, 1489–1496. [Google Scholar] [CrossRef] [PubMed] [Green Version]
- Utrillas, M.P.; Marín, M.J.; Esteve, A.R.; Estellés, V.; Gandía, S.; Núnez, J.A.; Martínez-Lozano, J.A. Ten years of measured UV Index from the Spanish UVB Radiometric Network. J. Photochem. Photobiol. B 2013, 125, 1–7. [Google Scholar] [CrossRef] [PubMed]
- Marín, M.J. Estudio de la Irradiancia Solar Ultravioleta B y Eritemática en la Comunidad Valenciana. Ph.D. Thesis, Universitat de València, València, Spain, 16 February 2007. (In Spanish). Available online: https://www.educacion.gob.es/teseo/mostrarRef.do?ref=410925 (accessed on 28 June 2023).
- Marchetti, F.; Esteve, A.R.; Siani, A.M.; Martínez-Lozano, J.A.; Utrillas, M.P. Validación de los datos de radiación solar UV del Ozone Monitoring Instrument (OMI) a partir de medidas con base en tierra en la costa mediterránea. Rev. Teledetec. 2016, 47, 13–22. (In Spanish) [Google Scholar] [CrossRef] [Green Version]
- Sánchez-Pérez, J.F.; Vicente-Agullo, D.; Barberá, M.; Castro-Rodríguez, E.; Cánovas, M. Relationship between ultraviolet index (UVI) and first-, second-and third-degree sunburn using the Probit methodology. Sci. Rep. 2019, 9, 733. [Google Scholar] [CrossRef] [PubMed] [Green Version]
- Malinović-Milićević, S.; Mihailović, A.; Mihailović, D.T. Kolmogorov Complexity Analysis and Prediction Horizon of the Daily Erythemal Dose Time Series. Atmosphere 2022, 13, 746. [Google Scholar] [CrossRef]
- Marín, M.J.; Sola, Y.; Tena, F.; Utrillas, M.P.; Campmany, E.; de Cabo, X.; Lorente, J.; Martínez-Lozano, J.A. The UV index on the Spanish Mediterranean coast. Photochem. Photobiol. 2005, 81, 659–665. [Google Scholar] [CrossRef] [PubMed]
- Utrillas, M.P.; Martínez-Lozano, J.A.; Núñez, M. Ultraviolet Radiation Protection by a Beach Umbrella. Photochem. Photobiol. 2010, 86, 449–456. [Google Scholar] [CrossRef]
Figure 1.
YES-UVB-1 radiometers with collimator (left) and shadow disk (center) on the solar tracker Eppley SMT.
Figure 1.
YES-UVB-1 radiometers with collimator (left) and shadow disk (center) on the solar tracker Eppley SMT.
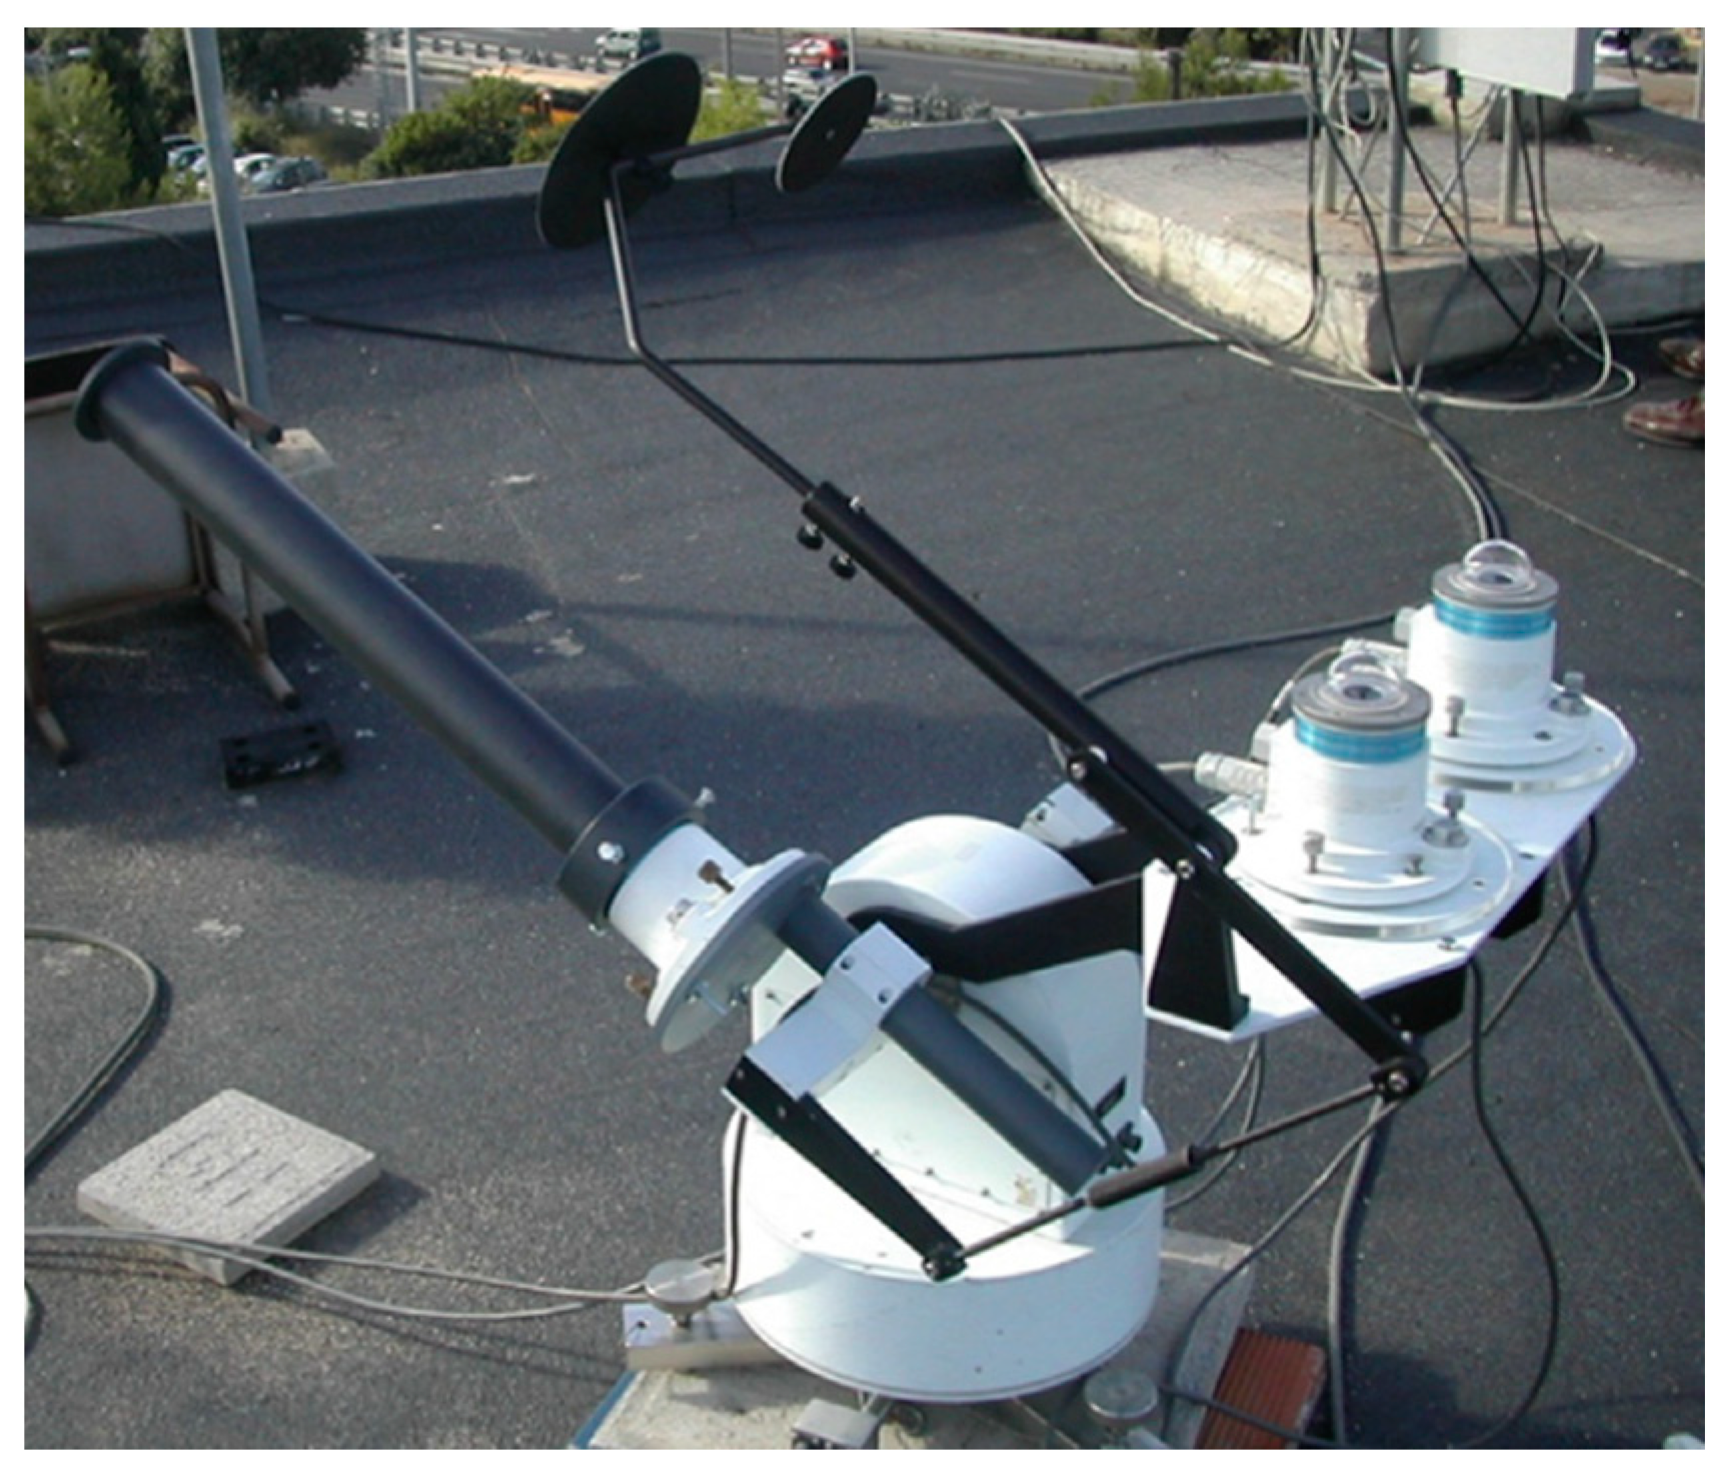
Figure 2.
Monthly mean UVER values (period 2016–2022).

Figure 3.
Recurrence of UV Index at solar noon and the maximum daily UVI for the global, diffuse, or direct components.
Figure 3.
Recurrence of UV Index at solar noon and the maximum daily UVI for the global, diffuse, or direct components.
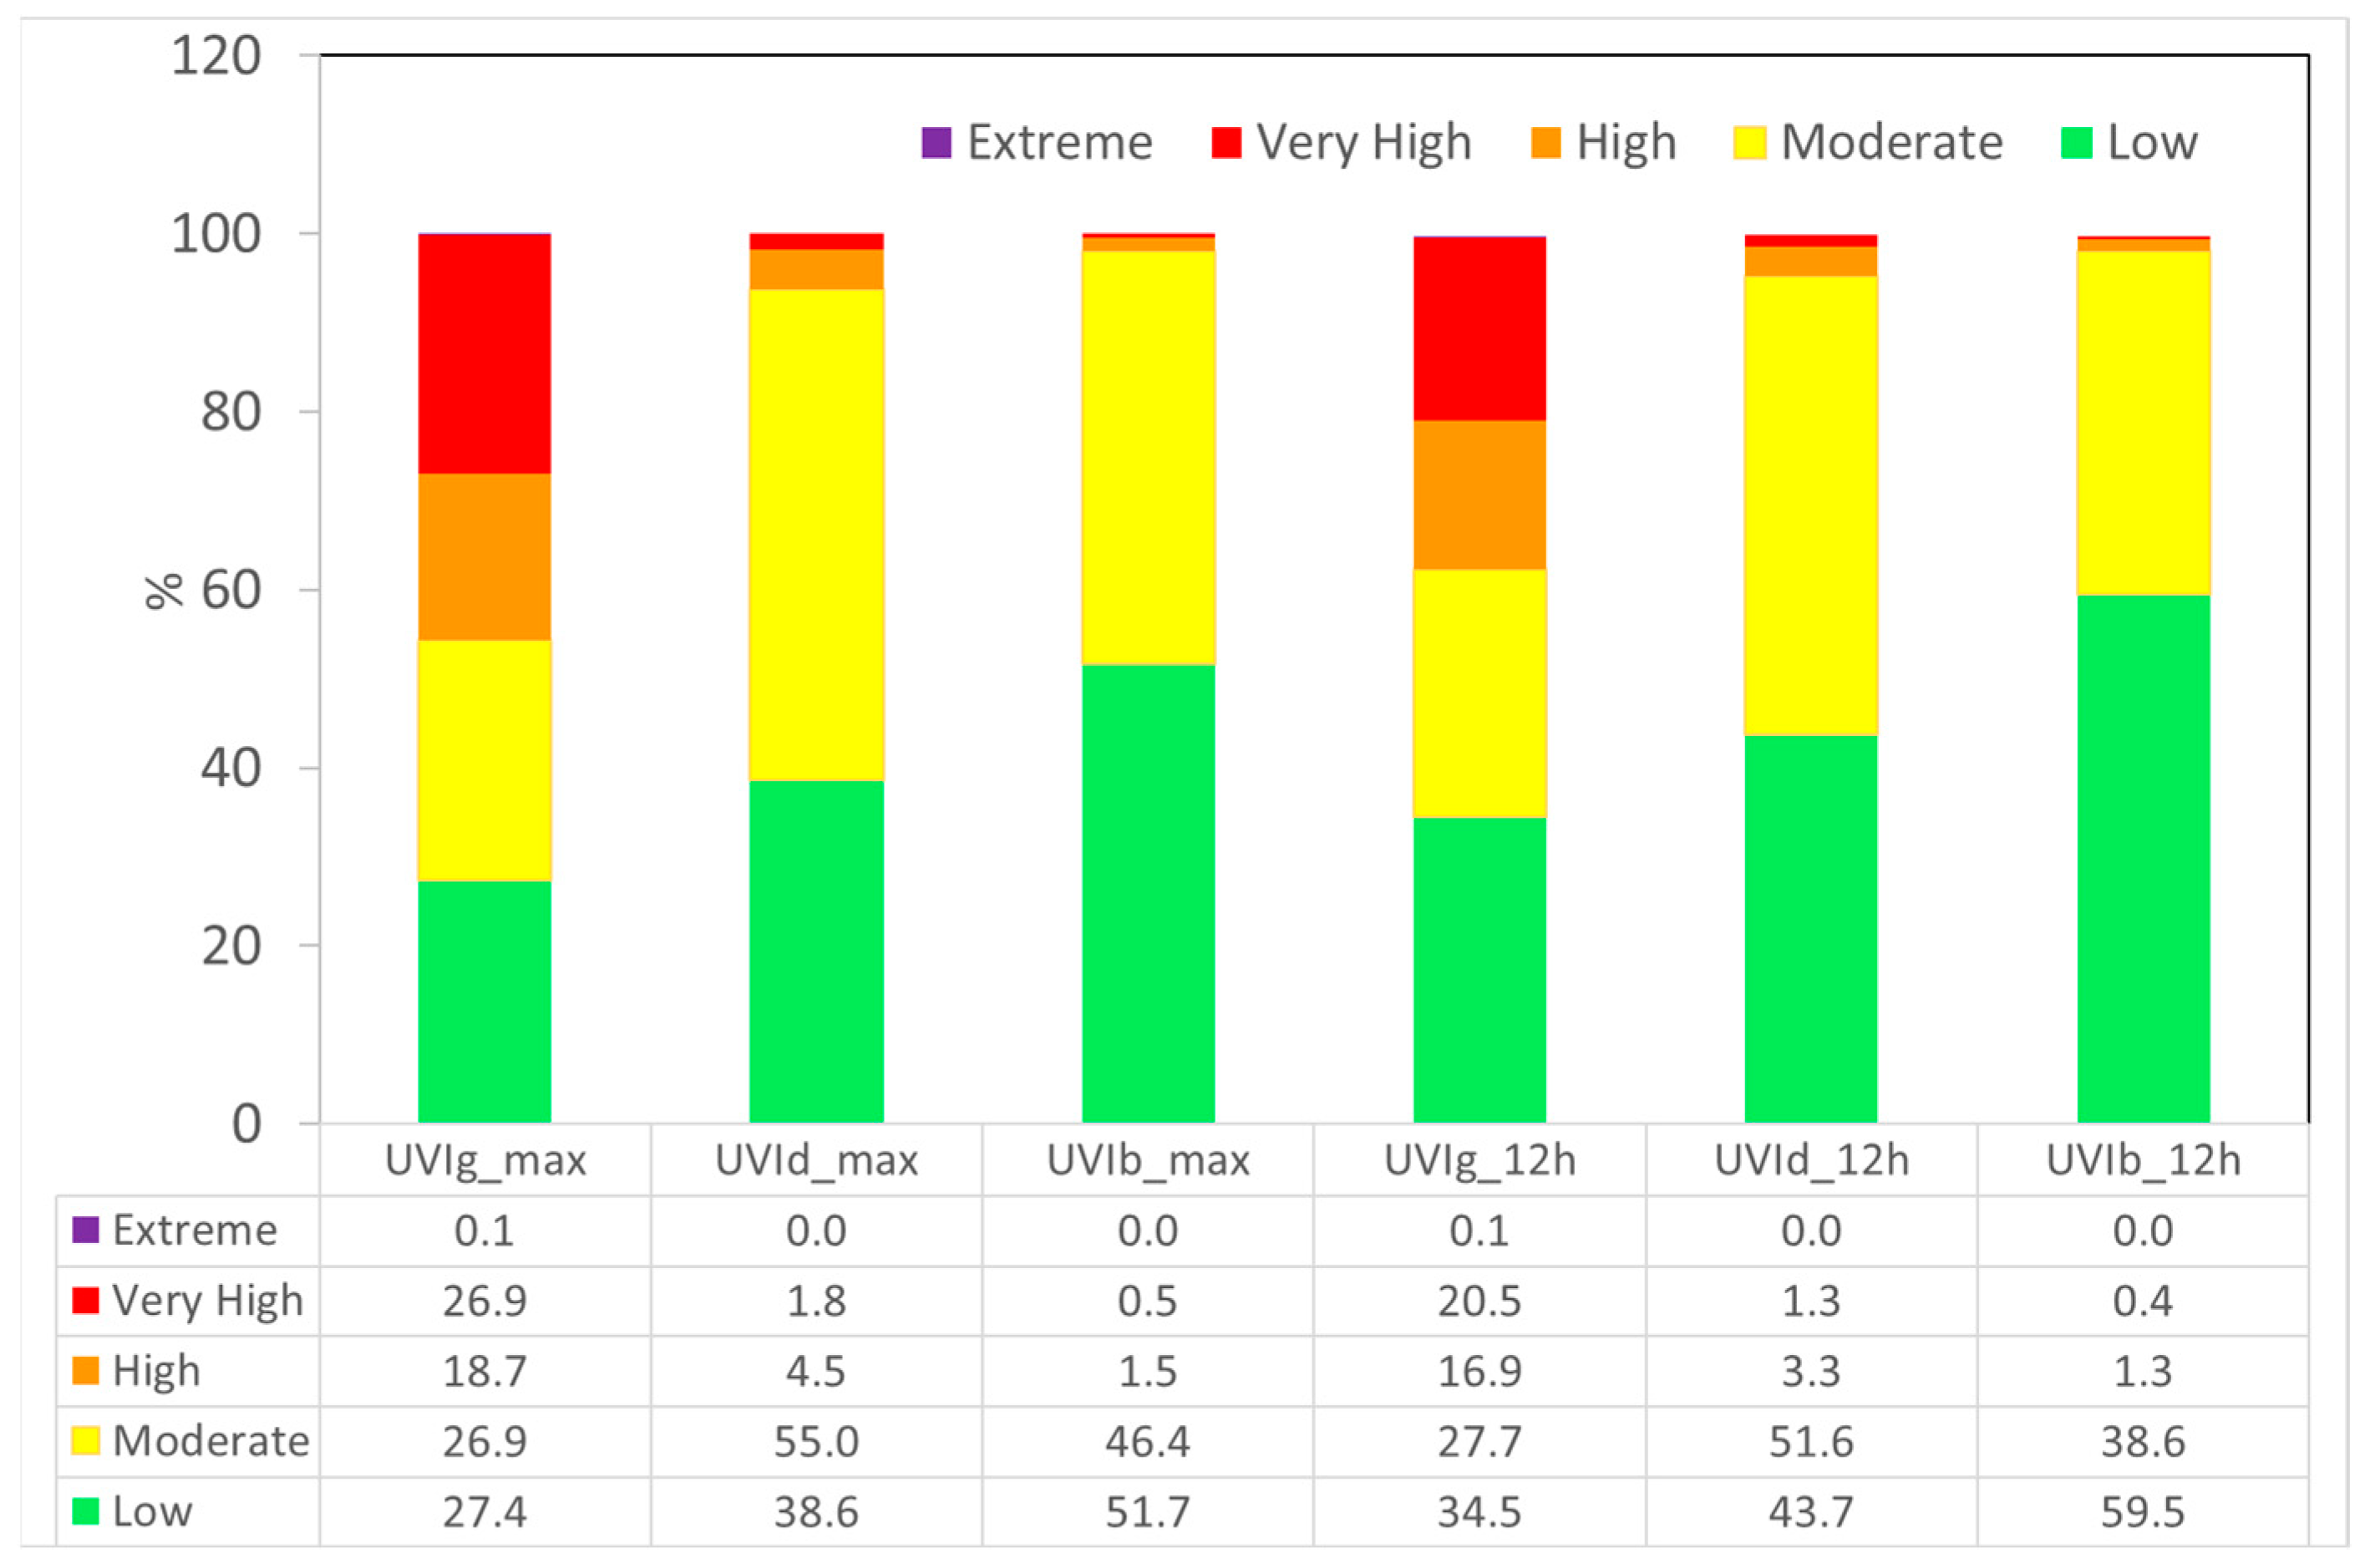
Figure 4.
Daily global and diffuse UVER (mW/m2) at noon.
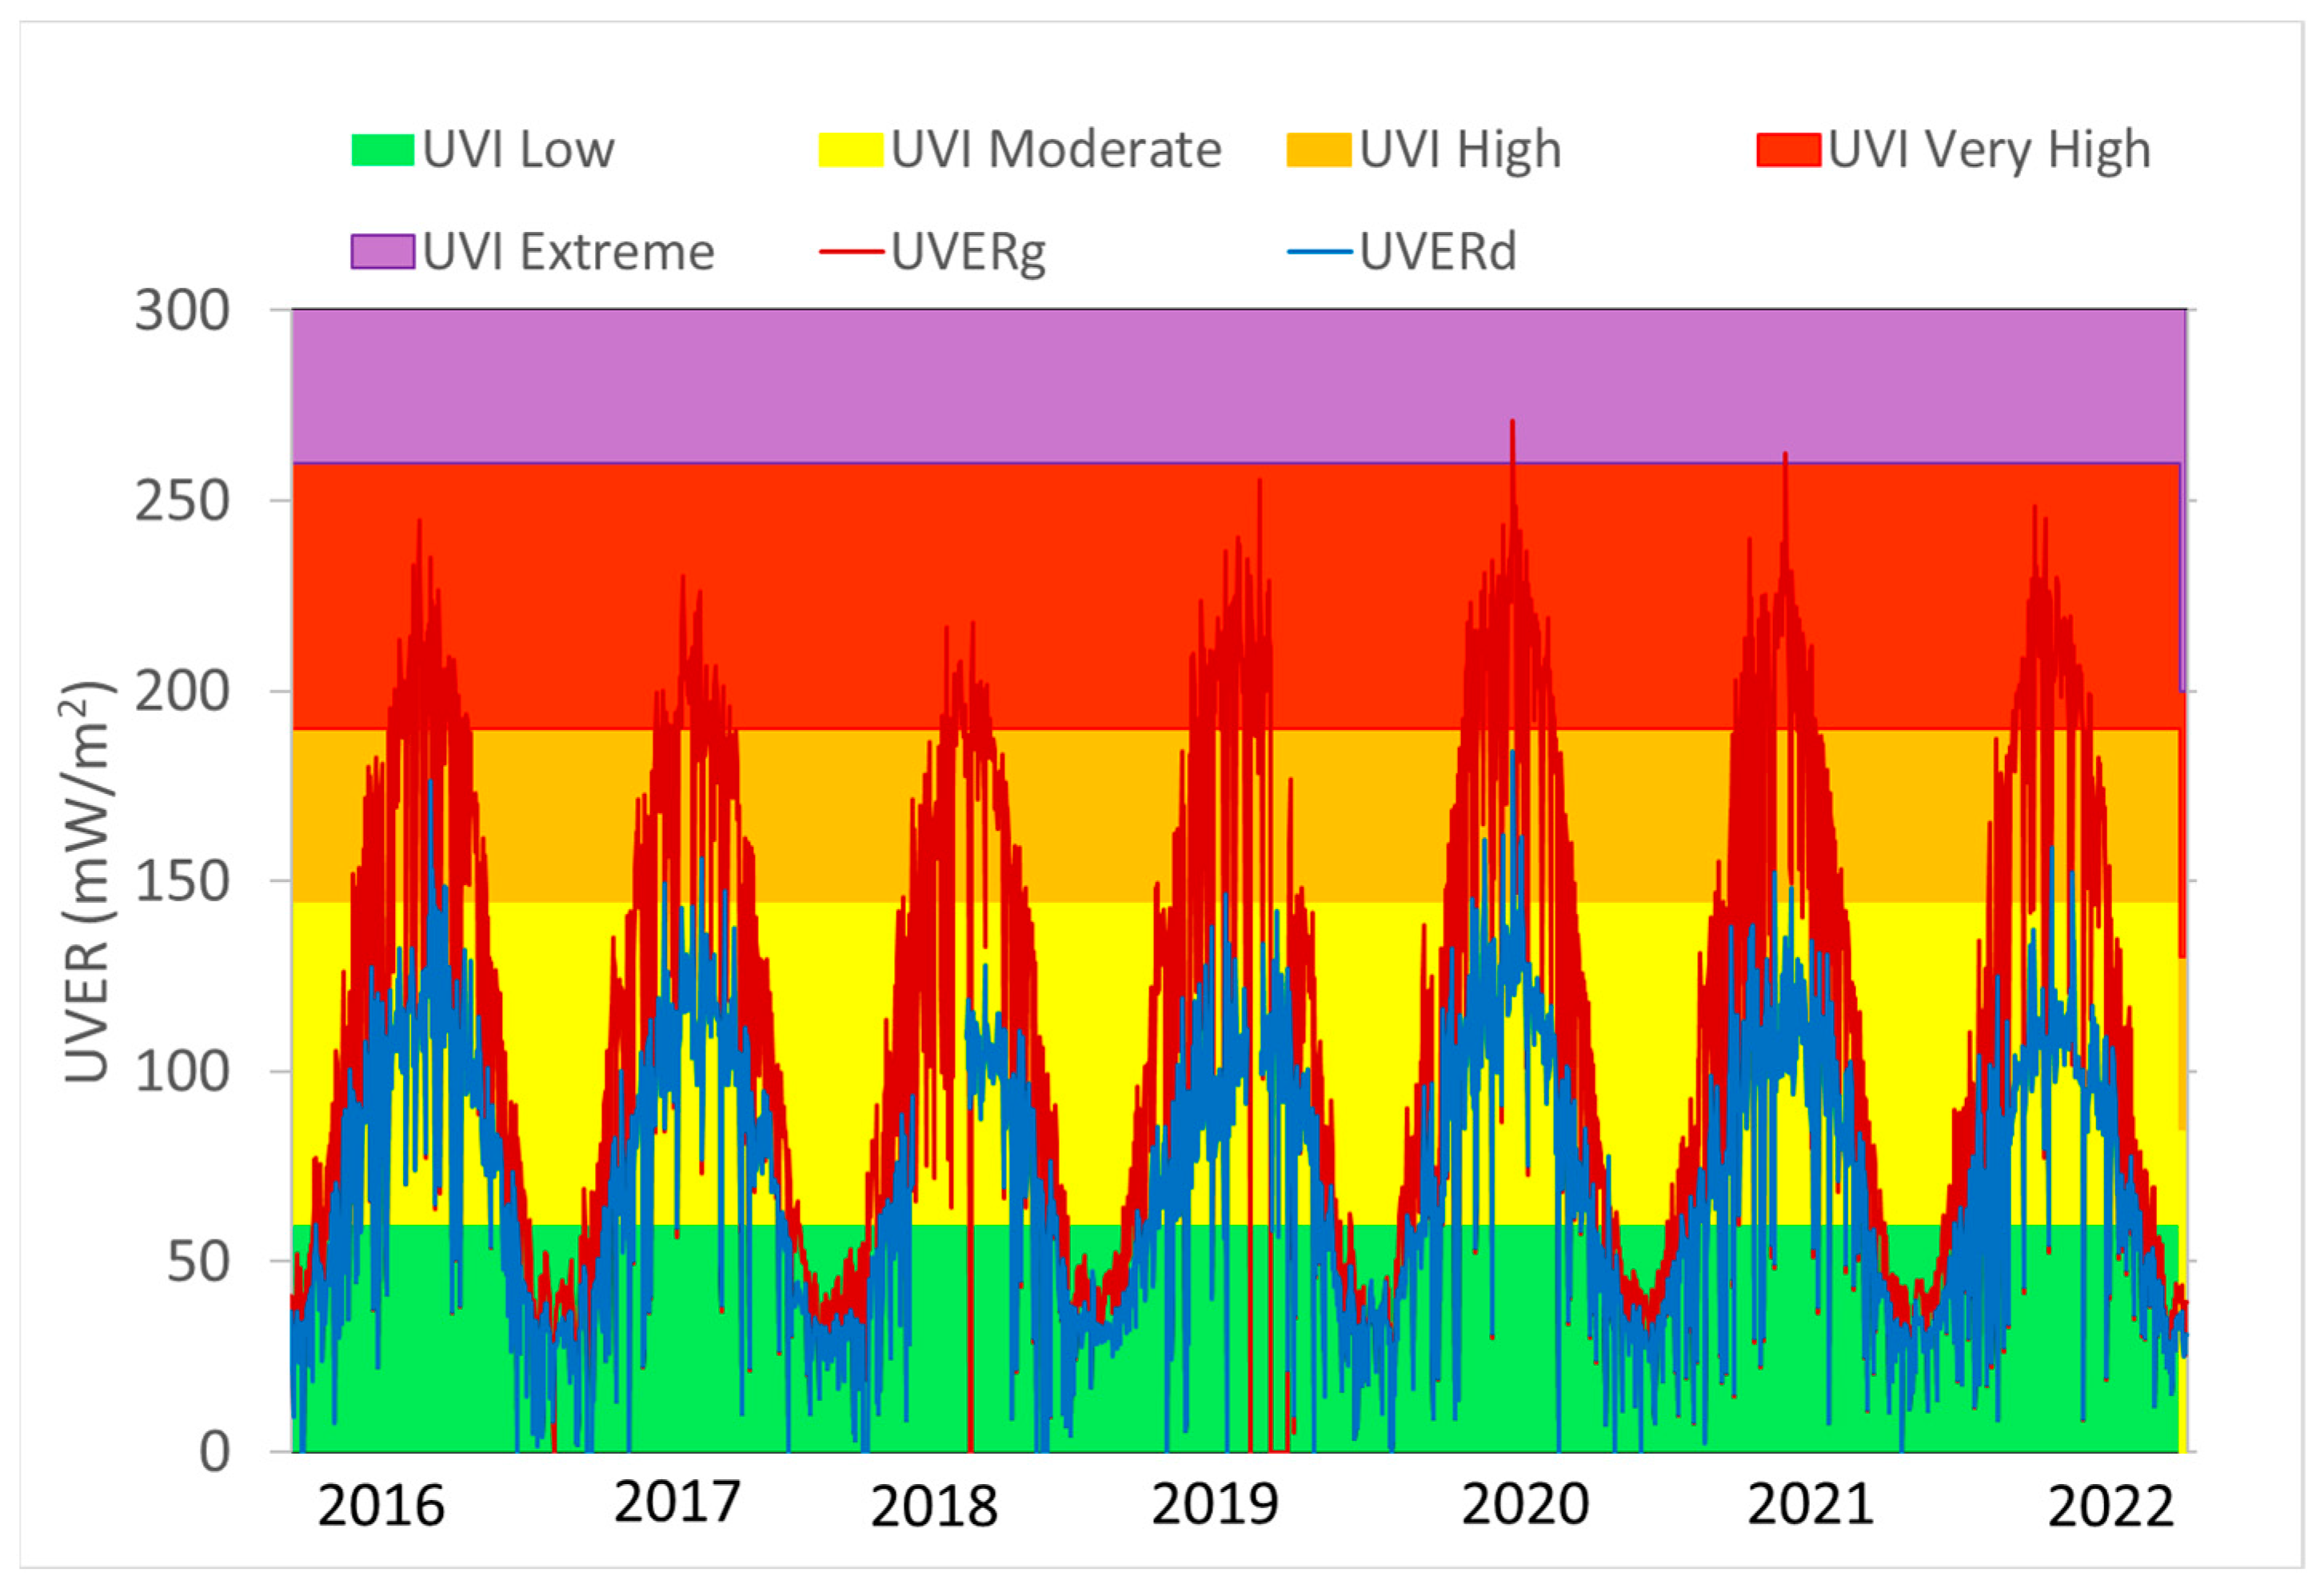
Figure 5.
Monthly UVI index at solar noon for global (a) and diffuse (b).
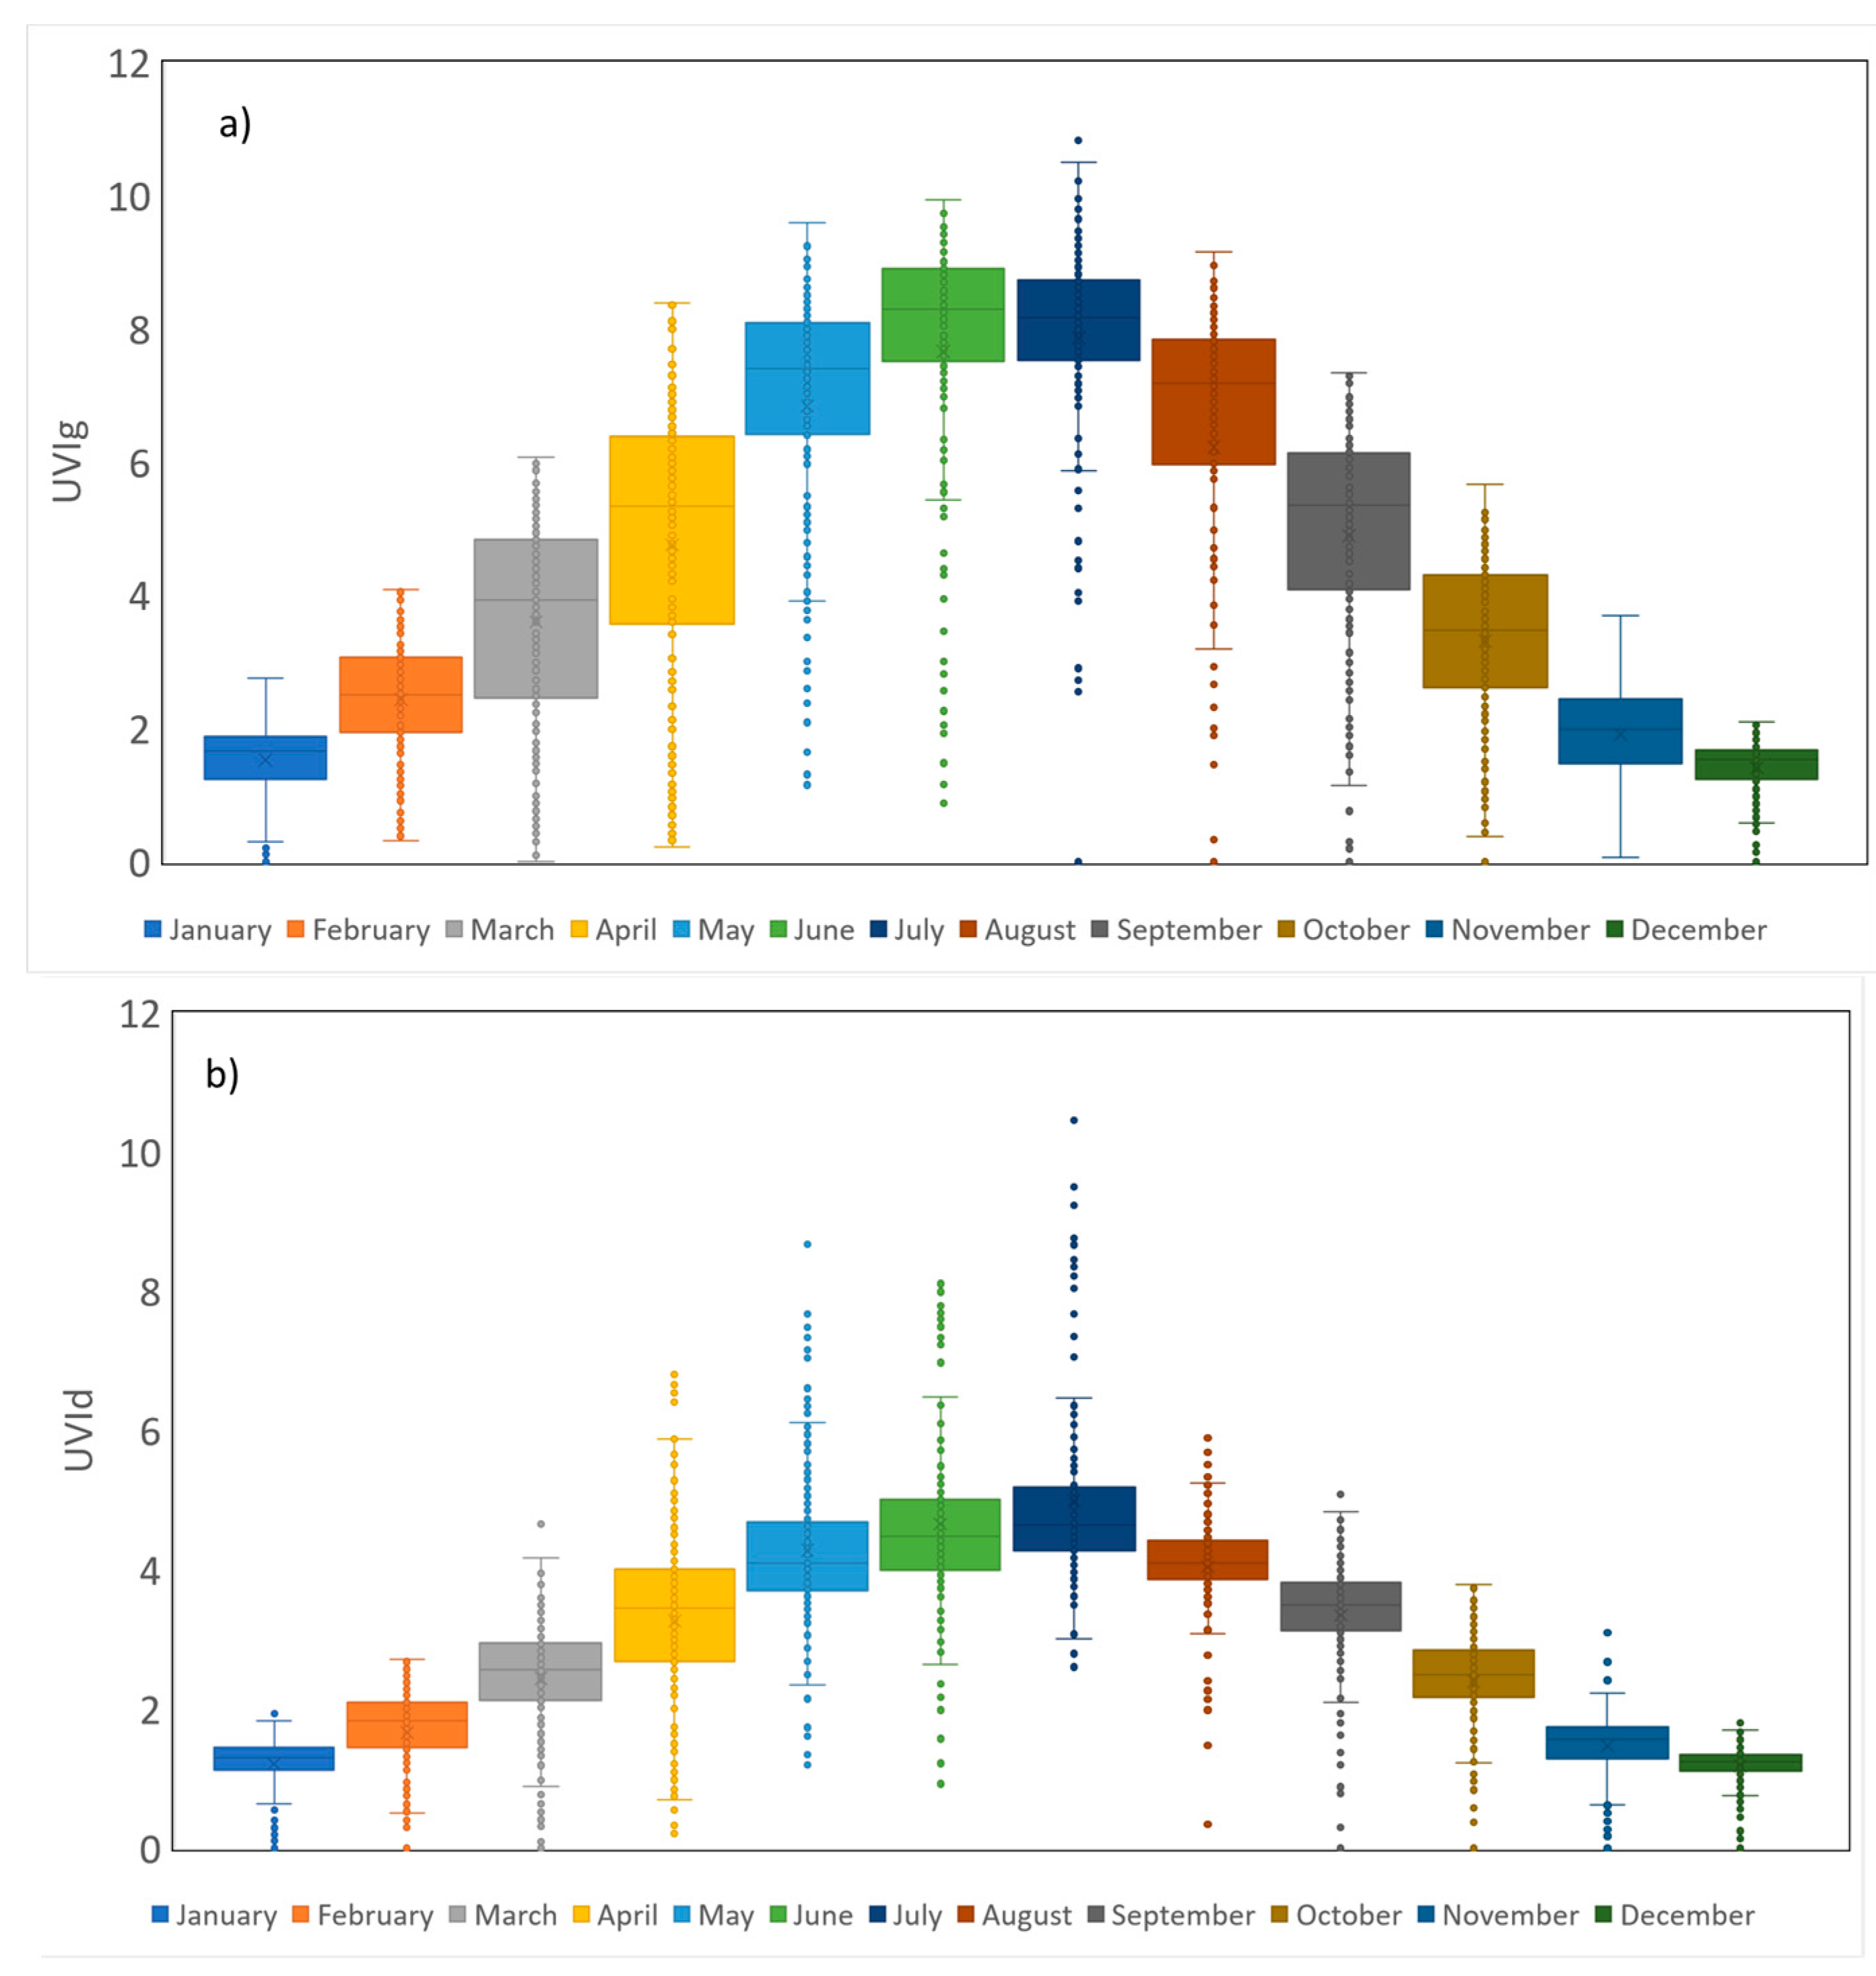
Figure 6.
Annual cumulative SED and MED for phototypes I to IV in a horizontal plane. Period 2016–2022.
Figure 6.
Annual cumulative SED and MED for phototypes I to IV in a horizontal plane. Period 2016–2022.
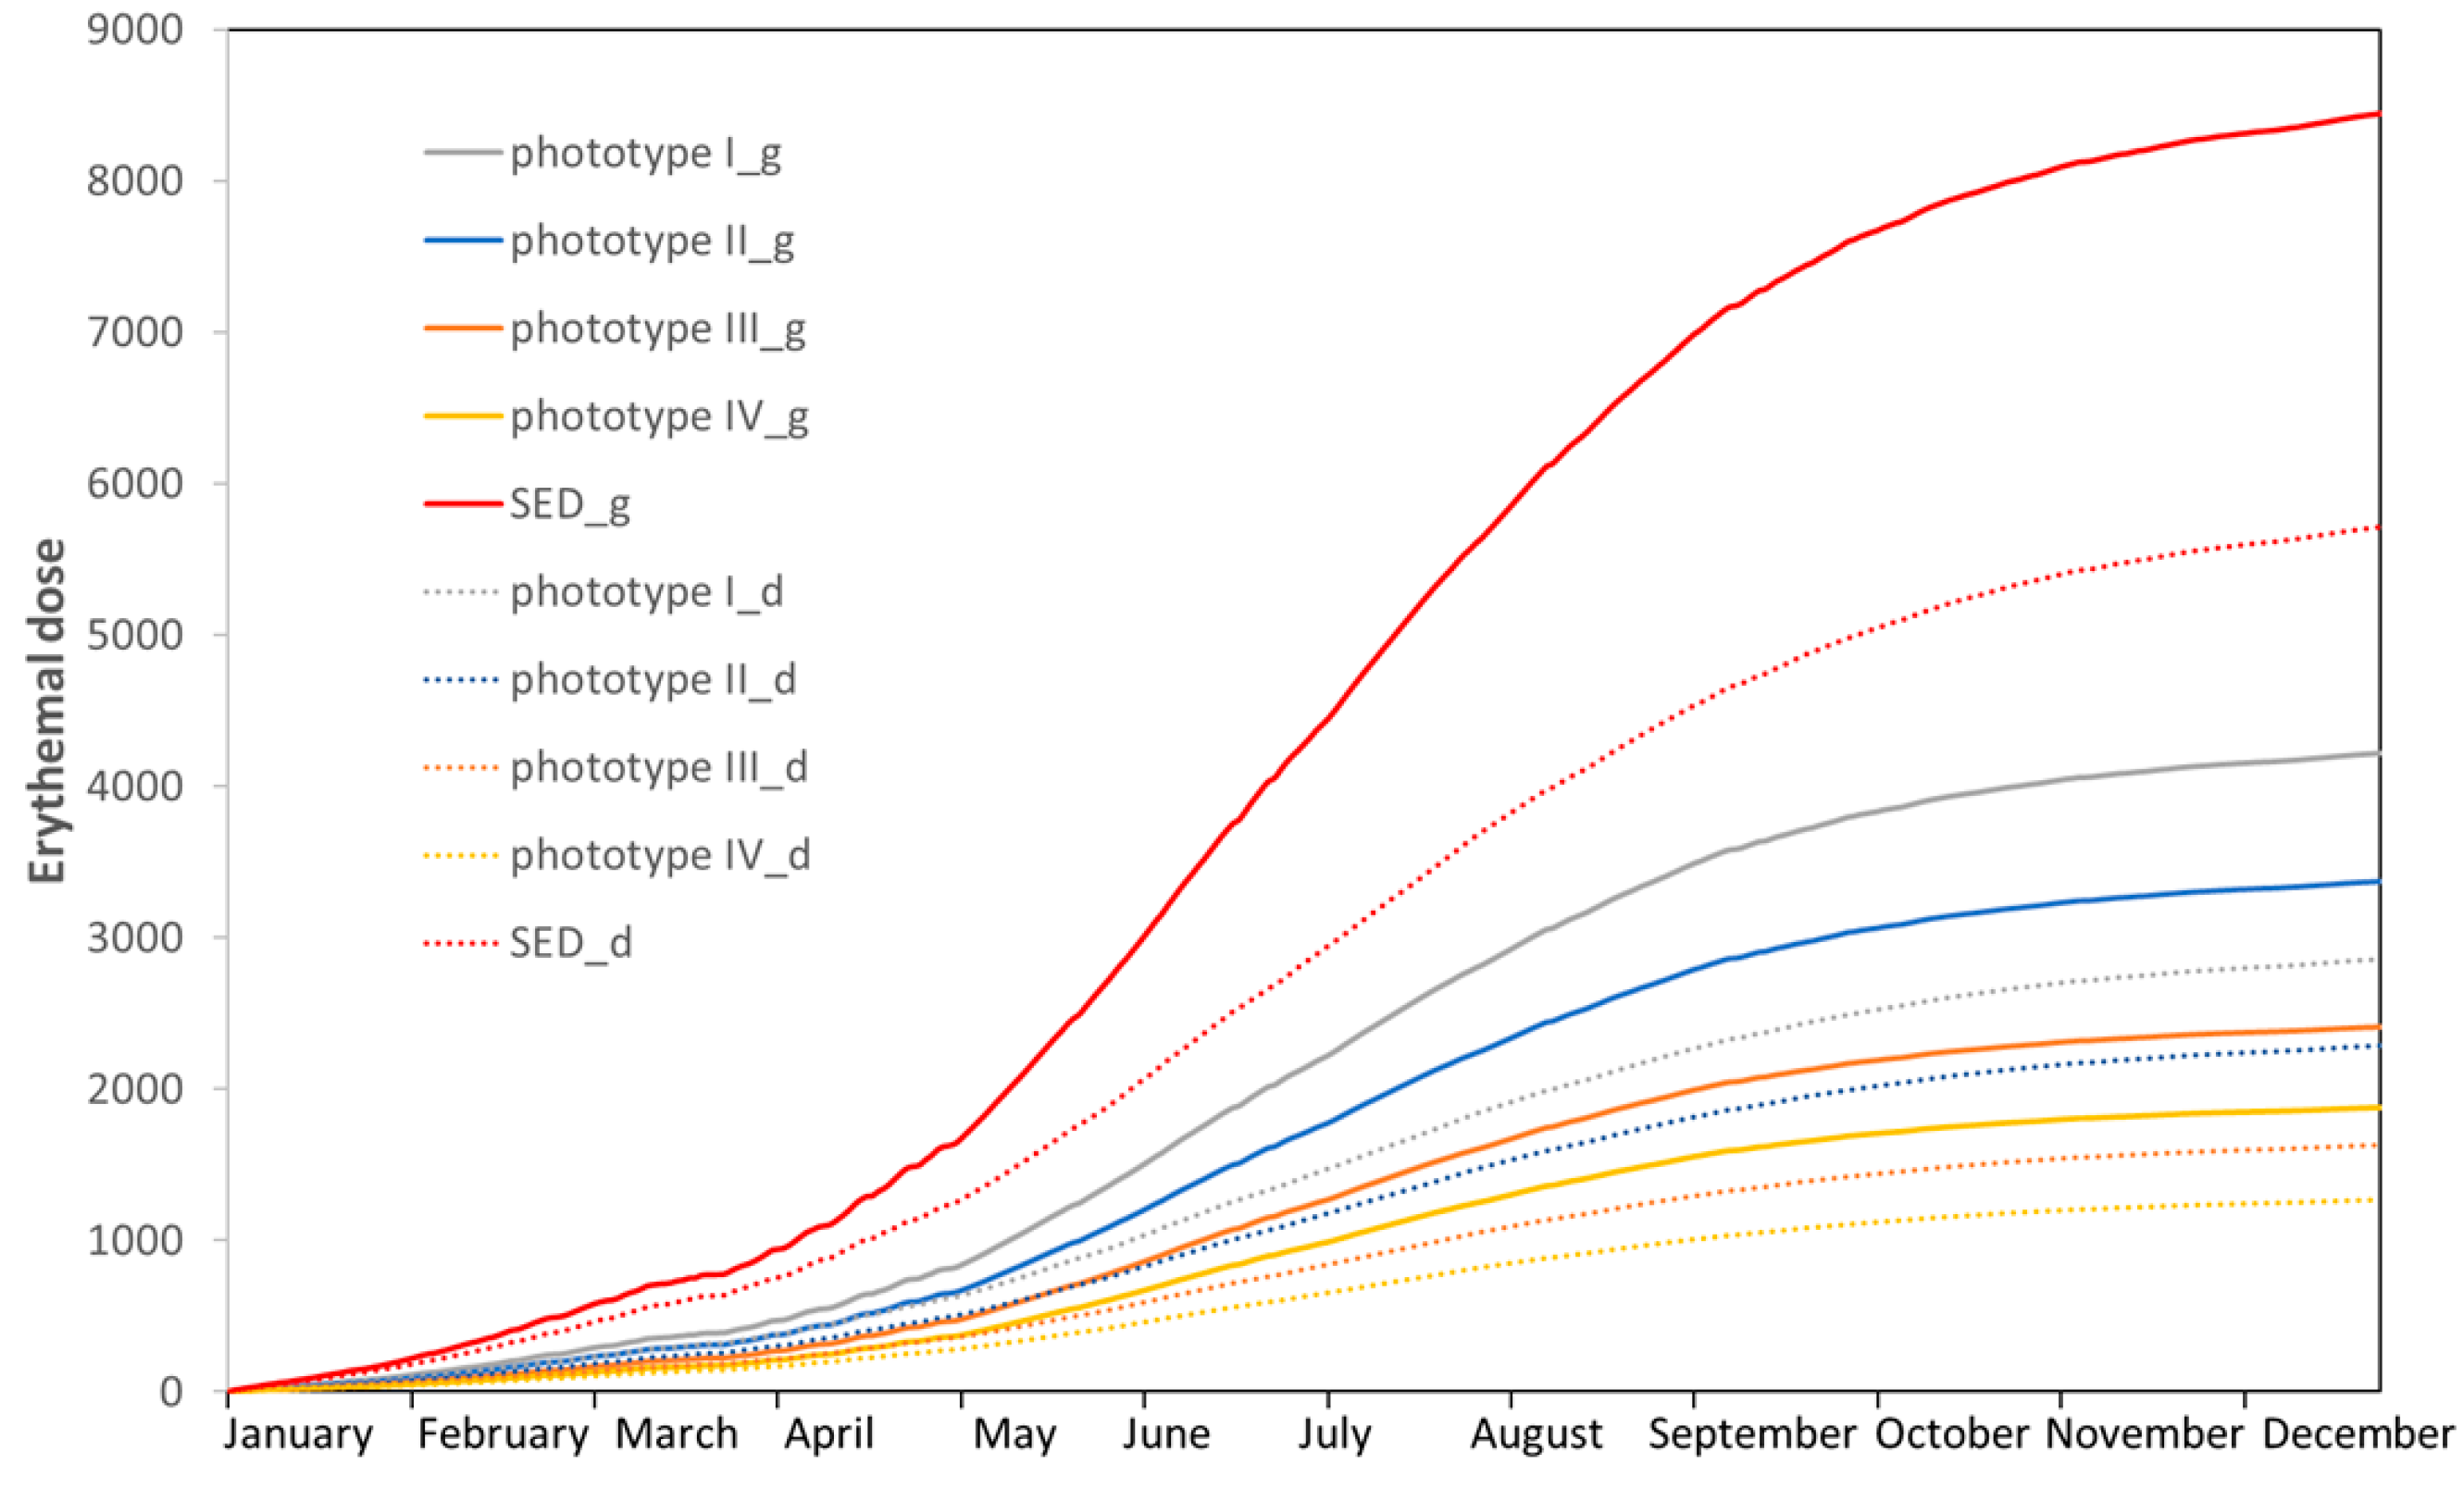
Figure 7.
SEDs are differences between months (the first point is the difference between February and January) in an average year (2016–2022) and in a horizontal plane.
Figure 7.
SEDs are differences between months (the first point is the difference between February and January) in an average year (2016–2022) and in a horizontal plane.
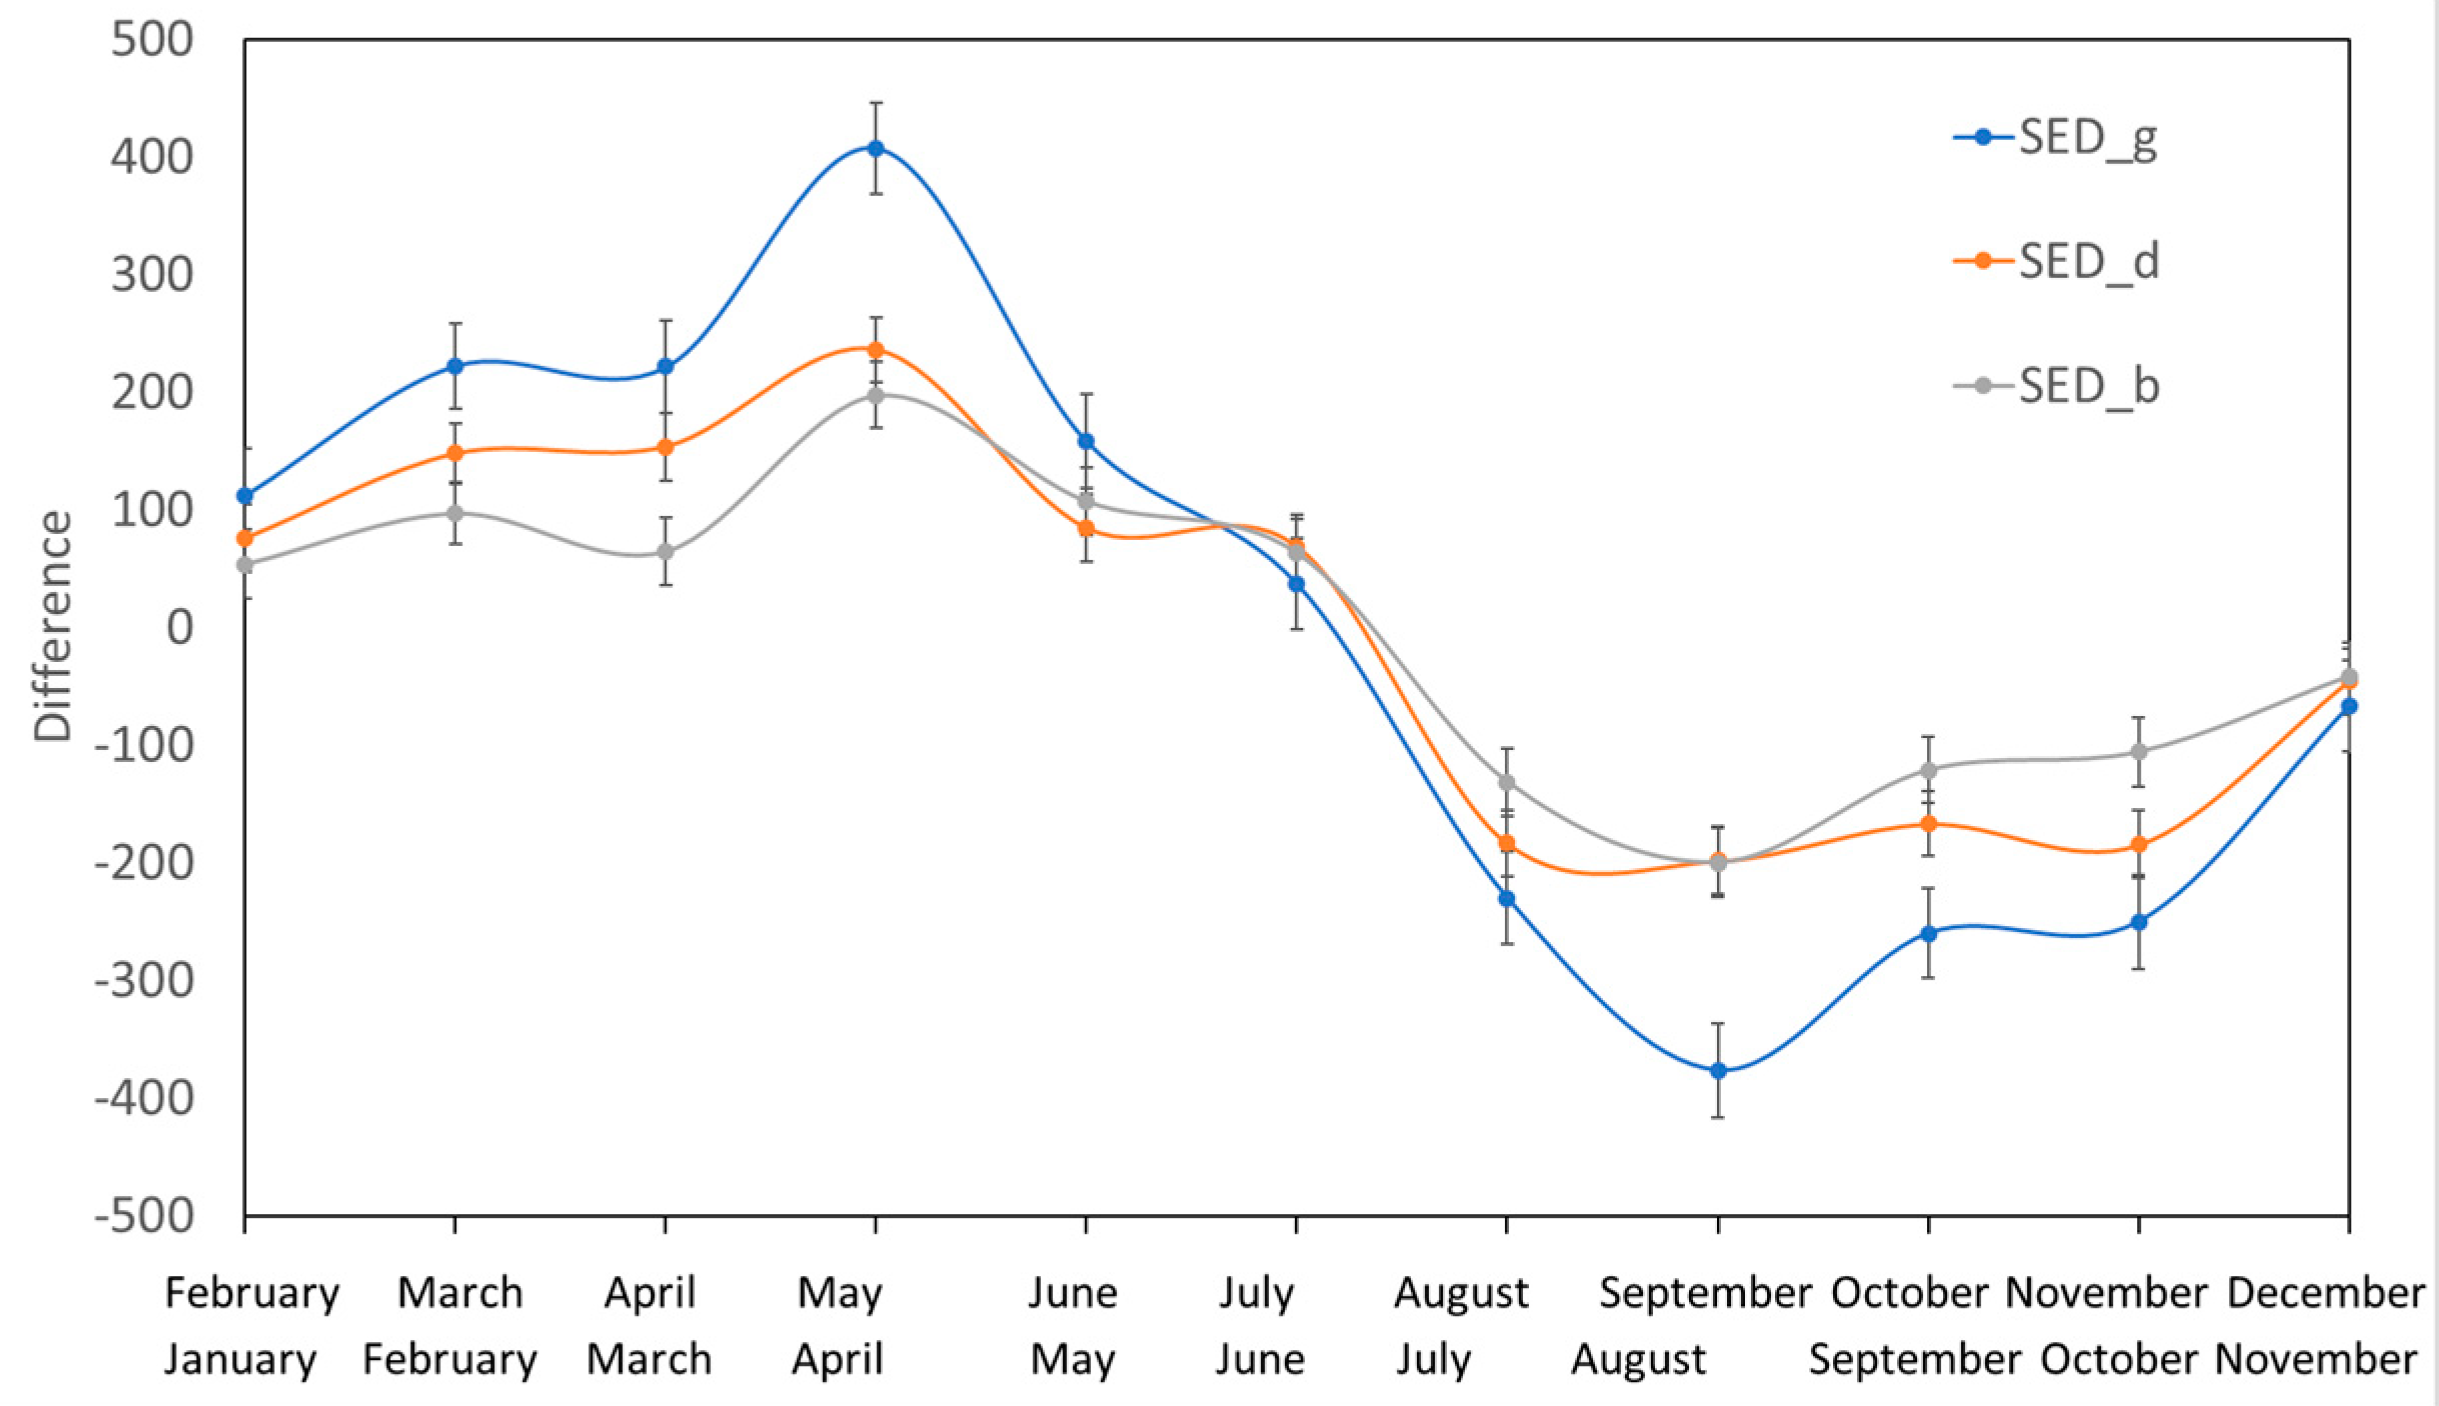
Figure 8.
Annual evolution of the ratio between diffuse and global daily SEDs.


Table 1.
Deviations between the UVI at noon and the maximum daily UVI for the global, diffuse, or direct components.
Table 1.
Deviations between the UVI at noon and the maximum daily UVI for the global, diffuse, or direct components.
| UV Index Value | Global (%) | Diffuse (%) | Direct (%) |
|---|---|---|---|
| {−1, 0, 1} | 88.0 | 95.4 | 90.3 |
Disclaimer/Publisher’s Note: The statements, opinions and data contained in all publications are solely those of the individual author(s) and contributor(s) and not of MDPI and/or the editor(s). MDPI and/or the editor(s) disclaim responsibility for any injury to people or property resulting from any ideas, methods, instructions or products referred to in the content. |
© 2023 by the authors. Licensee MDPI, Basel, Switzerland. This article is an open access article distributed under the terms and conditions of the Creative Commons Attribution (CC BY) license (https://creativecommons.org/licenses/by/4.0/).
Share and Cite
MDPI and ACS Style
Marín, M.J.; Estellés, V.; Gómez-Amo, J.L.; Utrillas, M.P. Diffuse and Direct UV Index Experimental Values. Atmosphere 2023, 14, 1221. https://doi.org/10.3390/atmos14081221
AMA Style
Marín MJ, Estellés V, Gómez-Amo JL, Utrillas MP. Diffuse and Direct UV Index Experimental Values. Atmosphere. 2023; 14(8):1221. https://doi.org/10.3390/atmos14081221
Chicago/Turabian StyleMarín, María J., Víctor Estellés, José L. Gómez-Amo, and María P. Utrillas. 2023. "Diffuse and Direct UV Index Experimental Values" Atmosphere 14, no. 8: 1221. https://doi.org/10.3390/atmos14081221
Note that from the first issue of 2016, this journal uses article numbers instead of page numbers. See further details here.