Article

Determining the Day-to-Day Occurrence of Low-Latitude Scintillation in Equinoxes at Sanya during High Solar Activities (2012–2013)

1
College of Electronic and Information Engineering, South-Central Minzu University, Wuhan 430074, China
2
Key Laboratory of Electronic Information Engineering, State Ethnic Affairs Commission, South-Central Minzu University, Wuhan 430074, China
3
China Research Institute of Radiowave Propagation, Qingdao 266107, China
4
Hubei Engineering Research Center of Intelligent Internet of Things Technology, South-Central Minzu University, Wuhan 430074, China
*
Author to whom correspondence should be addressed.
Atmosphere 2023, 14(8), 1242; https://doi.org/10.3390/atmos14081242
Submission received: 15 July 2023 / Revised: 28 July 2023 / Accepted: 30 July 2023 / Published: 2 August 2023

Abstract

:
Plasma irregularity in the equatorial and low-latitude ionosphere, which leads to ionospheric scintillation, can threaten the operation of radio-based communication and navigation systems. A method for forecasting scintillation activity is still pending. In this study, we examined the performance of ionospheric parameters, including the critical frequency (foF2), peak height of the F2-layer (hmF2), scale height (Hm) and virtual height (h’F), around local sunset from ground-based ionosonde observations, and also the characteristics of Equatorial Ionization Anomaly (EIA) derived from Gravity Recovery and Climate Experiment (GRACE) observations in equinoctial months (March–April and September–October) during high solar activities (2012–2013) at a low-latitude station at Sanya (18.3° N, 109.6° E; dip lat.: 12.8° N), China. Furthermore, the simplified linear growth rate of Rayleigh–Taylor (R–T) instability inferred from ionosonde measurements and EIA strength derived from GRACE observations were used to estimate the day-to-day occurrence of post-sunset scintillation. The results indicate that it is not adequate to determine whether scintillation in a low-latitude region would occur or not based on one ionospheric parameter around sunset. The simplified growth rate of R–T instability can be a good indicator for the day-to-day occurrence of scintillation, especially in combination with variations in EIA strength. An index including the growth rate and EIA variations for the prediction of the post-sunset occurrence of irregularity and scintillation is proposed; the overall prediction accuracy could be about 90%. Our results may provide useful information for the development of a forecasting model of the day-to-day variability of irregularities and scintillation in equatorial and low-latitude regions.

1. Introduction

At the bottom of the equatorial and low-latitude ionosphere, plasma density may be depleted over a large longitudinal range and irregularities are generated after sunset under the effect of generalized Rayleigh–Taylor (R–T) instability. The density depletions or irregularities, referred to as Equatorial Spread-F (ESF) or Equatorial Plasma Bubbles (EPB), move upward into the topside ionosphere due to the polarized eastward electric field. These irregularities can give rise to ionospheric scintillation, severely affecting the propagation of electromagnetic waves.
To forecast/predict the occurrence of irregularities and scintillation in equatorial and low-latitude regions, one of the important issues in space weather and ionospheric physics is the relationship between the occurrence of scintillation and various ionospheric parameters based on ground-based measurements [1], e.g., VHF radar, GNSS and ionosonde, and space-based in situ measurement [2], e.g., C/NOFS, ROCSAT-1, DMSP and Swarm, such as the scale length (L) of the vertical density gradient, virtual height (h’F), peak height of the F2-layer (hmF2), F2-layer peak electron density(NmF2) or total electron content (TEC) and vertical plasma drift (V). Based on ground-based and satellite insitu observations, earlier studies have pointed out that ionospheric parameters can be related to the occurrence of post-sunset irregularity and scintillation. For instance, post-sunset irregularities are often preceded by F-layer height rise around sunset, due to the pre-reversal enhancement (PRE) of the zonal electric field, which is crucial for the development of R–T instability and the sequent occurrence of irregularities and scintillation (e.g., see [2,3,4,5]). Some reports also pointed out that a threshold height of the F-layer (e.g., hmF2 or h’F) was necessary for the occurrence of post-sunset irregularities and scintillation in the equatorial region (e.g., see [6,7,8]). On ESF days, at Sanya, the h’F around local sunset was observed to be larger [8]. Moreover, there exists a “threshold” in upward E × B drift (e.g., 30 m/s) that determines whether post-sunset irregularities and subsequent scintillation activity will or will not occur [4,9,10]. Therefore, the h’F after local sunset at 1930 Local Time (LT) and vertical plasma drift around local sunset are suggested for use in predicting the occurrence of post-sunset scintillation activity (e.g., see [11,12,13,14]). Anderson and Redmon [11] used the virtual height (h’F) at 1930 Local Time (LT) to predict the scintillation activity in five longitude sectors, and the overall forecasting success was greater than 80% for each of the five longitude sectors. Zhao et al. [15] also proposed that equatorial hmF2 and foF2 before sunset could be used to predict the occurrence/nonoccurrence of intense scintillations in low-latitude regions; the prediction accuracy can reach about 85%.
In addition, the electron density and scale length of the vertical density gradient, which are important to the initiation and evolution of R–T instability at the bottom of the F-layer, are also important to the occurrence of post-sunset irregularities and the characteristics of scintillation [16,17,18,19,20]. It is found that a larger (steeper) density gradient at the bottom side F-layer is responsible for an enhanced R–T instability growth under a low solar flux condition [16]. The enhanced irregularity activity may be related to the high background electron density and the steep gradient in density [17].
Thus, the linear growth rate of R–T instability, including the effect of background density, vertical drift and neutral wind, has been used to evaluate the growth and occurrence of nighttime irregularities and scintillation [21,22,23,24,25,26,27,28,29,30]. For example, Wu [27] investigated the seasonal/longitudinal variability in R–T instability using a TIEGCM model and found a good qualitative agreement with the EPB occurrence patterns from 15 years of in situ satellite observations. Carter et al. [25] reported that the agreement between modeled R–T instability growth rates and EPB occurrence observations reached 85.7% during a two-month interval.
Moreover, a few previous studies have pointed out that the variations in Equatorial Ionization Anomaly (EIA), which are associated with both zonal electric field and meridional neutral wind, are also related to the occurrence of post-sunset irregularity and scintillation [31,32]. The EIA strength can also be used as an indicator to forecast the occurrence of irregularities and scintillation [31,32,33,34,35], especially during disturbed periods [36].
However, some studies also pointed out that only strong upward E × B drift, or large PRE, may not lead to the initiation of R–T instability and the occurrence of plasma irregularities and scintillation [8,37]. Smith et al. [38] found that despite large PRE peaks, which means large vertical drifts, ESF might not occur. Variations in hmF2 may be similar on spread-F and non-spread-F days [39]. hmF2 and h’F may also be small on some scintillation days and be large on some non-scintillation days [8]. Carter et al. [25] compared the variations in h’F and foF2 at a low-latitude station at Vanimo on scintillation and non-scintillation days. They indicated that the F-layer electron densities measured with an ionosonde were not directly related to the occurrence of EPBs. Wang et al. [40] reported that there were no clear relationships between foF2, h’F and the occurrence of spread-F over mid-and low-latitude China. On some EPB days, the growth rates of R–T instability inferred from model and digisonde observations were similar to those on non-EPB days, and they were quite small [29]. Therefore, an indicator for predicting post-sunset irregularities and scintillation is still worthy of study.
To study the possible precursors of the day-to-day occurrence of irregularities and scintillation activity in equatorial and low-latitude regions, based on ground-based observations, we examined the variations in ionospheric parameters around local sunset inferred from ionosonde observations, including the critical frequency(foF2), peak height of the F2-layer (hmF2), scale height (Hm) and virtual height (h’F), and EIA strength derived fromthe Gravity Recovery and Climate Experiment (GRACE) satellite in equinoctial months (March–April and September–October) during high solar activities (2012–2013) at a low-latitude station at Sanya (18.3° N, 109.6° E; dip lat.: 12.8° N), China. Furthermore, the relationship between the linear growth rate of R–T instability deduced from ionosonde measurements and the occurrence of post-sunset scintillation is discussed. Finally, we propose an index to predict the occurrence of post-sunset irregularities and scintillation, based on the characteristics of growth rate of R–T instability and EIA strength.

2. Dataset

2.1. Ground-Based Observations

The day-to-day occurrences of low-latitude scintillation at Sanya were recorded with the GPS Ionospheric Scintillation and TEC Monitor (GISTM) system GSV4004A [41]. The amplitude scintillation index S4 was calculated every one minute; the S4 data with elevation angles larger than 30° and lock time no less than 3 min were used to eliminate multi-path effects. To identify the occurrences of post-sunset scintillation, the threshold 0.2 of S4 was used [20,42]. Scintillation days were defined as scintillation occurring before local midnight with the daily maximum S4 (S4max) larger than 0.2. While the non-scintillation days were defined as the S4max less than 0.2 before local midnight. During 2012–2013, the numbers of scintillation days and non-scintillation days during two equinoxes are summarized in Table 1.
At Sanya, the ionospheric parameters, including foF2, hmF2, Hm and virtual height measured at 5 MHz (h’F5) were derived manually from Digisonde Portable Sounder (DPS-4D) measurements every 15 min [20].
Moreover, the vertical drifts of the F-layer were calculated, as proposed by [43]. In this study, the time rates of h’F5 were calculated to represent the movement of the F-layer and described as the E × B drift [29], which can be related to the combined effects from the meridional winds and vertical drift [3].
V = V h F 5 = dh F 5 dt
The altitudinal profiles of electron density (Ne) can be inferred from ionograms by the Automatic Real-Time Ionogram Scaler with True height (ARTIST) [44]. The scale length (L) of the vertical density gradient can be calculated as follows:
1 L = 1 N e N e h

2.2. Space-Based Observations

The GRACE mission, involving two spacecraft GRACE-A and GRACE-B, was launched into a polar orbit (inclination: 89°) at about 490 km on 17 March 2002 [45]. The electron density inferred from the K-band ranging (KBR) system between the two GRACE spacecraft [46] has been validated through comparisons with ground-based measurements at Jicamarca and European Incoherent Scatter radar (EISCAT), and Millstone hill and Arecibo radars [47], respectively. Electron densities from GRACE provide good opportunities to investigate the latitudinal variations in electron density and characteristics of Equatorial Ionization Anomaly [48]. The Crest-to-Trough Ratio (CTR) is usually used to represent the EIA strength [48] and is calculated as CTR = (N + S)/2T. N(S) represents the electron density above the northern (southern) crest. T represents the density at the trough.
GRACE passed over the 110° E region for 92 days in 2012 and 39 days in 2013 during the March–April and September–October periods, respectively.

3. Method for Determining Scintillation Activity

3.1. Characteristics of Ionospheric Parameters

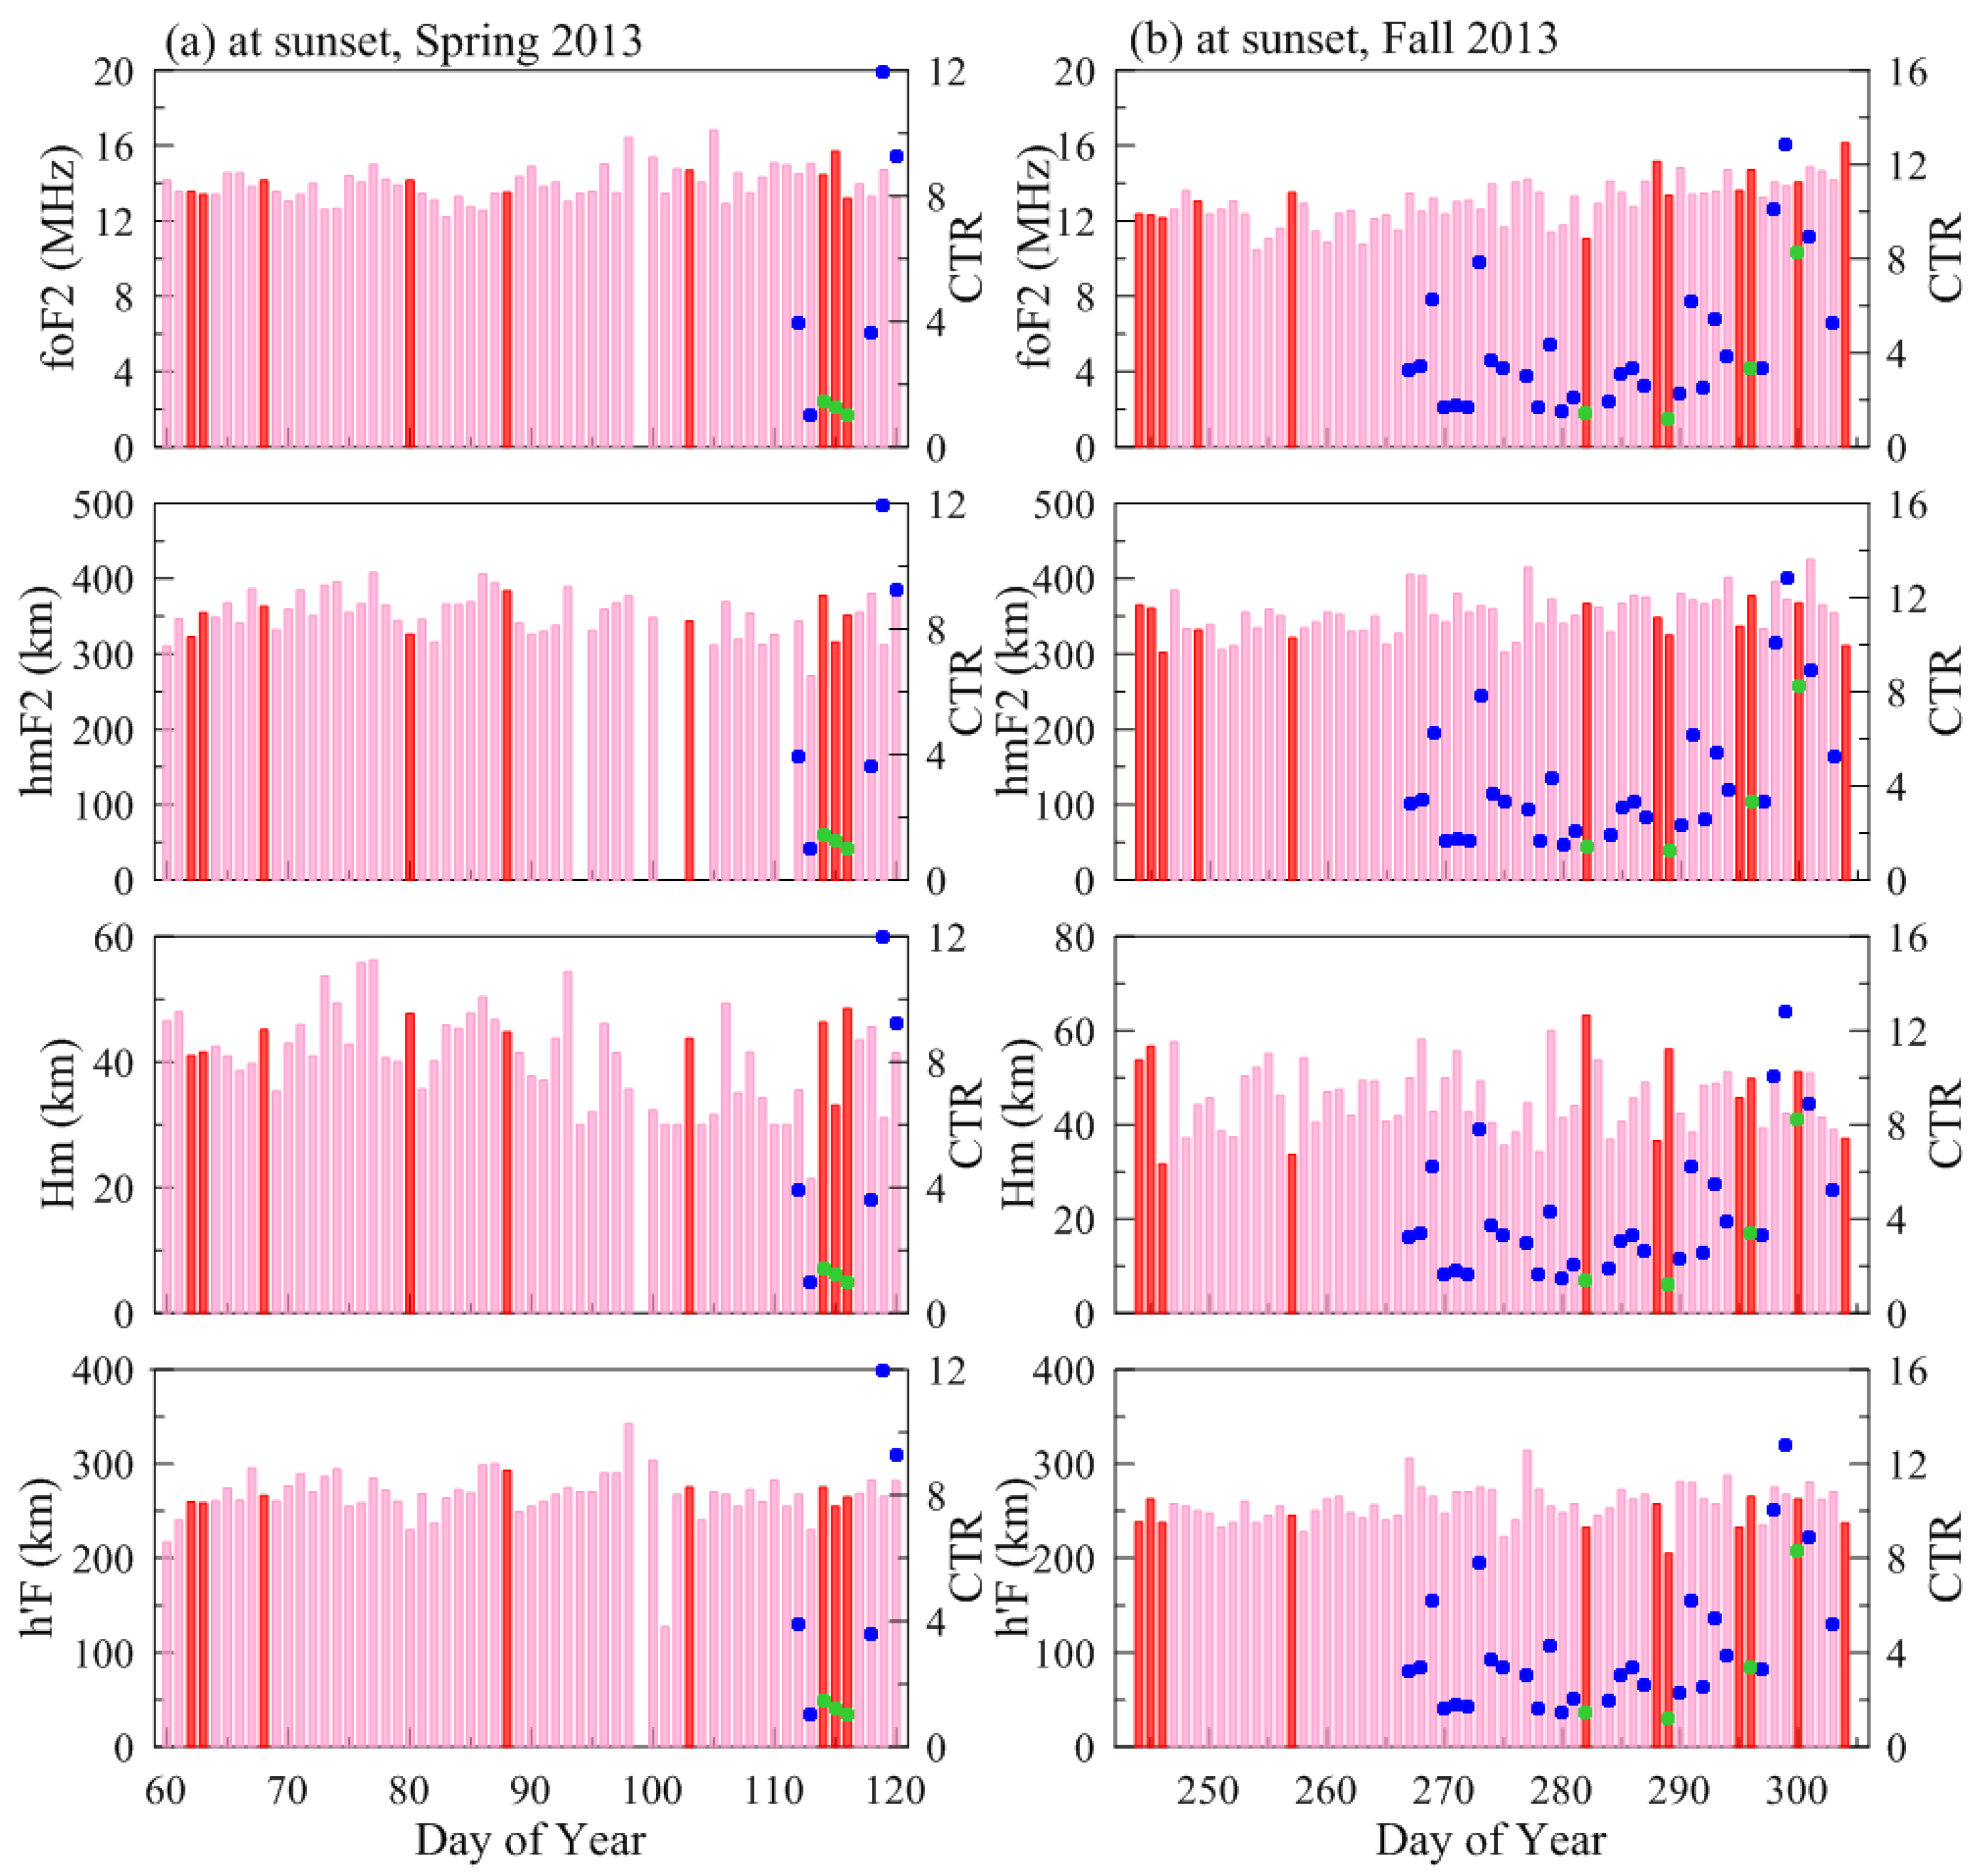
Figure 1 and Figure 2 display the day-to-day variations in foF2, hmF2, Hm and h’F at sunset on both scintillation and non-scintillation days during the spring (a) and fall (b) equinoxes in 2012 and 2013, respectively. EIA CTR derived from GRACE observations are also marked as blue dots on scintillation days and green dots on non-scintillation days in the figures. The pink bars and red bars represent the parameters on scintillation days and non-scintillation days, respectively. The average sunset time at Sanya was 1125 Universal Time (UT) (LT = UT + 7.5) during the spring equinox and 1100 UT during the fall equinox during 2012–2013.
From Figure 1 and Figure 2, it can be noticed that the variations in ionospheric parameters were similar on both scintillation and non-scintillation days. On some scintillation days, foF2, hmF2 or h’F were small, while they were larger on some non-scintillation days. It is difficult to determine the occurrence/nonoccurrence of irregularities and scintillation from only one of the ionospheric parameters, e.g., hmF2 or h’F.
The EIA strength may not be well correlated with the variations in ionospheric parameters. However, we can note that EIA CTRs on most scintillation days were larger than those on non-scintillation days. On some scintillation days the CTR was larger than 2 [33], while CTRs on non-scintillation days were less than 2, though the ionospheric parameters may be large or small. For example, on DOY104 and DOY105 in 2012, hmF2 and h’F were large (F-layer height was high) and EIA strength was weak (CTR was less than 2). On some scintillation days though, for example on DOY101 and DOY114 in 2012, foF2, hmF2 and h’F were not large and EIA strength was strong (CTR was larger than 3). This implies that the variations in hmF2/h’F may be not linearly correlated to the EIA strength; the variations in ionospheric parameters should be investigated together with the variations in EIA.
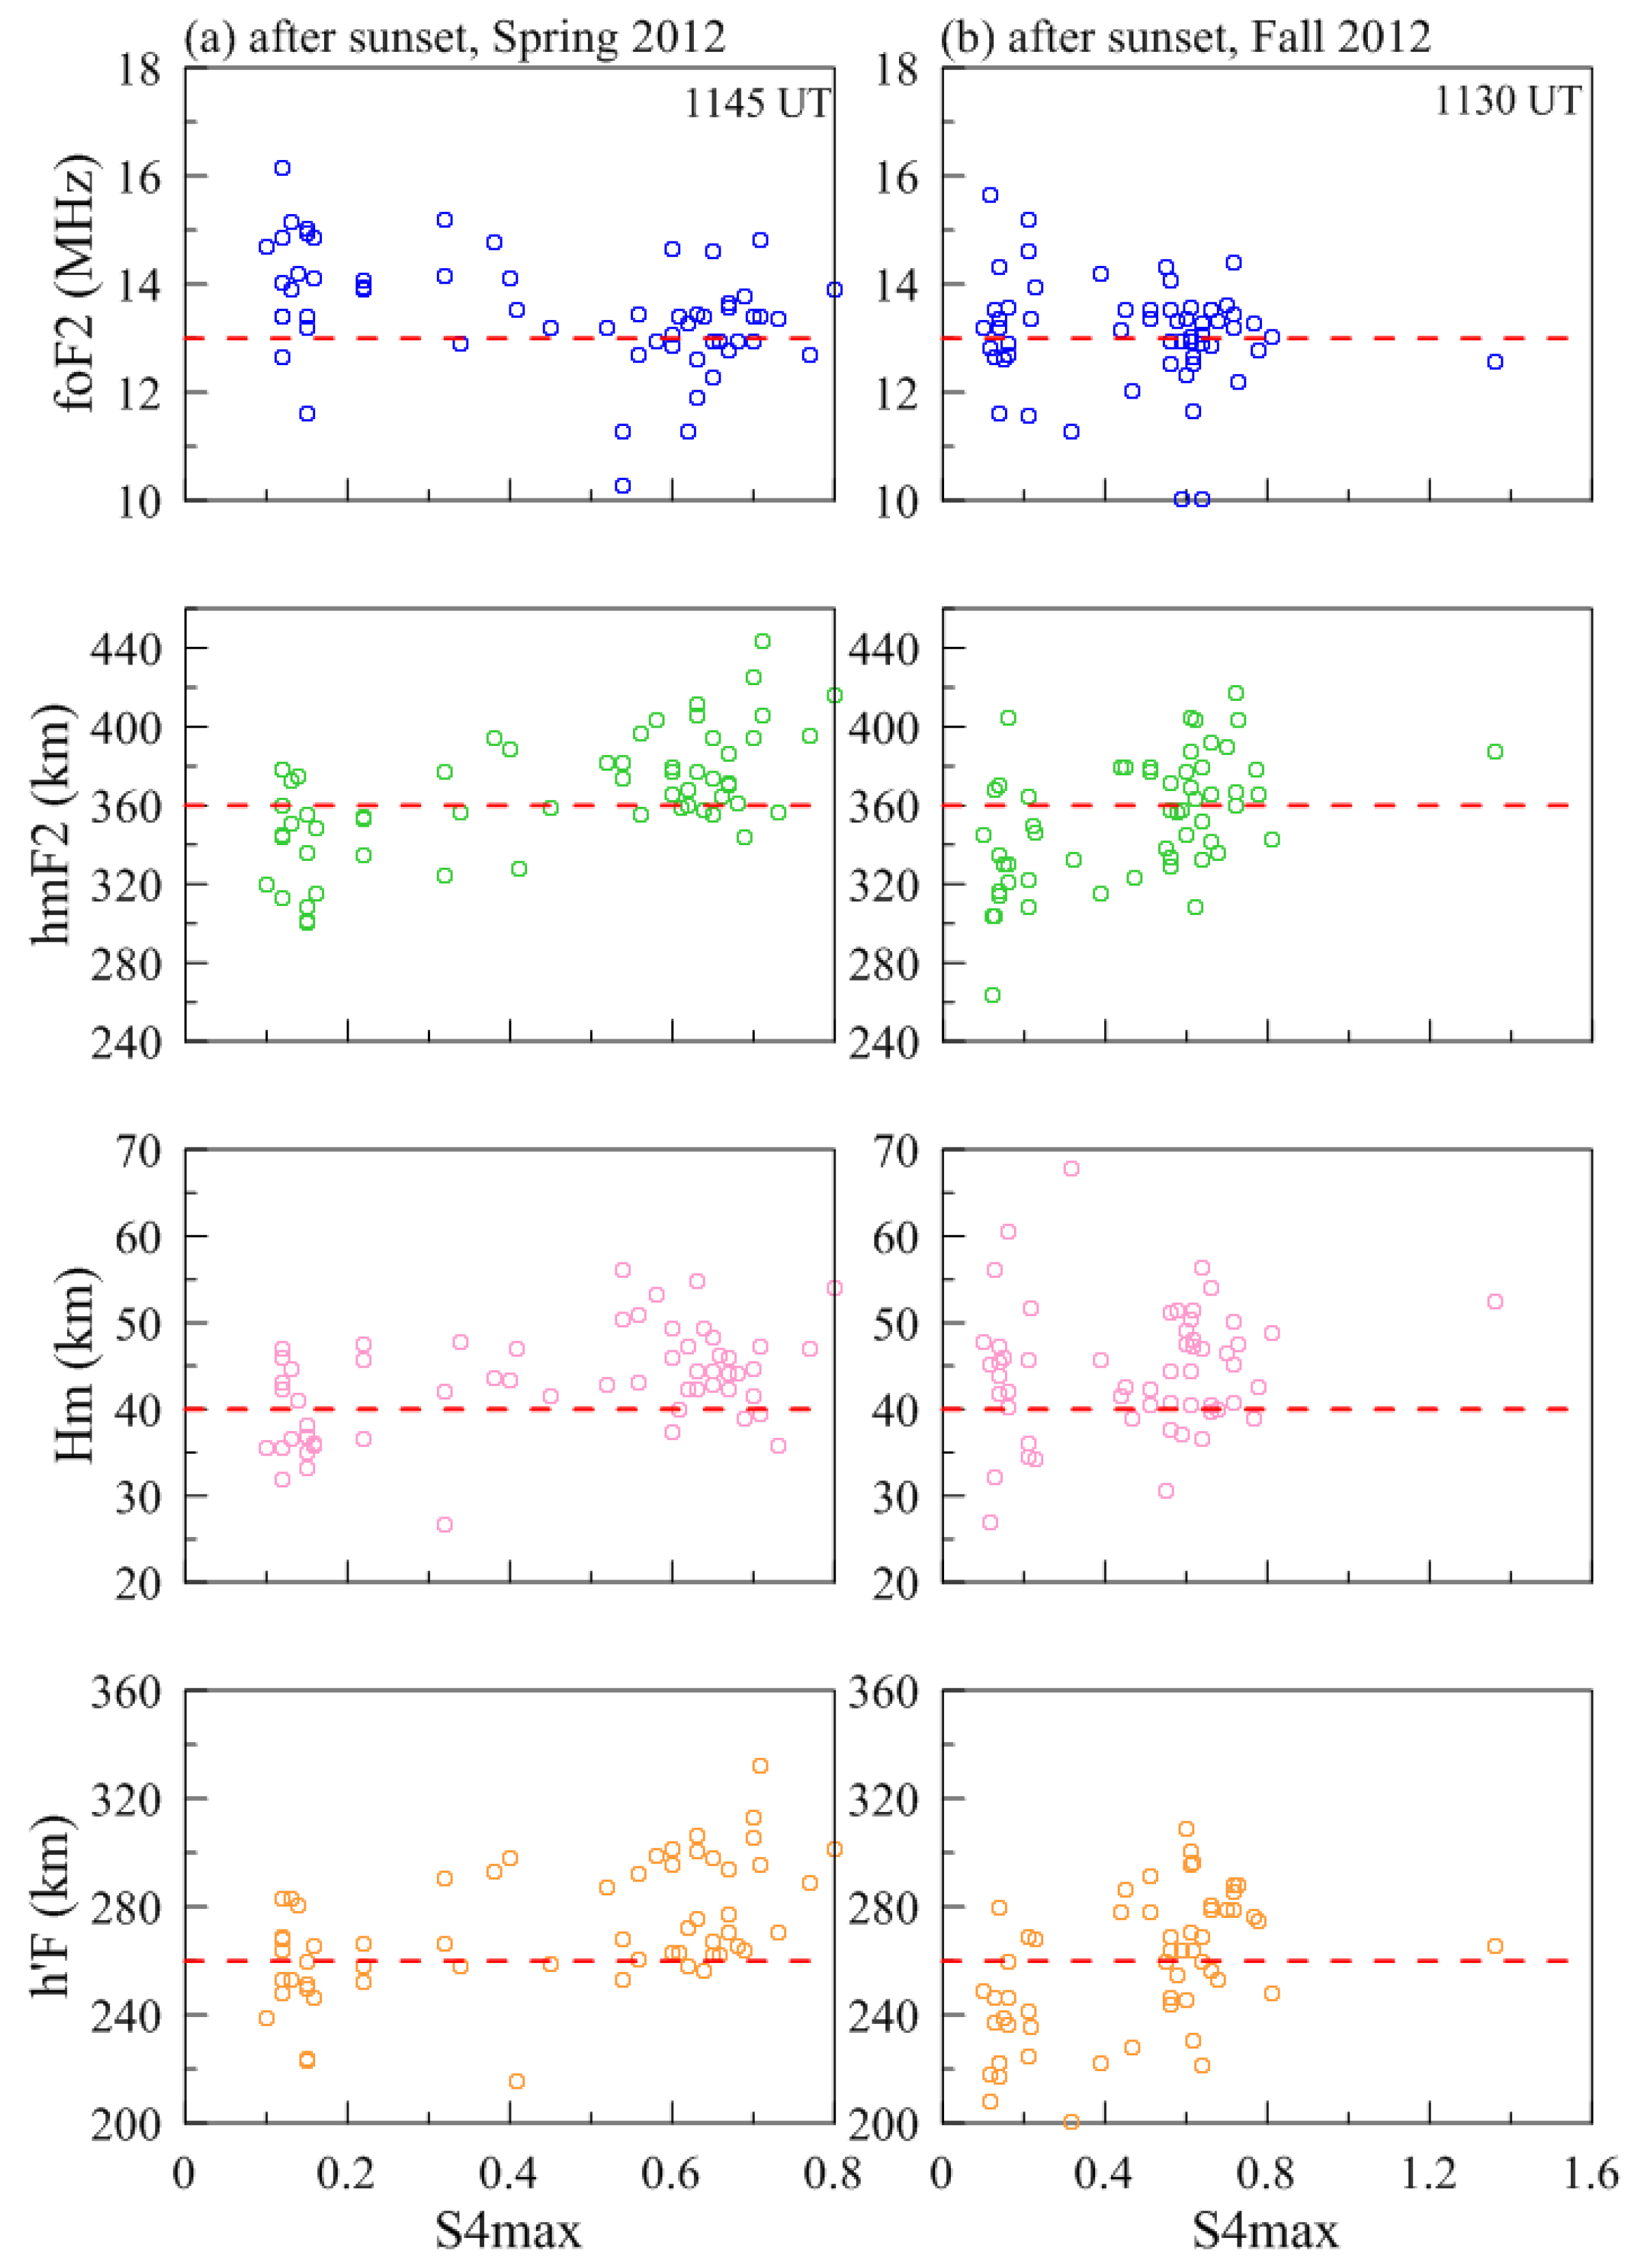
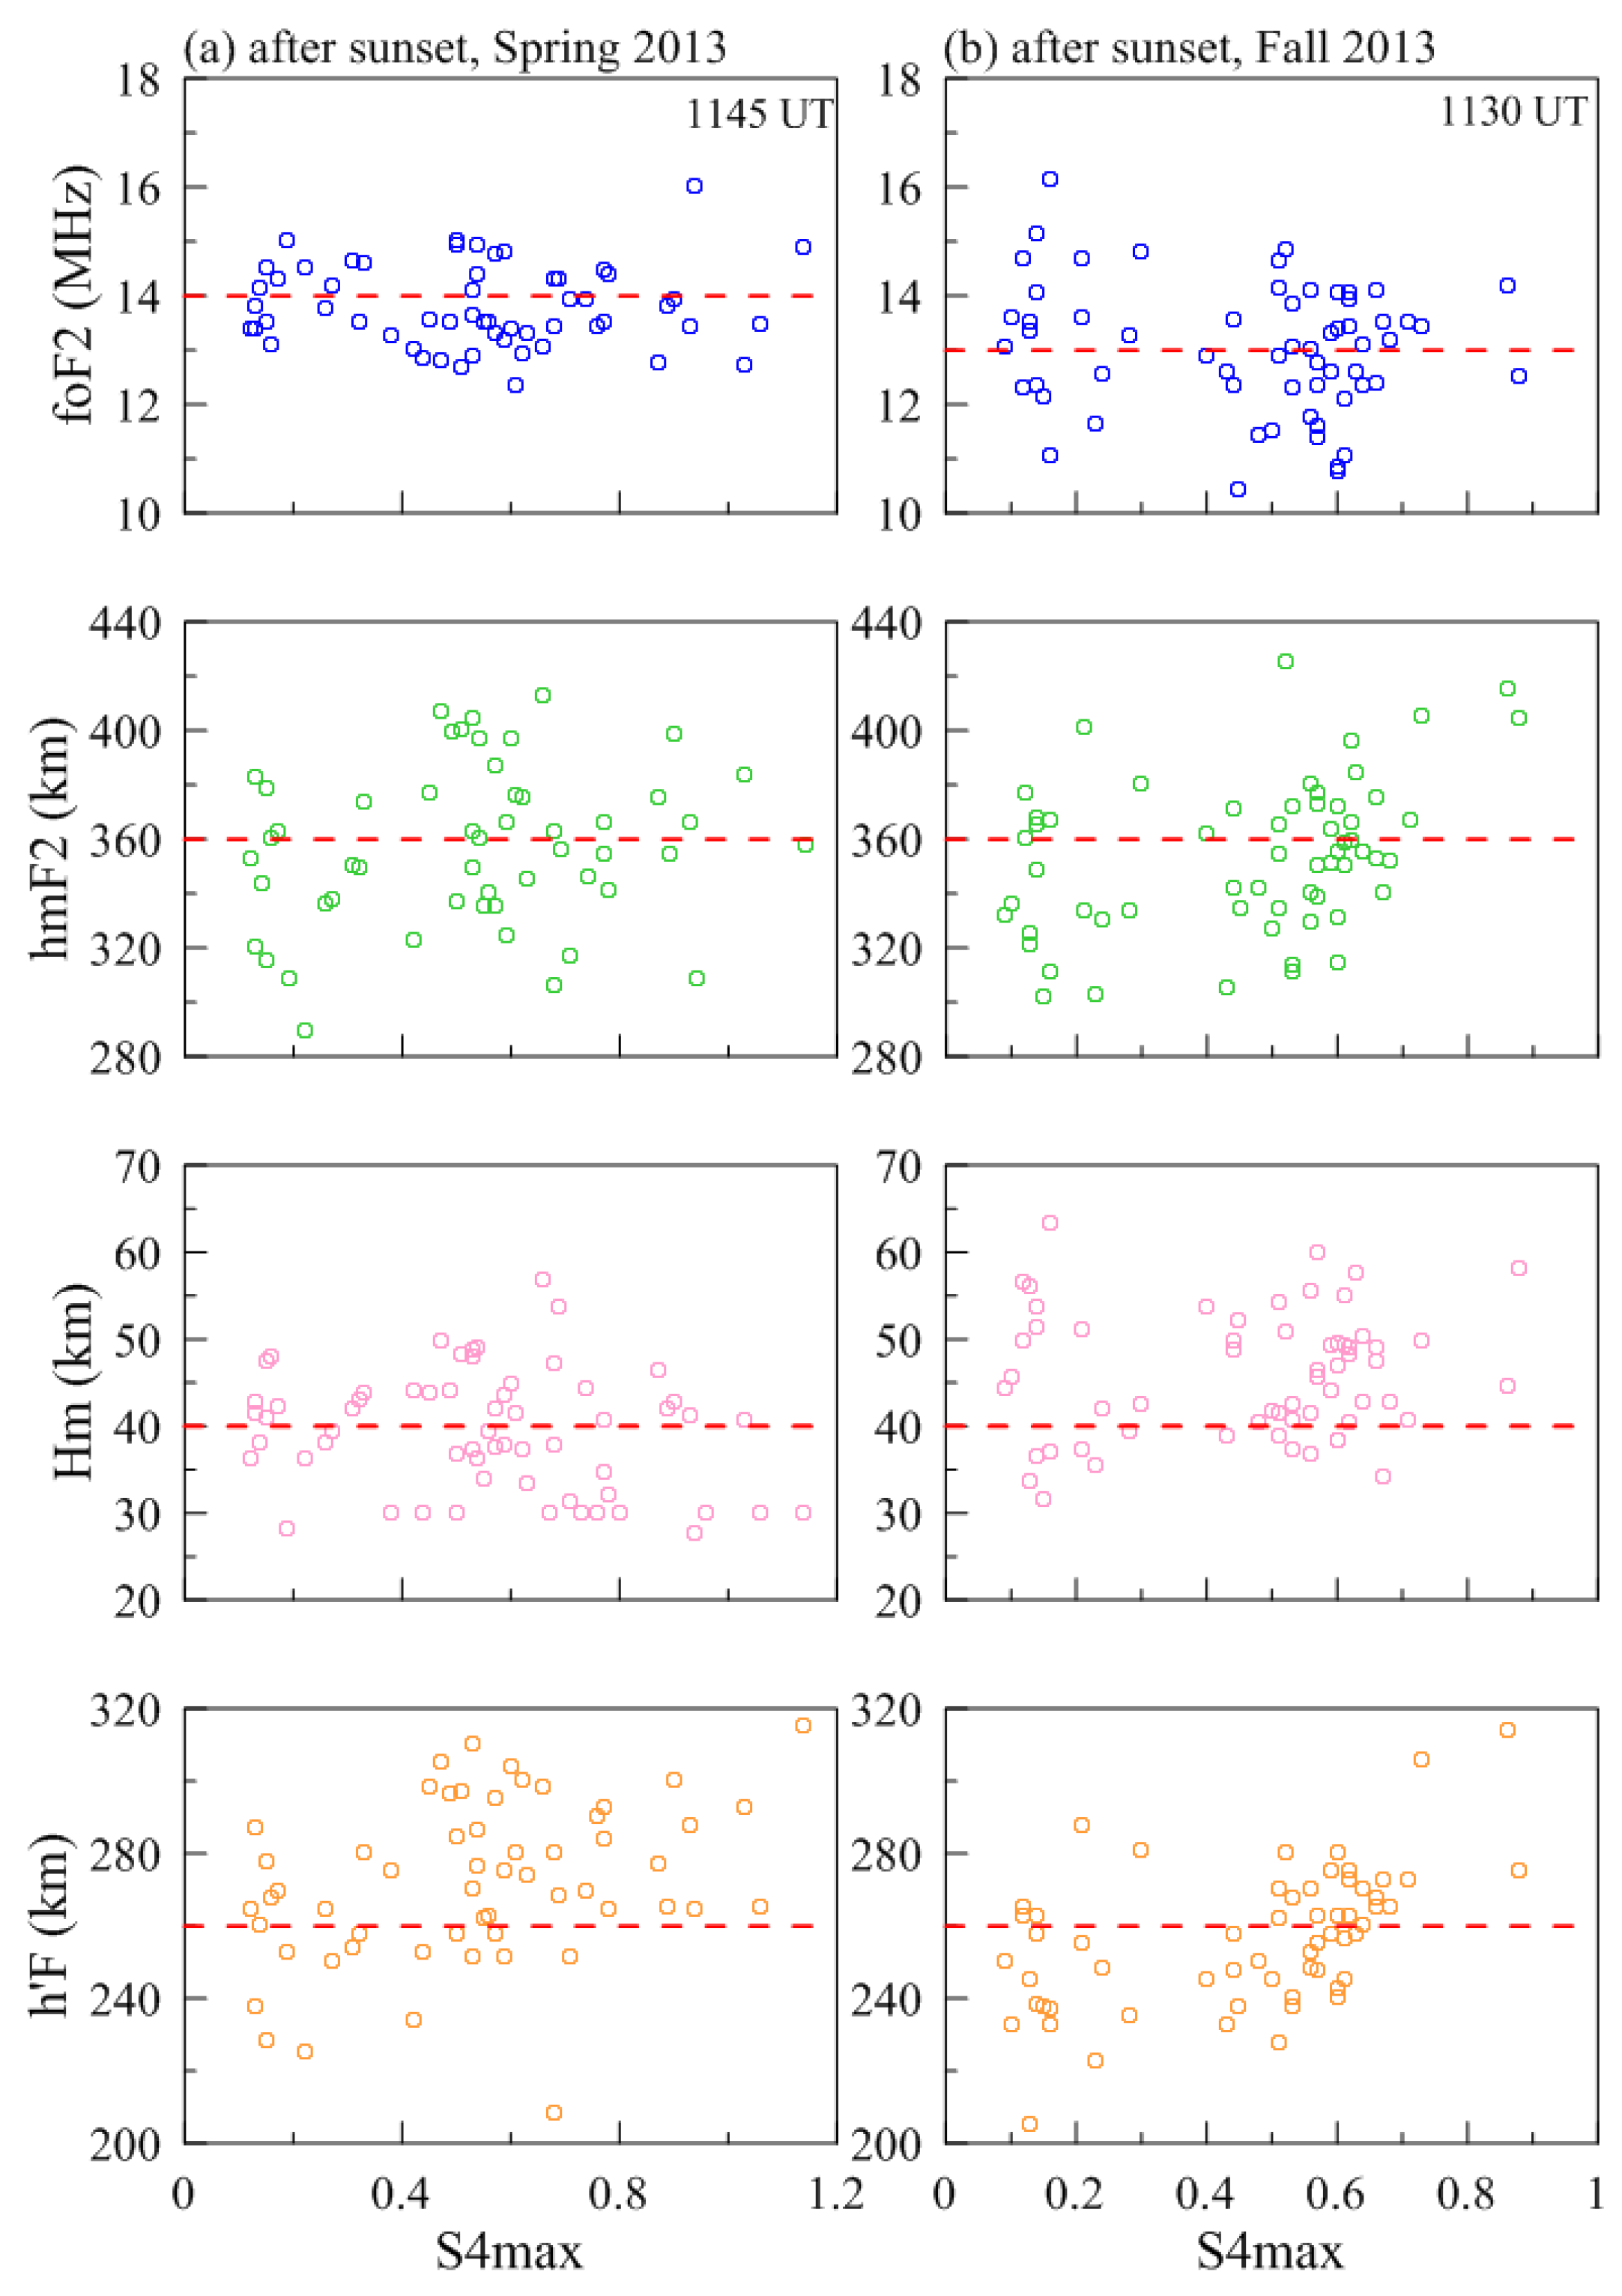
Furthermore, Figure 3 and Figure 4 show the variations in foF2, hmF2, Hm and h’F at the time 30 min after local sunset with the daily maximum S4 (S4max) index on both scintillation and non-scintillation days during the spring (a) and fall (b) equinox in 2012 and 2013, respectively.
At the time 30 min after sunset, in Figure 3, as hmF2 was larger than 360 km or h’F was larger than 260 km, scintillation was probable to occur in 2012. For example, at the time about 30 min after sunset, on 29 scintillation days (about 74% of scintillation days) during the spring equinox, hmF2 was larger than 360 km. On about 79% of non-scintillation days, hmF2 was smaller than 360 km. The characteristics of foF2 and Hm on non-scintillation days were similar with that on scintillation days.
In 2013, shown in Figure 4, similar with that in 2012, on many scintillation days, hmF2 and h’F at the time about 30 min after sunset were large, while foF2 and Hm were large or small.

3.2. The Simplified Growth Rate of R–T Instability

To acquire an index from the observations, the simplified local linear growth rate of R–T instability derived from ionosonde measurements was calculated with Equation (2).
γ = 1 N e N e h V h F 5 = 1 L V h F 5
In Equation (2), only the density gradient and vertical drift are included; the effects of ion-neutral collision, neutral wind and recombination are neglected, which will lead to differences when comparing to the full equation of linear growth rate of R–T instability [22], but it can approximately represent the development of R–T instability [49,50].
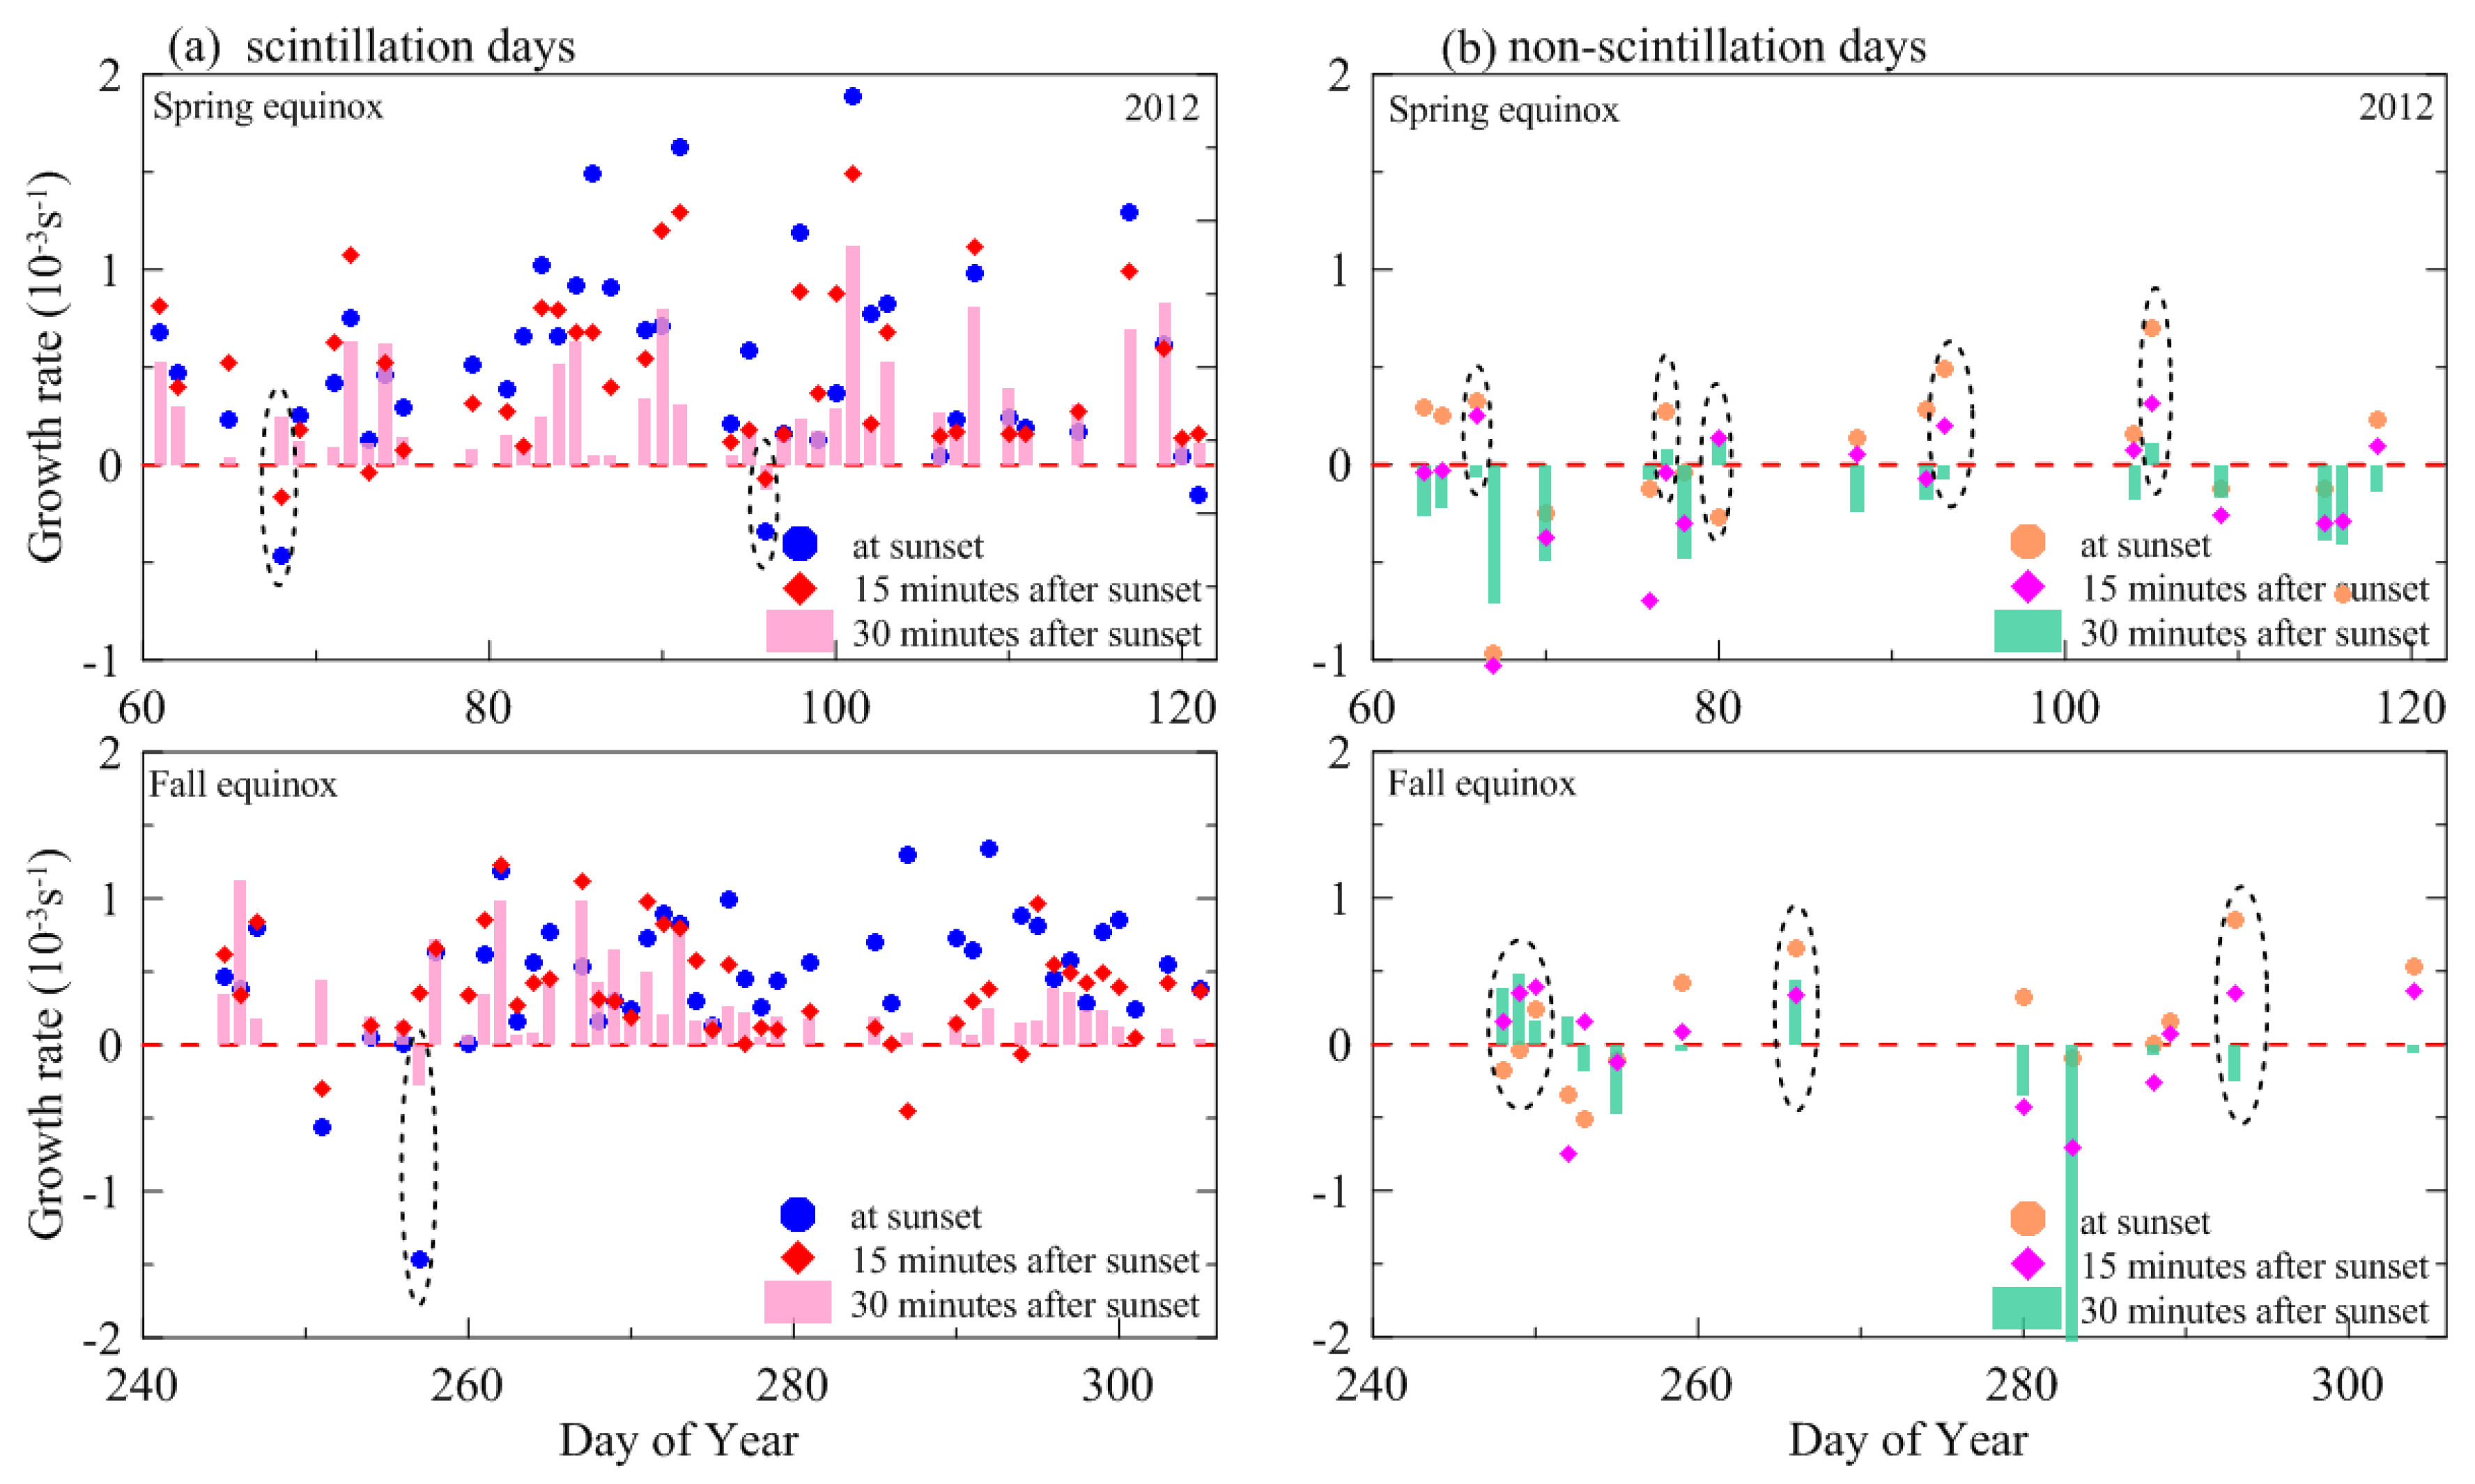
Figure 5 and Figure 6 display the day-to-day variations in simplified growth rates (γ) calculated from Equation (2) around local sunset, 15 min and 30 min after sunset, on both scintillation (a) and non-scintillation (b) days during equinoctial months in 2012 and 2013, respectively.
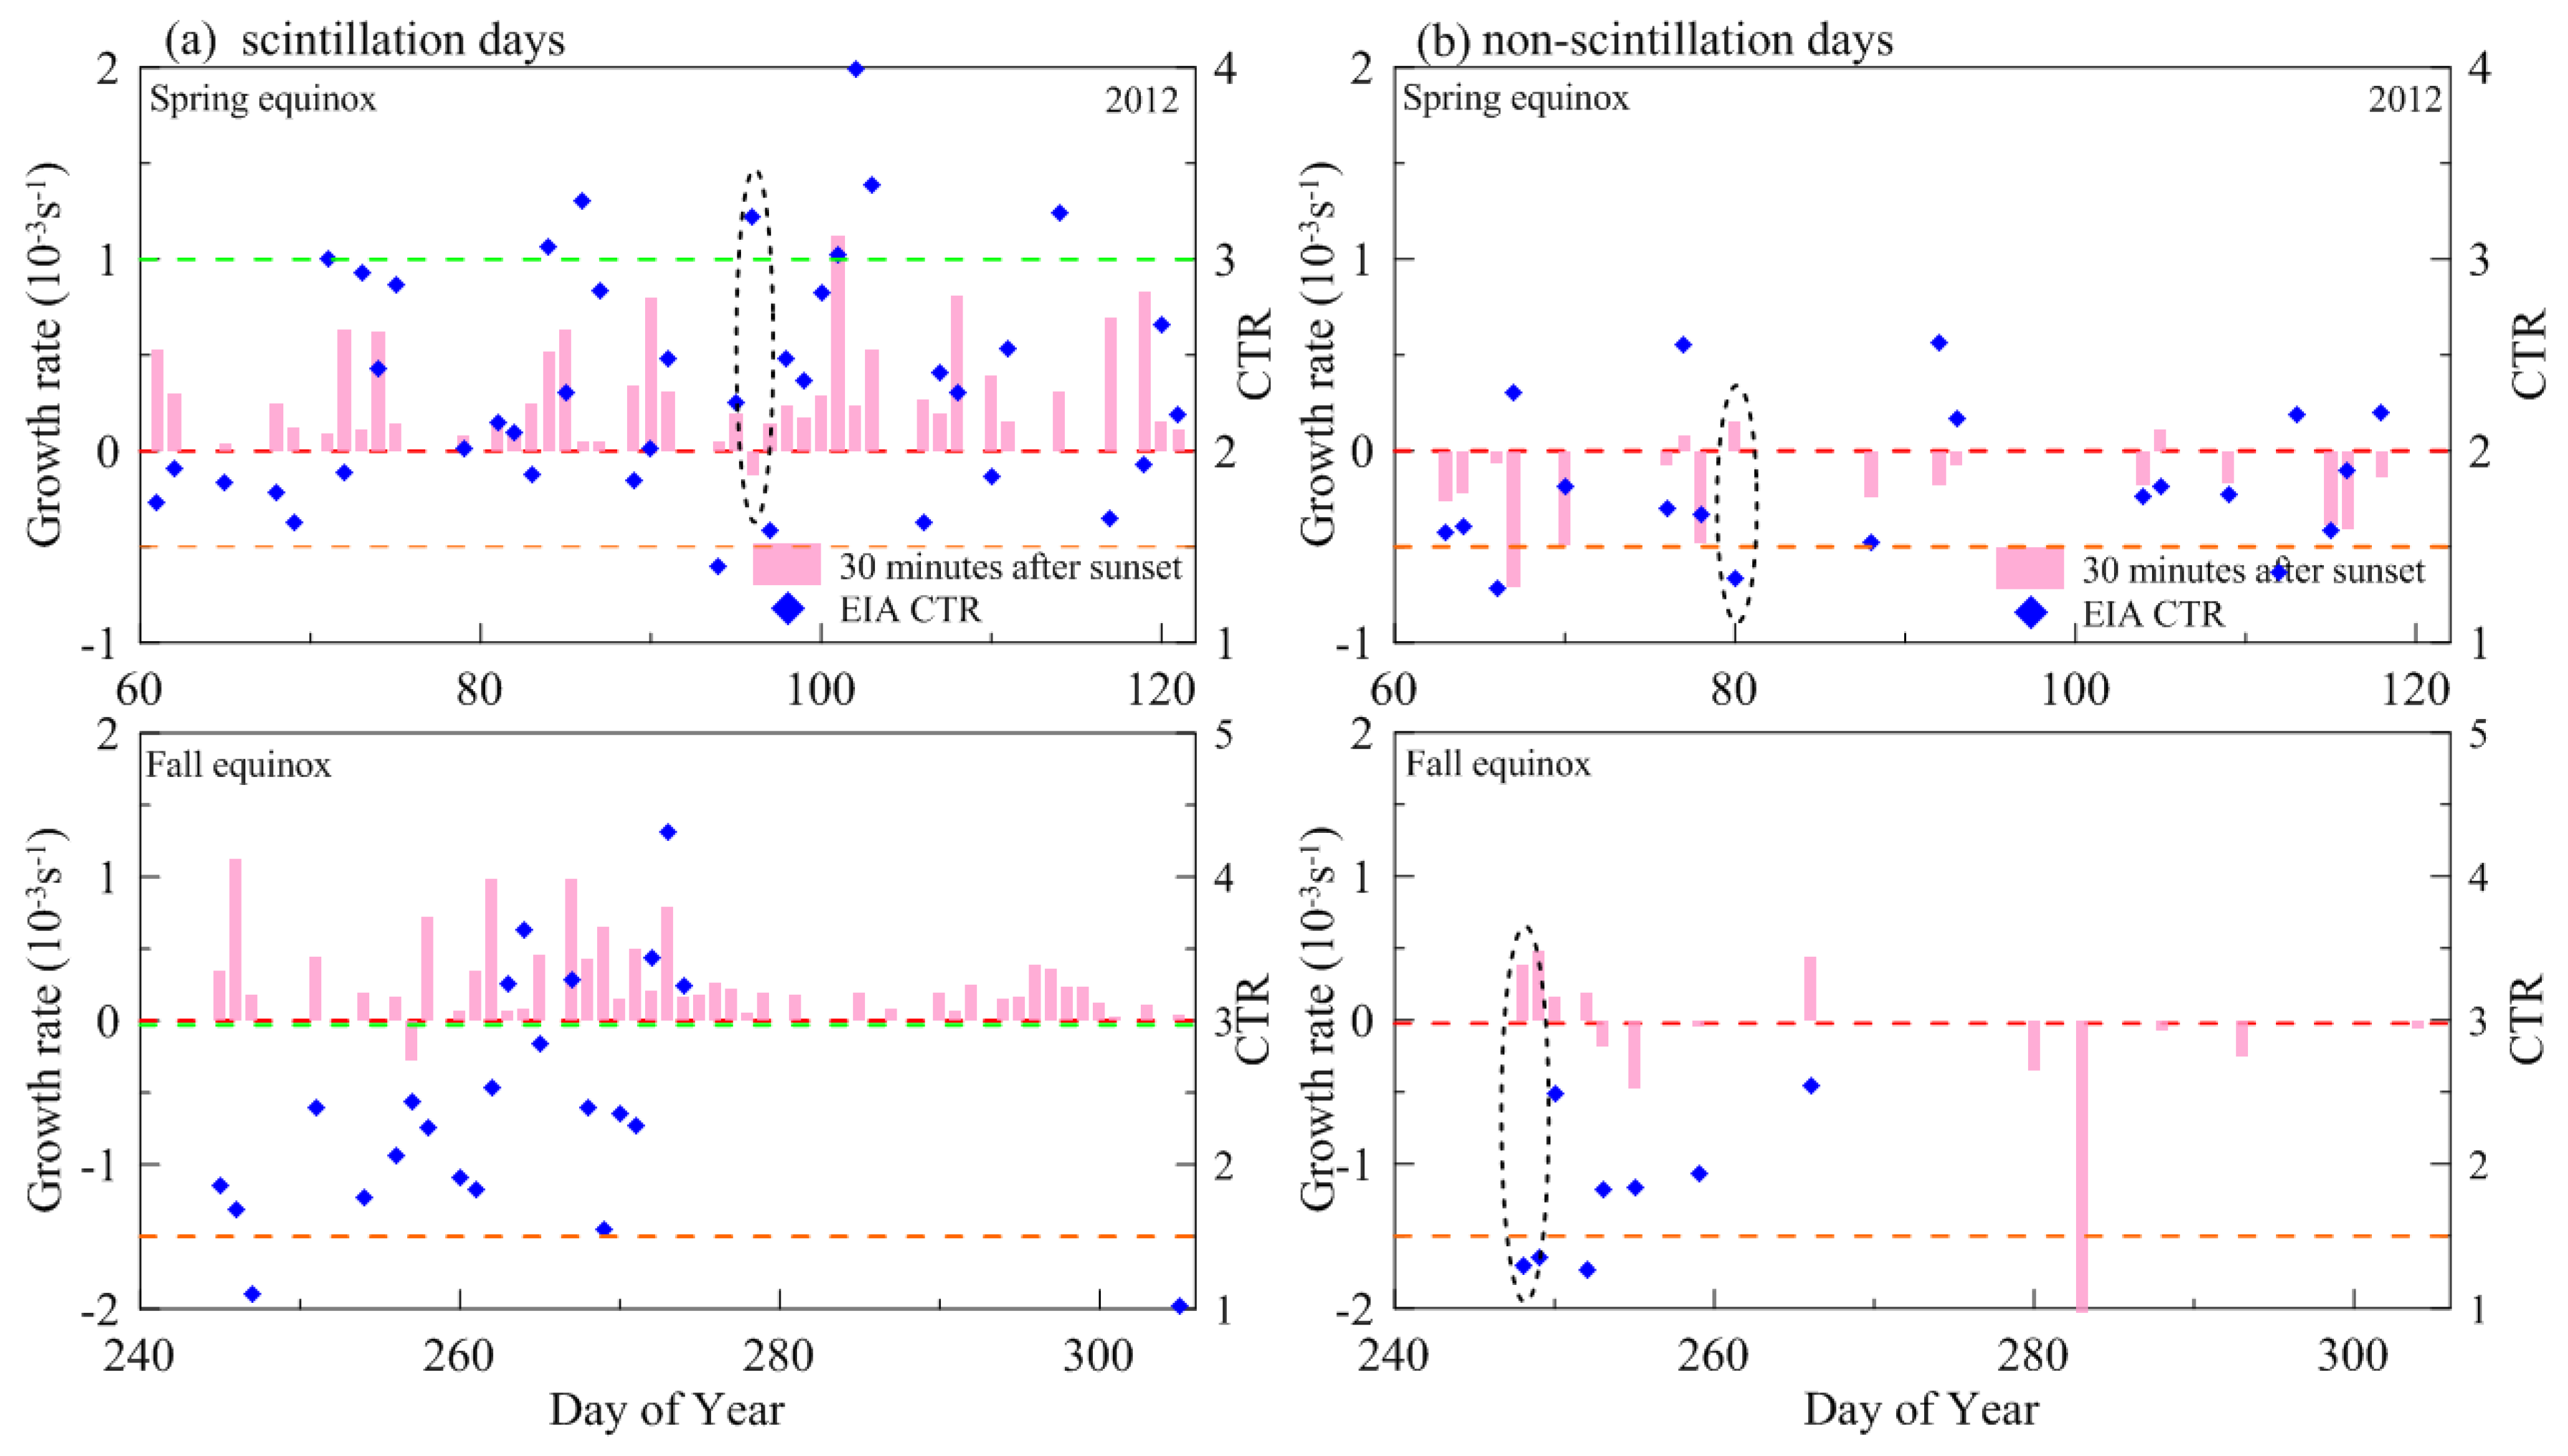
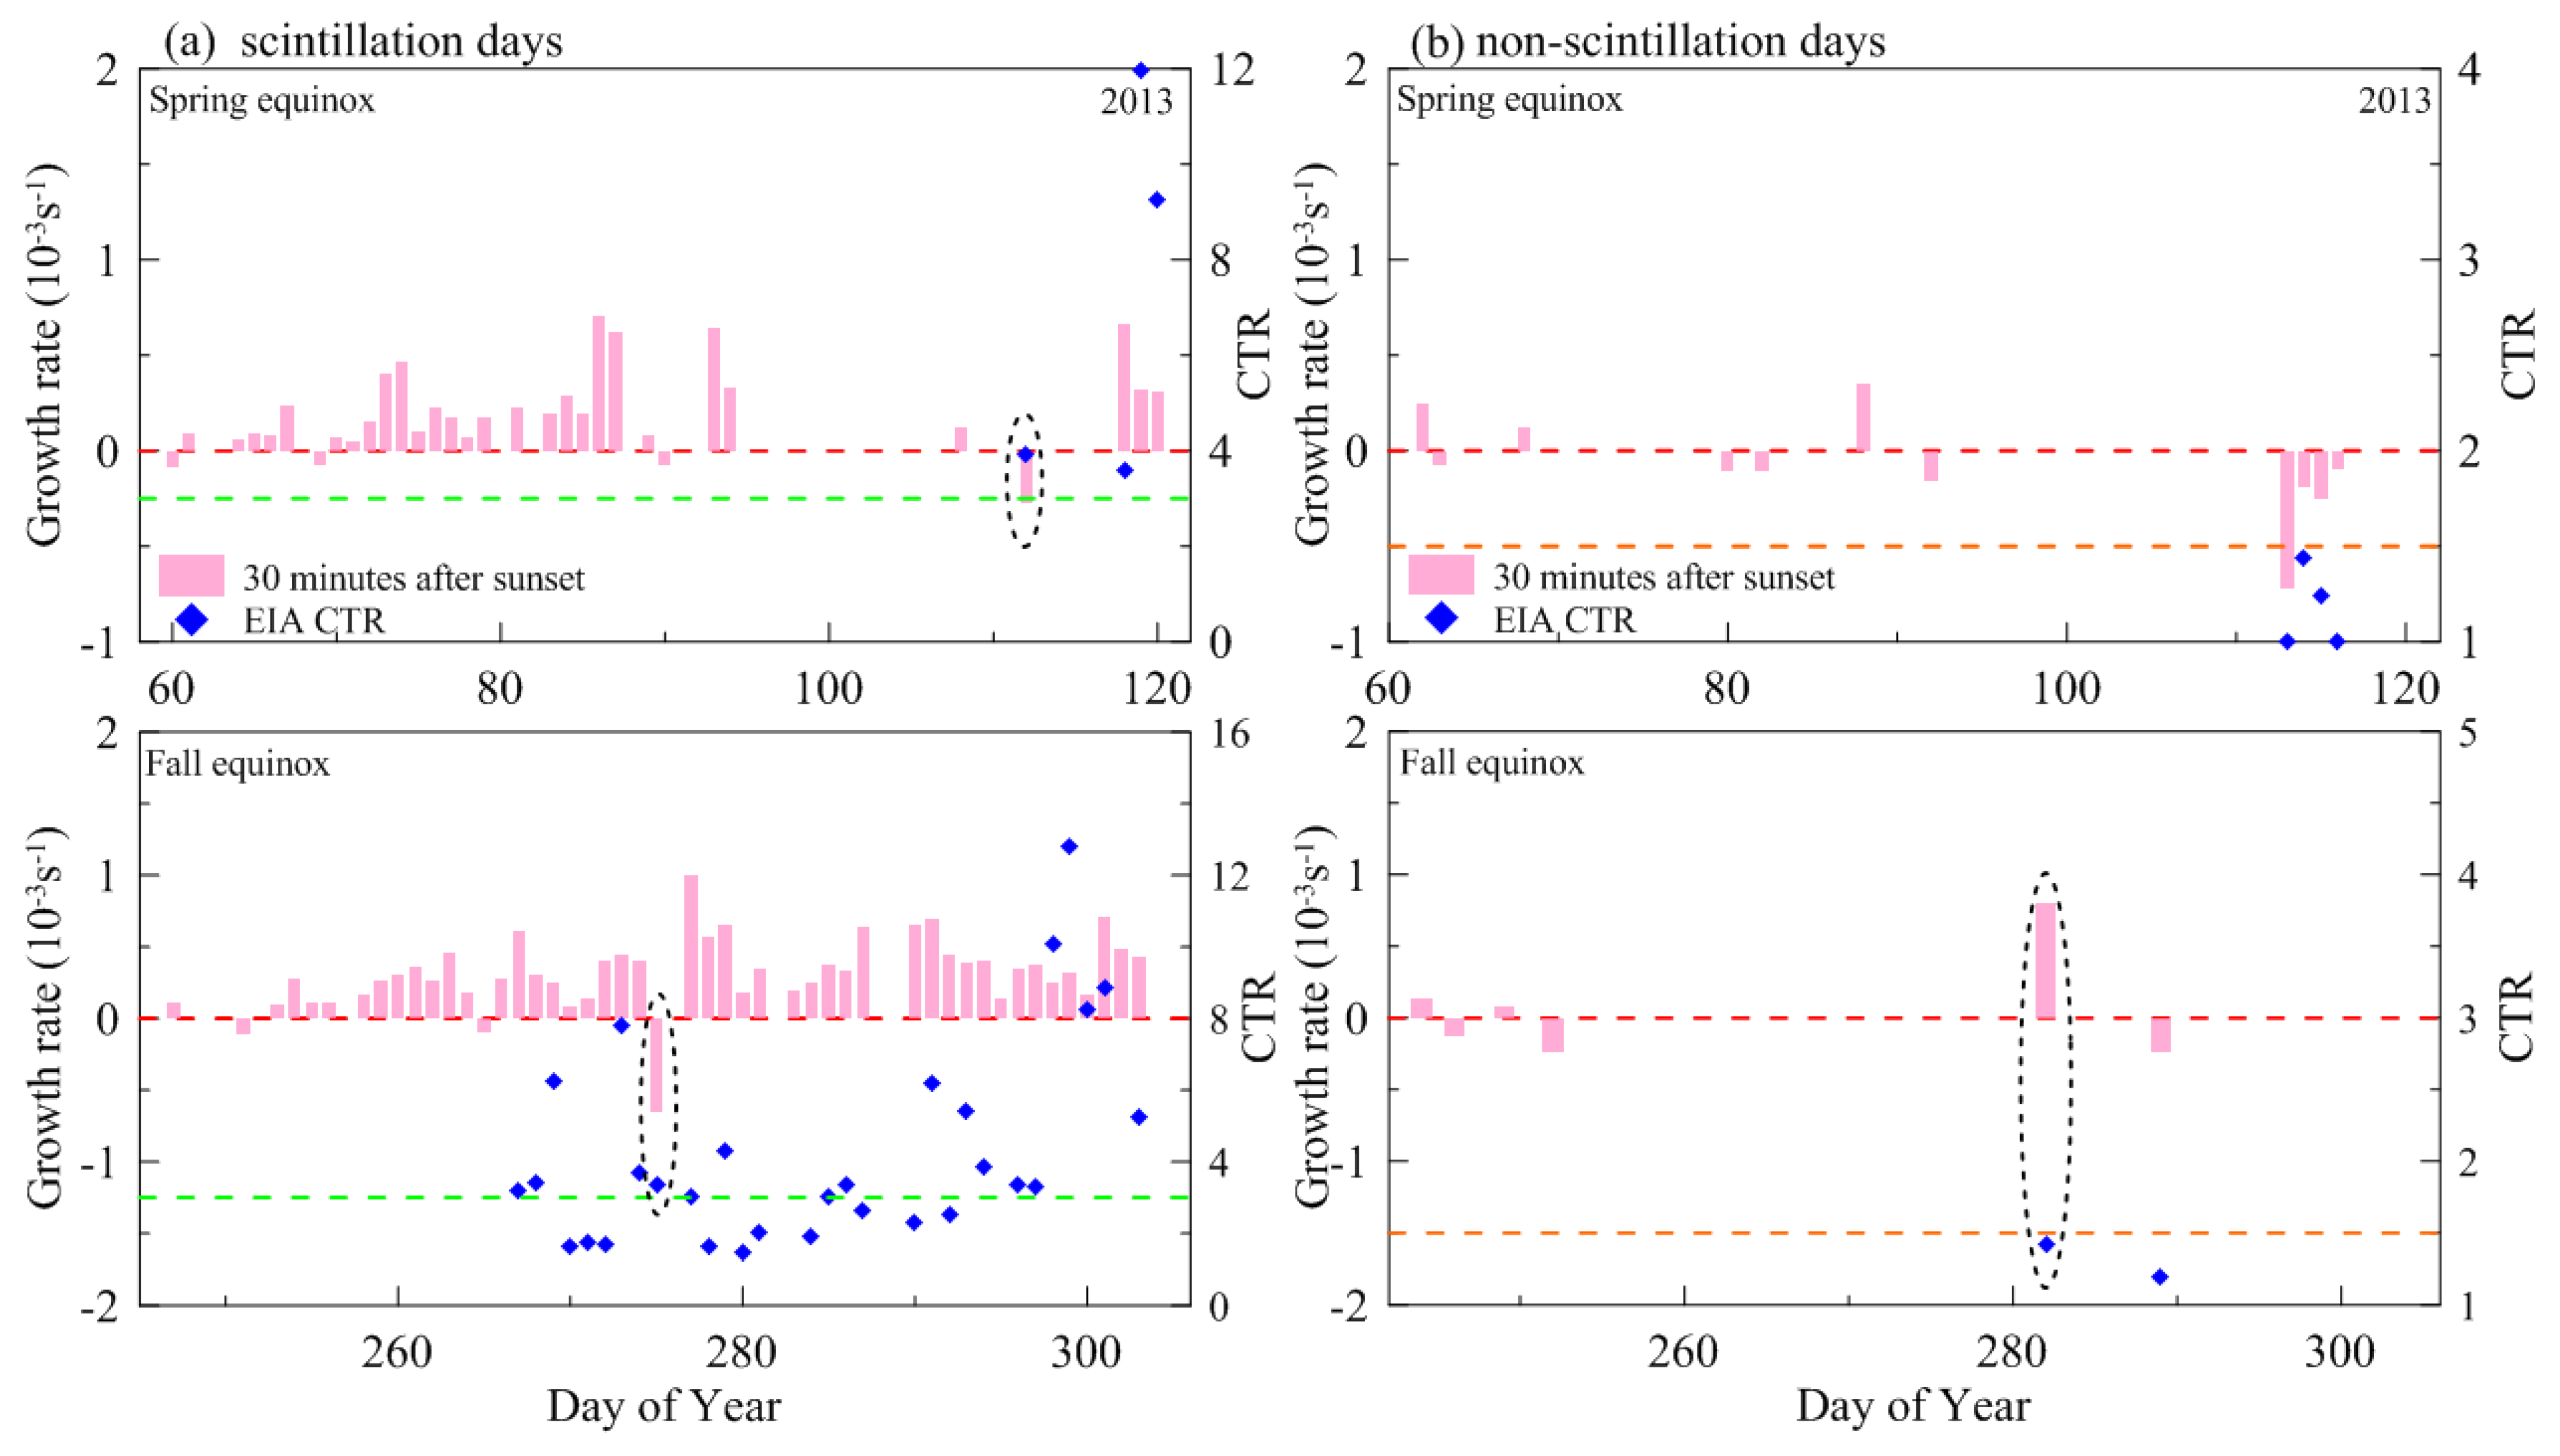
In 2012 and 2013, as displayed in Figure 5 and Figure 6, at sunset and 30 min after sunset, the growth rates were positive on most scintillation days, which implies the possibility of development of R–T instability and occurrence of irregularities, while the growth rates were negative on most of non-scintillation days, which implies the possibility of the absence of irregularities and scintillation.
Moreover, on some scintillation days in 2012, the growth rate was negative at sunset and turned positive after sunset. For example, on Day of Year (DOY) = 121, the growth rate was negative at sunset, and the growth rate became positive after 30 min. On some non-scintillation days in 2012, the growth rate was positive at sunset and turned negative after sunset. For example, on DOY63 and DOY64, the growth rates were positive at sunset, and the growth rates became negative after 30 min.
Additionally, we should note that growth rates may be negative on some scintillation days, while growth rates may be positive on some non-scintillation days. For instance, on DOY105 in 2012, DOY88 and DOY282 in 2013, the growth rates at sunset and after sunset were large (positive), but there were no scintillation activities. On DOY96 in 2012 and DOY112 in 2013, the growth rates were small (negative), but scintillation activity occurred.

3.3. The Growth Rate and Equatorial Ionization Anomaly

Valladares et al. [33] reported that UHF scintillations occurred when the CTR was larger than 2 around 70° W. Seba et al. [35] indicated that a CTR greater than 1.4 would be a good condition for the occurrence of spread-F in the African region. Based on the results displayed in Figure 3, Figure 4, Figure 5 and Figure 6, an index for predicting the occurrence of post-sunset scintillation activity (SA) is proposed in Equation (3).
SA = { γ ( CTR 1.5 ) , γ > 0 γ ( 3 CTR ) , γ < 0 ,
From Equation (3), as the growth rate is positive and CTR is larger than 1.5, or the growth rate is negative but CTR is larger than 3, the index SA is positive; scintillation will occur. On the contrary, scintillation will not occur if SA is negative, the growth rate is negative and CTR is less than 3, or the growth rate is positive and CTR is less than 1.5.
Figure 7 and Figure 8 display the day-to-day variations in simplified growth rate about 30 min after sunset and EIA CTRs derived from GRACE observations on both scintillation (a) and non-scintillation (b) days during two equinoxes in 2012 and 2013, respectively. The red dashed lines represent that the linear growth rate is equal to 0, the green and orange dashed lines represent a CTR equal to 3 and equal to 1.5, respectively.
As shown in Figure 7 and Figure 8, compared to the results shown in Figure 3 and Figure 4, we can notice that EIA CTR was larger than 3 on few scintillation days, but the growth rates were negative, while CTR was small (smaller than 1.5) on the non-scintillation days, but the growth rates were positive. For instance, on two scintillation days (DOY96 in 2012 and DOY275 in 2013, circled by the dashed lines in the figures), the growth rates were negative and the CTRs were larger than 3 (CTR = 3.2 on DOY96 and CTR = 3.34 on DOY275). On DOY248 and DOY252 in 2012 and DOY282 in 2013, non-scintillation days, the growth rates were positive and the CTRs were smaller than 2 (CTRs were 1.3 on DOY248, 1.2 on DOY252 and 1.4 on DOY282). These values imply that scintillation may occur as EIA is strong enough, though the growth rate is negative. On the contrary, scintillation may not occur as EIA is very weak, though the growth rate is positive. Therefore, to predict the occurrence of irregularities and scintillation in equatorial and low-latitude regions, the variations in EIA strength can be considered together with the growth rate of R–T instability.
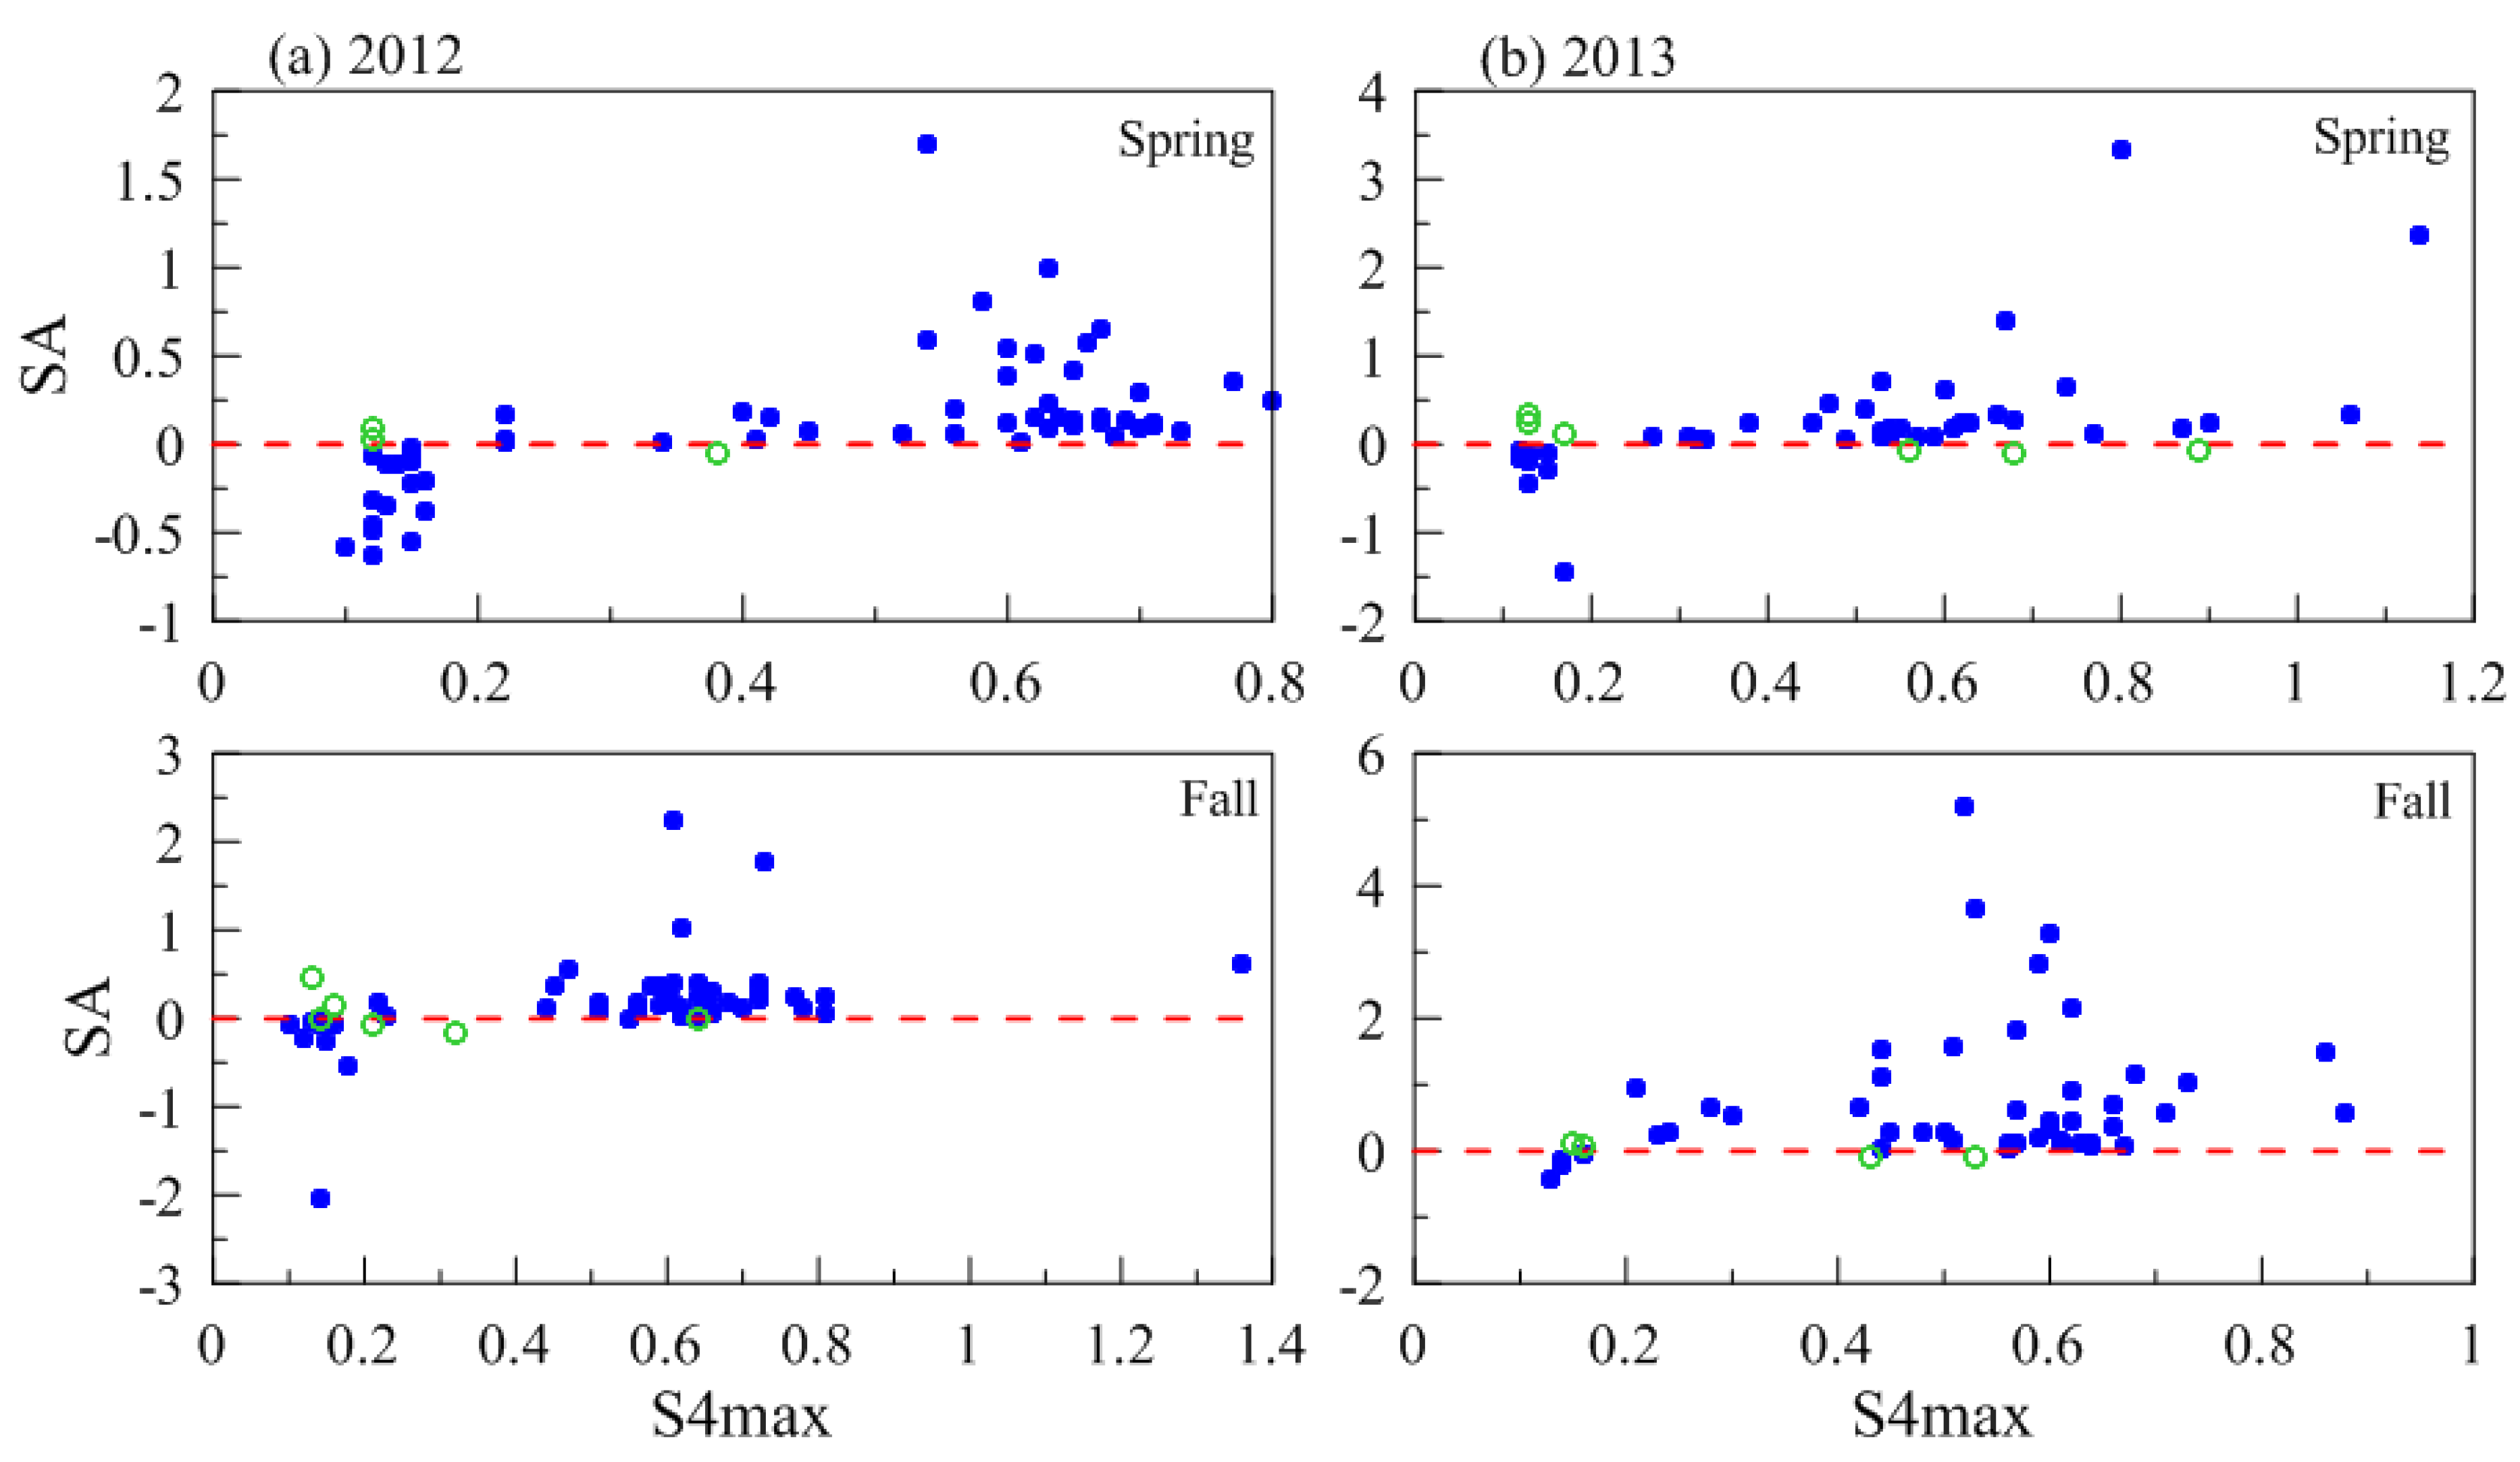
Furthermore, Figure 9 presents the variations in the index SA with S4max during the spring and fall equinoxes in 2012 (a) and 2013 (b). The blue dots represent true prediction and the green circles represent false prediction. It should be noted that there were no GRACE observations on some days, especially in 2013; we suppose that the SA is equal to the simplified growth rate (γ).
As shown in Figure 9, on most scintillation and non-scintillation days, SA gives a true prediction. In general, the index SA has a good performance during equinoctial months, which can be an indicator for predicting the occurrence of post-sunset scintillation.

4. Discussion

To date, the factors leading to the day-to-day variability in plasma irregularities have not been understood comprehensively, though it is thought that the equatorial irregularities are initiated by generalized R–T instability at the bottom of the F-layer and related to the conditions in the background ionosphere, such as ion-neutral collision, zonal electric field, neutral wind, electron density, and so on. The variations in ionospheric parameters (e.g., foF2, h’F and hmF2) are associated with the electric field (upward drift) and neutral wind. Hence, the relationship between the ionospheric parameters and the onset of irregularities and scintillation has been widely investigated based on ground- and space-based observations in different longitudinal sectors, and the ionospheric parameter is used to forecast the occurrence of post-sunset irregularities and the sequent scintillation in equatorial and low-latitude regions.
In this study, to determine whether post-sunset scintillation occurs or not, we examined the qualitative relationship between the day-to-day variability in ionospheric parameters from ionosonde observations around local sunset and the occurrence of scintillation at a low-latitude station at Sanya. As presented in Figure 1 and Figure 2, the variations in ionospheric parameters around local sunset were similar on both scintillation and non-scintillation days. Though hmF2 or h’F was large enough, e.g., h’F was significantly above 260 km shown in Figure 3 and Figure 4, scintillation was likely to occur, which was consistent with reports in previous studies [6,7,11]; it is not convincing to conclude whether scintillation will occur or not based only on one parameter (e.g., foF2, hmF2 or h’F) in a low-latitude region. It may be because the irregularities at low-latitude regions originate from the equatorial region that the occurrence of post-sunset irregularity and scintillation are directly associated with variations in parameters in the equatorial region.
The results demonstrated that it is not adequate to evaluate the occurrence/nonoccurrence of post-sunset irregularities and scintillation at low-latitude regions based only on one ionospheric parameter around local sunset. Therefore, an indicator including multiple parameters is used to predict the occurrence of irregularity and scintillation, such as the EIA strength and growth rate of R–T instability.
The linear growth rate of R–T instability is used as an index for the prediction of the occurrence of irregularities and scintillation [22], as the growth rate includes the effects of electron density, conductivity and collision, in addition to electric field and neutral wind. Based on ionosonde measurements, the day-to-day variations in the simplified growth rate of R–T instability, which include the effects of background electron density and variations in the F-layer height, can be calculated. In Figure 5 and Figure 6, the growth rates after sunset were positive on most scintillation days, while they were negative on most non-scintillation days, though the growth rates were negative on a few scintillation days and positive on a few non-scintillation days. Based on Figure 5 and Figure 6, assuming scintillation would occur because the growth rates at sunset and 30 min after sunset were positive and that scintillation would not occur because the growth rates around sunset were negative, theday numbers of true prediction and false prediction are summarized in Table 2; the accuracy rates are also calculated in the table.
From Table 2, we can notice that the overall accuracy of predictions was close in the two years, with values of about 86.2% in 2012 and 86.7% in 2013. The results imply that the growth rate of R–T instability inferred from ionosonde measurements can be a good indicator for predicting the occurrence of post-sunset irregularity and scintillation. In fact, some previous studies have shown that the simplified growth rate inferred from ionosonde measurements would be larger on ESF days than that on non-ESF days [48,49,50]. Nugent et al. [30] also proposed that the growth rates of R–T instability would provide good opportunities to forecast scintillation activity, especially after assimilating more observational data from the ionosphere and thermosphere. It also should be noted that the accuracy rate was better on scintillation days than on non-scintillation days, which implies it is not adequate to predict the occurrence of scintillation activity using the growth rate.
On the other hand, EIA strength can be linked with the occurrence of post-sunset irregularity [32] because the EIA strength is mainly associated with the zonal electric field and also meridional neutral wind. As displayed in Figure 1 and Figure 2, on most scintillation days, EIA CTR was larger than 2. However, CTR was also larger than 2 on a few non-scintillation days and CTR was less than 2 on a few scintillation days. EIA CTR can be used as an indicator for predicting the occurrence of post-sunset irregularity [33], but it is not adequate to forecast the day-to-day occurrence of post-sunset scintillation only based on EIA CTR [32].
In Table 3, based on the results shown in Figure 7, Figure 8 and Figure 9, we present the day numbers of true and false prediction of scintillation occurrence using the index SA in equinoctial months of 2012–2013, and the accuracy rates are also displayed in the table. It should be noted that there were no GRACE observations on some days, especially in 2013; we suppose that the results determined by SA are consistent with that by the simplified growth rate (γ).
Furthermore, in Table 4, we summarize the prediction accuracy using the growth rate and SA in equinoctial months of 2012–2013, respectively. The day numbers include the successful prediction of both scintillation days and non-scintillation days.
From Table 3 and Table 4, compared to the results in Table 2, we can notice that the accuracy of prediction would be enhanced by combining the variations in EIA. In 2012, the accuracy of prediction was about 86.2% using the growth rates at sunset and after sunset, while the overall prediction accuracy would increase to about 92.2% using both the growth rate and EIA CTR. In 2013, the prediction accuracy would increase to about 89.8%, based on the variations in both the growth rates and EIA CTR. In a word, the index SA, which would be better than the simplified growth rate (γ), can be a good indicator for predicting the occurrence of post-sunset scintillation activity.
In addition, it should be noted that SA could not provide an accurate prediction on some non-scintillation days, such as on DOY77 and DOY249 in 2012; the growth rates were positive and CTRs were large (larger than 2). It may imply that there should be other key factors that dominate the development of irregularities, such as gravity wave [37] or wave-like structures [8,51]. Fagundes et al. [37] reported that plasma bubbles may not occur on a day with existing strong upward E × B plasma drift, without mesospheric gravity wave. Li et al. [8] pointed out that neither Large-Scale Wave Structure (LSWS) nor the post-sunset rise of the F-layer is sufficient alone to cause the development of ESF [51]. LSWS plays a significant role in the generation and growth of equatorial F region irregularities producing ionospheric scintillation [29,52,53]. ESF or scintillation may occur during the existence of LSWS without F-layer lift (weak zonal electric field), or not occur in the absence of LSWS, though the upward drift is large.
On the other hand, the irregularities leading to scintillation in a low-latitude region may originate from the irregularities generated in the equatorial region. Thus, though the growth rate was negative on some scintillation days, scintillation also occurred, such as on DOY112 in 2013 when the growth rates were negative and the EIA strength was weak (CTR was less than 2) and scintillation occurred. It is still a challenge to forecast the scintillation activity in low-latitude regions due to the coupled thermosphere–ionosphere–magnetosphere and the motion of irregularities. With more observational data assimilated into the growth rate calculation, such as solar wind data [54,55], prediction would be more accurate.
Moreover, with the development of computer algorithms, some previous studies have developed scintillation forecasting models using data mining [56], machine learning [57] and neutral networks [58,59]. Relying on many observational data for a special region, these models may provide a prediction of the S4 value with a good accuracy rate, which is suitable for long-term prediction. The index SA is easy to calculate immediately, which is appropriate for short-term prediction.
In addition, to predict post-sunset scintillation activity, the quantitative relationship between ionospheric parameters and the variability of irregularities/scintillation should also be considered, and this is still pending. Some reports indicated that the plasma depletion amplitudes of irregularities and scintillation intensity are closely linked to the background electron density [17,18,19,20]. Whalen [60] also indicated that the daily S4 maximum(S4max) may be related to the peak electron density of the F2-layer (NmF2). Recently, Aswathy and Manju [61] reported that the average EIA crest magnitude around local sunset was linearly correlated with the S4max over 77° E. On the other hand, Khadka et al. [62] reported that scintillation intensity was not well correlated with TEC values over Jicamarca. In a recent study, Luo et al. [20] also showed that ionospheric parameters were not related to the intensity of post-sunset scintillation at Sanya, China. These studies imply that the scintillation intensity may also be related to the background parameters, however, the quantitative relationship between ionospheric parameters and the variability of irregularities and scintillation still needs to be further studied, which is out of the scope of this study.

5. Conclusions

In this study, we investigated the day-to-day variability in ionospheric parameters at local sunset, including foF2, hmF2, Hm and h’F, at a low-latitude station around 110°E (Sanya, China) during equinoctial months in high solar activity. Moreover, the simplified linear growth rate of R–T instability inferred from ground-based ionosonde measurements, and also the EIA strength derived from GRACE observations were used to discuss the possibility of prediction of the occurrence of post-sunset scintillation.
The results show that it is not adequate to predict the day-to-day occurrence of post-sunset scintillation based on only one ionospheric parameter (e.g., hmF2/h’F and EIA CTR) around local sunset in a low-latitude region, though scintillation is likely to occur when hmF2 or h’F around local sunset is large enough, e.g., hmF2 is larger than 360 km, which is consistent with some previous studies (e.g., see [6,7,11]). The simplified growth rate of R–T instability can be an indicator for the day-to-day occurrence of scintillation. Furthermore, an index (SA) including the simplified growth rate of R–T instability inferred from ionosonde measurements and EIA strength derived from GRACE observations for the prediction of the post-sunset occurrence of irregularity and scintillation is proposed, with a prediction accuracy of about 90% for 2012–2013.
Our results are useful for developing a model for forecasting the day-to-day occurrence of post-sunset plasma irregularities and scintillation in equatorial and low-latitude regions. The performances of the predicting index (SA) during low solar activities in different longitudinal sectors will be further evaluated in future studies.

Author Contributions

Conceptualization, W.L.; methodology, W.L.; software, G.J.; validation, W.L., X.Y. and Z.Z.; formal analysis, G.J. and W.L.; investigation, W.L.; resources, Z.Z.; data curation, W.L. and X.Y.; writing—original draft preparation, G.J. and W.L.; writing—review and editing, W.L. and Z.Z.; visualization, G.J. and S.C.; supervision, W.L.; project administration, W.L.; funding acquisition, W.L. All authors have read and agreed to the published version of the manuscript.

Funding

This research received no external funding.

Institutional Review Board Statement

Not applicable.

Informed Consent Statement

Not applicable.

Data Availability Statement

The ionosonde and scintillation data were provided by the Beijing National Observatory of Space Environment, Institute of Geology and Geophysics, Chinese Academy of Sciences through the Data Center for Geophysics, National Earth System Science Data Sharing Infrastructure (http://wdc.geophys.ac.cn/), we accessed on 10 December 2019. The GRACE data can be downloaded from CDAAC (https://data.cosmic.ucar.edu/gnss-ro/grace/postProc/) (accessed on 1 March 2021).

Acknowledgments

We acknowledge the use of ionosonde and GNSS scintillation data at Sanya from the Institute of Geology and Geophysics, Chinese Academy of Sciences.

Conflicts of Interest

The authors declare no conflict of interest.

References

  1. Ogwala, A.; Oyedokun, O.J.; Akala, A.O.; Amaechi, P.O.; Simi, K.G.; Panda, S.K.; Ogabi, C.; Somoye, E.O. Characterization of ionospheric irregularities over the equatorial and low latitude Nigeria region. Astrophys. Space Sci. 2022, 367, 79. [Google Scholar] [CrossRef]
  2. Retterer, J.M.; Gentile, L.C. Modeling the climatology of equatorial plasma bubbles observed by DMSP. Radio Sci. 2009, 44, RS0A31. [Google Scholar] [CrossRef]
  3. Abdu, M.A.; Iyer, K.N.; de Medeiros, R.T.; Batista, I.S.; Sobral, J.H.A. Thermospheric meridional wind control of equatorial spread F and evening prereversal electric field. Geophys. Res. Lett. 2006, 33, L07106. [Google Scholar] [CrossRef] [Green Version]
  4. Huang, C.S. Effects of the postsunset vertical plasma drift on the generation of equatorial spread F. Prog. Earth Planet. Sci. 2018, 5, 3. [Google Scholar] [CrossRef]
  5. Liu, H.L. Day-to-day variability of prereversal enhancement in the vertical ion drift in response to large-scale forcing from the lower atmosphere. Space Weather 2020, 18, e2019SW002334. [Google Scholar] [CrossRef] [Green Version]
  6. Devasia, C.V.; Jyoti, N.; Viswanathan, K.S.; Subbarao, K.S.V.; Tiwari, D.; Sridharan, R. On the plausible linkage of thermospheric meridional winds with equatorial spread F. J. Atmos. Sol.-Terr. Phys. 2002, 64, 1–12. [Google Scholar] [CrossRef]
  7. Manju, G.; Devasia, C.V.; Sridharan, R. On the seasonal variations of the threshold height for the occurrence of equatorial spread F during solar minimum and maximum years. Ann. Geophys. 2007, 25, 855–861. [Google Scholar] [CrossRef]
  8. Li, G.; Ning, B.; Abdu, M.A.; Wan, W.; Hu, L. Precursor signatures and evolution of post-sunset equatorial spread-F observed over Sanya. J. Geophys. Res. Space Phys. 2012, 117, A08321. [Google Scholar] [CrossRef]
  9. Anderson, D.N.; Reinisch, B.; Valladare, C.; Chau, J.; Veliz, O. Forecasting the occurrence of ionospheric scintillation activity in the equatorial ionosphere on a day-to-day basis. J. Atmos. Sol.-Terr. Phys. 2004, 66, 1567–1572. [Google Scholar] [CrossRef]
  10. Tulasi Ram, S.; Rama Rao, P.V.S.; Niranjan, K.; Prasad, D.S.V.V.D.; Sridharan, R.; Devasia, C.V.; Ravindran, S. The role of post-sunset vertical drifts at the equator in predicting the onset of VHF scintillations during high and low sunspot activity years. Ann. Geophys. 2006, 24, 1609–1616. [Google Scholar] [CrossRef] [Green Version]
  11. Anderson, D.N.; Redmon, R.J. Forecasting scintillation activity and equatorial spread F. Space Weather 2017, 15, 495–502. [Google Scholar] [CrossRef]
  12. Redmon, R.J.; Anderson, D.; Caton, R.; Bullett, T. A forecasting ionospheric real-time scintillation tool (FIRST). Space Weather 2010, 8, S12003. [Google Scholar] [CrossRef]
  13. Bagiya, M.S.; Sridharan, R.; Sunda, S. Pre-assessment of the “strength” and “latitudinal extent” of L-band scintillation: A case study. J. Geophys. Res. Space Phys. 2013, 118, 488–495. [Google Scholar] [CrossRef] [Green Version]
  14. Sridharan, R.; Bagiya, M.S.; Sunda, S.; Choudhary, R.; Pant, T.K.; Jose, L. First results on forecasting the spatial occurrence pattern of L-band scintillation and its temporal evolution. J. Atmos. Sol.-Terr. Phys. 2014, 119, 53–62. [Google Scholar] [CrossRef]
  15. Zhao, X.; Li, G.; Xie, H.; Hu, L.; Sun, W.; Yang, S.; Li, Y.; Ning, B.; Takahashi, H. The prediction of day-to-day occurrence of low latitude ionospheric strong scintillation using gradient boosting algorithm. Space Weather 2021, 19, 12. [Google Scholar] [CrossRef]
  16. Abdu, M.A.; Kherani, E.A.; Sousasantos, J. Role of bottom-side density gradient in the development of equatorial plasma bubble/spread F (ESF) irregularities: Solar minimum and maximum conditions. J. Geophys. Res. Space Phys. 2020, 125, e2020JA027773. [Google Scholar] [CrossRef]
  17. Olwndo, J.; Cilliers, P.J.; Ming, O. Comparison of ground-based ionospheric scintillation observations with in situ electron density variations as measured by the Swarm satellites. Radio Sci. 2019, 54, 852–866. [Google Scholar] [CrossRef]
  18. Hu, L.; Zhao, X.; Sun, W.; Wu, Z.; Zheng, J.; Xie, H.; Huang, Z.; Ning, B.; Li, G. Statistical characteristics and correlation of low-latitude F region bottom-type irregularity layers and plasma plumes over Sanya. J. Geophys. Res. Space Phys. 2020, 125, e2020JA027855. [Google Scholar] [CrossRef]
  19. Li, G.; Ning, B.; Otsuka, Y.; Abdu, M.A.; Abadi, P.; Liu, Z.; Spogli, L.; Wan, W. Challenges to equatorial plasma bubble and ionospheric scintillation short-term forecasting and future aspects in East and Southeast Asia. Surv. Geophys. 2021, 42, 201–238. [Google Scholar] [CrossRef]
  20. Luo, J.; Xiong, Y.; Luo, W.; Zhu, Z.; Fan, C. Relationships between ionospheric parameters derived from ionosonde observations and characteristics of post-sunset GHz scintillation during high solar acitivities (2012–2013) at Sanya (18.3° N, 109.6° E), China. Earth Planet. Phys. 2023, 7, 389–406. [Google Scholar] [CrossRef]
  21. Sultan, P.J. Linear theory and modeling of the Rayleigh-Taylor instability leading to the occurrence of the equatorial spread F. J. Geophys. Res. Space Phys. 1996, 101, 26875–26891. [Google Scholar] [CrossRef]
  22. Basu, S. On the linear theory of equatorial plasma instability: Comparison of different descriptions. J. Geophys. Res. Space Phys. 2002, 107, 1199. [Google Scholar] [CrossRef]
  23. Retterer, J.M. Physics-based forecasts of equatorial radio scintillation for the Communication and Navigation Outage Forecasting System (C/NOFS). Space Weather 2005, 3, S12C03. [Google Scholar] [CrossRef]
  24. Luo, W.; Xu, J.S.; Zhu, Z.P. Theoretical modeling of the occurrence of equatorial and low-latitude ionospheric irregularity and scintillation. Chin. J. Geophys. 2013, 56, 2892–2905. (In Chinese) [Google Scholar] [CrossRef]
  25. Carter, B.A.; Yizengaw, E.; Retterer, J.M.; Francis, M.; Terkildsen, M.; Marshall, R.; Norman, R.; Zhang, K. An analysis of the quiet time day-to-day variability in the formation of postsunset equatorial plasma bubbles in the Southeast Asian region. J. Geophys. Res. Space Phys. 2014, 119, 3206–3223. [Google Scholar] [CrossRef]
  26. Carter, B.A.; Currie, J.L.; Dao, T.; Yizengaw, E.; Retterer, J.; Terkildsen, M.; Groves, K.; Caton, R. On the assessment of daily equatorial plasma bubble occurrence modeling and forecasting. Space Weather 2020, 18, e2020SW002555. [Google Scholar] [CrossRef]
  27. Wu, Q. Longitudinal and seasonal variation of the equatorial flux tube integrated Rayleigh-Taylor instability growth rate. J. Geophys. Res. Space Phys. 2015, 120, 7952–7957. [Google Scholar] [CrossRef]
  28. Shinagawa, H.; Jin, H.; Miyoshi, Y.; Fujiwara, H.; Yokoyama, T.; Otsuka, Y. Daily and seasonal variations in the linear growth rate of the Rayleigh-Taylor instability in the ionosphere obtained with GAIA. Prog. Earth and Planet. Sci. 2018, 5, 16. [Google Scholar] [CrossRef]
  29. Das, S.K.; Patra, A.K.; Niranjan, K. On the assessment of day-to-day occurrence of equatorial plasma bubble. J. Geophys. Res. Space Phys. 2021, 126, e2021JA029129. [Google Scholar] [CrossRef]
  30. Nugent, L.D.; Elvidge, S.; Angling, M.J. Comparison of low-latitude ionospheric scintillation forecasting techniques using a physics-based model. Space Weather 2021, 19, e2020SW002462. [Google Scholar] [CrossRef]
  31. Thampi, S.V.; Ravindram, S.; Pant, T.K.; Devasia, C.V.; Sreelatha, P.; Sridharan, R. Deterministic prediction of post-sunset ESF based on the strength and asymmetry of EIA from ground based TEC measurements: Preliminary results. Geophys. Res. Lett. 2006, 33, L13103. [Google Scholar] [CrossRef]
  32. Luo, W.; Li, H.; Xiong, H.; Zhu, Z.; Yu, X.; Chang, S. Linkage of equatorial ionization anomaly with the day-to-day occurrence of postsunset irregularities and scintillation in low-latitude region around 110° E. Space Weather 2022, 20, e2022SW003192. [Google Scholar] [CrossRef]
  33. Valladares, C.E.; Sheehan, R.; Villalobos, J. A latitudinal network of GPS receivers dedicated to studies of equatorial spread-F. Radio Sci. 2004, 39, RS1S23. [Google Scholar] [CrossRef]
  34. Paul, A.; DasGupta, A. Characteristics of the equatorial ionization anomaly in relation to the day-to-day variability of ionospheric irregularities around the postsunset period. Radio Sci. 2010, 45, RS6001. [Google Scholar] [CrossRef]
  35. Seba, E.B.; Nigussie, M.; Moldwin, M.B. The relationship between equatorial ionization anomaly and nighttime equatorial spread F in East Africa. Adv. Space Res. 2018, 62, 1737–1752. [Google Scholar] [CrossRef]
  36. Vankadara, R.K.; Panda, S.K.; Amory-Mazaudier, C.; Fleury, R.; Devanadoyina, V.R.; Pant, T.K.; Jamjareegulgarn, P.; Haq, M.A.; Okoh, D.; Seemala, G.K. Signature of equatorial plasma bubbles and ionospheric scintillations from magnetometer and GNSS observations in the Indian Longitudes during the space weather events of early September 2017. Remote Sens. 2022, 14, 652. [Google Scholar] [CrossRef]
  37. Fagundes, P.R.; Sahai, Y.; Batista, I.S.; Abdu, M.A.; Bittencourt, J.A.; Takahashi, H. Observations of day-to-day variability in the precursor signatures to equatorial F-region plasma depletions. Ann. Geophys. 1999, 17, 1053–1063. [Google Scholar] [CrossRef]
  38. Smith, J.M.; Rodrigues, F.S.; Fejer, B.G.; Milla, M.A. Coherent and incoherent scatter radar study of the climatology and day-to-day variability of mean F region vertical drifts and equatorial spread F. J. Geophys. Res. Space Phys. 2016, 121, 1466–1482. [Google Scholar] [CrossRef] [Green Version]
  39. Zhang, Y.; Wan, W.; Li, G.; Liu, L.; Hu, L.; Ning, B.A. comparative study of GPS ionospheric scintillations and ionogram spread F over Sanya. Ann. Geophys. 2015, 33, 1421–1430. [Google Scholar] [CrossRef] [Green Version]
  40. Wang, N.; Guo, L.; Zhao, Z.; Ding, Z.; Lin, L. Spread-F occurrences and relationships with foF2 and h’F at low- and mid-latitudes in China. Earth Planets Space 2018, 70, 59. [Google Scholar] [CrossRef]
  41. Li, G.; Ning, B.; Liu, L.; Zhao, B.; Yue, X.; Su, S.Y.; Venkatraman, S. Correlative study of plasma bubbles, evening equatorial ionization anomaly, and equatorial prereversal E×B drifts at solar maximum. Radio Sci. 2008, 43, RS4005. [Google Scholar] [CrossRef]
  42. Liu, K.; Li, G.; Ning, B.; Hu, L.; Li, H. Statistical characteristics of low-latitude ionospheric scintillation over China. Adv. Space Res. 2015, 55, 1356–1365. [Google Scholar] [CrossRef]
  43. Bittencourt, J.A.; Abdu, M.A. A theoretical comparison between apparent and real vertical ionization drift velocities in the equatorial F region. J. Geophys. Res. Space Phys. 1981, 86, 2451–2454. [Google Scholar] [CrossRef] [Green Version]
  44. Galkin, I.A.; Kozlov, G.M.; Reinisch, B.W.; Huang, X.; Paznukhov, V.V. The ARTIST 5. AIP Conf. Proc. 2008, 974, 150–159. [Google Scholar] [CrossRef]
  45. Tapley, B.D.; Bettadpur, S.; Watkins, M.; Reigber, C. The gravity recovery and climate experiment: Mission overview and early results. Geophys. Res. Lett. 2004, 31, L09607. [Google Scholar] [CrossRef] [Green Version]
  46. Xiong, C.; Park, J.; Lühr, H.; Stolle, C.; Ma, S.Y. Comparing plasma bubble occurrence rates at CHAMP and GRACE altitudes during high and low solar activity. Ann. Geophys. 2010, 28, 1647–1658. [Google Scholar] [CrossRef] [Green Version]
  47. Xiong, C.; Lühr, H.; Fejer, B.G. Validation of GRACE electron densities by incoherent scatter radar data and estimation of plasma scale height in the topside ionosphere. Adv. Space Res. 2015, 55, 2048–2057. [Google Scholar] [CrossRef]
  48. Xiong, C.; Lühr, H.; Ma, S.Y. The magnitude and inter-hemispheric asymmetry of equatorial ionization anomaly- based on CHAMP and GRACE observations. J. Atmos. Sol.-Terr. Phys. 2013, 105–106, 160–169. [Google Scholar] [CrossRef]
  49. Abdu, M.A.; De Medeiros, R.T.; Sobral, J.H.A. Equatorial spread F instability conditions as determined from ionograms. Geophys. Res. Lett. 1982, 9, 692–695. [Google Scholar] [CrossRef] [Green Version]
  50. Jayachandran, J.; Balan, N.; Rao, P.B.; Sastri, J.H.; Baliey, G.J. HF Doppler and ionosonde observations on the onset conditions of equatorial spread F. J. Geophys. Res. Space Phys. 1993, 98, 13741–13750. [Google Scholar] [CrossRef] [Green Version]
  51. Narayanan, V.L.; Taori, A.; Patra, A.K.; Emperumal, K.; Gurubaran, S. On the importance of wave-like structures in the occurrence of equatorial plasma bubbles: A case study. J. Geophys. Res. Space Phys. 2012, 117, A01306. [Google Scholar] [CrossRef] [Green Version]
  52. Tsunoda, R.T.; Yamamoto, M.; Tsugawa, T.; Hong, T.L.; Tulasi Ram, S.; Thampi, S.V.; Chau, H.D.; Nagatsuma, T. On seeding, large-scale wave structure, equatorial spread F, and scintillations over Vietnam. Geophys. Res. Lett. 2011, 38, L20102. [Google Scholar] [CrossRef]
  53. Das, S.K.; Reddy, G.J.; Patra, A.K.; Niranjan, K. Onset condition and features of equatorial F region irregularities: New insight from collocated Digisonde and radar observations from Gadanki. J. Geophys. Res. Space Phys. 2022, 127, e2021JA029715. [Google Scholar] [CrossRef]
  54. Kelley, M.C.; Retterer, J. First successful prediction of a convective equatorial ionospheric storm using solar wind parameters. Space Weather 2008, 6, S08003. [Google Scholar] [CrossRef]
  55. Zhang, K.; Wang, H.; Wang, W. Equatorial nighttime thermospheric zonal wind jet response to the temporal oscillation of solar wind. J. Geophys. Res. Space Phys. 2021, 126, e2021JA029345. [Google Scholar] [CrossRef]
  56. Rezende, L.F.C.; de Paula, E.R.; Stephany, S.; Kantor, I.J.; Muella, M.T.A.H.; de Siqueira, P.M.; Correa, K.S. Survey and prediction of the ionospheric scintillation using data mining techniques. Space Weather 2010, 8, S06D09. [Google Scholar] [CrossRef]
  57. Taabu, S.D.; Dujanga, F.M.; Ssenyonga, T. Prediction of ionospheric scintillation using neutral network over East African region during ascending phase of sunspot cycle 24. Adv. Space Res. 2016, 57, 1570–1584. [Google Scholar]
  58. McGranaghan, R.M.L.; Mannucci, A.J.; Wilson, B.; Mattmann, C.A.; Chadwick, R. New capabilities for prediction of high-latitude ionospheric scintillation: A novel approach with machine learning. Space Weather 2018, 16, 1817–1846. [Google Scholar] [CrossRef] [Green Version]
  59. Sridhar, M.; Ratnam, D.V.; Raju, K.P.; Praharsha, D.S.; Saathvika, K. Ionospheric scintillation forecasting model based on NN-PSO technique. Astrophys. Space Sci. 2017, 362, 166. [Google Scholar] [CrossRef]
  60. Whalen, J.A. The linear dependence of GHz scintillation on electron density observed in the equatorial anomaly. Ann. Geophys. 2009, 27, 1755–1761. [Google Scholar] [CrossRef] [Green Version]
  61. Aswathy, R.P.; Manju, G. Equatorial ionization anomaly crest magnitude and its implications on the nocturnal equatorial ionospheric plasma irregularity characteristics. Adv. Space Res. 2021, 68, 4129–4136. [Google Scholar] [CrossRef]
  62. Khadka, S.M.; Valladares, C.; Pradipta, R.; Pachero, E.; Condo, P. On the mutual relationship of the equatorial electrojet TEC and scintillation in the Peruvian sector. Radio Sci. 2016, 51, 742–751. [Google Scholar] [CrossRef] [Green Version]
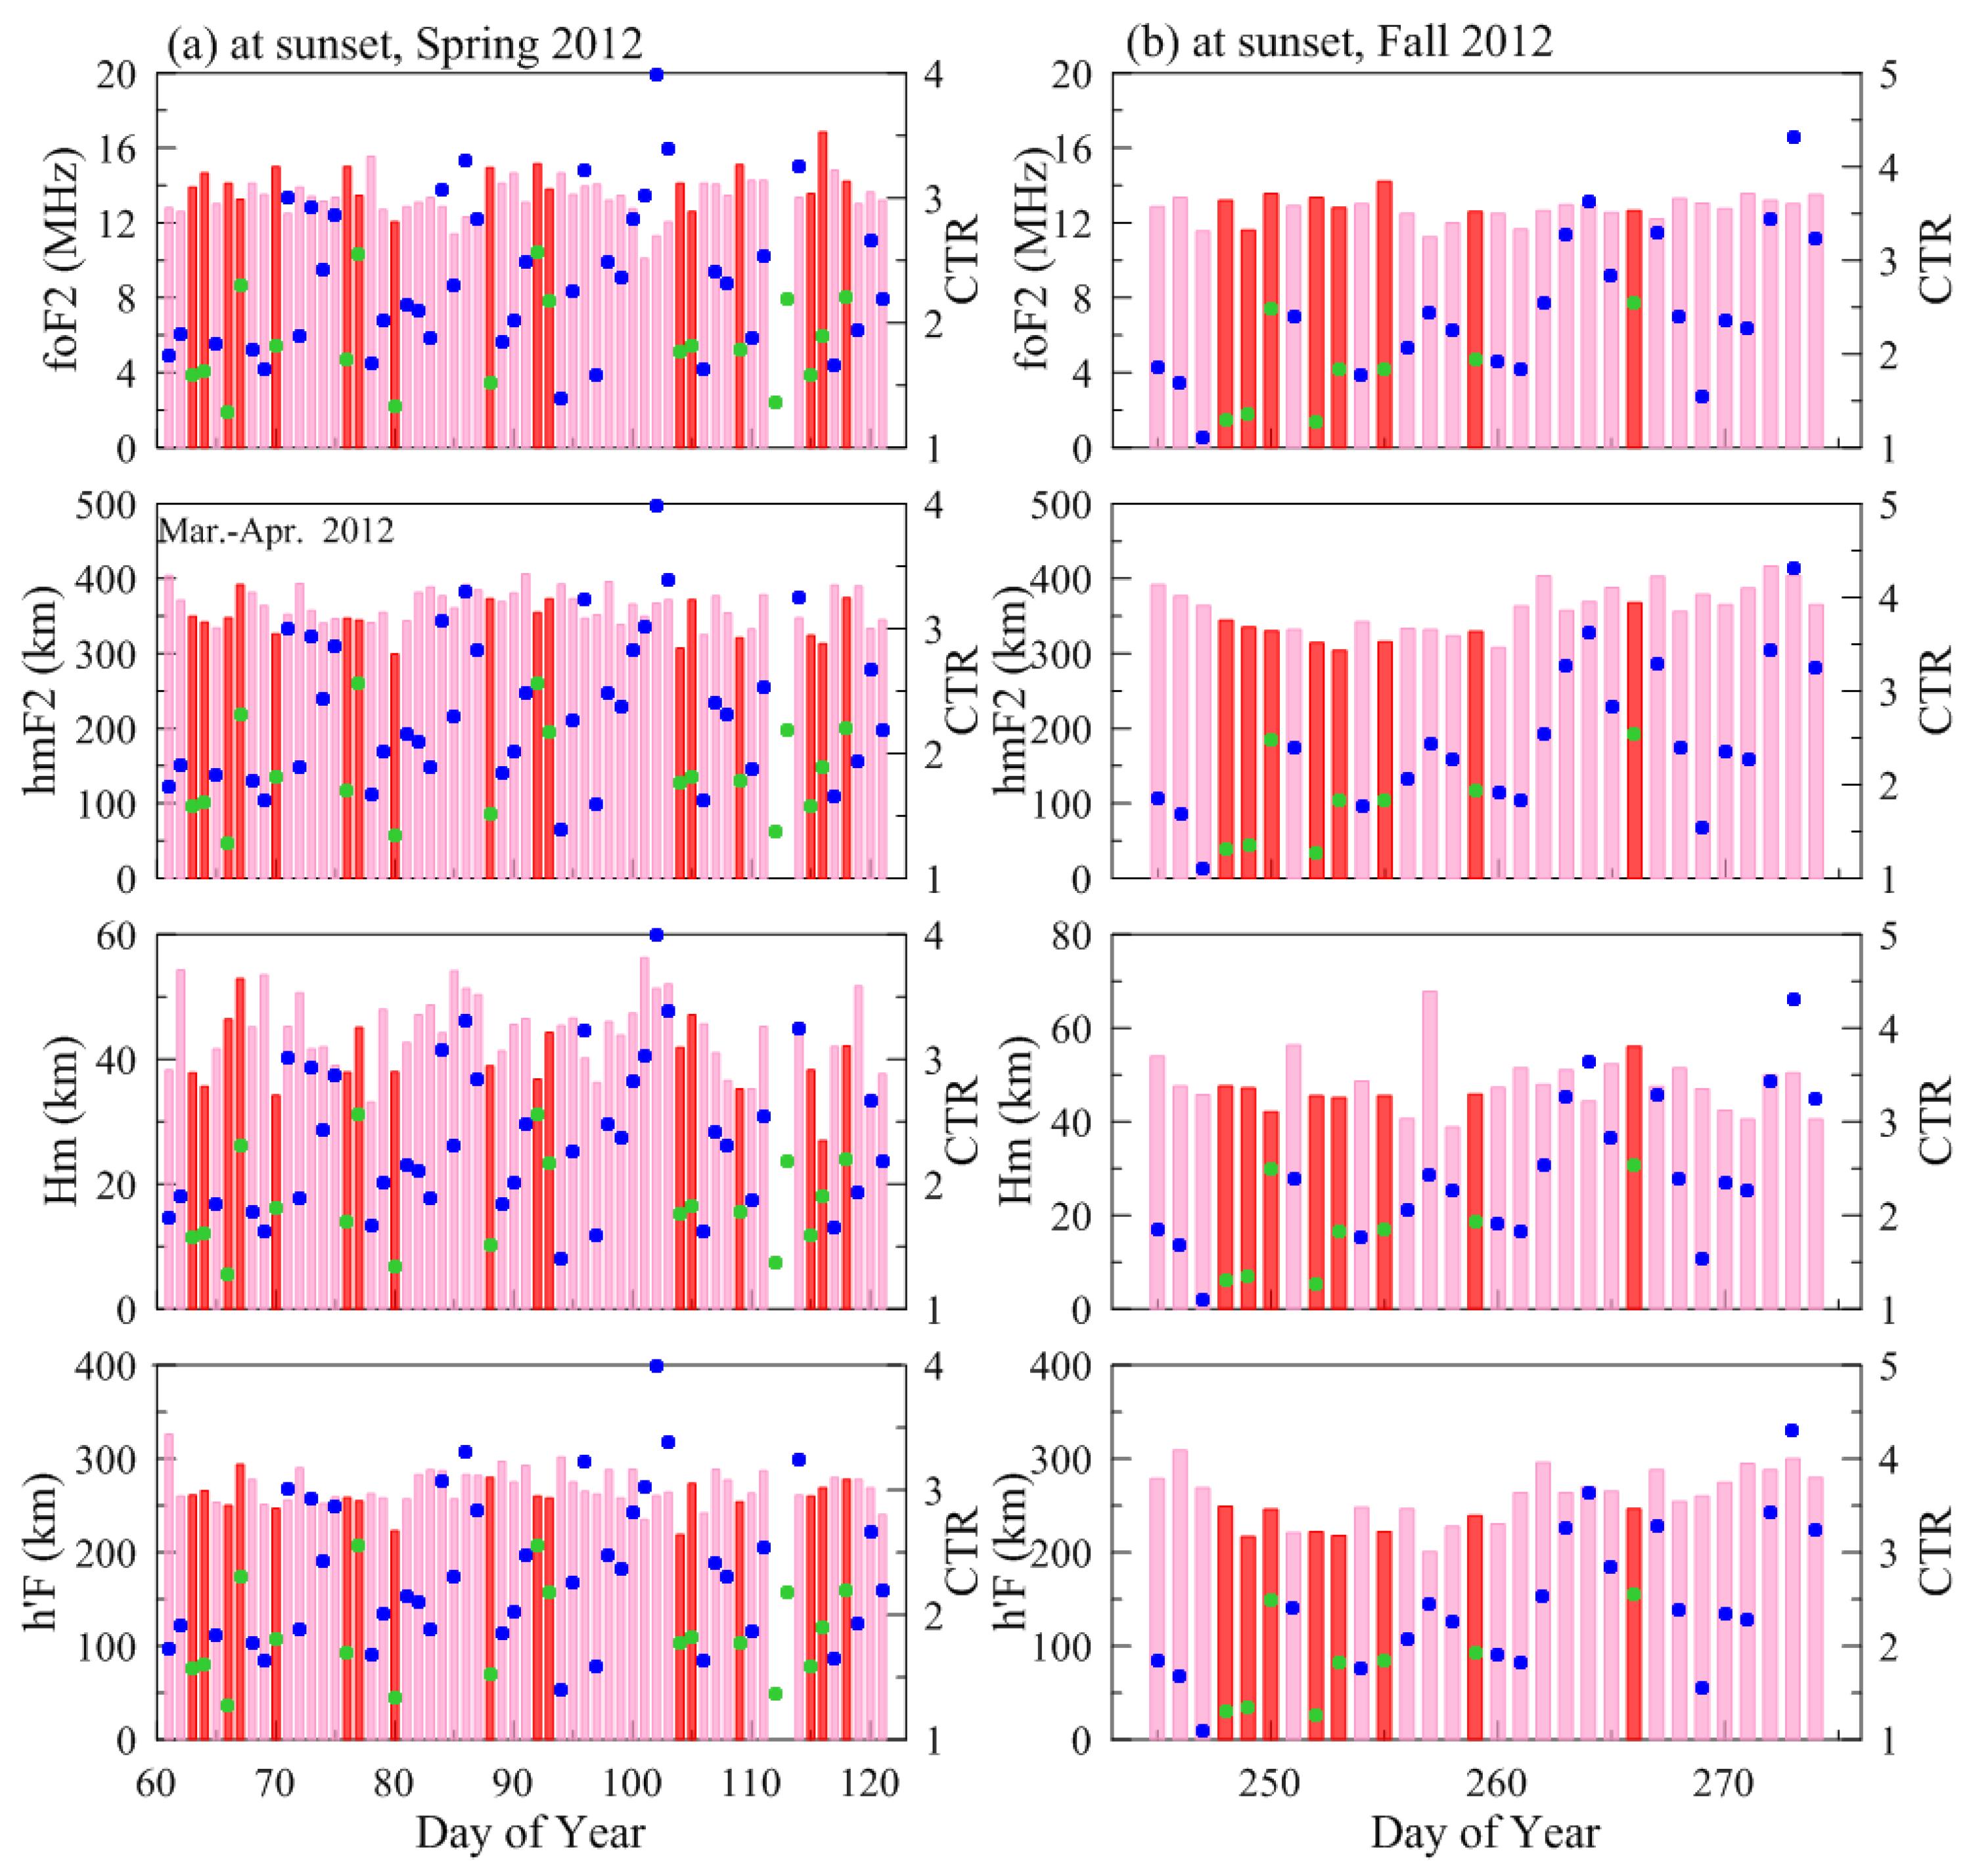
Figure 1. Day-to-day variations in foF2, hmF2, Hm and h’F at sunset on both scintillation and non–scintillation days during spring (a) and fall (b) equinox in 2012. EIA CTRs derived from GRACE observations are also marked in the figure. The pink and red bars represent the parameters, and the blue dots and green dots represent the CTR on scintillation and non-scintillation days, respectively.
Atmosphere 14 01242 g001
Figure 2. Same as Figure 1, but in 2013.
Atmosphere 14 01242 g002
Figure 3. Variations in foF2, hmF2, Hm and h’F at the time 30 min after sunset with the daily maximum S4 (S4max) on both scintillation and non-scintillation days during spring (a) and fall (b) equinox in 2012.
Atmosphere 14 01242 g003
Figure 4. Same as Figure 3, but in 2013.
Atmosphere 14 01242 g004
Figure 5. The day-to-day variations in growth rates from ionosonde measurements at sunset (blue, orange dots), 15 min after sunset (red, magenta rectangles) and 30 min after sunset (pink, green bars) on scintillation (a) and non−scintillation (b) days during equinoctial months in 2012. The red dashed lines represent that the growth rates were equal to zero. The dashed-line circles represent the abnormal days.
Atmosphere 14 01242 g005
Figure 6. Same as Figure 5, but in 2013.
Atmosphere 14 01242 g006
Figure 7. The day−to−day variations in growth rates from ionosonde measurements at the time about 30 min after sunset onboth (a) scintillation and (b) non−scintillation days, during equinoctial months in 2012. EIA CTRs from GRACE observations are also marked as blue rectangles in the figure. The red dashed lines represent that the growth rates were equal to zero, and the green and orange dashed lines represent a CTR equal to 3 and 1.5, respectively. The dashed-line circles represent the abnormal days.
Atmosphere 14 01242 g007
Figure 8. Same as Figure 7, but in 2013.
Atmosphere 14 01242 g008
Figure 9. Variations in SA with S4max during spring and fall equinoxes in 2012 (a) and 2013 (b). Blue dots represent true prediction and the green circles represent false prediction. The red dashed lines represent that the SA is equal to 0.
Atmosphere 14 01242 g009
Table 1. Dataset of ground-based observations in equinoctial months of 2012–2013.
Spring Equinox
(March–April)
Fall Equinox
(September–October)
Total
201220132012201320122013
Scintillation days413344488581
Non-scintillation days18111363117
Total59445754214
Table 2. Prediction accuracy using γ around sunset in equinoctial months of 2012–2013.
Spring EquinoxFall EquinoxTotal
201220132012201320122013
Scintillation daysTrue (γ > 0)392942458174
False (γ < 0)242347
Non-scintillation daysTrue (γ < 0)138631911
False (γ > 0)5373126
Accuracy rate (%)88.184.184.288.986.286.7
Table 3. Prediction accuracy using SA in equinoctial months of 2012–2013.
Spring EquinoxFall EquinoxTotal
201220132012201320122013
Scintillation daysTrue (SA > 0)403041468276
False (SA < 0)133235
Non-scintillation daysTrue (SA < 0)1681042512
False (SA > 0)233265
Accuracy rate (%)94.986.489.592.692.289.8
Table 4. Comparison of prediction accuracy using γ and SA in equinoctial months of 2012–2013.
Spring EquinoxFall EquinoxTotal
201220132012201320122013
Days of successful prediction using γ 5437484810285
Days of successful prediction using SA5638515010788
Total data records5944575411698
Disclaimer/Publisher’s Note: The statements, opinions and data contained in all publications are solely those of the individual author(s) and contributor(s) and not of MDPI and/or the editor(s). MDPI and/or the editor(s) disclaim responsibility for any injury to people or property resulting from any ideas, methods, instructions or products referred to in the content.