Article

Spatial and Temporal Variability of Extreme Precipitation Events in the Southeastern United States

by
Mohammad Siddiqur Rahman
1,
Jason C. Senkbeil
1,* and
David J. Keellings
2
1
Department of Geography, University of Alabama, Tuscaloosa, AL 35487, USA
2
Department of Geography, University of Florida, Gainesville, FL 32611, USA
*
Author to whom correspondence should be addressed.
Atmosphere 2023, 14(8), 1301; https://doi.org/10.3390/atmos14081301
Submission received: 12 July 2023 / Revised: 31 July 2023 / Accepted: 10 August 2023 / Published: 17 August 2023
(This article belongs to the Section Climatology)

Abstract

:
Much of the Southeastern United States (SeUS) has experienced an increasing number of extreme precipitation events in recent decades. Characterizing these extreme precipitation events is critical for assessing risk from future hydroclimatic extremes and potential flash flooding. A threshold of one inch per hour (1IPH) was used to indicate an extreme precipitation event. Non-parametric tests were run to identify trends in 1IPH event frequency and locate time series change points. In the last 20 years, 1IPH events increased by 53 percent in the SeUS, and 21/61 stations recorded significant increasing trends. A change point is identified in 15/61 stations. June, July, and August are generally the peak time for 1IPH events, but Florida, Louisiana, and Mississippi recorded longer peak seasons. For the time between events, 17/61 stations recorded significant decreasing trends, implying that 1IPH events are increasing in frequency. Four teleconnection indices were positively correlated with 1IPH events. The SeUS experiences considerable tropical cyclone-induced extreme precipitation, yet only seven percent of 1IPH events overlapped with tropical cyclones. Therefore, the increasing frequency of 1IPH events is likely the result of a combination of baroclinic frontal zones or regional and mesoscale convective features. Causes for the increasing frequency of 1IPH events require further research.

1. Introduction

Extreme precipitation events are becoming more intense and more frequent due to climate change [1,2,3]. Variability and changes in heavy precipitation bring unwanted hydrological extremes [4]. Around 700 million people live in places where the annual maximum one-day extreme precipitation has increased globally since 1950 [5]. In the last four decades, average annual extreme weather events have doubled in the United States (hereafter, US) [6]. The southeastern part of the US (SeUS) is especially vulnerable to extreme hydrological events [7]. In particular, one-inch per hour (1IPH) rainfall events (defined here as being ≥1” per hour [8]) are a major societal problem due to often short forecast lead times and uncertainty in predictive capabilities [9]. Furthermore, extreme precipitation is particularly hazardous in urban areas with impervious surfaces and less drainage density, which can easily lead to flash flooding events. In addition to large societal and environmental impacts, these extreme hydrological events’ frequency, intensity, magnitude, and extent are changing spatiotemporally. Thus, the necessity of understanding the nature of these events is increasingly important [10,11].
Understanding 1IPH rainfall change is particularly important because of its contribution to shaping extreme hydrological events. Due to the damage caused by high-impact events, heavy precipitation frequency, magnitude, and intensity have been researched extensively in the United States, and findings reported changes in the status of trends for different regions. Precipitation day indices show downward trends in the SeUS, and most Northeastern and Midwestern states show upward trends in extreme precipitation day indices [12]. The top 1% of precipitation events for the Northeast United States indicate that these precipitation events have increased both in frequency (count) and in magnitude for the study area from 1979 to 2014 for 58 sites [11]. More specifically, daily rainfall events ≥150 mm have increased from an average of six events per year for the period of 1979–1996 to an average of 25 events per year in the period of 1997–2014.
Previous studies conducted in the SeUS primarily focused on the changing behavior of precipitation days and total indices. In the SeUS, the intensity, magnitude, and frequency of heavy precipitation days and events have increased [13], except in some parts of South Carolina [2]. Another study noted that 36 percent of the stations showed statistically significant increasing trends, while none of the stations recorded significant decreasing trends in the last 57 years using 90th percentile hourly precipitation data in the SeUS [14]. From 1960 to 2017, hourly intensity and average hourly accumulation increased in more than 40 percent of the sites, while the average duration of the precipitation events decreased in 82 percent of the sites [15]. It is evident that there has been an increase in heavy precipitation events in the SeUS.
Since the Atlantic Ocean and the Gulf of Mexico surround the SeUS, seasonal, annual, and decadal precipitation is impacted by the behavior of the Atlantic Multidecadal Oscillation (AMO), El Niño Southern Oscillation (ENSO), and Pacific Decadal Oscillation (PDO) among other teleconnections and climatic influences. Extreme precipitation events in the US were mainly influenced by the AMO and PDO with natural interdecadal variability. Also, the phase reversals of the AMO and PDO in the late 1990s were favorable to an increase in extreme precipitation events across the northern Gulf coast and portions of the SeUS [16]. However, no significant seasonal differences observed in extreme precipitation in five SeUS states were due to phase changes of ENSO in two 30-year periods (1955–1984 and 1985–2014) [17]. Studies also suggested that extreme precipitation events of the SeUS are more influenced by the Bermuda High (BH) than ENSO [18,19]. In a changing climate with the fluctuation of large-scale atmospheric circulations and seasonal shifts in the BH, natural interdecadal variability contributes to variations and changes in heavy precipitation frequency, magnitude, and distribution in the SeUS [2,16,20,21].
Hydrological extremes like flash floods have increased both in intensity and frequency [22], and many studies also illustrated significant increasing trends in different extreme precipitation indices [2]. However, in the existing literature, some crucial aspects of hydrological extremes such as 1IPH rainfall, with flash flooding potential, have received less emphasis. In this study, 1IPH is defined as a rainfall rate that is equal to or greater than 1” per hour. Most of the 1IPH events span more than one hour. The emphasis of 1IPH set for this study is to identify extreme events that might lead to flash flooding. Therefore, to fill the void in existing literature, this research plans to evaluate the potential changing regime of 1IPH rainfall frequency in the SeUS and explore reasons that might explain recorded trends.
This research has a few major questions. The first theme of the questions is about possible changes in 1IPH rainfall event numbers over time. Are there trends in the number of 1IPH rainfall events over time (increasing or decreasing)? Are possible trends constant, or are there any abrupt changes in trends? The next theme of questions is about event characteristics and climatology. Are 1IPH events becoming clustered closer together temporally? What climatic influences may at least partially explain some of the results?

2. Methods

2.1. Study Area

The definition of the SeUS changes slightly for published articles on climatology. For example, the SeUS is defined as 11 adjacent states, including Oklahoma and Texas and the nine states selected for our research [2,14]. On the other hand, another study selected a smaller subset of Alabama, Florida, Georgia, North Carolina and South Carolina as SeUS [17]. The nine adjacent states were selected for this study based on the more homogeneous climatology of heavy precipitation events in those states (southern Florida being an exception) compared to drier states farther west and cooler mid-latitude states farther north (Figure 1).

2.2. Definition of 1IPH and Data Collection

There is no universal definition of extreme precipitation. Precipitation can vary abruptly based on elevation and topography, proximity to the moisture source, meteorological conditions, and other climatological factors. The most common approach so far is either percentile-based (for example, 95th or 99th percentile) or threshold-based (where the researcher picks a threshold suited for that study area). This research only considers precipitation that is greater than 1 inch per hour (25.4 mm). The rationale behind this threshold is that 1 inch per hour of precipitation is generally heavy enough to cause a flash flood event in an urban area [8]. It is also a standard often seen in tropical cyclone precipitation, which is considered a high rainfall rate [8]. According to The National Weather Service (NWS), flash floods can happen within six hours of heavy precipitation and often within three hours of heavy precipitation.
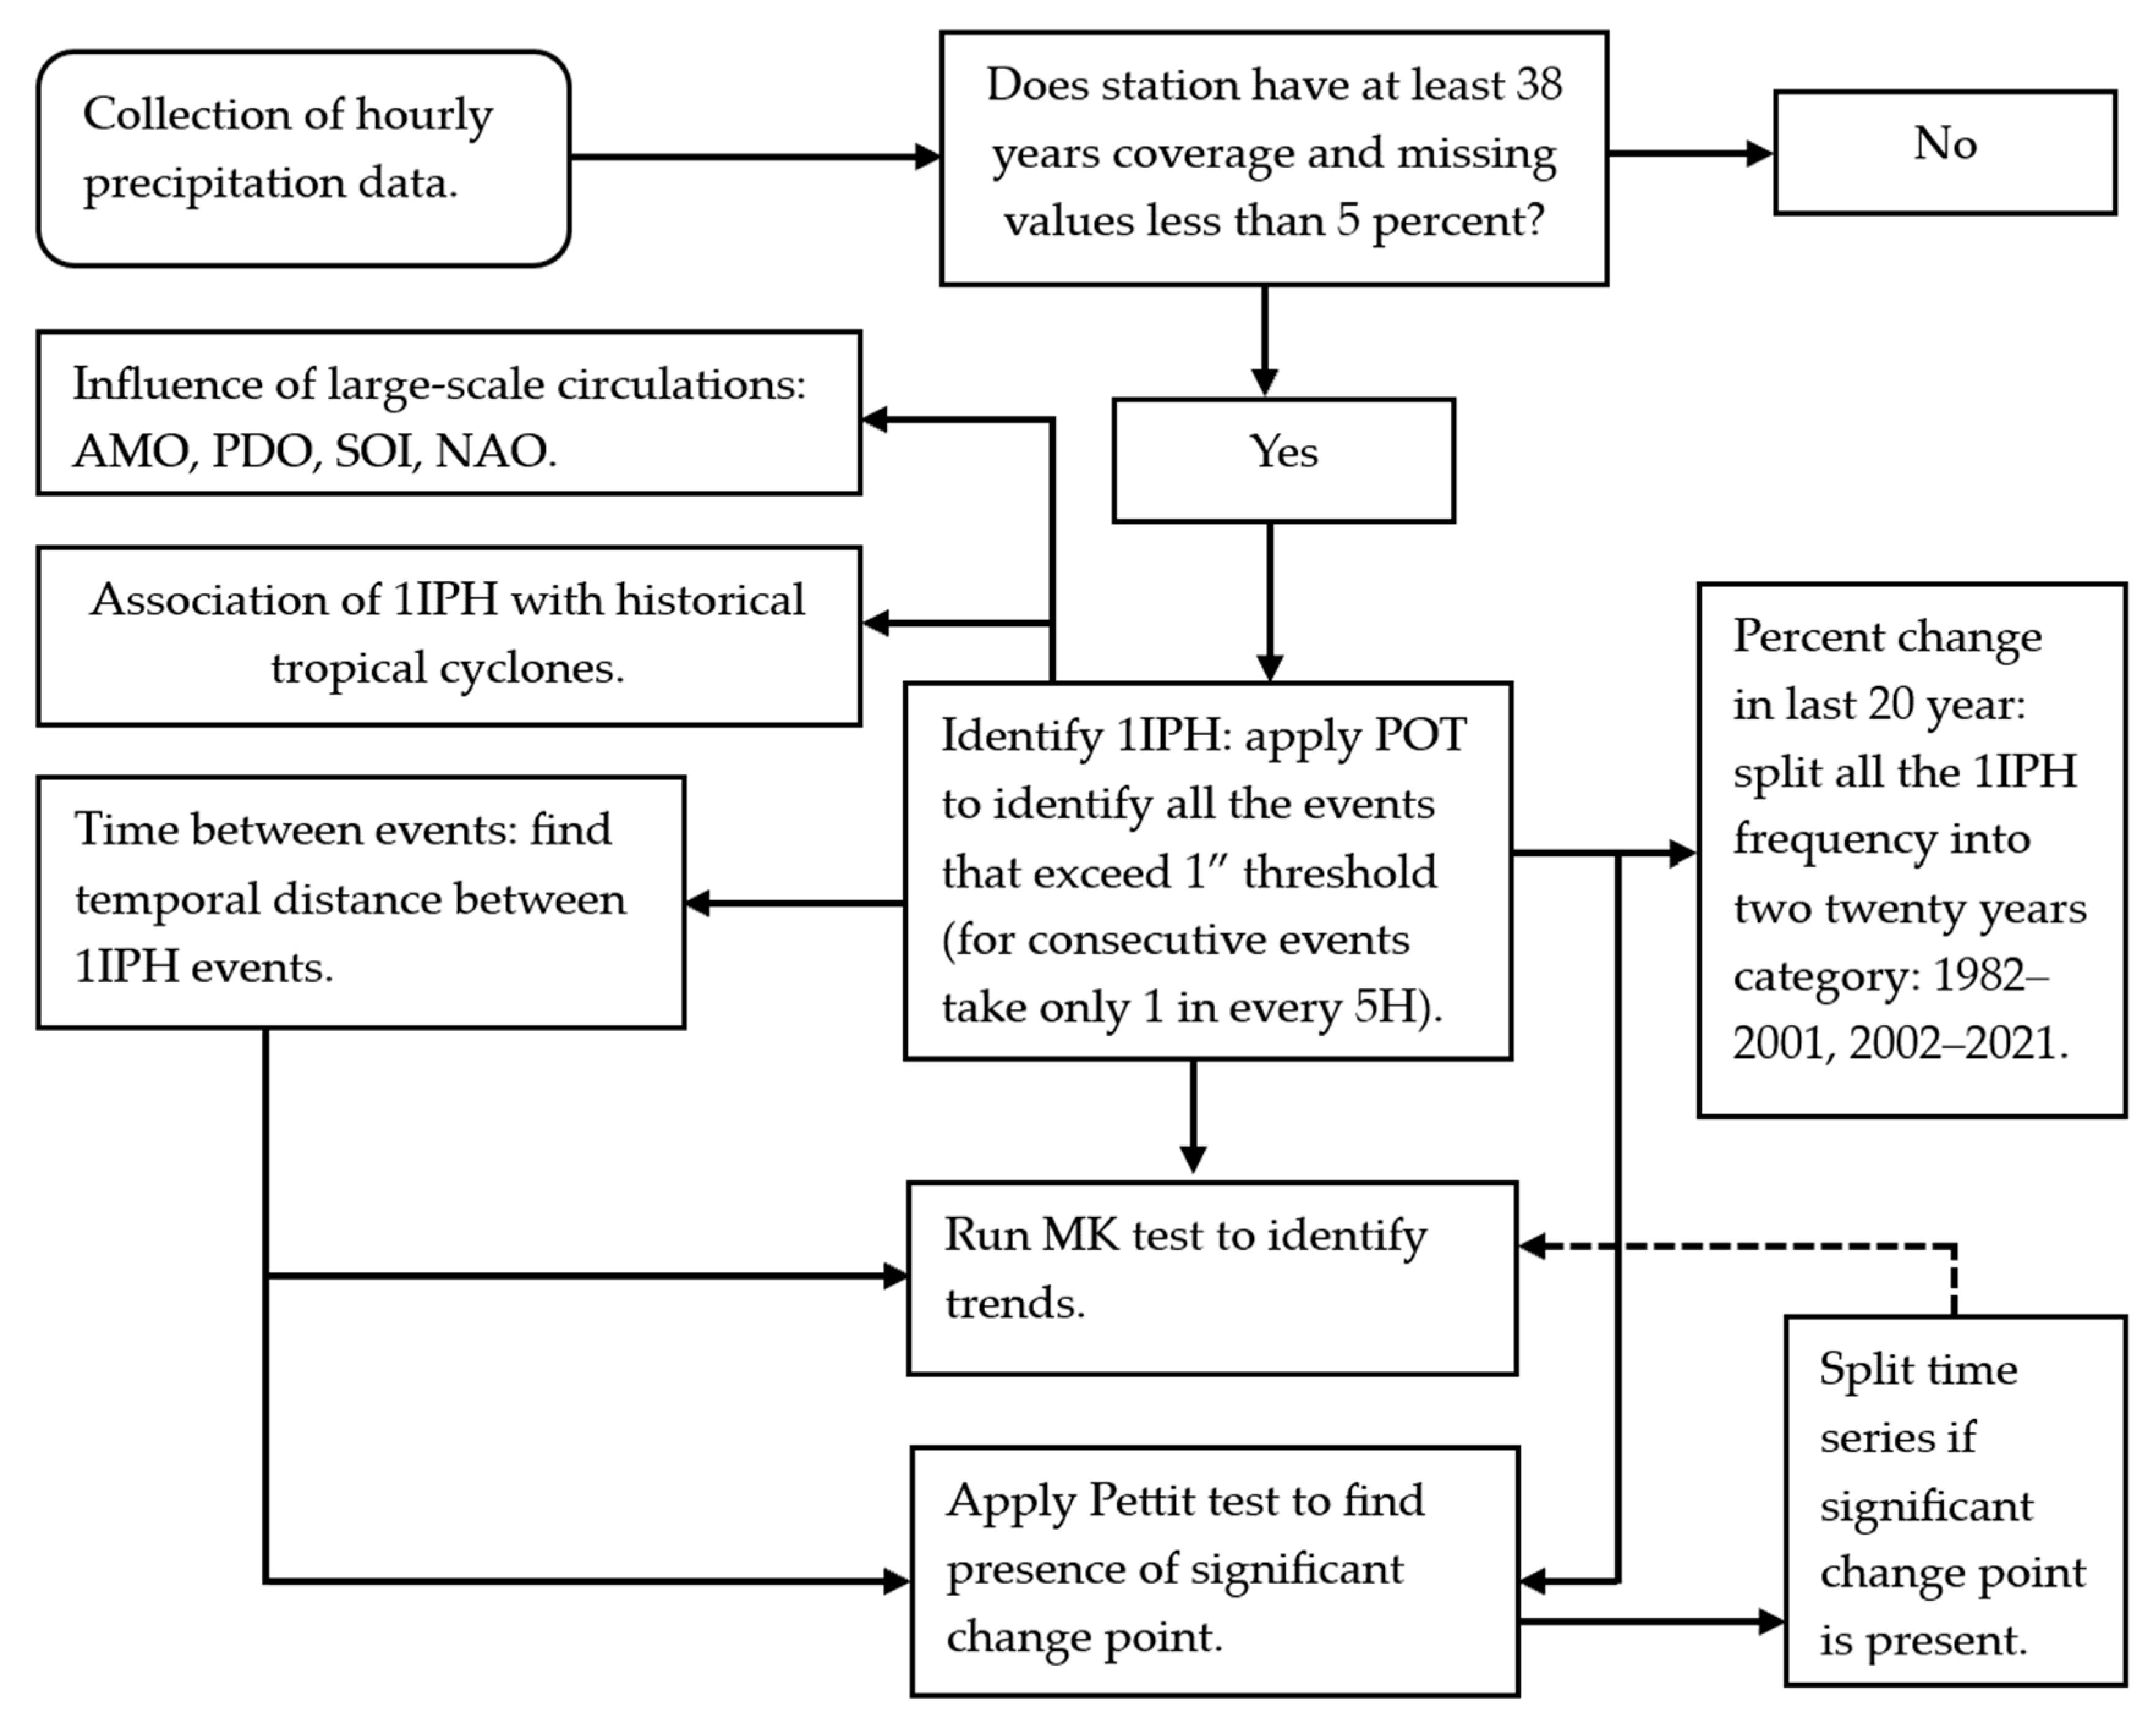
A flowchart depicting the analysis process is featured here at the start of the research procedures (Figure 2). An hourly precipitation dataset of automated surface observation stations was collected from The National Climate Data Center (NCDC) for the SeUS stations that have temporal coverage of at least 38 years or more and less than five percent missing data (Table 1). A total of 61 stations were identified that fulfilled these criteria having a data record starting before 1985 and continuing until 2021. A total of 39/61 stations began in 1948–1950. For this research, we set the threshold as precipitation accumulation of ≥1 inch/h as one 1IPH event. In this research, an isolated hour that was equal to or greater than 1 inch was counted as an event. Decisions about the starting and ending point of events became more complicated when there were many consecutive hours greater than 1 inch. This is discussed in the next paragraph.
An open access Python package called ‘pyextremes’ was used to successfully count 1IPH events for every year and produce a time series that made the 1IPH acquisition possible for this study. This package utilizes the Peaks-Over-Threshold (POT) method to count values that are above a user-defined threshold. One of the benefits of using this method is that it considers the minimum time interval between two POT values. For this study, the minimum time interval was set to five hours. Setting a time interval allowed only one event to be counted as 1IPH every five hours, even if there were multiple hours when the precipitation rate was more than 1” per hour. If multiple consecutive hours crossed the 1-inch threshold, it was treated as a single event to avoid obtaining an excessive number of hourly precipitation observations from a few extreme precipitation events, such as tropical cyclones. Extreme precipitation from tropical cyclones has been increasing significantly in the SeUS by approximately 5–10 percent per decade [23,24,25]. The emphasis of this research is on 1IPH events that are caused by a variety of meteorological or climatological sources.

2.3. Statistical Analysis

2.3.1. Trends in 1IPH Rainfall Events

In this research, the Mann–Kendall (MK) test was used to evaluate trends in 1IPH rainfall events. MK was used due to the uneven distribution of annual count data for 1IPH events that did not conform to a normal distribution. The MK test (proposed by [26,27]) is quite frequently used in detecting long-term monotonic change in time series datasets. An MK test was used to identify trends in precipitation days in the SeUS [12] and to detect trends in extreme rainfall frequency for the Midwest of the US [28]. One of the benefits of using the MK test is that it does not assume any distribution of a time series. Another benefit of using this test is that it is not affected by the length of the time series. However, it is well established that shorter datasets are more likely to give negative trend values, whereas longer datasets tend to give more effective estimation of existing trends in datasets. MK test results can be influenced by seasonality in data, and measurement bias can be the cause of false estimation of trends.

2.3.2. Detection of Potential Change Points

The second research question focused on the potential existence of change points within the data at each station. Abrupt changes in a time series can influence the result of monotonic trend detection. An abrupt change in a time series can be caused by either natural climatic variability, instrumentation bias or error, changes in instrumentation location, or unknown influences. This research focuses on detecting whether there are significant change points present in the time series at each station. Many studies [28,29] used a Pettitt test [30] to detect the presence of abrupt change points in a time series. Likewise, in this research, Pettit tests are also used to evaluate potential change points.
The Pettitt test is a non-parametric test, less influenced by outliers and skewed distributions. This test is based on Mann–Whitney U statistics, which allows a user to detect whether two samples come from the same population. The reason behind selecting this test is that an abrupt change point can influence trend detection and can result in a false assumption of a recorded trend since monotonic trends are greatly influenced by the presence of a significant change point in a time series. For this research, it is assumed that there is only one change point that can be present in the time series. If no significant change point (at the 0.05 level) is found, the results of monotonic trend detection for the whole time series are used. If an abrupt change is present, then monotonic trend detection was performed before and after the change point of that specific time series.

2.3.3. Time between Events

The time between 1IPH events was determined to analyze potential changes in time between events. The time between events was calculated on a daily scale. It was calculated as the number of calendar days between 1IPH rainfall events as previously defined.

2.3.4. Climatic Attribution

Climatic attribution attempts to determine what climatic factors are related to or can partially explain the 1IPH rainfall event results found in the previous subsections. Many studies have already found that recorded changes in extreme precipitation are partially related to changes in large-scale atmospheric teleconnections [2,16,17,31]. The teleconnections considered in our research were the Atlantic Multidecadal Oscillation (AMO), North Atlantic Oscillation (NAO), Pacific Decadal Oscillation (PDO), and Southern Oscillation Index (SOI), one indicator of ENSO. The reason behind choosing SOI instead of a multivariate index is that a trial run did not find a strong correlation with other multivariate indices like Nino 3 or 3.4. Pearson correlations between 1IPH events and monthly teleconnection data were used to identify stations that have significant relationships. Data were collected from National Oceanic and Atmospheric Administration (NOAA) websites such as Physical Sciences Laboratory (https://psl.noaa.gov/data/correlation/amon.us.data) (accessed on 12 July 2023) or National Centers for Environmental Information (https://www.ncei.noaa.gov/ (accessed on 12 July 2023). Only stations that had significant correlations at the 0.05 level were considered significant in this research. Other than teleconnections, tropical cyclones also contribute to extreme precipitation events in the SeUS.
Any 1IPH events that overlapped with the starting and ending time of tropical cyclones that made landfall in the US were counted as tropical cyclone-induced 1IPH events to account for extreme events resulting from tropical cyclones. The Inner Join Function (Python) is effective for detecting overlap between two variables or among multiple variables. Here, the starting and ending time of a specific cyclone was considered as a variable, and the date column of 1IPH events was considered as another variable. Inner Join was able to isolate the 1IPH events that overlapped with cyclone starting and ending times to associate 1IPH events with specific tropical cyclones. This association may not indicate that a tropical cyclone caused the 1IPH during this time period. It merely means that any 1IPH event that occurred during this time period could have been caused by a tropical cyclone. Cyclone start and end times were collected from the National Hurricane Center.
In this research, the focus was on examining the extent to which 1IPH events overlapped with tropical cyclones. While it is acknowledged that not all precipitation events in the study area may have been influenced by a specific tropical cyclone, the intention was to identify any instances where such temporal overlap occurred. The aim was to determine the maximum extent of overlap between 1IPH events and tropical cyclones. This method of overlap exaggerates the potential contribution of tropical cyclones in our research. Conversely, having only one 1IPH event every five hours diminishes the contribution of tropical cyclones. These effects are discussed more in the results. It is important to recognize that extreme precipitation events can have various causes, including local mechanisms like convective weather patterns. Additionally, this study did not take a tropical cyclone path into consideration to find spatial overlap with stations.

3. Results and Discussion

3.1. Trends in 1IPH Rainfall Counts

For the sake of understanding the potential changing trends of 1IPH, this research split the 1IPH time series into two 20-year periods, following [17]. The first portion ranged from 1982 to 2001, and the second portion from 2002 to 2021. The splitting of the 1IPH time series into these periods was done to understand how much 1IPH frequency has changed between the two 20-year periods. Before 2002, 2936 1IPH events were recorded, whereas, after 2001, 4480 1IPH events were recorded. This is a 53 percent increase in 1IPH events in the last 20 years in the SeUS.
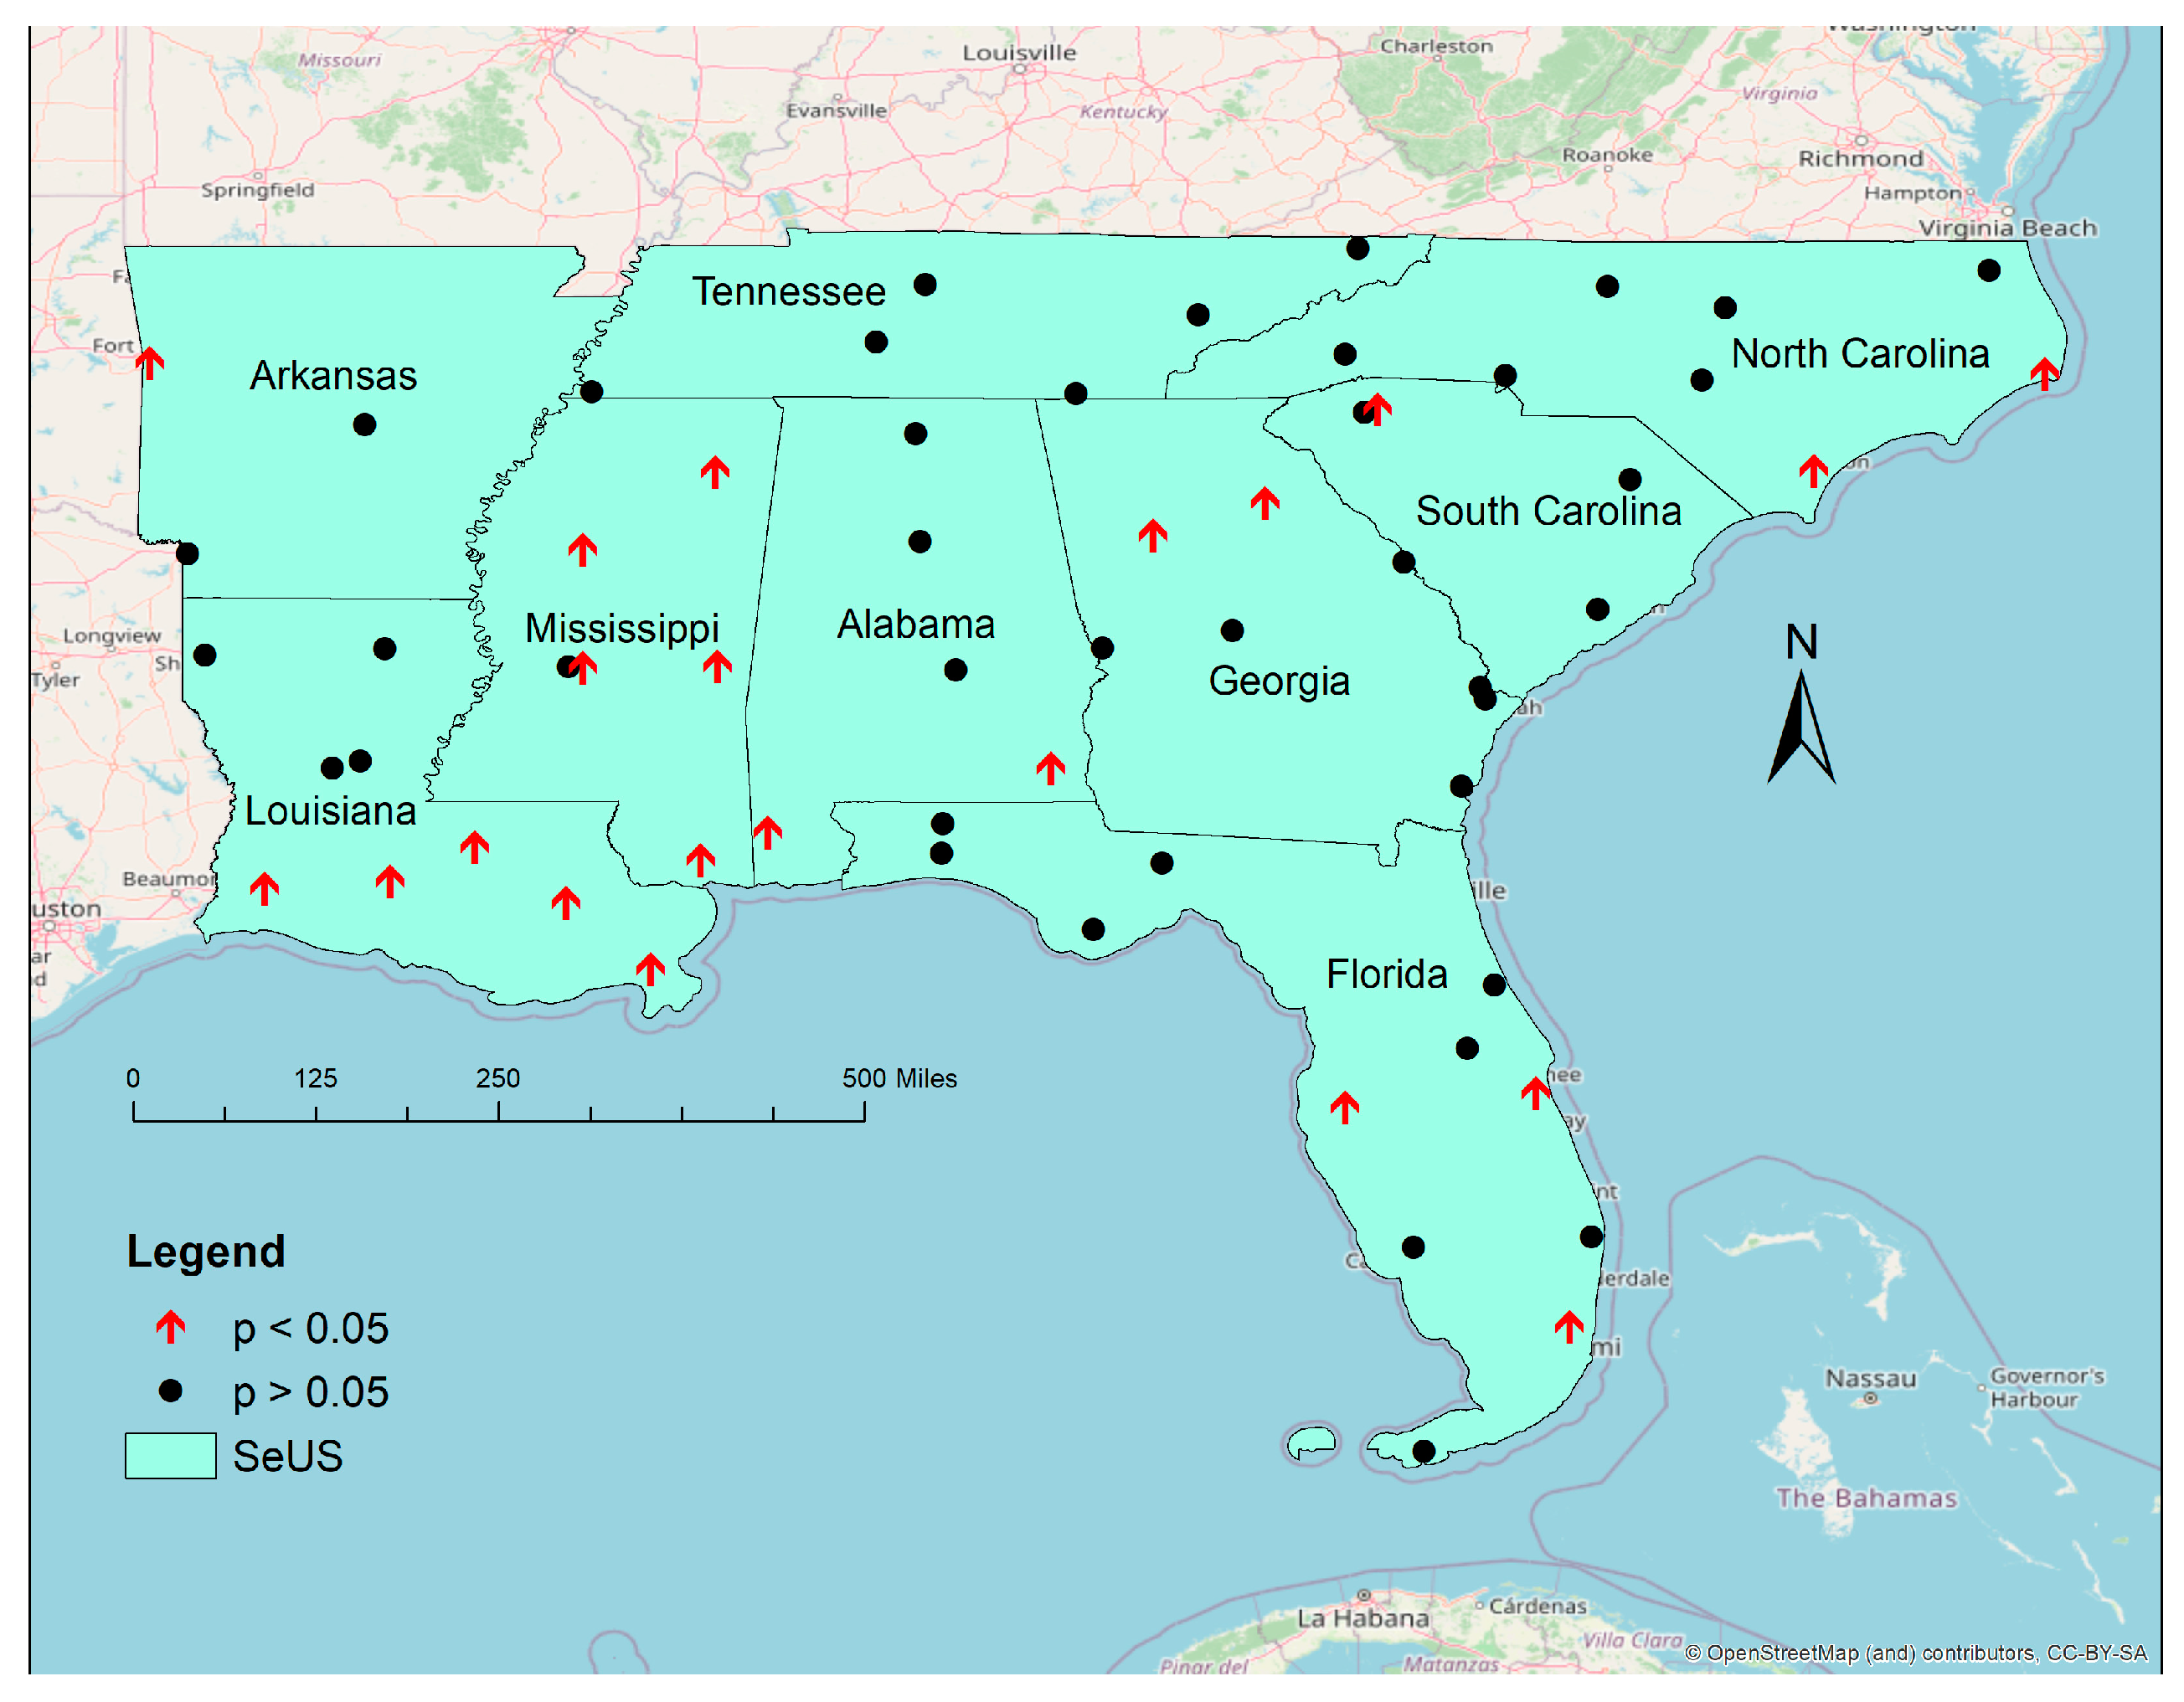
A total of 21 stations out of 61 stations selected from the SeUS recorded a significant increasing trend in 1IPH rainfall events (p < 0.05) (Figure 3). No station showed a significant decreasing trend. In attempting to discuss the results, spatial patterns of geographic locations are used in this section to best group significant findings. The Gulf Coast states of Louisiana and Mississippi have the largest spatial concentration of stations with significant increases. The majority of stations on the northern Gulf Coast recorded significant increases. The Atlantic coastal states of Florida, Georgia, North Carolina, and South Carolina have only a few stations with significant increases, with three locations in Florida, two in coastal North Carolina, and inland stations in Georgia and South Carolina. The northernmost stations in the study region generally showed no significant increasing trends, and this was especially true in Tennessee. Spatial patterns revealed from this study also aligned with [2], except in southern latitudes. The recorded variability could potentially be attributed to variations in the definitions used for categorizing extreme precipitation events. Alternatively, it is plausible that the data from the most recent seven years exerted a strong influence on the overall analysis, potentially deviating from the patterns recorded in the earlier studies.
Authors in [14] studied 1, 3, 6, 12, and 18 h period accumulation changes in 90th percentile precipitation. Findings indicate that five stations from Alabama, Florida, Georgia, and Tennessee recorded a statistically significant increasing trend (p < 0.05), and no station recorded a statistically significant decreasing trend, which is generally in agreement with our research. Another finding of [14] is that 18 out of 50 stations recorded a statistically significant trend in annual hourly 90th percentile precipitation, while no station was statistically significant in Arkansas, Louisiana, and Mississippi. However, Louisiana and Mississippi are the states where statistically significant stations were geographically clustered in our research.
The findings of [13] and our research illustrate similar temporal characteristics of extreme precipitation in the SeUS. Ref. [13] found a significant increasing trend in IPE (defined as 99th percentile precipitation events) frequency for the SeUS, which also holds true for this research.
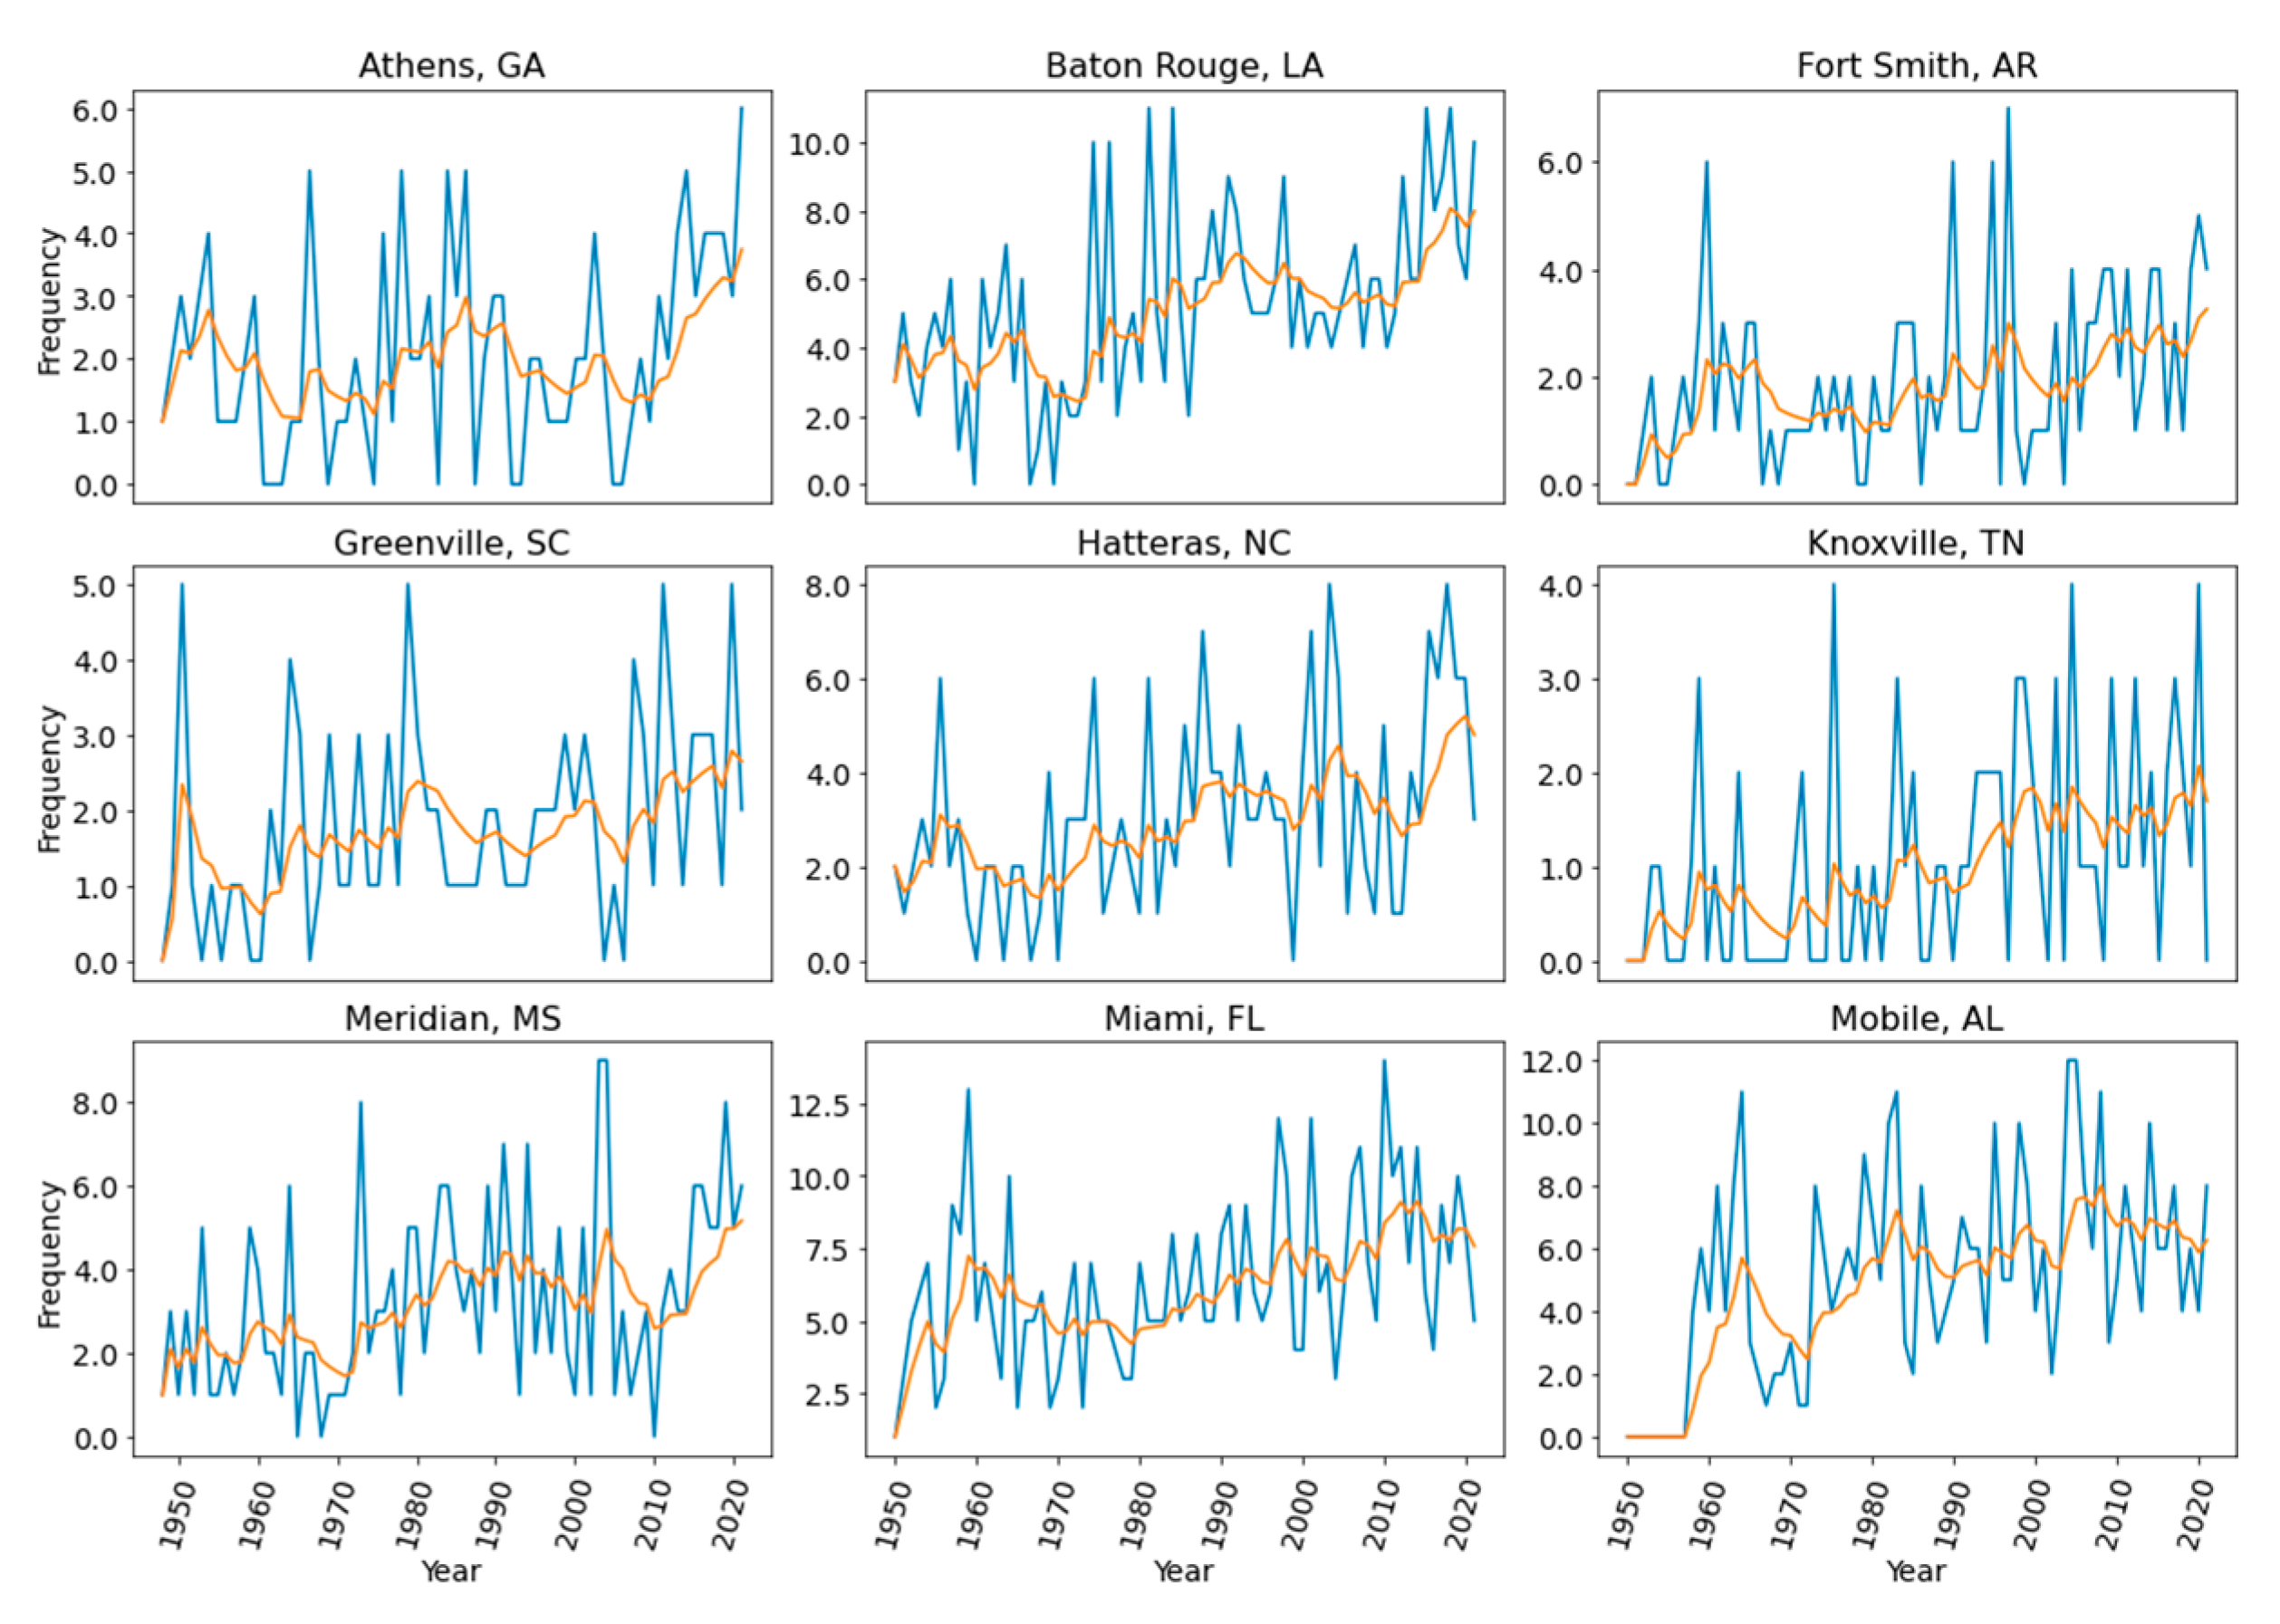
Attempts to fit Poisson regression and linear regression for different stations were considered in this study. Although residuals were normally distributed in both instances, the variance of residuals was not constant. Therefore, a ten-year exponential moving average line was used to show trends at nine stations (Figure 4). Stations were randomly selected from the pool of statistically significant increasing trends in Mann–Kendall tests. Additionally, compared to 1982–2001, from 2002 to 2021, the 1IPH average increased from two events to three events annually in the study area.
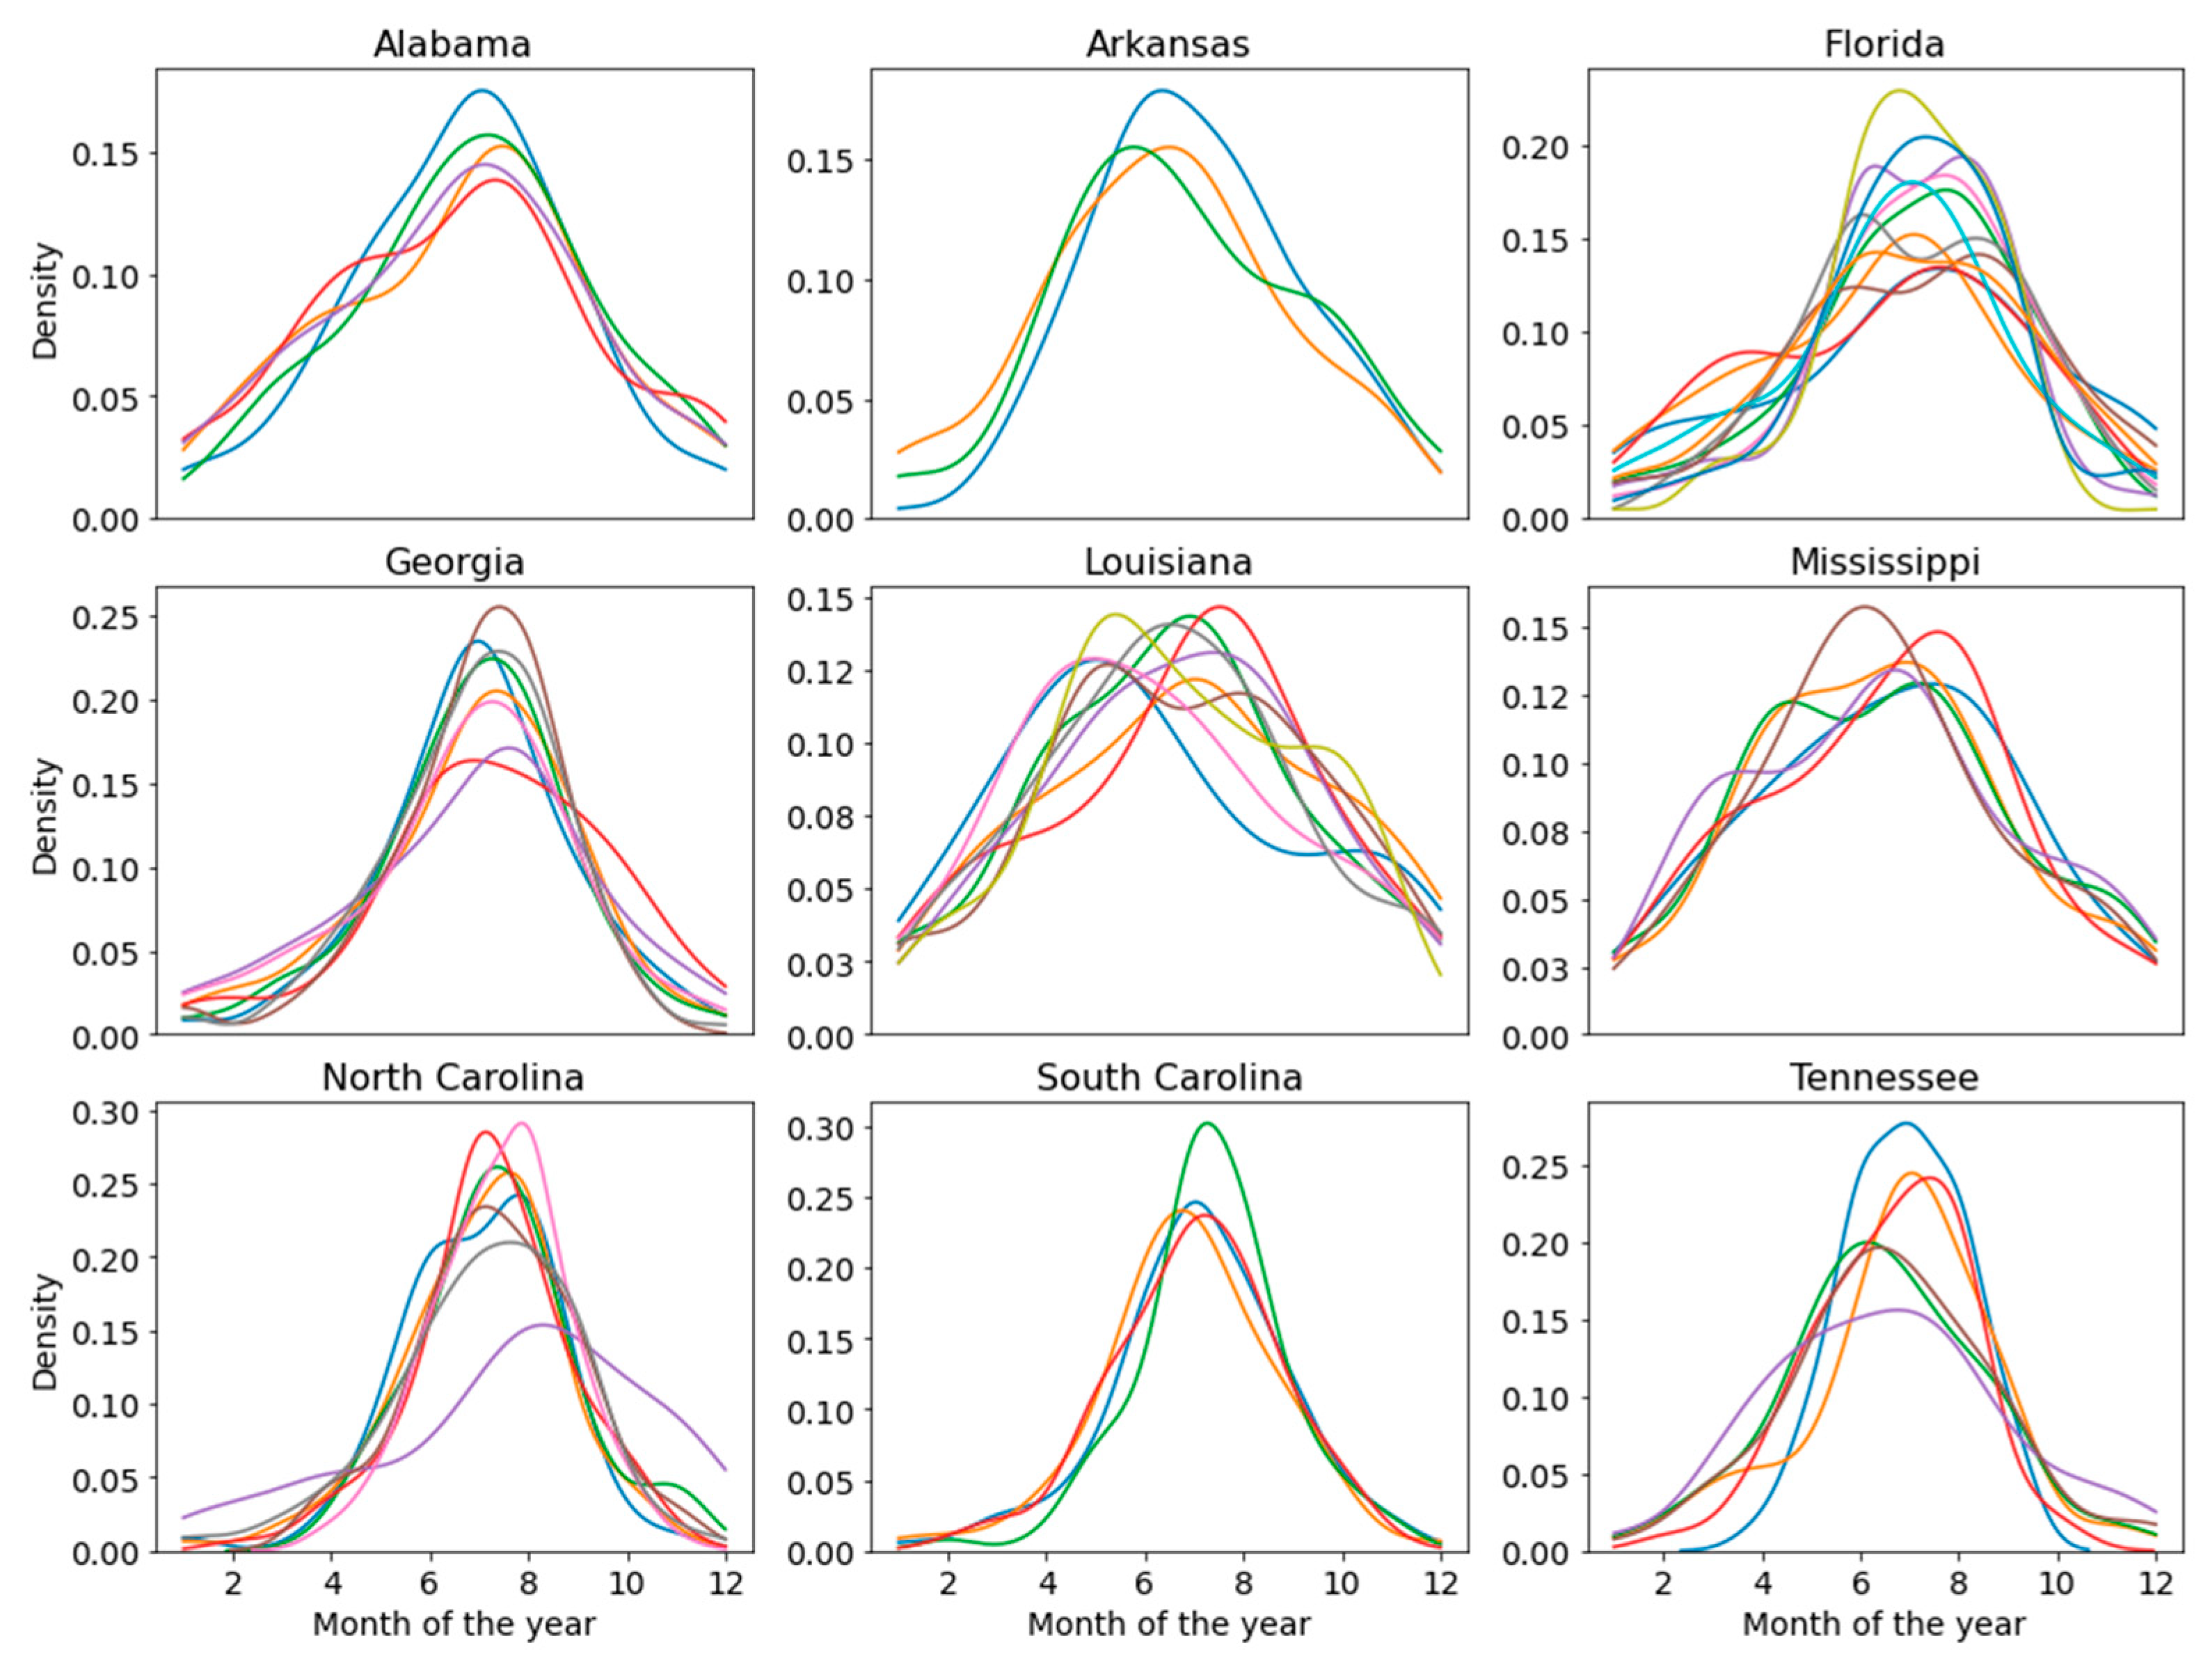
One way to better understand the possible mechanisms controlling the pattern of significance is to explore the seasonality of 1IPH events. Stations were grouped by state here to facilitate explanation. Most of the 1IPH events happened in June, July, and August (JJA). From the density plots, for most of the states, 1IPH events become more frequent in the months of April and May and reach a JJA peak (Figure 5). Louisiana and Mississippi do not have a sharp peak in JJA, and events were distributed more evenly throughout April to August. That distinction might be a clue toward an explanation for why these two states have the highest number of stations with significant increasing trends. Early starts of JJA or summer weather precipitation and late ends might be one explanation for wider peaks recorded in Louisiana and Mississippi. It could also be the result of convective features like mesoscale convective systems in spring or tropical systems in August and September.
Authors in [32] studied increased fall precipitation for the SeUS and reported that fall precipitation increased by 40 percent in this region. Their study also noted that 87 percent of fall precipitation increase was mostly influenced by frontal activity and not tropical cyclones, although early fall is the most active part of the Atlantic hurricane season. Three states (Florida, Louisiana, and Mississippi) have many stations that recorded statistically significant increasing trends. Another interesting finding of [32] is that enhanced moisture transport resulted in contributing more to the highest-intensity precipitation days than lower-intensity precipitation days.
Although the recorded peaks in 1IPH are mostly in JJA, the existing literature shows that fall is more significant. Ref. [33] noted that July–August and September recorded at least 50 percent more extreme precipitation events than other months, which overlaps with the peak months of our research.

3.2. Change Points in Trends

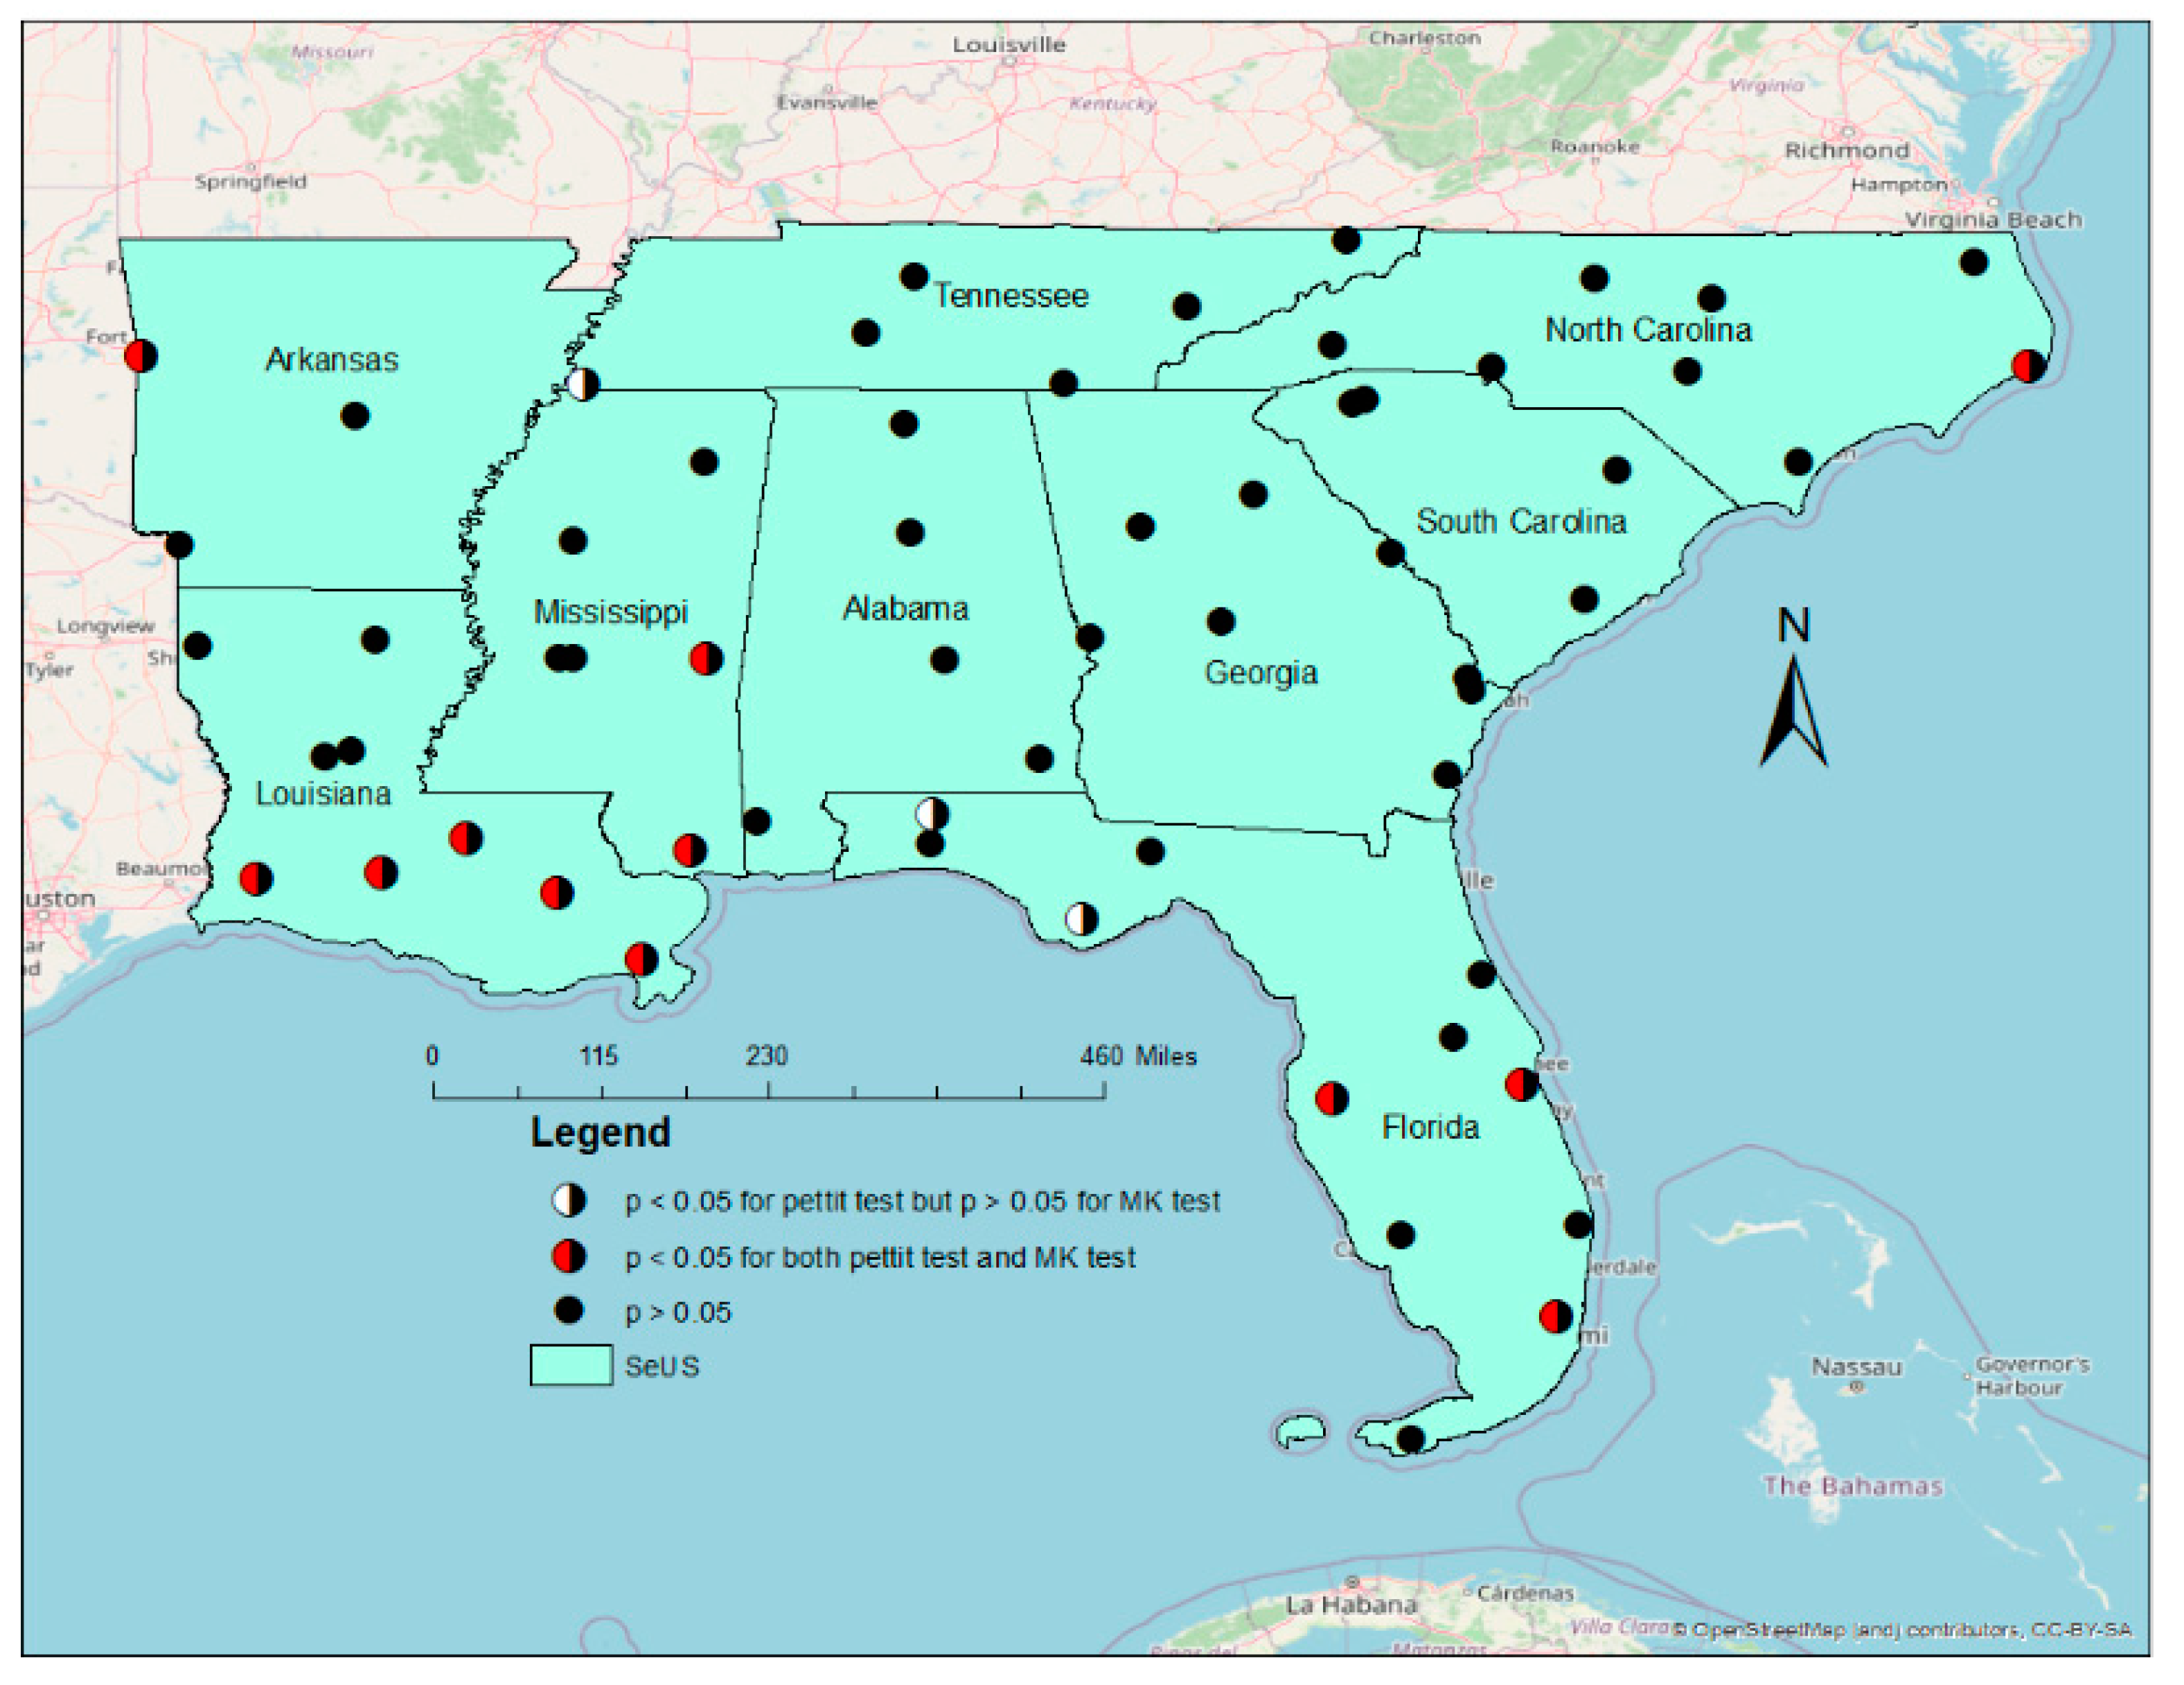
Recorded monotonic trends in a time series can sometimes obscure a change point in the time series. For example, Ref. [34] reported that starting in 1996, extreme precipitation events have increased significantly in the northeastern US. To overcome this potential bias in trend detection, Pettit tests were used to find existing significant change points assuming only one change point could exist in a time series. Only significant p values (p < 0.05) were considered as the presence of an abrupt change point in a time series. A total of 15/61 stations recorded the presence of a significant change point in the time series (Figure 6). Eleven of the fifteen stations have a significant increasing trend in 1IPH events. The location of these stations follows a similar pattern to the stations that recorded a statistically significant increasing trend in Section 3.1. Fourteen stations were clustered near the Gulf of Mexico coast in Louisiana, Mississippi, or Florida. Four of the fifteen stations recorded a non-significant trend in 1IPH events but still have a significant change point in the time series. Four stations had a significant change point but no significant trend. These are in Florida (2), Louisiana (1), and Tennessee (1). Out of these four stations, only one station, Memphis, was more than 500 km inland, and less influenced by the Gulf of Mexico.
For the SeUS, the detection of significant change points in a time series is still scarce in the literature. Ref. [31] utilized segmented regression to detect the presence of significant change points in heavy rainfall frequency time series for the Central United States, which includes Alabama, Mississippi, Louisiana, Arkansas, and Tennessee, in our research. Ref. [31] found many stations that had significant change points present for Louisiana, Mississippi, Alabama, and Tennessee. However, the Midwest region of the United States reported very few stations observing a significant change point in heavy rainfall time series [28].
Taking only the 15 stations that recorded a significant change point, time periods of trends were partitioned and analyzed separately for those stations before and after the change point. The time periods were separated to better identify possible mechanisms explaining change points in time.
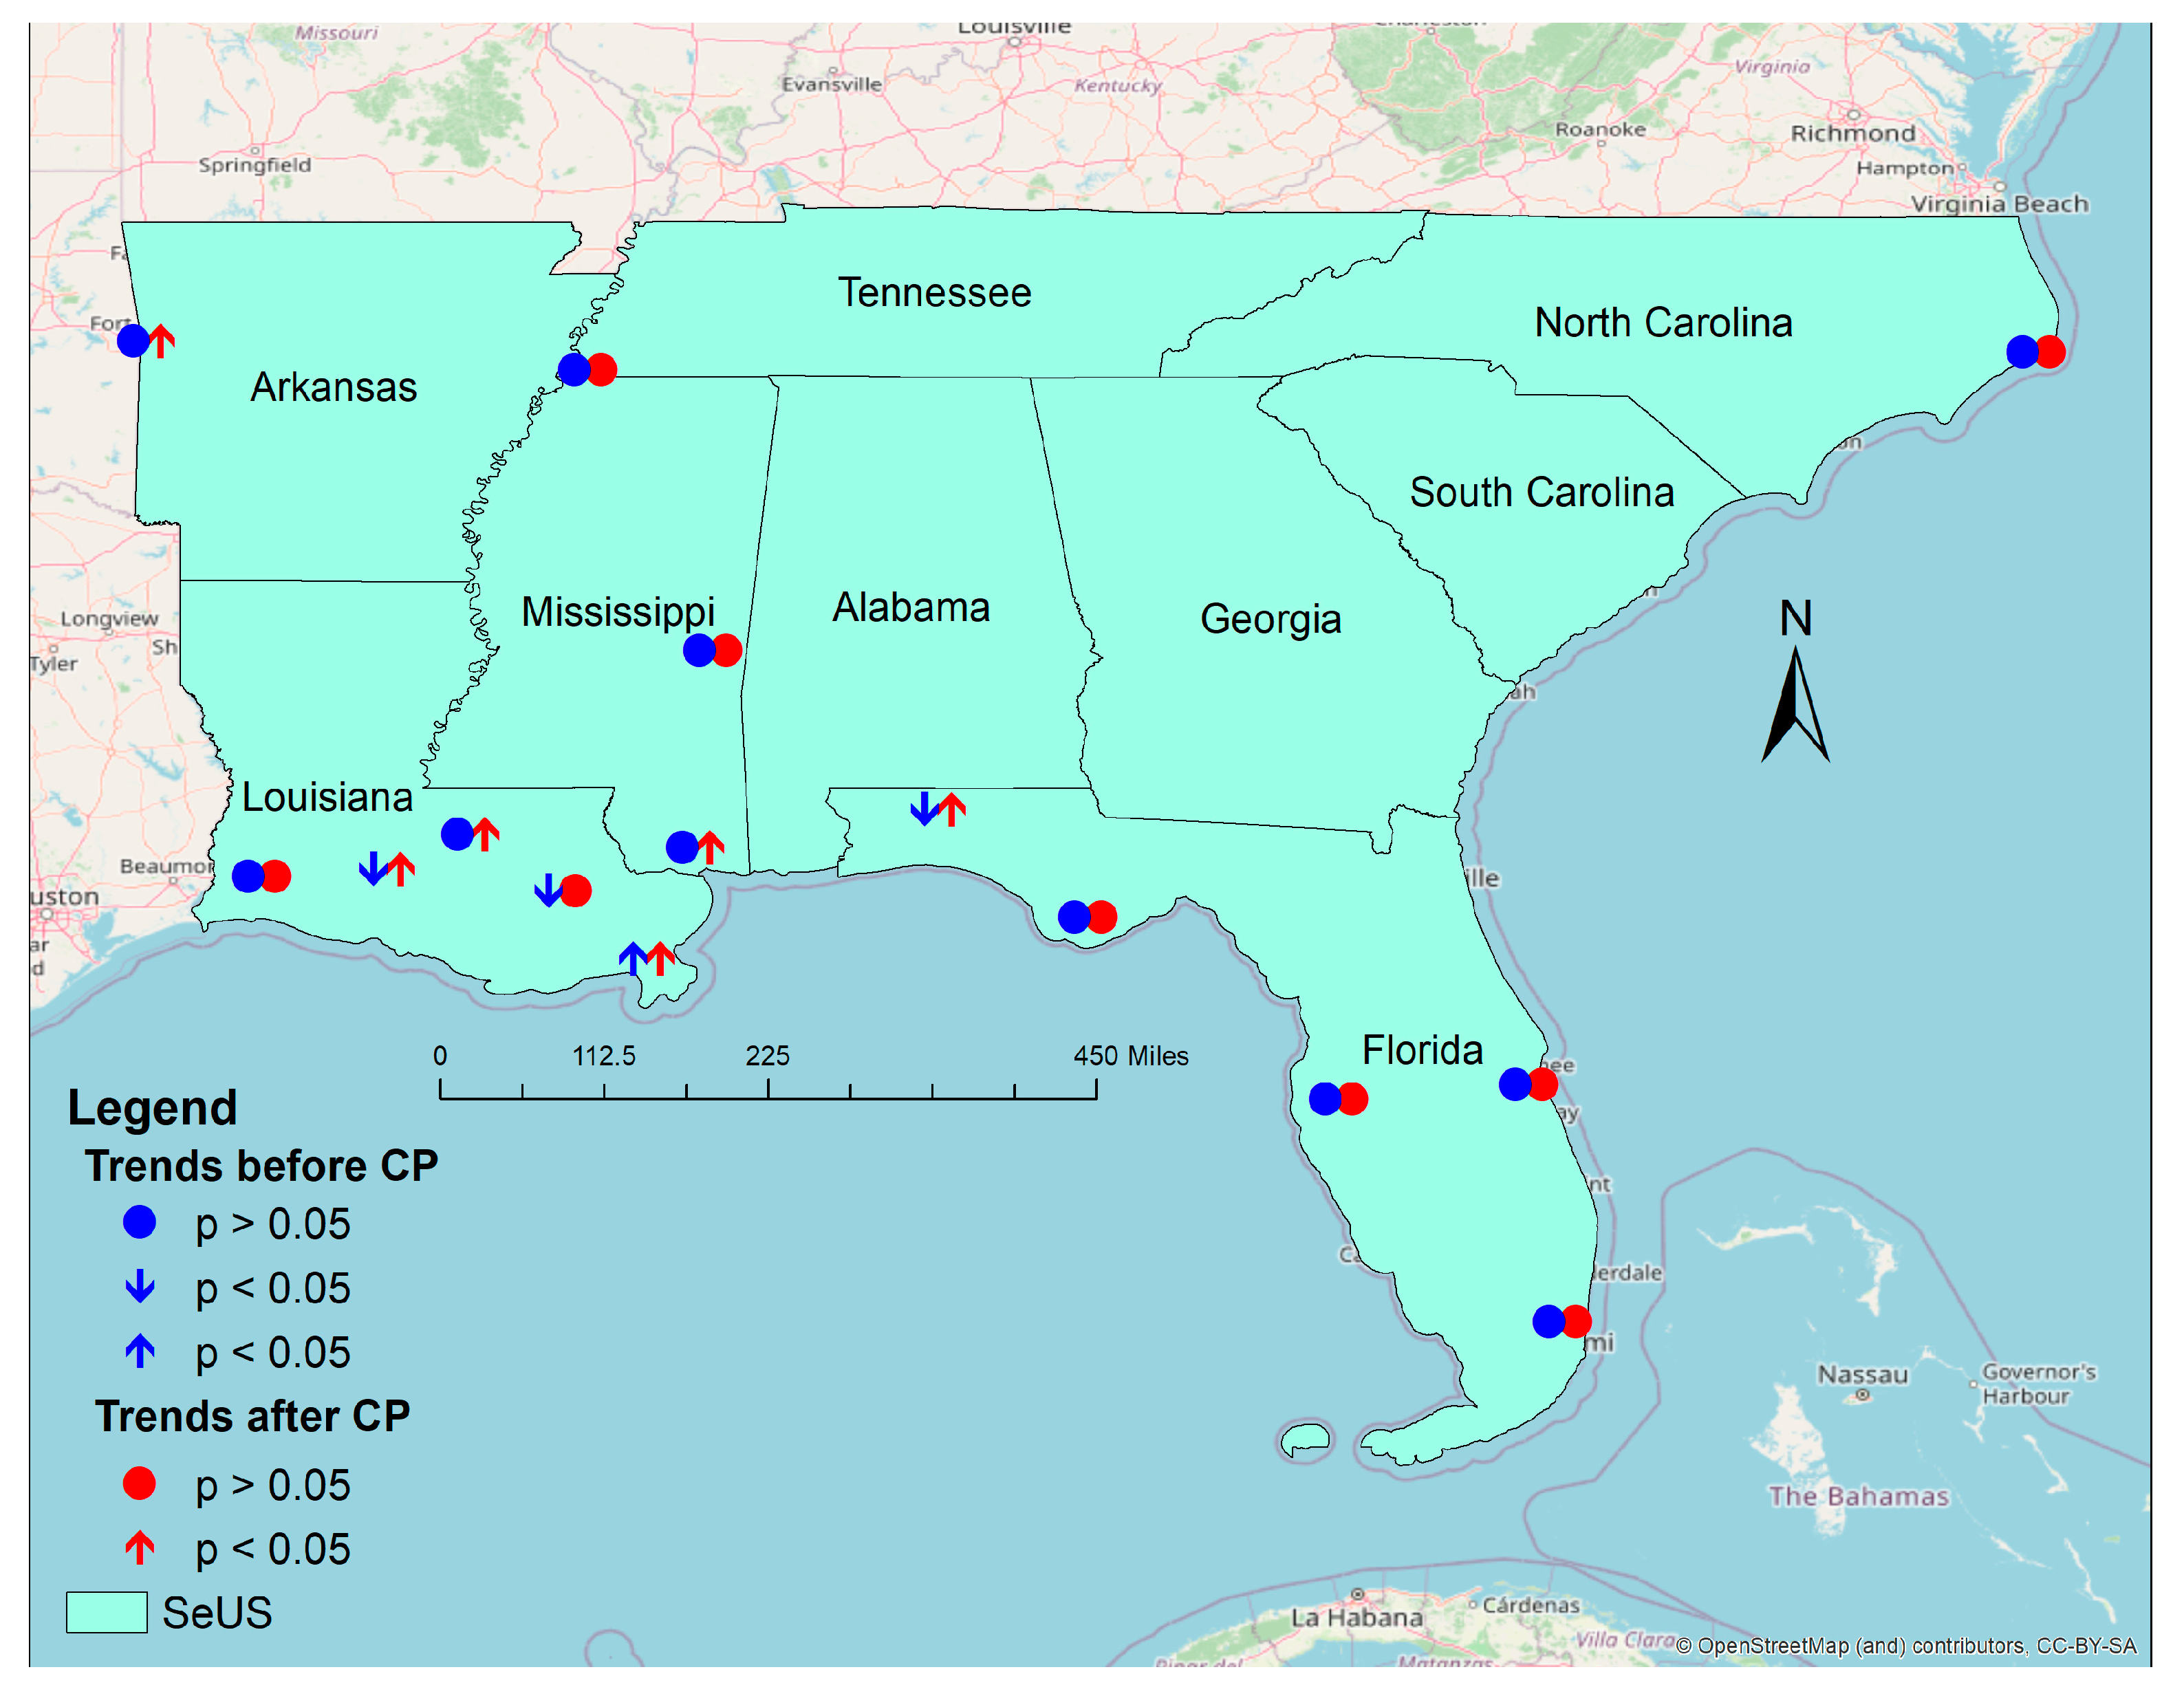
Most of the stations with significant change point trends are located on the northern Gulf Coast. Only Fort Smith, Arkansas, has a significant increasing trend after the change point, which is located inland from the Gulf of Mexico. Only one station recorded a significant increasing trend before the change point (Boothville, LA, USA). Three stations located close to the Gulf of Mexico coast recorded a significant decreasing trend before the change point (Figure 7).

3.3. Time between Events

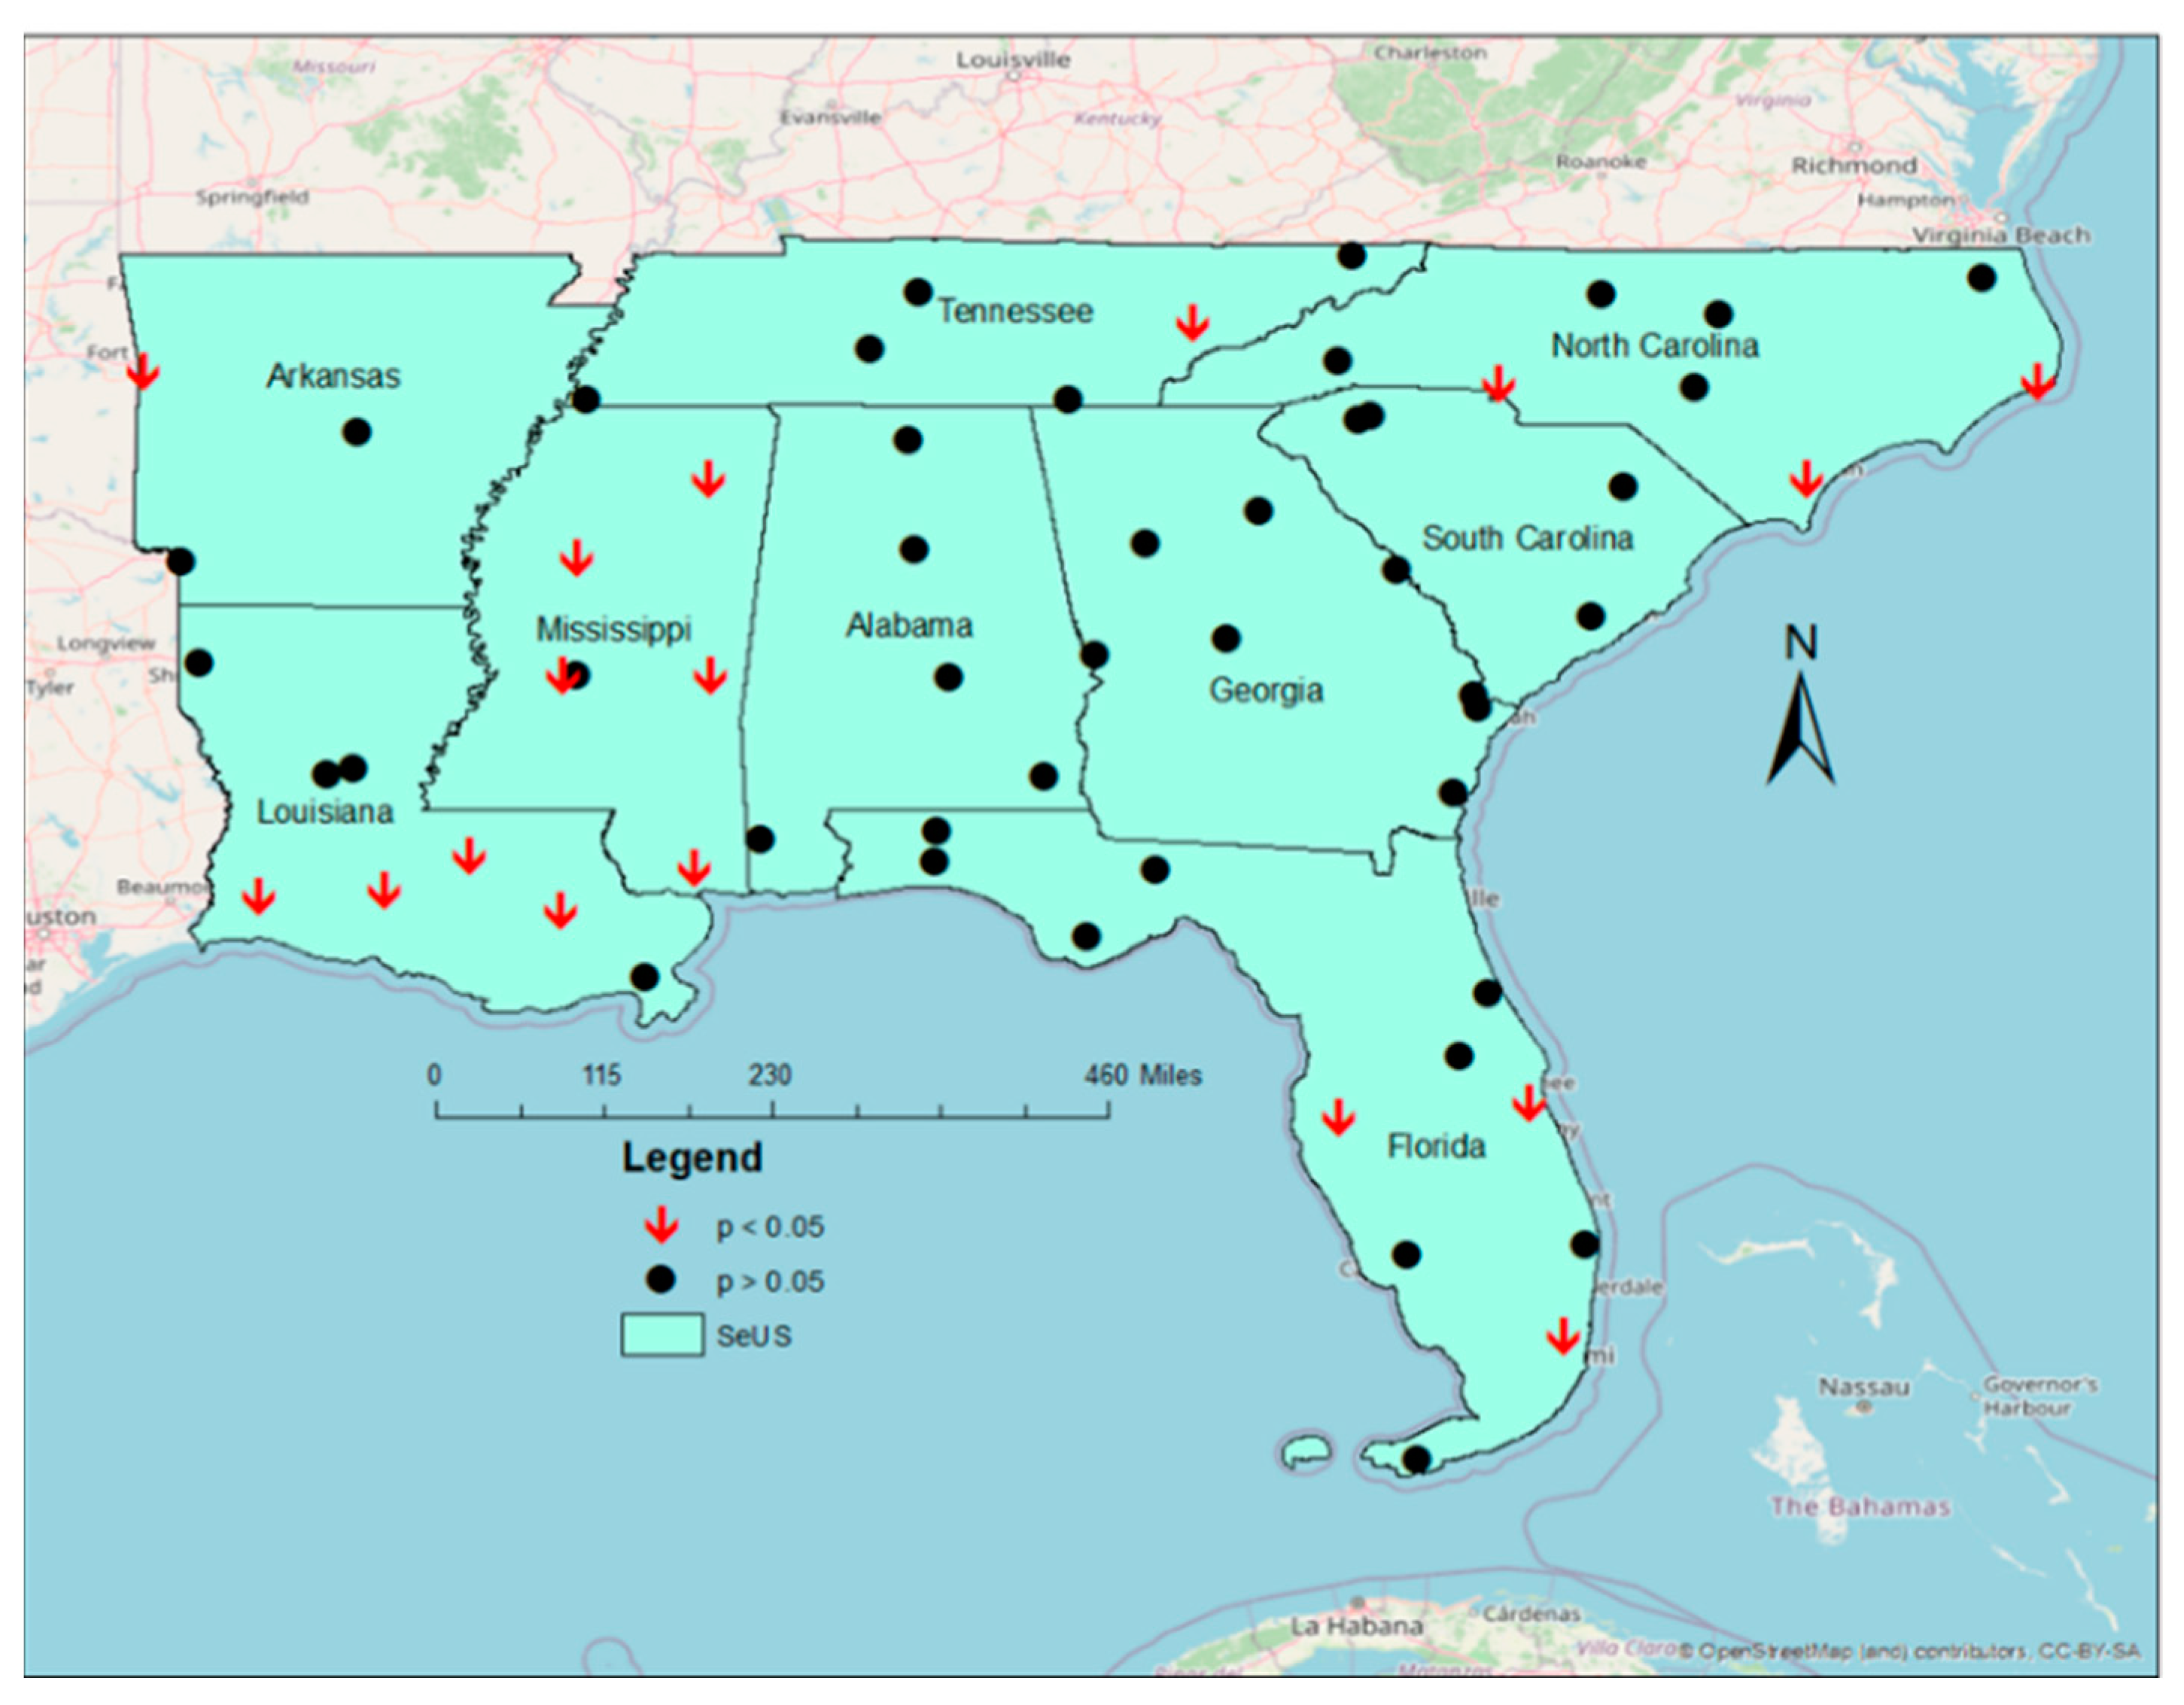
Most stations with increasing trends in 1IPH rainfall events also have a decreasing time interval between when those events occur (Figure 8). This is logical since more total events should decrease the time between events. However, this simple extrapolation might not be true for every station, and there could be considerable variation. The temporal interval between recorded 1IPH events is also one of the important ways to explore changing patterns of extreme precipitation events. Just as before, to identify trends in 1IPH rainfall events, this section utilized MK trend tests to identify any possible changes in the temporal intervals between events.
A total of 17 stations out of 61 stations showed a significant decreasing trend for time between events. No station recorded an increasing trend. Most of the 17 significant decreasing trend stations are once again in Louisiana and Mississippi. The states of Alabama, Georgia, and South Carolina have no significant decreasing stations.
As before, a Pettit test was used to detect significant change points in the temporal time series. The existence of a significant change point in a time series could impact a trend test result that could lead to a false assumption of a trend. A total of 15 stations out of 61 stations showed the existence of significant change points in the time series. These results were identical to those seen in Figure 6.
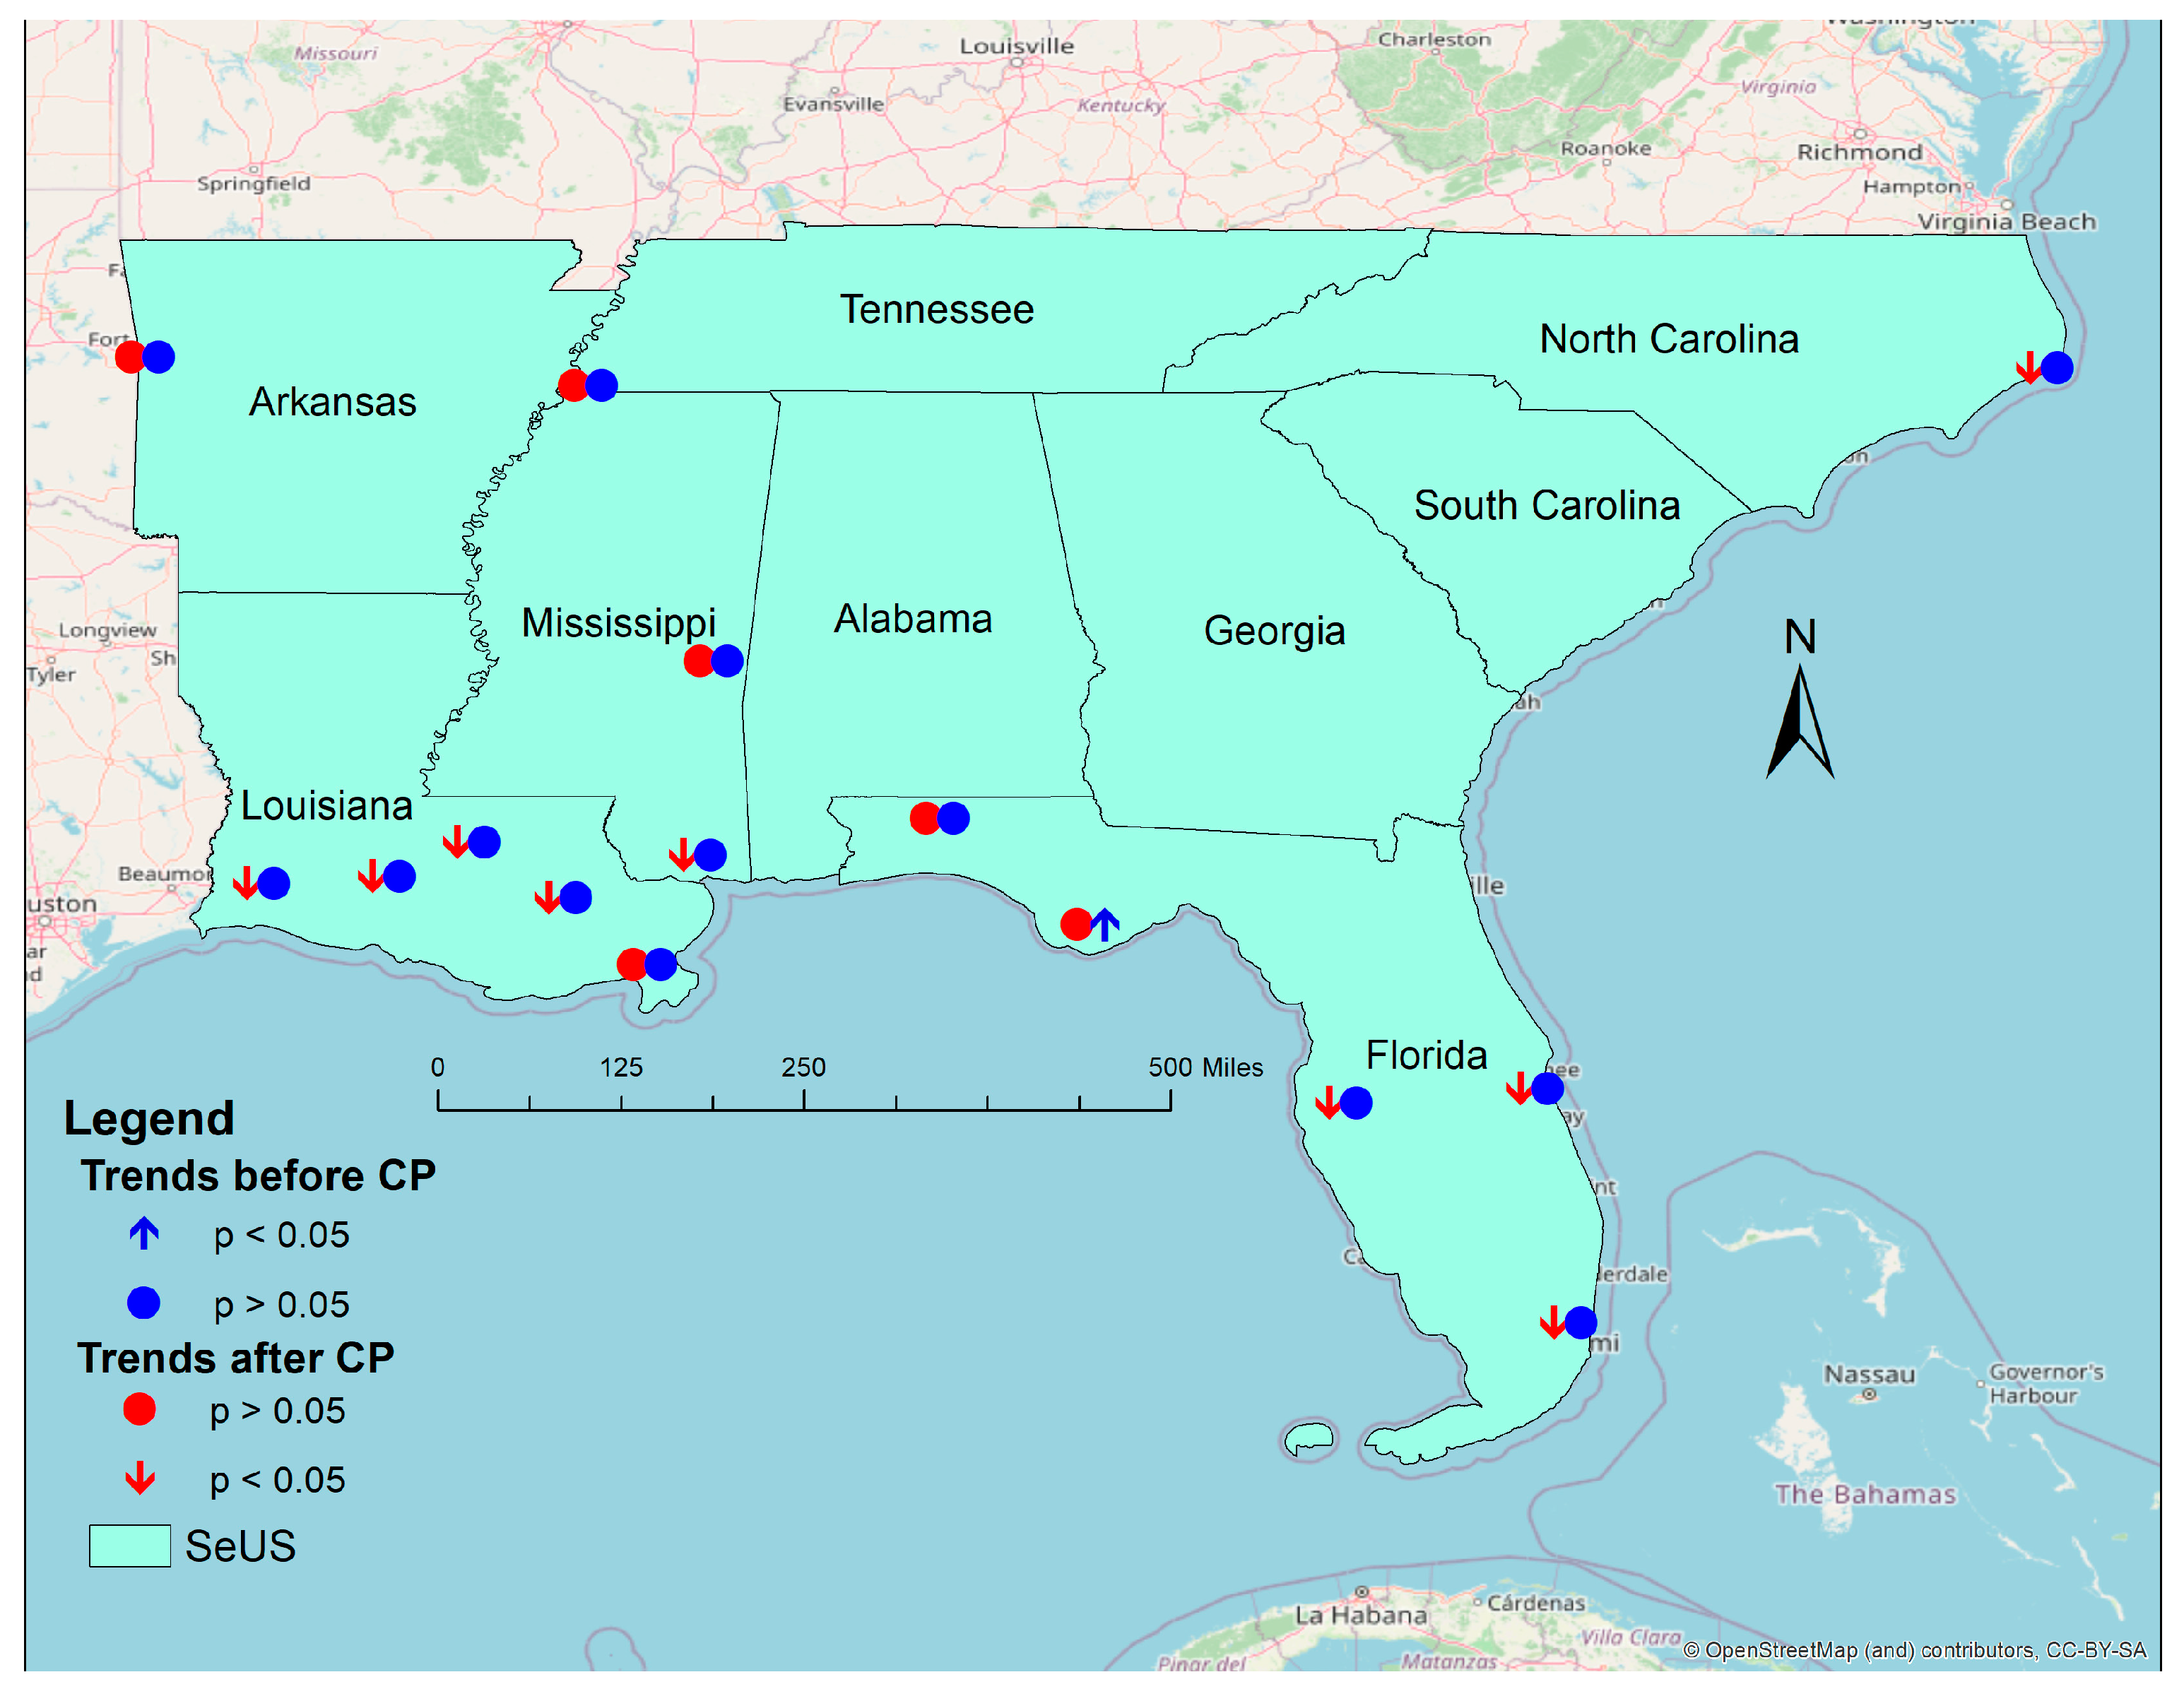
Before and after change points in a time series separate the time series into two parts for analysis. Before CP represents 1IPH earlier than 2002 since most of the significant change points occurred before 1995. Since the time between events exhibits a similar pattern as 1IPH events, it is safe to assume that the year of the significant change point also followed the 1IPH time series. One station (Apalachicola, FL) out of 15 stations recorded a significant increasing trend before the change point (CP) (Figure 9).
A statistically significant decreasing trend for nine stations out of fifteen stations was recorded after the presence of a significant CP in the time between events time series (Figure 9). Many studies have concluded that extreme precipitation in the US recorded a significant change after 2000 [2,14,28], which holds true for our research. All the nine stations that recorded significant decreasing trends were coastal or in Florida.

3.4. Climatic Attribution

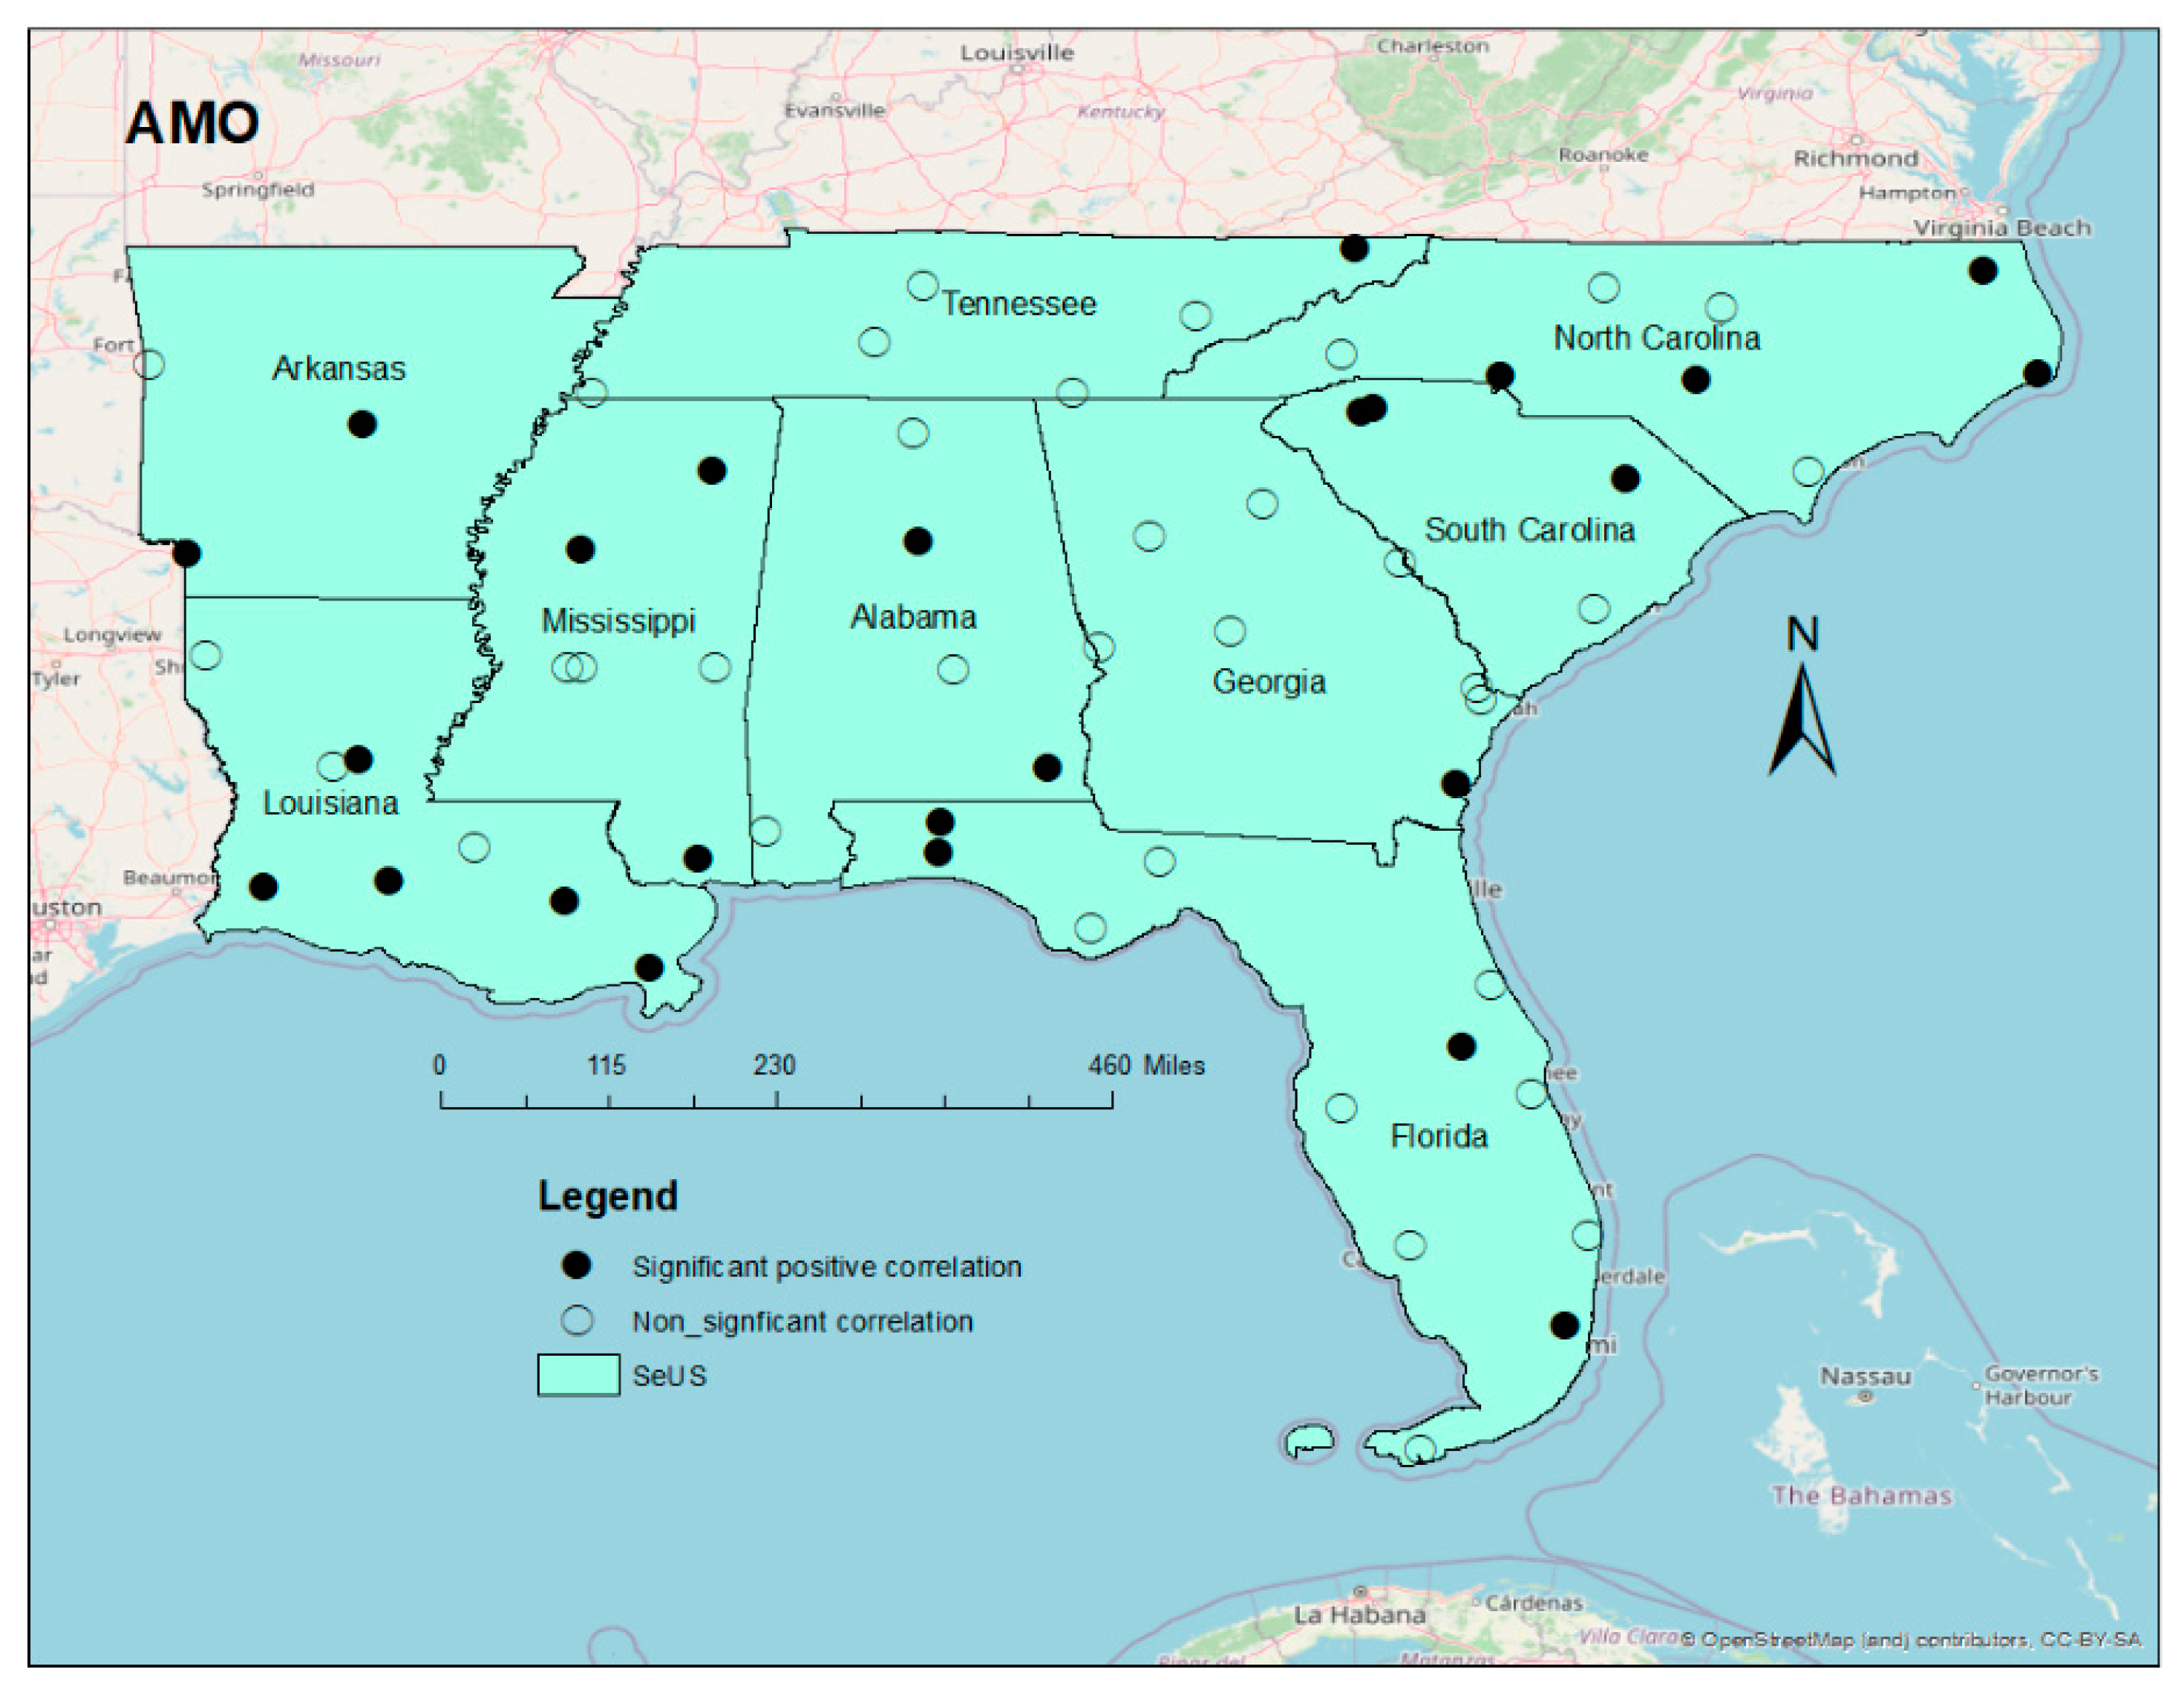
Large-scale atmospheric circulations play a crucial role in changes and variability of extreme precipitation in the US [16]. Four large-scale atmospheric teleconnection indices were used to find correlations with 1IPH counts. Out of these four indices, the Atlantic Multidecadal Oscillation (AMO) was significant at 26 stations. The positive phase of the AMO is associated with greater tropical cyclone numbers. The AMO switched to positive in 1995; thus, it would logically be correlated with at least some of the increase in 1IPH rainfall events, especially for coastal stations; however, a substantial portion of inland stations are also significantly correlated with the AMO (Figure 10).
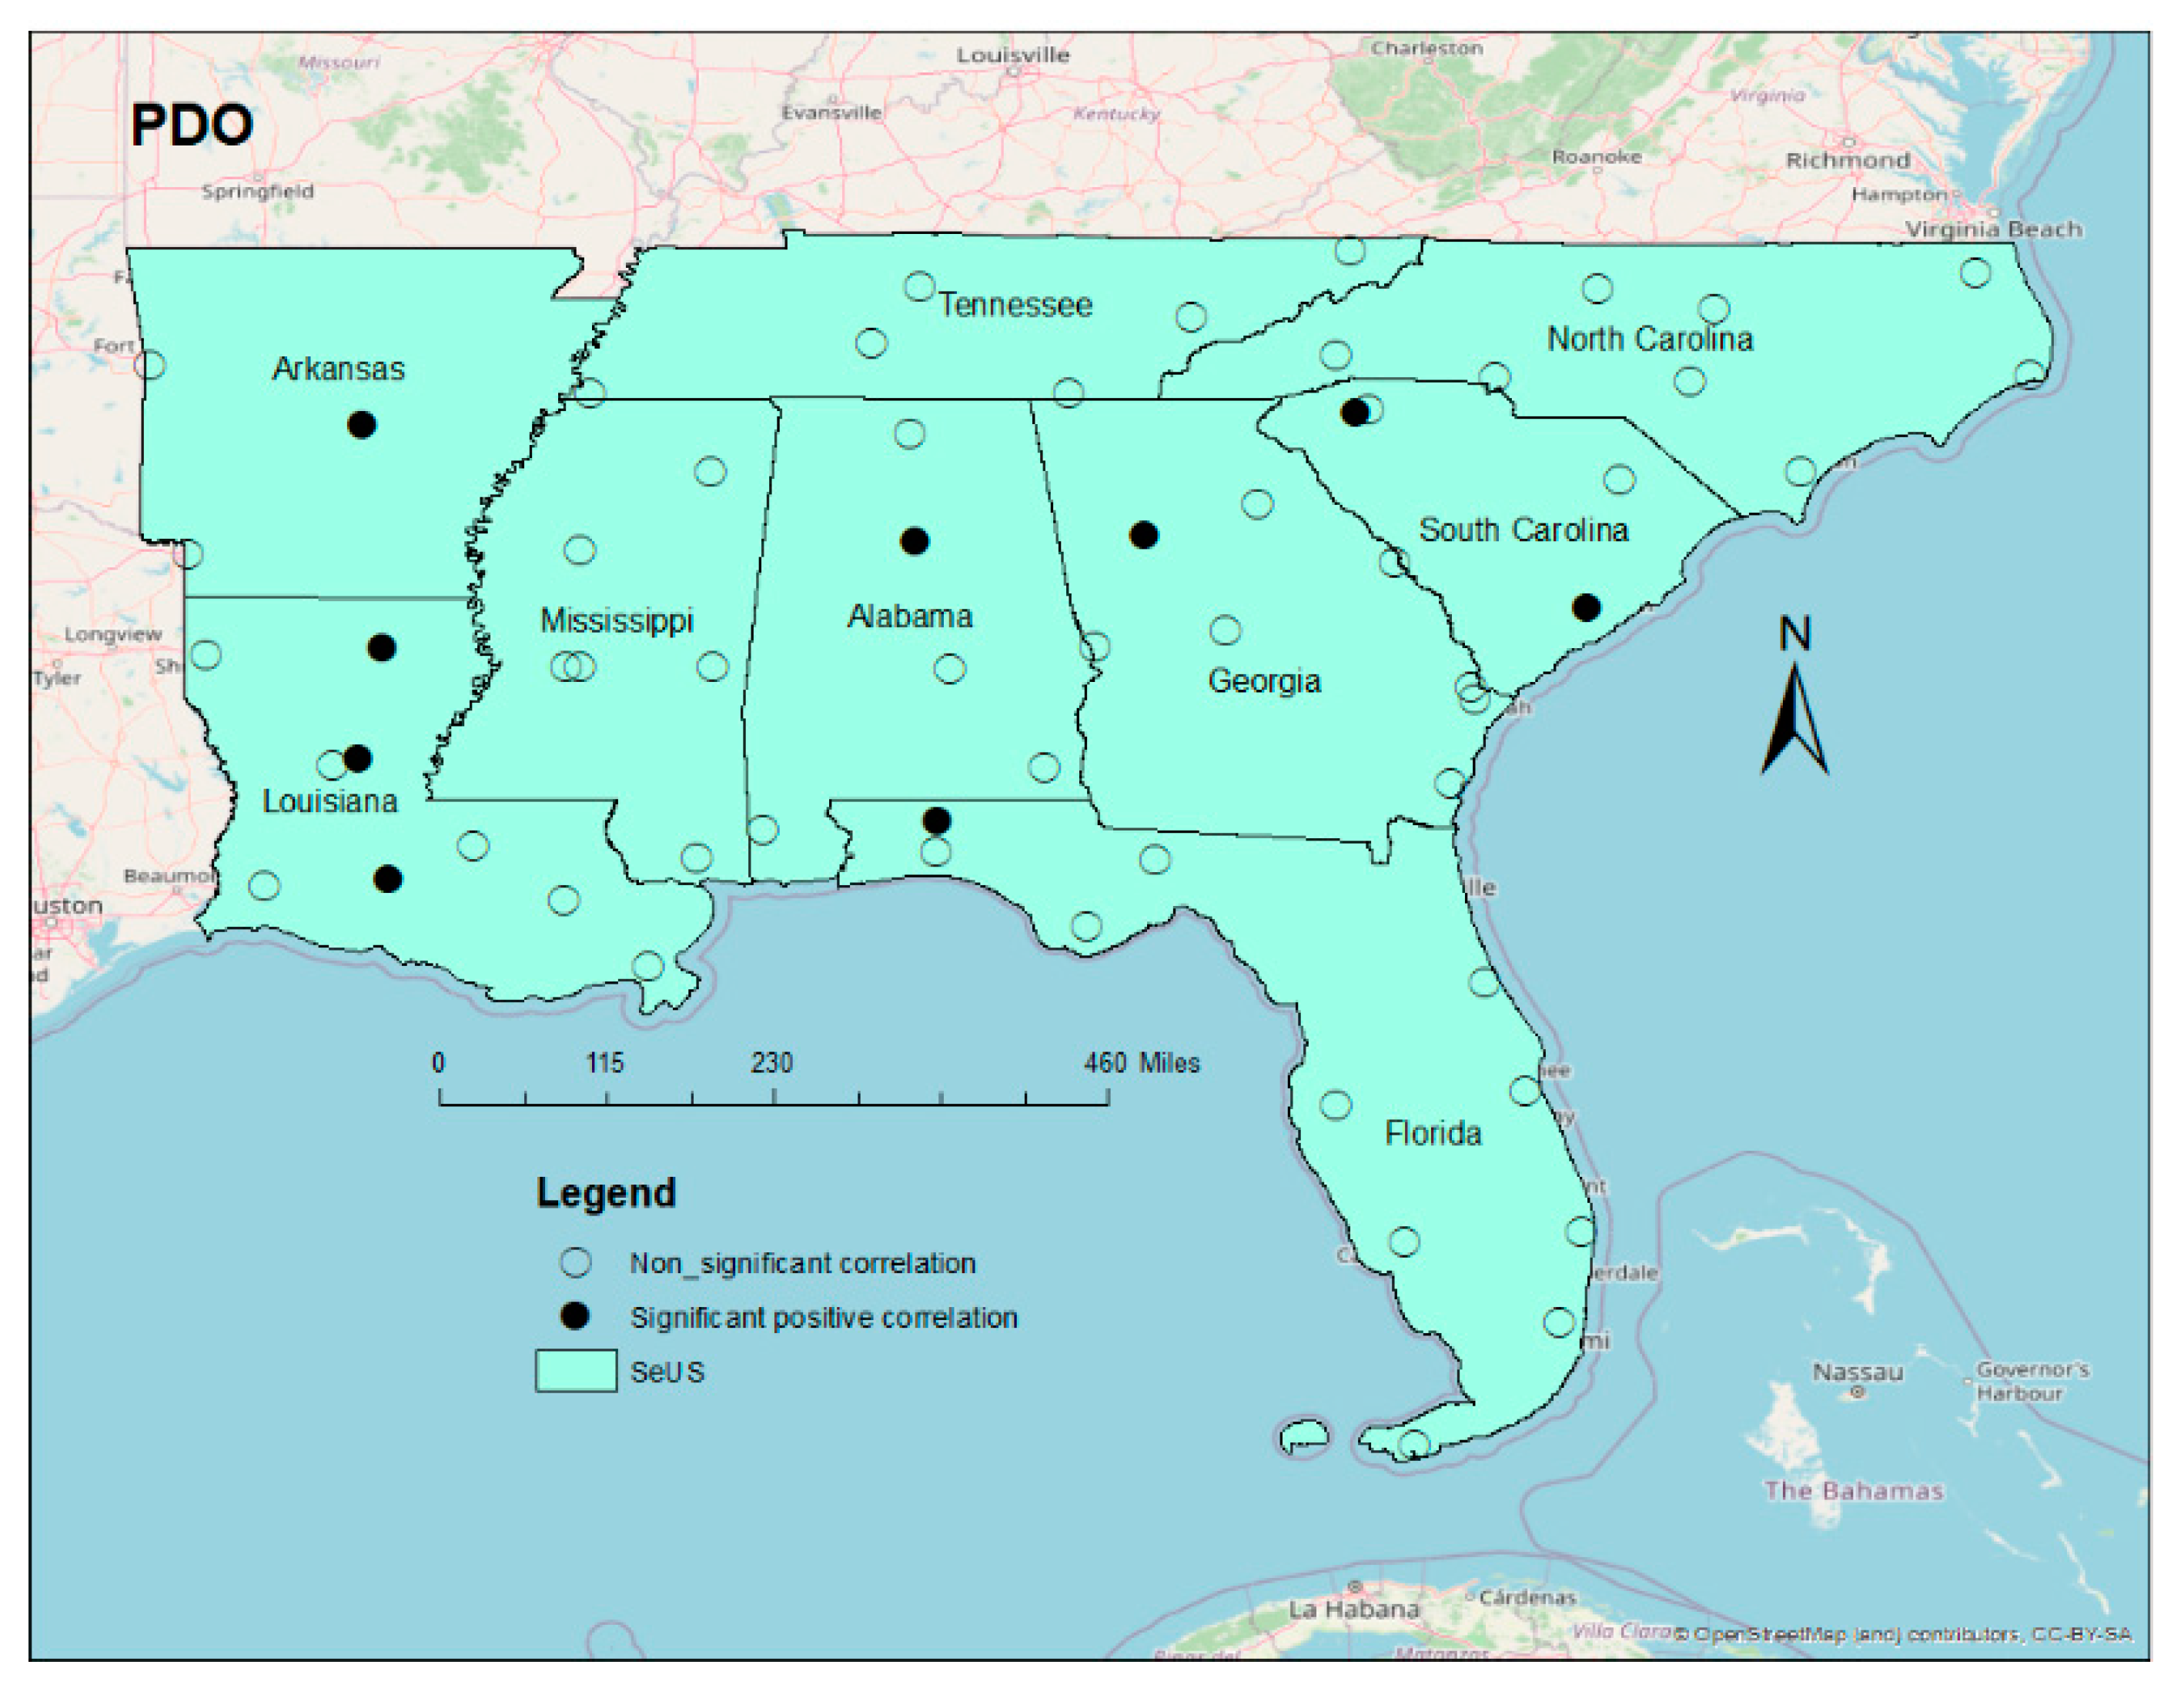
The Pacific Decadal Oscillation (PDO) is another important teleconnection that influences precipitation in the SeUS and other regions of the United States. Nine stations that are more inland by average latitude have recorded significant positive correlations with 1IPH frequency. The spatial pattern of these stations is random, but there is some overlap with the AMO results (Figure 11).
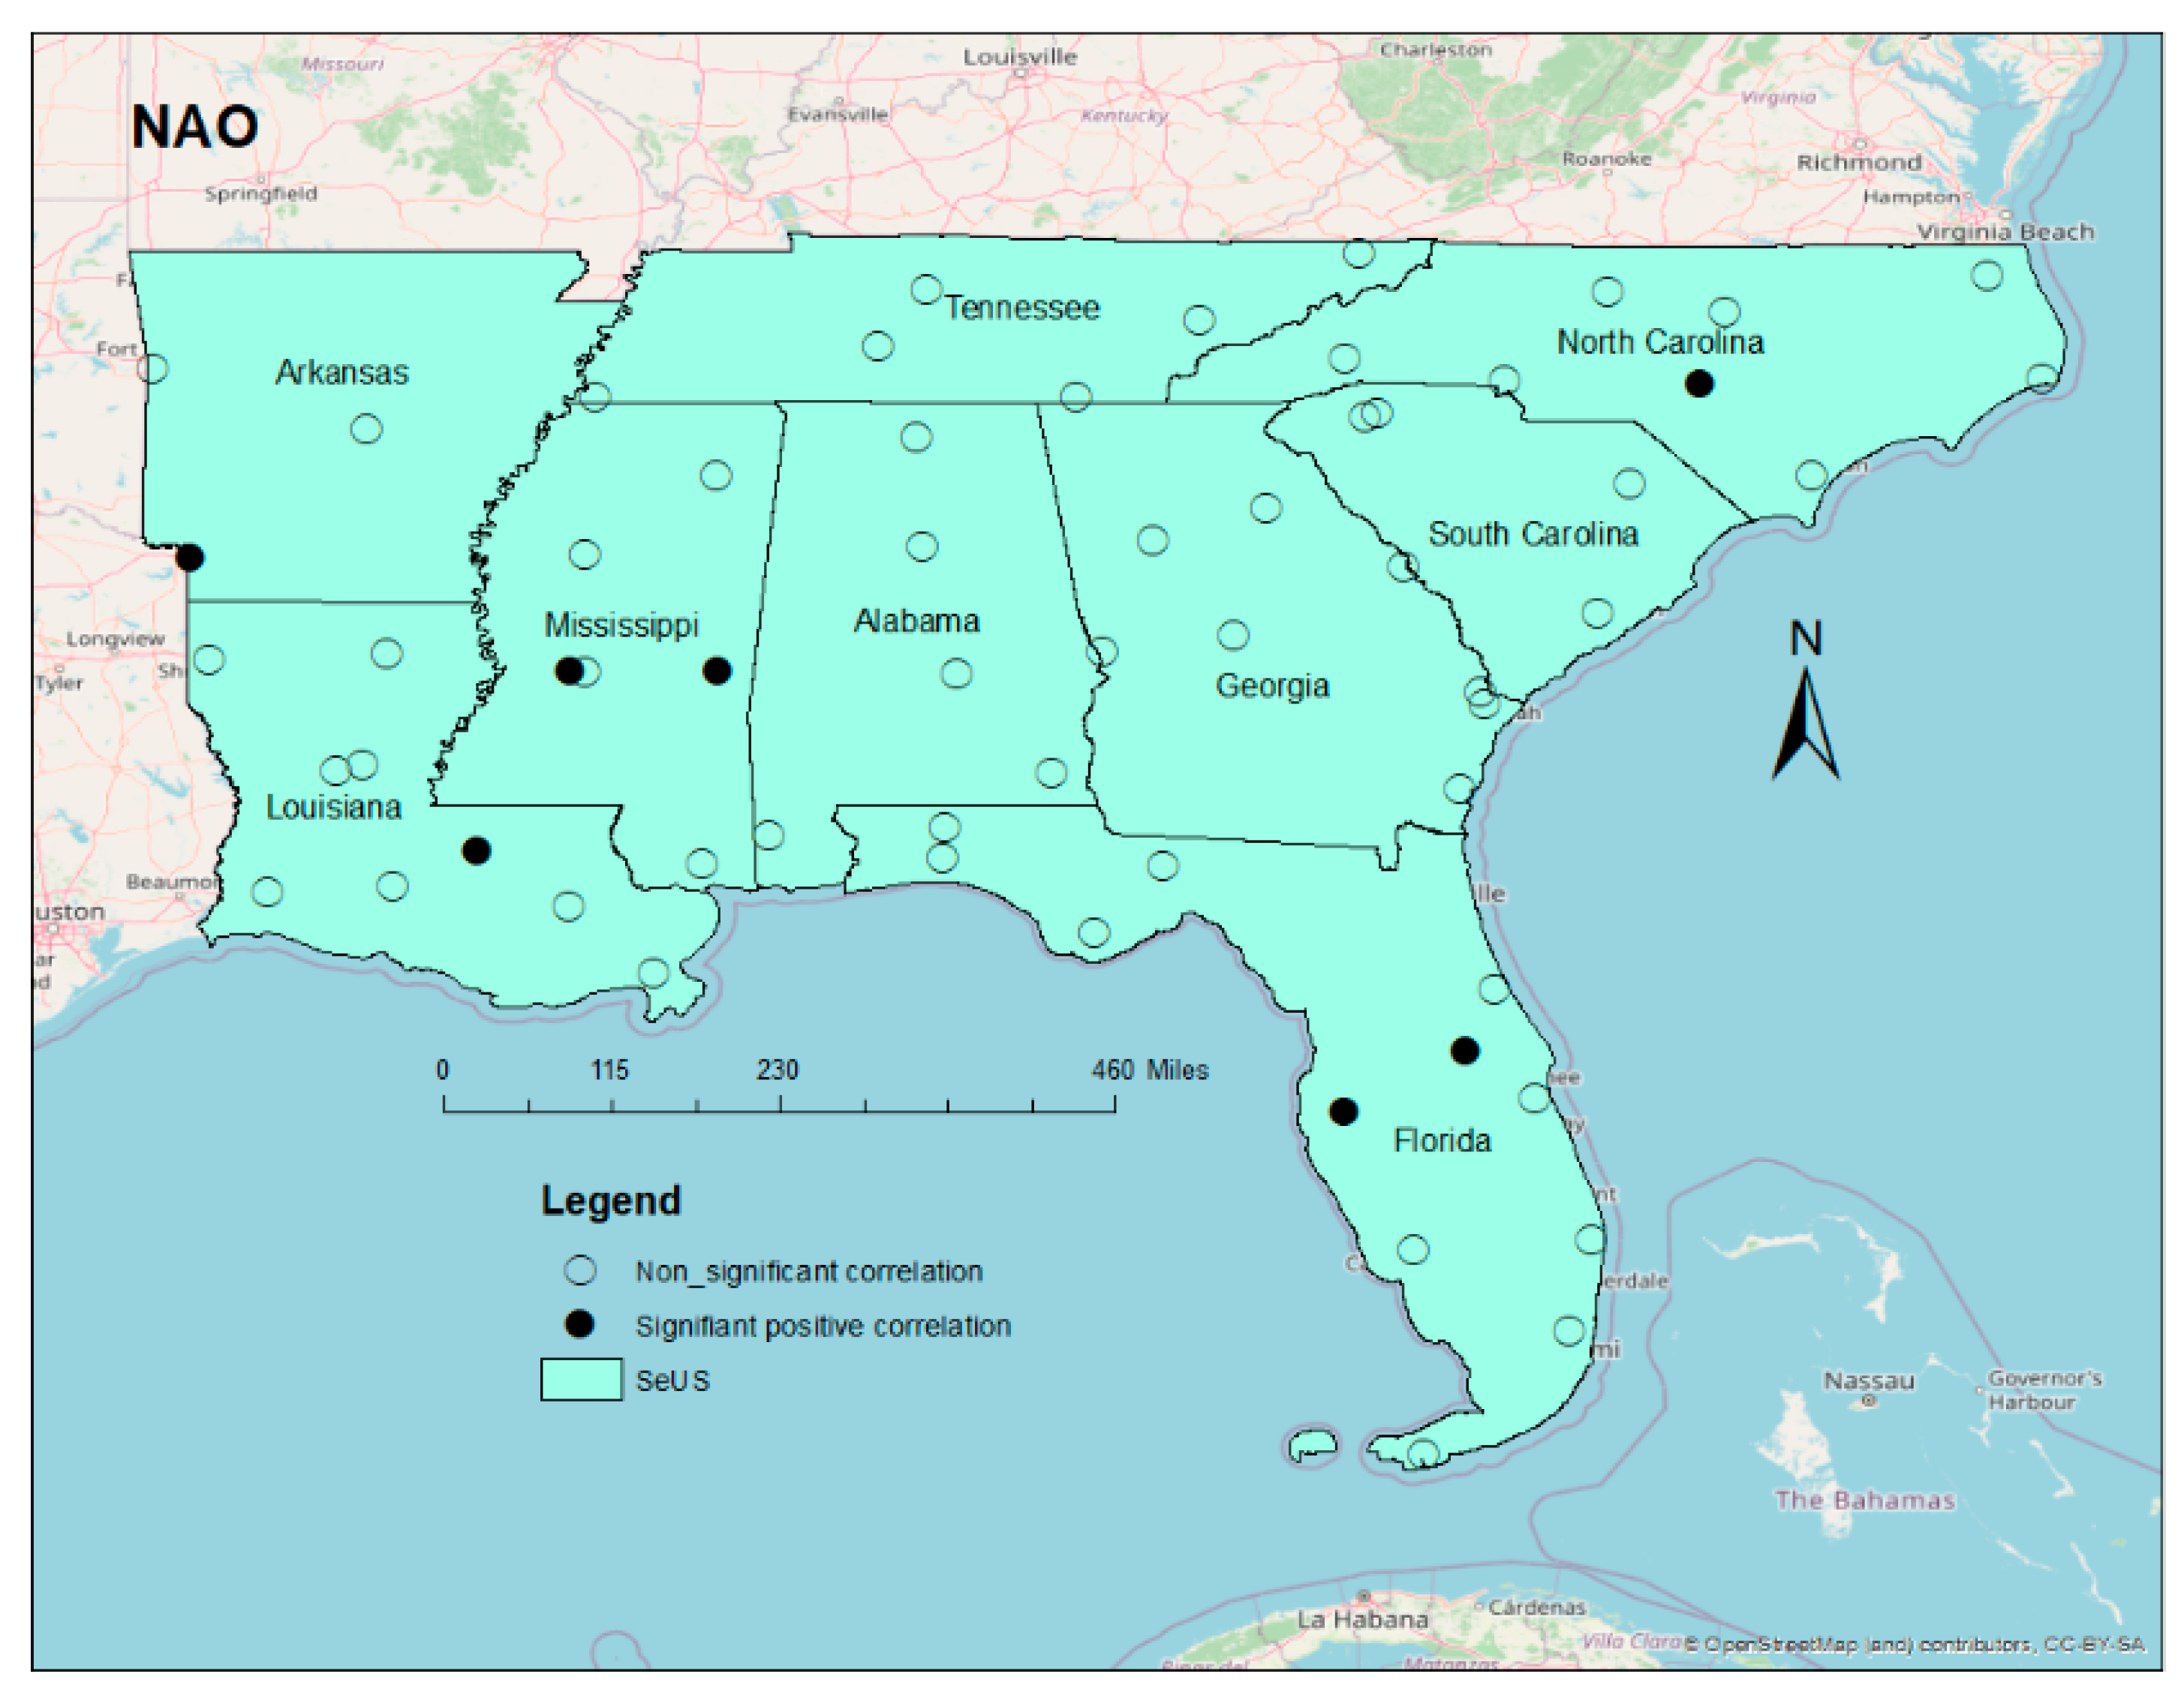
The North Atlantic Oscillation (NAO) is a strong mode of winter climate variability in the SeUS but has less influence on the SeUS during summer [32,35,36]. As the map illustrates for the SeUS, NAO has a minor influence on 1IPH events (Figure 12). Only seven stations out of 61 stations recorded a significant correlation with NAO, and six stations overlapped with either AMO or PDO.
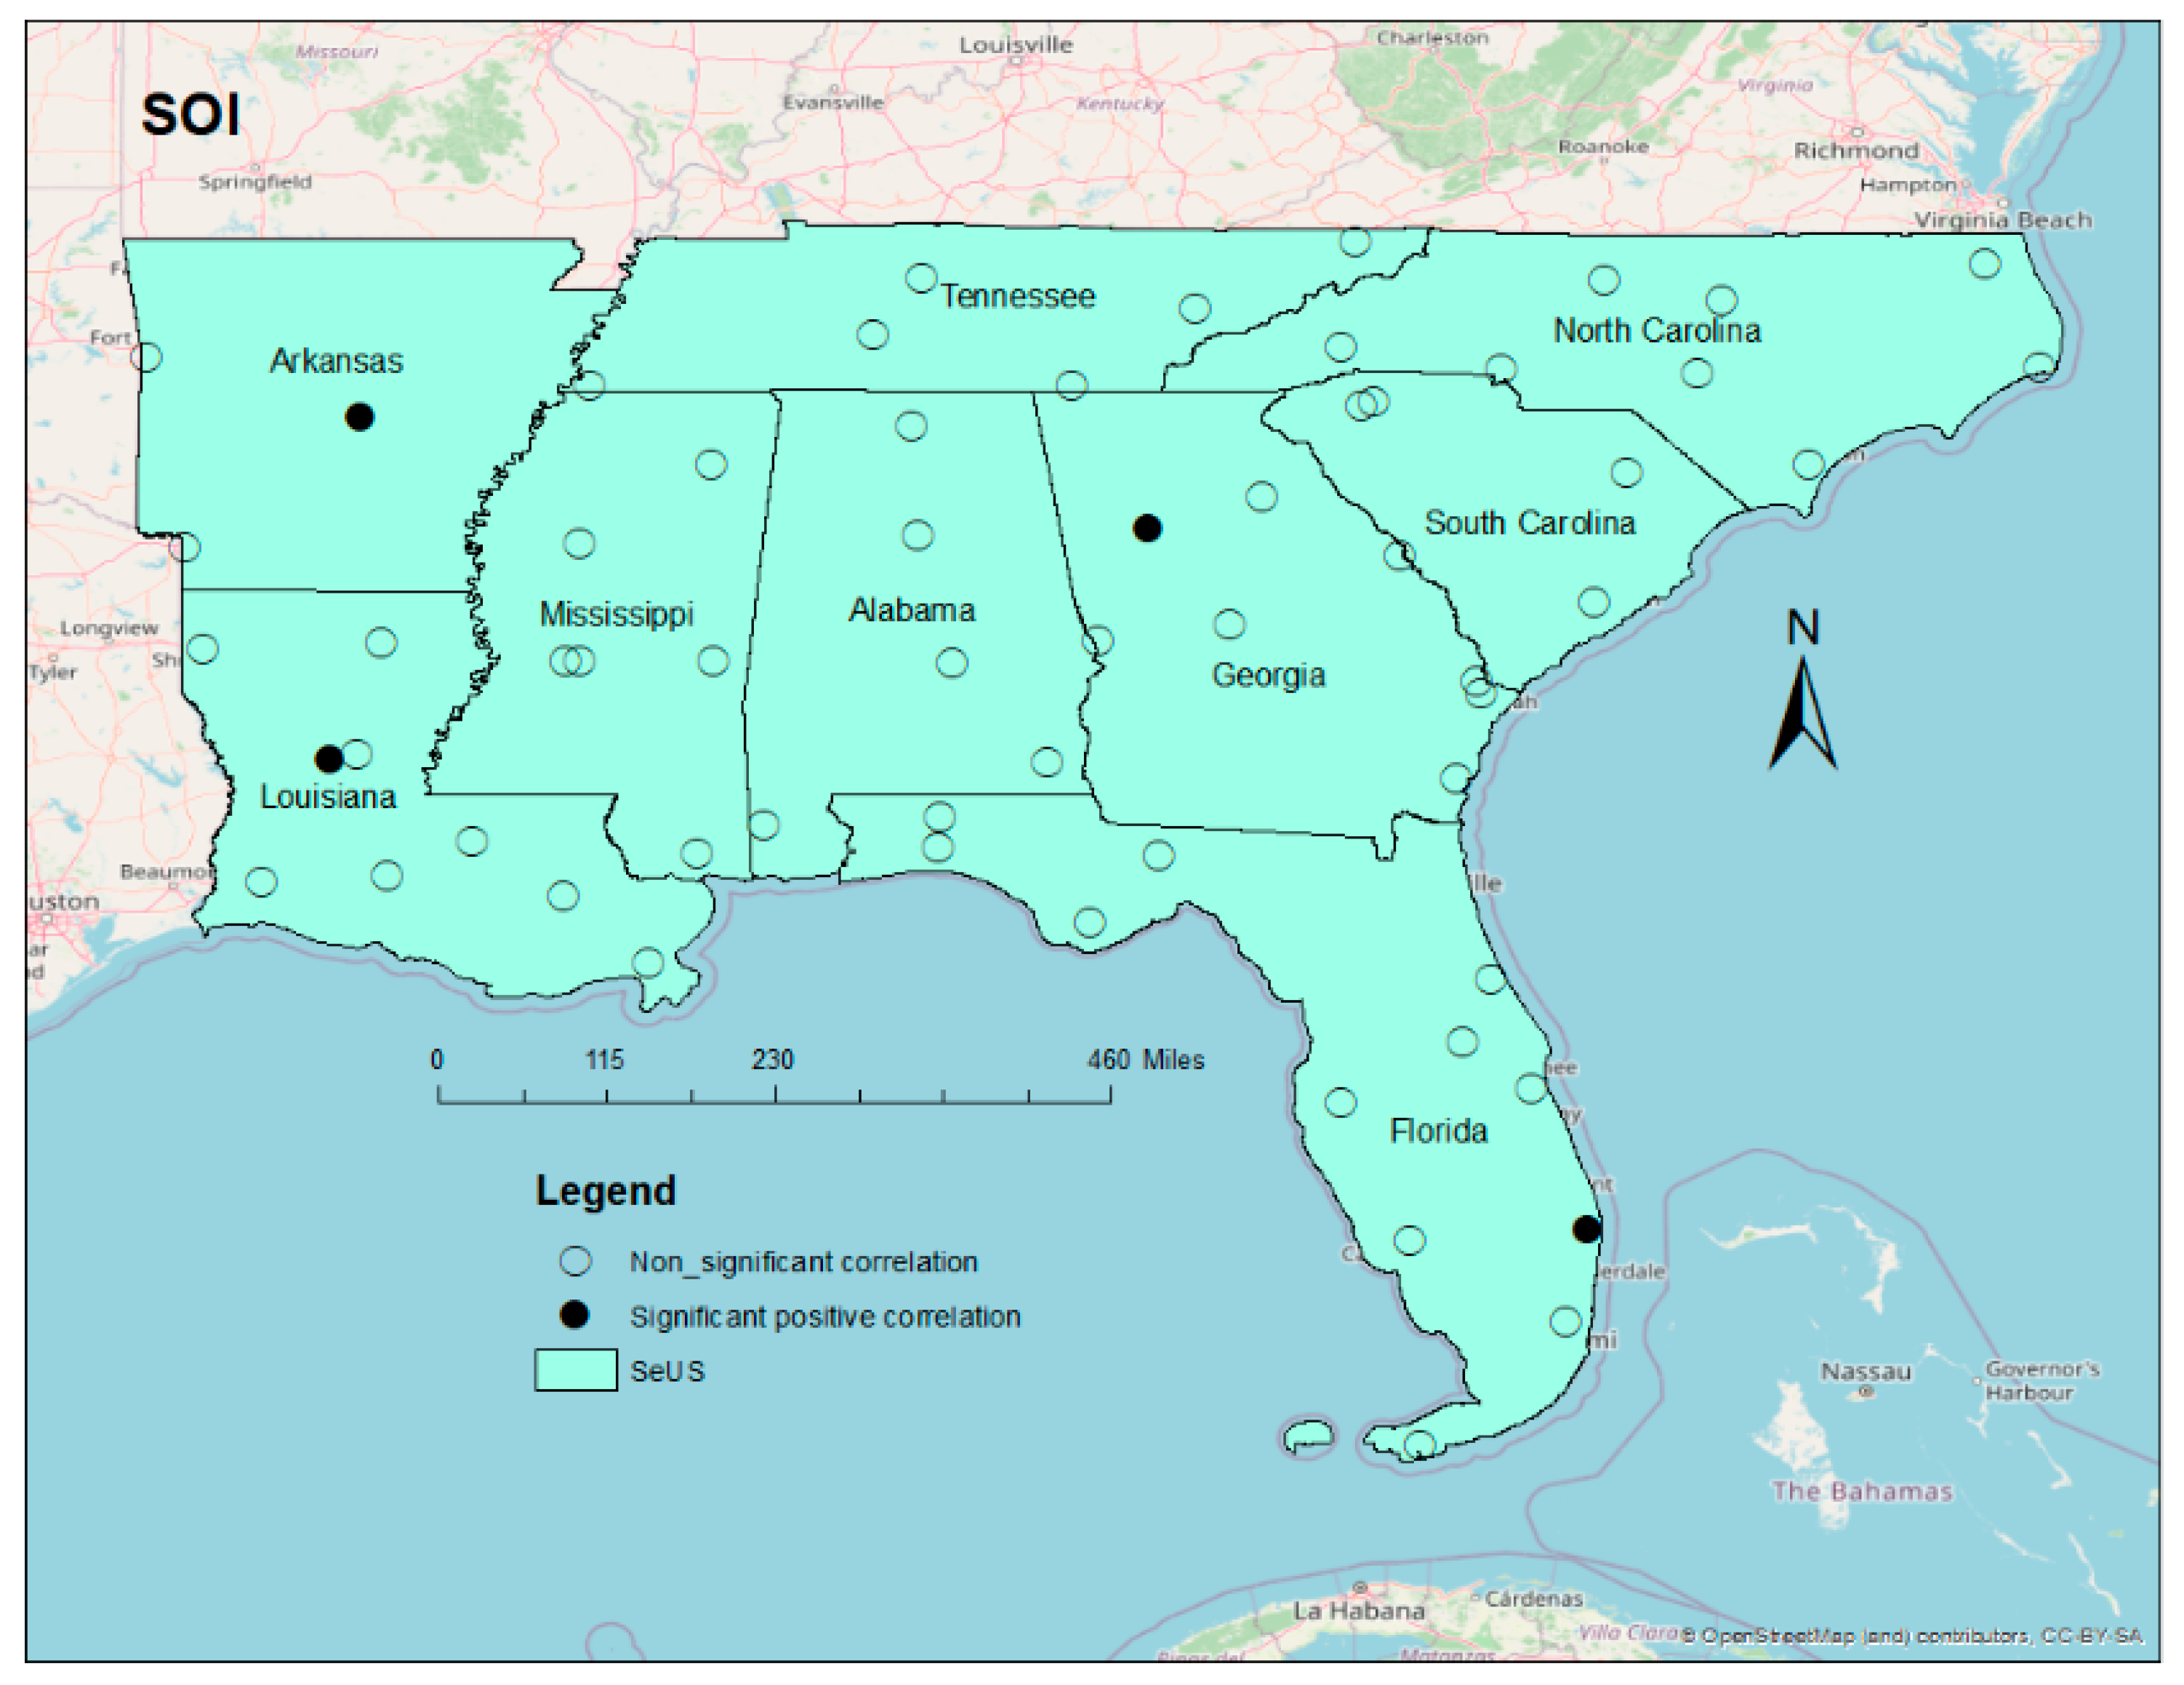
The Southern Oscillation Index (SOI) also plays a crucial role in changes and variability of precipitation and temperature around the globe. For the 1IPH of the SeUS, only four stations recorded a significant correlation with SOI. SOI is the least influential of the four teleconnections (Figure 13). This is surprising considering the established relationship of more and often heavy winter rainfall events associated with El Nino in the SeUS [32]. However, the peak of JJA 1IPH events does not correspond with the most active SOI tele-connective season of winter and early spring in the SeUS.
The SeUS experiences frequent tropical cyclones, and some of these produce major flooding events with 1IPH rainfall rates. Considering this, it is important to quantify the role of tropical cyclones in recorded trends in 1IPH frequency. Seventy tropical cyclones made landfall in the study area from 1980 to 2021. From 1980 to 2021, 7668 1IPH events were recorded, and out of this total, only 567 1IPH (7 percent) overlapped with the 70 tropical cyclones (Figure 14). Increasing tropical cyclone activity is less of a reason for the increasing trends of 1IPH events than was originally thought before this research began. Admittedly, the methodology of counting five consecutive hours as one event helps to normalize the effect of tropical cyclones. Even if the 567 overlapping 1IPH events were multiplied by five, which would artificially exaggerate the contribution of tropical cyclones, the percentage is still only 37 percent.
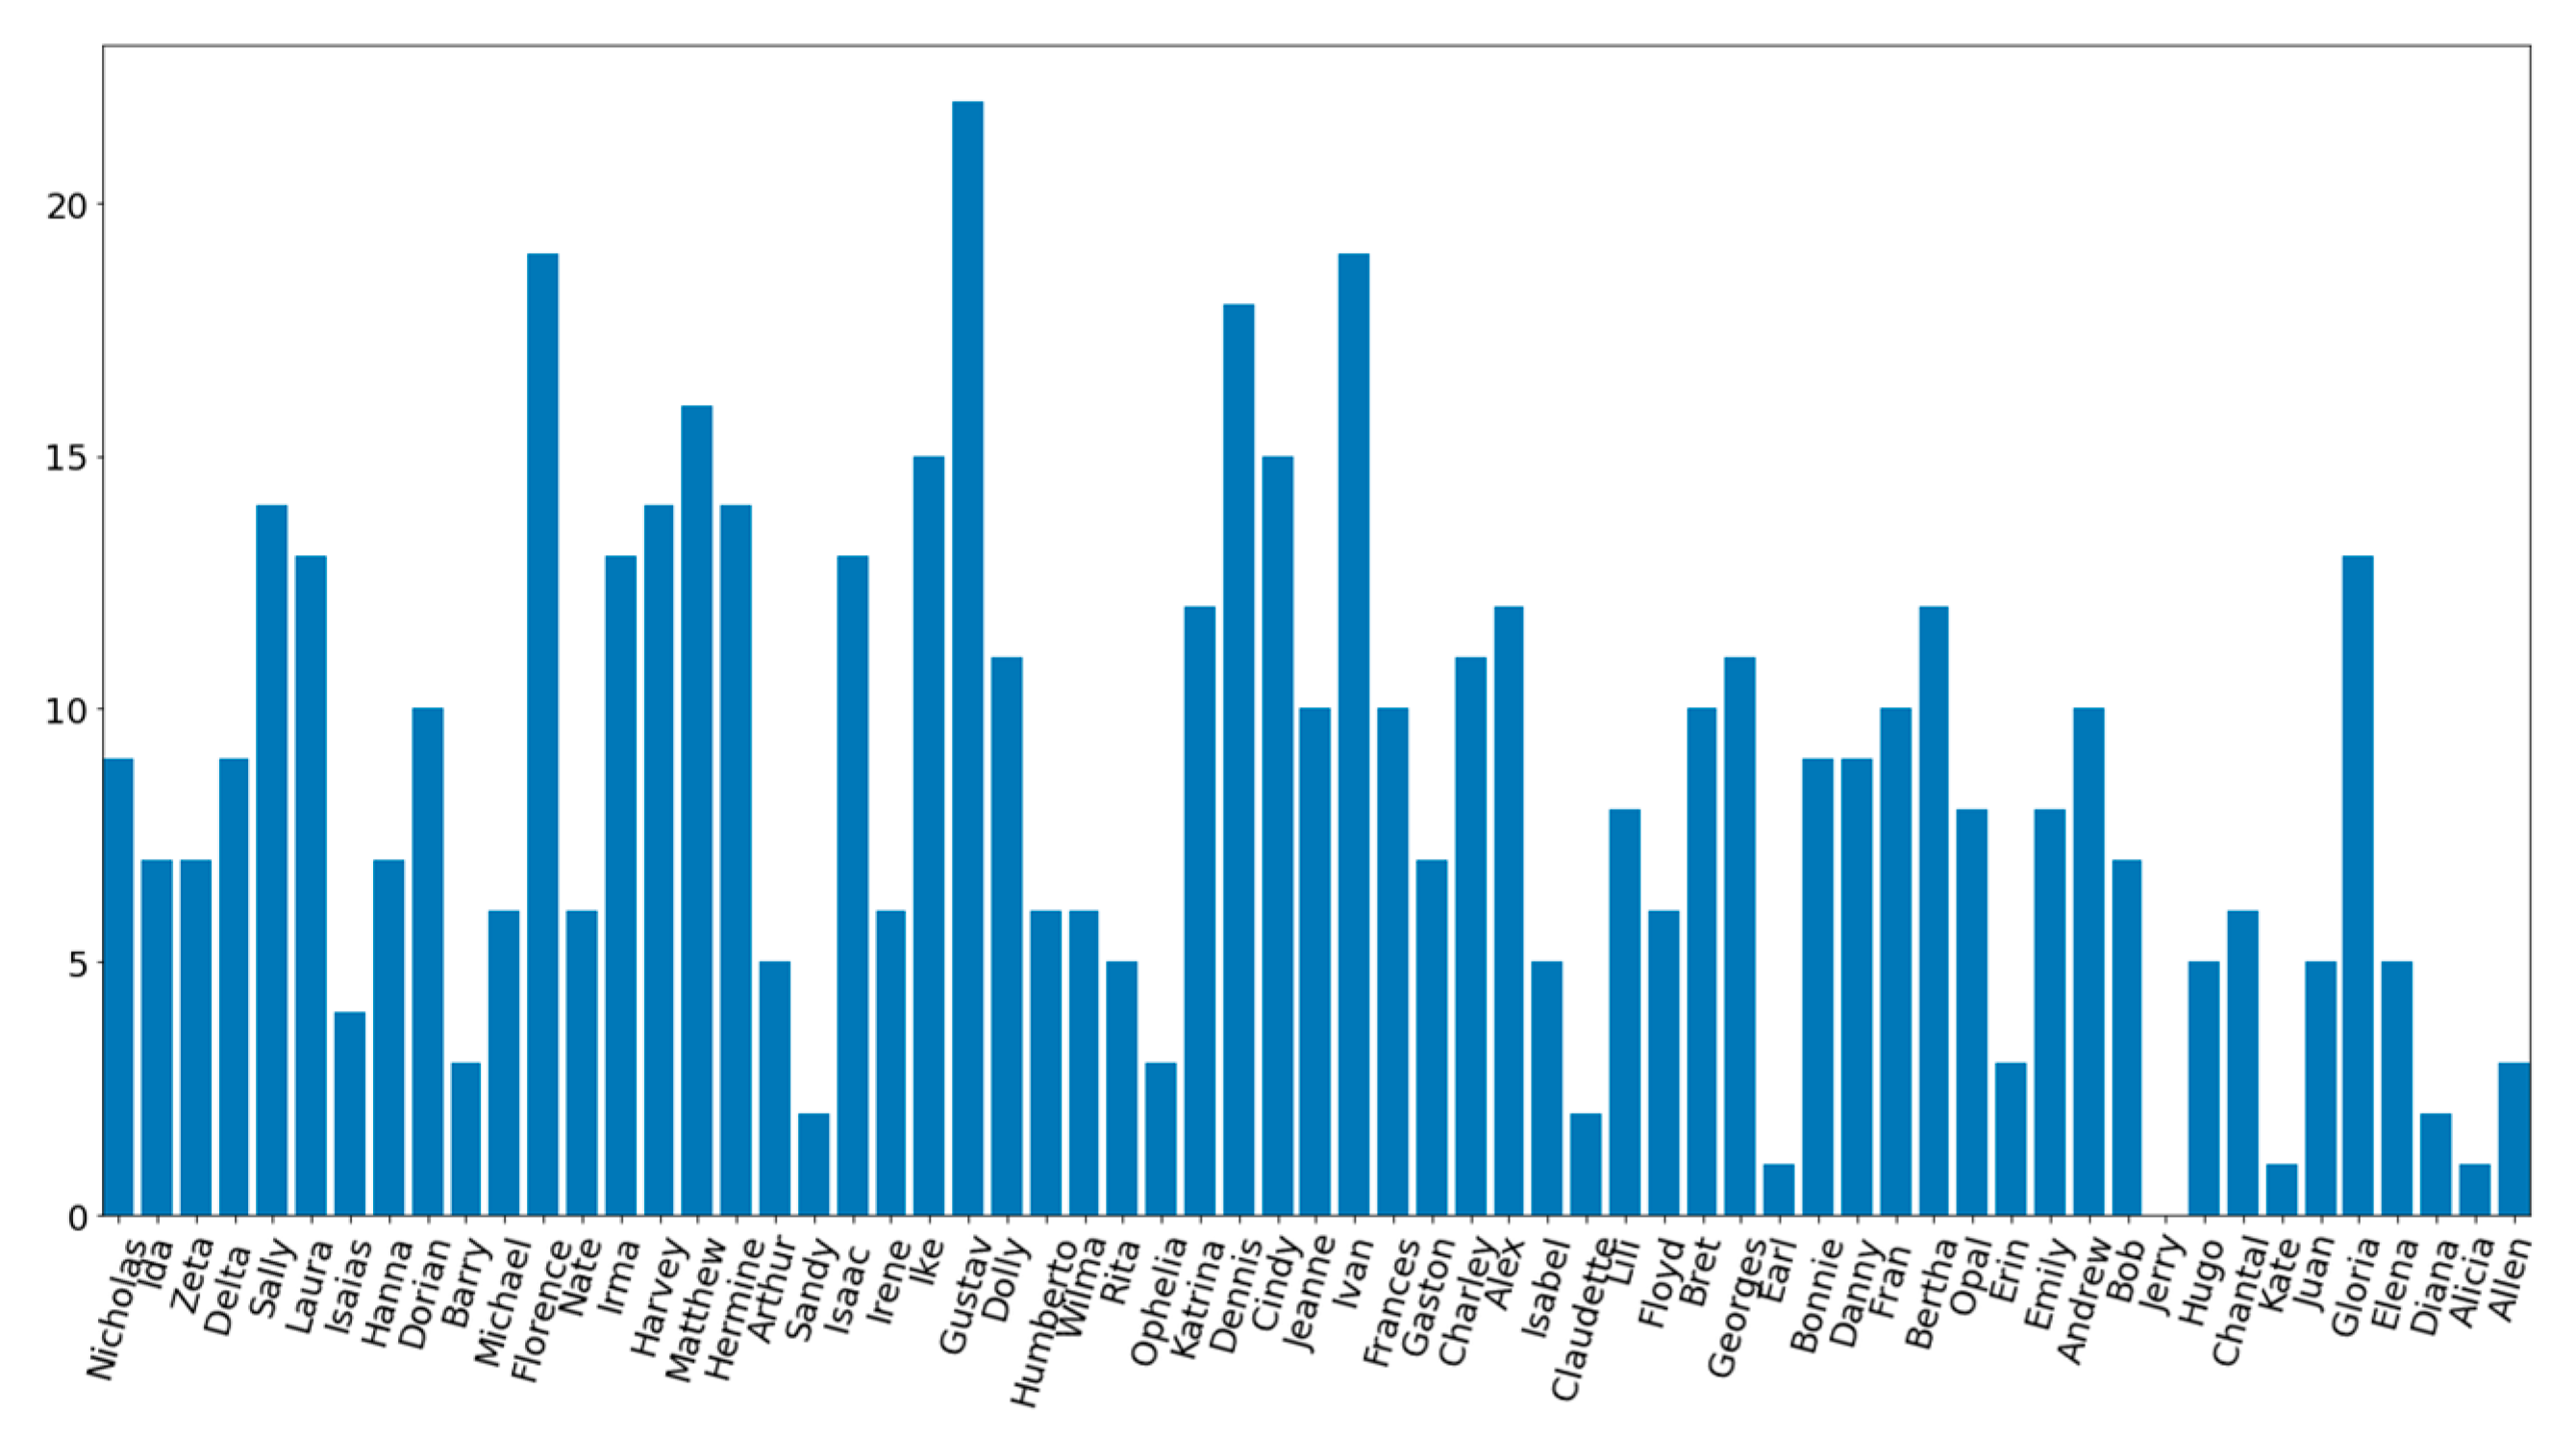
In recent decades, some of the tropical cyclones that made landfall in the US have a higher number of 1IPH overlaps than previous decades. For example, Hurricanes Gustav (2008), Harvey (2017), and Michael (2018) contributed more 1IPH events than other recorded tropical cyclones. This might be because these storms tracked across more stations within the study area, or some storms were slow-moving with longer duration of precipitation (Figure 15). Regardless of tracks, it does not appear that tropical cyclones are the dominant mechanism responsible for the increasing trends in 1IPH events. Other studies also claimed that 60 percent of fall precipitation was frontal while only 11 percent was tropical, and the rest (29 percent) was neither tropical nor frontal precipitation [32,37].
It should be noted that here we have undertaken an examination of trends in observed data that cannot necessarily be extrapolated to the future. Additionally, while correlations between 1IPH events and modes of natural variability and tropical cyclones have given some insight into possible mechanisms behind trends in 1IPH events, further investigation is required to better understand the physical drivers leading to the observed trends in events.

4. Conclusions

This study used 61 weather stations with a record of at least 38 years of precipitation data from the SeUS (Alabama, Arkansas, Florida, Georgia, Louisiana, Mississippi, North Carolina, South Carolina, and Tennessee). Specific objectives were to determine if there were possible trends in 1IPH events, if there were any change points, if 1IPH events were becoming clustered closer together temporally, and what climatic influences may at least partially explain some of the recorded results.
The major findings of this research can be summarized as follows:
  • In the last 20 years, 1IPH events increased by roughly 53 percent in the SeUS. Mann–Kendall trend tests revealed that 21/61 stations recorded a statistically significant increasing trend. Mississippi and Louisiana were the states that had the most stations with significant increasing trends in 1IPH.
  • While most of the states recorded a peak of 1IPH events in JJA, Florida, Louisiana, and Mississippi recorded peaks that are wider and continued beyond JJA. JJA is the peak time for 1IPH events, but 1IPH events are not only limited to JJA, which is very true for the Gulf of Mexico bordering states.
  • Pettit tests were used to detect the presence of significant change points in the 1IPH time series. Results demonstrated that 15/61 stations recorded a significant change point in their 1IPH time series. Most of the stations had a change point before the 1990′s. Three stations out of 15 stations recorded significant decreasing trends, while one station recorded a significant increasing trend before the change point. After the change point, six stations recorded a significant increasing trend, most of which are located close to the Gulf of Mexico coast.
  • For the time between events, 17/61 stations recorded a significant decreasing trend, which implies that 1IPH events are happening more often and closer together in time. A total of 15/61 stations recorded the presence of a significant change point in time between events. One station out of 15 stations recorded a significant increasing trend before the change point time, while nine stations out of 15 stations recorded a significant decreasing trend after the change point. These stations are either coastal or in Florida.
  • Four teleconnection indices (AMO, PDO, NAO, SOI) used in this research had positive relationships with 1 IPH events. Of these, AMO played the most significant role in changes and variability of 1IPH events in the SeUS.
  • Tropical cyclone activity was thought to be an influential factor in changes and variability of SeUS precipitation. Seven percent of the 1IPH events overlapped with tropical cyclones.
  • Although teleconnections are positively correlated with 1IPH at some stations, these climatic influences and natural climatic variability cannot account for the statistically significant increases in extreme precipitation found in our research and in numerous published articles in the SeUS and other regions. Climate change is the most plausible explanation. The phases of certain teleconnections that favor increased extreme precipitation can be exacerbated by climate change to enhance the odds of seeing more frequent extreme precipitation events.

Author Contributions

Conceptualization, M.S.R. and J.C.S.; Methodology, M.S.R., J.C.S. and D.J.K.; Formal Analysis, M.S.R., J.C.S. and D.J.K.; Writing, original draft preparation, M.S.R. and J.C.S.; Writing, review and editing, M.S.R., J.C.S. and D.J.K. All authors have read and agreed to the published version of the manuscript.

Funding

This research received no external funding.

Data Availability Statement

Publicly available datasets were analyzed in this study. Hourly precipitation data used in this study can be found here: https://mesonet.agron.iastate.edu/request/asos/hourlyprecip.phtml?network=AL_ASOS/ accessed on 7 May 2023. Hurricane data were collected from National Hurricane Center official website, and large-scale teleconnections data are freely available and can be accessed from the website provided in the Climatic Attribution section of this manuscript.

Conflicts of Interest

The authors declare no conflict of interest.

References

  1. Groisman, P.Y.; Knight, R.W.; Easterling, D.R.; Karl, T.R.; Hegerl, G.C. Trends in intense precipitation in the climate record. J. Clim. 2005, 18, 1326–1350. [Google Scholar] [CrossRef]
  2. Powell, E.J.; Keim, B.D. Trends in daily temperature and precipitation extremes for the southeastern United States: 1948–2012. J. Clim. 2015, 28, 1592–1612. [Google Scholar] [CrossRef]
  3. Li, C.; Wang, R.H. Recent changes of precipitation in Gansu, Northwest China: An index-based analysis. Theor. Appl. Climatol. 2017, 129, 397–412. [Google Scholar] [CrossRef]
  4. Li, C.; Zhang, H.; Singh, V.P.; Fan, J.; Wei, X.; Yang, J.; Wei, X. Investigating variations of precipitation concentration in the transitional zone between Qinling Mountains and Loess Plateau in China: Implications for regional impacts of AO and WPSH. PLoS ONE 2020, 15, e0238709. [Google Scholar] [CrossRef] [PubMed]
  5. IPCC. Climate Change 2022: Impacts, Adaptation, and Vulnerability. Contribution of Working Group II to the Sixth Assessment Report of the Intergovernmental Panel on Climate Change; Pörtner, H.-O., Roberts, D.C., Tignor, M., Poloczanska, E.S., Mintenbeck, K., Alegría, A., Craig, M., Langsdorf, S., Löschke, S., Möller, V., et al., Eds.; Cambridge University Press: Cambridge, UK, 2022; in press. [Google Scholar]
  6. NOAA; National Centers for Environmental Information (NCEI). U.S. Billion-Dollar Weather and Climate Disasters. 2021. Available online: https://www.ncdc.noaa.gov/billions/ (accessed on 7 May 2023).
  7. Van der Wiel, K.; Kapnick, S.B.; van Oldenborgh, G.J.; Whan, K.; Philip, S.; Vecchi, G.A.; Singh, R.K.; Arrighi, J.; Cullen, H. Rapid attribution of the August 2016 flood-inducing extreme precipitation in south Louisiana to climate change. Hydrol. Earth Syst. Sci. 2017, 21, 897–921. [Google Scholar] [CrossRef]
  8. Brooks, H.E.; Stensrud, D.J. Notes and Correspondence Climatology of Heavy Rain Events in the United States from Hourly Precipitation Observations. Mon. Weather. Rev. 1999, 128, 1194–1201. [Google Scholar] [CrossRef]
  9. Touma, D.; Michalak, A.M.; Swain, D.L.; Diffenbaugh, N.S. Characterizing the Spatial Scales of Extreme Daily Precipitation in the United States. J. Clim. 2018, 31, 8023–8037. [Google Scholar] [CrossRef]
  10. O’Gorman, P.A. Precipitation extremes under climate change. Curr. Clim. Chang. Rep. 2015, 1, 49–59. [Google Scholar] [CrossRef]
  11. Howarth, M.E.; Thorncroft, C.D.; Bosart, L.F. Changes in extreme precipitation in the northeast United States: 1979–2014. J. Hydrometeorol. 2019, 20, 673–689. [Google Scholar] [CrossRef]
  12. Bartels, R.J.; Black, A.W.; Keim, B.D. Trends in precipitation days in the United States. Int. J. Climatol. 2020, 40, 1038–1048. [Google Scholar] [CrossRef]
  13. Skeeter, W.J.; Senkbeil, J.C.; Keellings, D.J. Spatial and temporal changes in the frequency and magnitude of intense precipitation events in the Southeastern United States. Int. J. Climatol. 2019, 39, 768–782. [Google Scholar] [CrossRef]
  14. Brown, V.M.; Keim, B.D.; Black, A.W. Trend analysis of multiple extreme hourly precipitation time series in the southeastern United States. J. Appl. Meteorol. Climatol. 2020, 59, 427–442. [Google Scholar] [CrossRef]
  15. Brown, V.M.; Keim, B.D.; Black, A.W. Climatology and trends in hourly precipitation for the Southeast United States. J. Hydrometeorol. 2019, 20, 1737–1755. [Google Scholar] [CrossRef]
  16. Yu, L.; Zhong, S.; Pei, L.; Bian, X.; Heilman, W.E. Contribution of large-scale circulation anomalies to changes in extreme precipitation frequency in the United States. Environ. Res. Lett. 2016, 11, 044003. [Google Scholar] [CrossRef]
  17. Dourte, D.R.; Fraisse, C.W.; Bartels, W.L. Exploring changes in rainfall intensity and seasonal variability in the Southeastern U.S.: Stakeholder engagement, observations, and adaptation. Clim. Risk Manag. 2015, 7, 11–19. [Google Scholar] [CrossRef]
  18. Vega, A.J.; Henderson, K.G. On the use of eigenvector techniques in climatological analysis. Pa. Geogr. 1996, 34, 50–73. [Google Scholar]
  19. Katz, R.W.; Parlange, M.B.; Tebaldi, C. Stochastic modeling of the effects of large-scale circulation on daily weather in the southeastern U.S. Clim. Chang. 2003, 60, 189–216. [Google Scholar] [CrossRef]
  20. Kunkel, K.E.; Easterling, D.R.; Redmond, K.; Hubbard, K. Temporal variations of extreme precipitation events in the United States: 1895–2000. Geophys. Res. Lett. 2003, 30, 1900. [Google Scholar] [CrossRef]
  21. Mishra, V.; Wallace, J.M.; Lettenmaier, D.P. Relationship between hourly extreme precipitation and local air temperature in the United States. Geophys. Res. Lett. 2012, 39, L16403. [Google Scholar] [CrossRef]
  22. Alipour, A.; Ahmadalipour, A.; Moradkhani, H. Assessing flash flood hazard and damages in the southeast United States. J. Flood Risk Manag. 2020, 13, e12605. [Google Scholar] [CrossRef]
  23. Knight, D.B.; Davis, R.E. Contribution of tropical cyclones to extreme rainfall events in the southeastern United States. J. Geophys. Res. Atmos. 2009, 114, D23102. [Google Scholar] [CrossRef]
  24. Chalise, D.R.; Aiyyer, A.; Sankarasubramanian, A. Tropical cyclones’ contribution to seasonal precipitation and streamflow over the southeastern and southcentral United States. Geophys. Res. Lett. 2021, 48, e2021GL094738. [Google Scholar] [CrossRef]
  25. Zhu, L.; Quiring, S.M. Exposure to precipitation from tropical cyclones has increased over the continental United States from 1948 to 2019. Commun. Earth Environ. 2022, 3, 312. [Google Scholar] [CrossRef]
  26. Mann, H.B. Non-Parametric Test against Trend. Econometrica 1945, 13, 245–259. [Google Scholar] [CrossRef]
  27. Kendall, M.G. Rank Correlation Methods, 2nd ed.; Hafner Publishing Co.: Oxford, UK, 1955. [Google Scholar]
  28. Villarini, G.; Smith, J.A.; Baeck, M.L.; Vitolo, R.; Stephenson, D.B.; Krajewski, W.F. On the frequency of heavy rainfall for the Midwest of the United States. J. Hydrol. 2011, 400, 103–120. [Google Scholar] [CrossRef]
  29. Towfiqul Islam, A.R.M.; Rahman, M.S.; Khatun, R.; Hu, Z. Spatiotemporal trends in the frequency of daily rainfall in Bangladesh during 1975–2017. Theor. Appl. Climatol. 2020, 141, 869–887. [Google Scholar] [CrossRef]
  30. Pettitt, A.N. A non-parametric approach to the change-point problem. J. R. Stat. Soc. 1979, 28, 126–135. [Google Scholar] [CrossRef]
  31. Villarini, G.; Smith, J.A.; Vecchi, G.A. Changing frequency of heavy rainfall over the central United States. J. Clim. 2013, 26, 351–357. [Google Scholar] [CrossRef]
  32. Bishop, D.A.; Williams, A.P.; Seager, R. Increased fall precipitation in the southeastern United States driven by higher-intensity, frontal precipitation. Geophys. Res. Lett. 2019, 46, 8300–8309. [Google Scholar] [CrossRef]
  33. Skeeter, W.; Senkbeil, J. Mid-Tropospheric Flow Characteristics of Intense Precipitation Events in the Southeastern USA. Int. J. Appl. Geospat. Res. 2020, 11, 10–23. [Google Scholar] [CrossRef]
  34. Huang, H.; Winter, J.M.; Osterberg, E.C. Mechanisms of abrupt extreme precipitation change over the northeastern United States. J. Geophys. Res. Atmos. 2018, 123, 7179–7192. [Google Scholar] [CrossRef]
  35. Hurrell, J.W. Decadal trends in the North Atlantic Oscillation: Regional temperatures and precipitation. Science 1995, 269, 676–679. [Google Scholar] [CrossRef] [PubMed]
  36. Visbeck, M.H.; Hurrell, J.W.; Polvani, L.; Cullen, H.M. The North Atlantic Oscillation: Past, present, and future. Proc. Natl. Acad. Sci. USA 2001, 98, 12876–12877. [Google Scholar] [CrossRef] [PubMed]
  37. Kunkel, K.E.; Easterling, D.E.; Kristovich DA, R.; Gleason, B.; Stoecker, L.; Smith, R. Meteorological causes of the secular variations in recorded extreme precipitation events for the conterminous United States. J. Hydrometeorol. 2012, 13, 1131–1141. [Google Scholar] [CrossRef]
Figure 1. Study area with 61 automated surface observation stations in the SeUS.
Atmosphere 14 01301 g001
Figure 2. Flowchart showing methodology used in this research.
Atmosphere 14 01301 g002
Figure 3. Map showing significant and non-significant Mann–Kendall trend test values for the SeUS. Black dots represent non-significant (p > 0.05) and upward red arrows represent a significant increasing trend in 1IPH events (p < 0.05).
Atmosphere 14 01301 g003
Figure 4. 1IPH events per year for different stations in the SeUS. The blue curvy line represents 1IPH counts and the yellow line represents exponential 10 year moving averages.
Atmosphere 14 01301 g004
Figure 5. Density plots of the stations based on month of 1IPH events. Lines represent different stations in that specific state.
Atmosphere 14 01301 g005
Figure 6. Pettit test of 1IPH precipitation events. The black dots represent stations with no significant change point present and black-red mixed dots represent the presence of a change point with significant increasing trend. Black-white mixed dots represent the presence of change points with insignificant trends.
Atmosphere 14 01301 g006
Figure 7. Trend for 1IPH events before and after change points. The up arrow represents statistically significant increasing trends, and the down arrow represents significant decreasing trends. Dots represent no significant trends (The locations of individual stations were placed side-by-side to show both before and after CP in one map).
Atmosphere 14 01301 g007
Figure 8. Map showing trends in 1IPH time between events. The red down arrow represents statistically significant decreasing trends while the black dots represent no statistically significant trend.
Atmosphere 14 01301 g008
Figure 9. Trends in before and after CP in time between events. Dot represents no significant trend, the up arrow represents a significant increasing trend, and down arrow represents significant decreasing trends (The locations of individual stations were placed side-by-side to show both before and after CP in one map).
Atmosphere 14 01301 g009
Figure 10. Pearson correlation between 1IPH frequency and AMO for different stations. Black dots represent statistically significant correlations with AMO, and unfilled black circles represent non-significant correlations with AMO.
Atmosphere 14 01301 g010
Figure 11. As in Figure 10 but for PDO.
Atmosphere 14 01301 g011
Figure 12. As in Figure 10 but for NAO.
Atmosphere 14 01301 g012
Figure 13. As in Figure 10 but for SOI.
Atmosphere 14 01301 g013
Figure 14. Bar plot showing number of 1IPH events overlapped with different tropical cyclones in descending chronological order from left to right.
Atmosphere 14 01301 g014
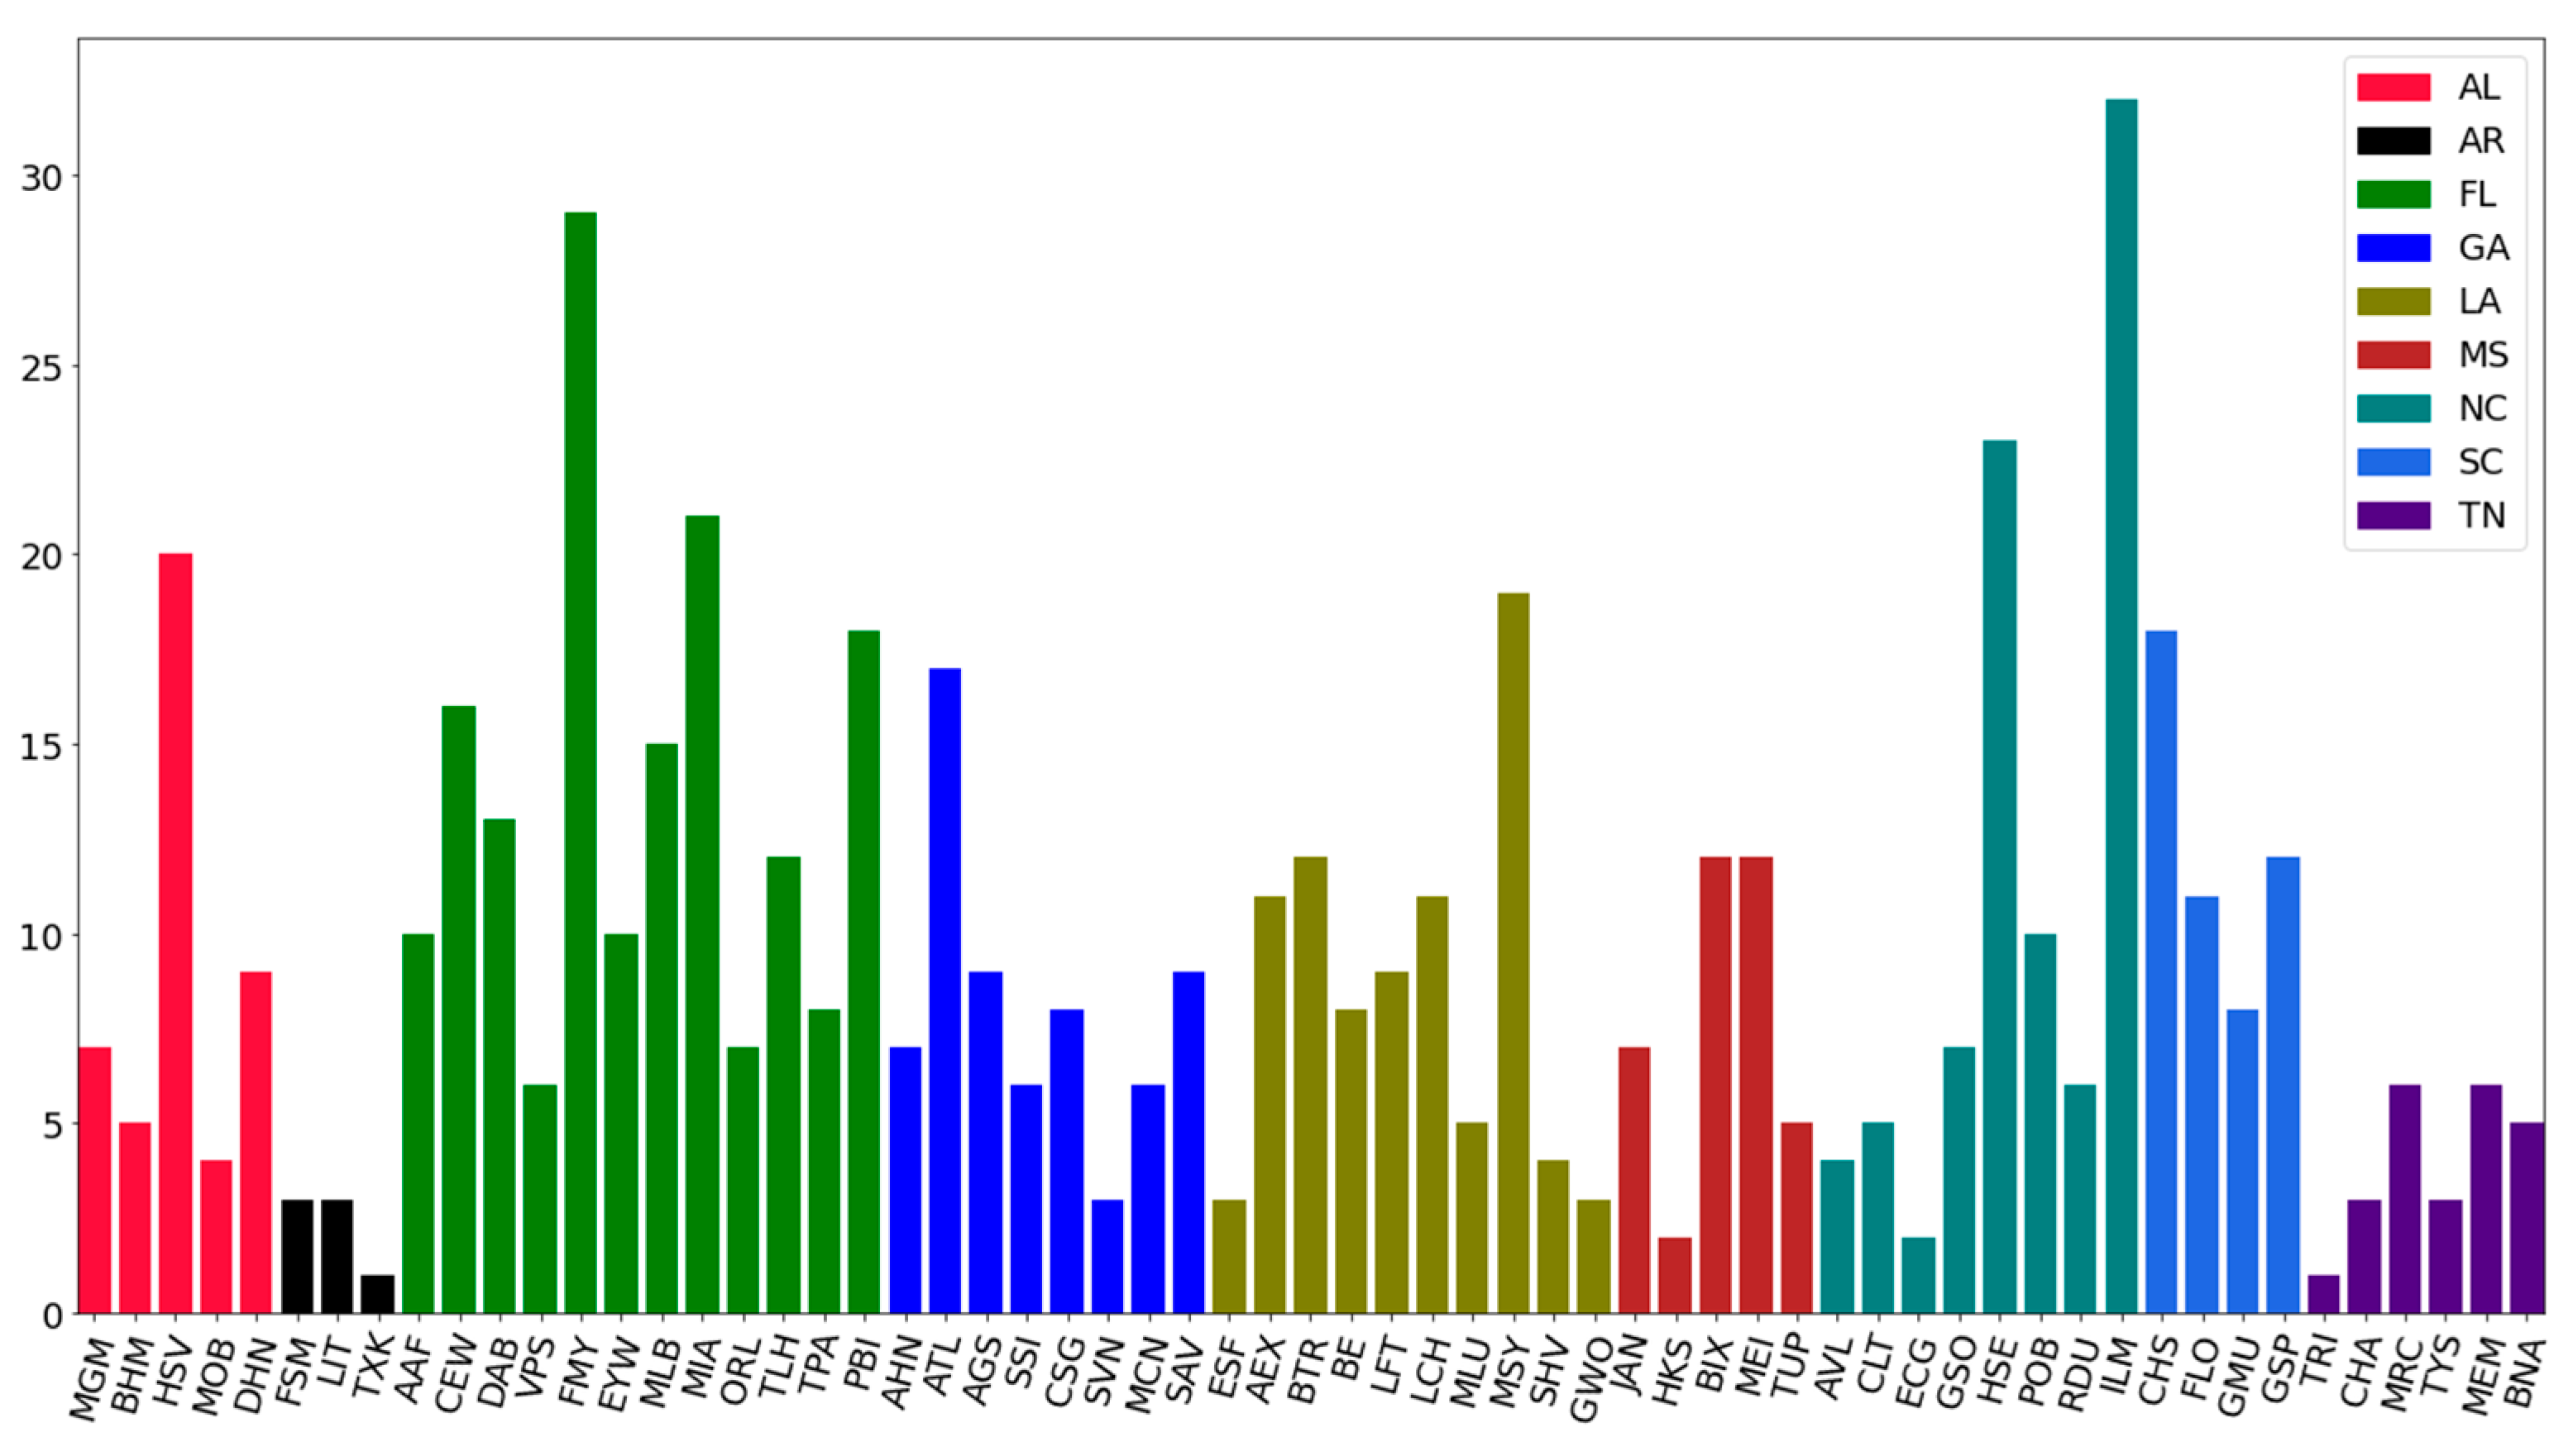
Figure 15. Number of 1IPH overlapped with tropical cyclones at different stations. Colors represent different states.
Atmosphere 14 01301 g015
Table 1. List of stations with start date of historical rainfall data record with highest hourly rainfall recorded in inches and presence of change point and change point year.
StationStateStart YearHighest Hourly RainfallPresence of CPStationStateStart YearHighest Hourly RainfallPresence of CP
BHMAL19503.16NoESFLA19732.69No
DHNAL19493.28NoLCHLA19623.411987
HSVAL19582.33NoLFTLA19473.351966
MGMAL19494.84NoMLULA19473.34No
MOBAL19504NoMSYLA19544.021973
FSMAR19482.371992SHVLA19484.46No
LITAR19482.87NoBIXMS1942241949
TXKAR19482.67NoGWOMS19491.84No
AAFFL19723.771980HKSMS19424.16No
CEWFL19483.071959JANMS19482.78No
DABFL19483.72NoMEIMS19483.41971
EYWFL19524.5NoTUPMS19733.4No
FMYFL19764.48NoAVLNC19642.35No
MIAFL19504.511984CLTNC19482.83No
MLBFL197431988ECGNC19493.14No
ORLFL19842.65NoGSONC19482.57No
TLHFL19584.83NoHSENC19573.131985
TPAFL19483.011992ILMNC19503.43No
PBIFL19483.31NoPOBNC194824No
VPSFL19472.66NoRDUNC19482.64No
AHNGA19583.08NoCHSSC19493.89No
ATLGA19483.58NoFLOSC19492.1No
AGSGA19483.14NoGMUSC19483.46No
CSGGA19484.51NoGSPSC19623No
MCNGA19583.59NoBNATN19482.9No
SAVGA19483.71NoCHATN19482.47No
SSIGA19486.07NoTRITN19482.83No
SVNGA19483.01NoTYSTN19482.78No
AEXLA19593.1NoMEMTN19482.61975
BELA19654.31987MRCTN19483.35No
BTRLA19483.581977
Disclaimer/Publisher’s Note: The statements, opinions and data contained in all publications are solely those of the individual author(s) and contributor(s) and not of MDPI and/or the editor(s). MDPI and/or the editor(s) disclaim responsibility for any injury to people or property resulting from any ideas, methods, instructions or products referred to in the content.