Article

Evaluating the Present and Future Heat Stress Conditions in the Grand Duchy of Luxembourg

Environmental Research and Innovation, Luxembourg Institute of Science and Technology, 4422 Luxembourg, Luxembourg
*
Author to whom correspondence should be addressed.
Atmosphere 2024, 15(1), 112; https://doi.org/10.3390/atmos15010112
Submission received: 13 December 2023 / Revised: 13 January 2024 / Accepted: 15 January 2024 / Published: 17 January 2024

Abstract

:
The impact of elevated air temperature and heat stress on human health is a global concern. It not only affects our well-being directly, but also reduces our physical work capacity, leading to negative effects on society and economic productivity. Climate change has already affected the climate in Luxembourg and, based on the results of regional climate models, extreme heat events will become more frequent and intense in the future. To assess historical conditions, the micro-scaleRayManPro 3.1 model was used to simulate the thermal stress levels for different genders and age classes based on hourly input data spanning the last two decades. For the assessment of future conditions, with a special emphasis on heat waves, a multi-model ensemble of regional climate models for different emission scenarios taken from the Coordinated Regional Climate Downscaling Experiment (CORDEX) was used. For both, the past and future conditions in Luxemburg, an increase in the heat stress levels was observed. Small differences for different age groups and genders became obvious. In addition to the increase in the absolute number of heat waves, an intensification of higher temperatures and longer durations were also detected. Although some indications of the adaptation to rising air temperatures can be observed for high-income countries, our results underscore the likelihood of escalating heat-related adverse effects on human health and economic productivity unless more investments are made in research and risk management strategies.

1. Introduction

Global change poses serious risks to the health, safety, and well-being of people and ecosystems worldwide, and rising heat stress levels due to climate change are considered a major element of those risks. According to the latest Lancet report, in 2023, the world experienced record-breaking global temperatures, surpassing those recorded in the past 100,000 years [1]. The last eight years have been the warmest ever and, in 2022, many temperature records were broken on every continent. In addition, July 2023 is the hottest month that has been recorded since the present day [1]. These temperature records have major negative impacts on human health and, based on current greenhouse gas emissions plans, air temperatures will rise by 2.7 °C until the end of the century [2]. This continuous increase in the average air temperature also affects the frequency and intensity of extreme events, such as prolonged periods with consecutive days where conditions are hotter than normal. Even minor variations in the yearly average air temperature can have a significant impact on the intensity of extreme weather occurrences [3].
For the evaluation of historical thermal stress levels in Luxembourg, we calculated the physiologically equivalent temperature (PET) with the RayMan Pro model Ver. 3.1 based on the measurements from the WMO (World Meteorological Organization) station at Findel Airport (ID 06590) [4]. The suitability of the PET for the assessment of the potential health impacts of different thermal stress levels was recently investigated [5,6,7,8]. According to the 2022 Europe report of the Lancet Countdown on health and climate change, the global population’s exposure to heat stress increased by an average of 57% between the period from 2010 to 2019 compared to the period from 2000 to 2009. Especially older people and people with underlying chronic health conditions are facing higher risks of heat-related morbidity and mortality [9,10]. The heat-related mortality of people older than 65 years increased by 85% compared to the period of 1990–2000 [1]. A recent study based on the Eurostat mortality database estimated over 61,672 heat-related deaths in Europe during the heat wave of 2022, occurring between 30 May and 4 September [11]. Women throughout all age groups are, with 56% of heat-related deaths, more severely affected than men. An analysis of heat-related deaths in Slovenia between 2003 and 2015 for different age groups and genders showed that the +75 age group was the most severely affected [12]. Extreme heat not only contributes to negative health impacts, but also results in frequent disruptions to outdoor work and negative consequences for both natural and managed ecosystems [13,14].
The absence of a universally, internationally accepted definition for heat waves poses a significant challenge when studying their impact on society [15]. Various sectors, such as human health, agriculture, and energy, are affected differently by these events, which contribute to the lack of a consensus [16]. In order to ensure a maximum level of comparability, we used the following indices related to heat waves from the Expert Team on Sector-Specific Climate Indices (ET-SCIs) [17] of the WMO Commission for Climatology (CCI): heat wave number, number of days that contribute to heat waves, length of the longest heat wave, and the heat wave magnitude. The advantage of these standardized indices is that comparisons of the temporal and spatial trends between different regions are possible [18]. In addition, we used three more simple threshold-based indices, such as tropical night, summer days, and consecutive warm days.
Developing effective strategies to adapt and mitigate the health and economic impacts of future heat waves requires a thorough understanding of these events. To achieve this, an ensemble of transient regional climate change projections from the Coordinated Regional Climate Downscaling Experiment (CORDEX) was used. To encompass the full spectrum of potential changes, we examined three Representative Concentration Pathways (RCPs); RCP26, RCP46, and RCP85. A time series spanning from January 1971 to December 2099, encompassing daily minimum and maximum air temperatures, was constructed. Comparable studies were recently published for Romania [19], Portugal with the same set of RCPs [20], Asia and China [21,22], five Swedish cities [23], as well as the Mediterranean area [24].
To date, a comprehensive assessment of the historical and future heat stress conditions in the Grand Duchy of Luxembourg, utilizing a multi-model ensemble of bias-corrected outputs from regional climate models forced with different emission scenarios, has not been carried out yet. The scientific objectives of this study are: (1) to examine thermal stress levels experienced in the past using a thermo-physiological index, (2) to assess the impact of thermal stress on different genders and age groups, and (3) to evaluate the severity of past and future heat waves based on bias-corrected regional climate change projections.
The paper is structured as follows. After the introduction, in Section 2, the methods, such as observational datasets; regional climate projections, including the bias-correction method; and the RayMan model for the thermal stress assessment are described. Section 3 presents the main findings, while Section 4 discusses these results in relation to other international peer-reviewed studies. The paper concludes with a short summary and recommendations for future mitigation strategies.

2. Materials and Methods

2.1. Station Data

The regional reference time series was obtained from the Findel Airport SYNOP (synoptic observation) station (WMO station ID = 06590). This station, situated southeast of the City of Luxembourg (49°37′57.547″ N/6°13′58.543″ E), is the sole official WMO station in the country. To evaluate thermal stress using the PET, we utilized continuous hourly data for air temperature, humidity, windspeed, and global radiation for the period between January 2006 and December 2020. For the bias correction of the regional climate models’ daily values, the air temperature and precipitation covering the period from 1 January 1971 to 31 December 2000 were used.

2.2. Regional Climate Projections

For the assessment of the regional climate change signal, we used time series derived from a multi-model ensemble of climate change projections from the Coordinated Regional Climate Downscaling Experiment (EURO-CORDEX) project of the World Climate Research Programme (WCRP). The data were retrieved from the data nodes of the Earth System Grid Federation (ESGF) model data dissemination system [25] for three Representative Concentration Pathways (RCPs), namely, RCP26, RCP45, and RCP85 [26]. The data consisted of transient model simulations from 1950 to 2100. Table 1 lists the models used in our study.
The time-series data were obtained by the use of a bilinear resampling algorithm (using the Climate Data Operators, CDO, v1.8.1 software, https://code.mpimet.mpg.de/projects/cdo; accessed on 15 January 2022) from the EUR-11 RCM model grid. However, certain inconsistencies were noted between the models. For instance, in model M13, leap years were not taken into account, while in model M5, the first day (1 January 1971) was missing. Gaps due to leap years were filled via a linear interpolation and the missing values for 1 January in M5 were replaced by the values of 2 January. The time-series data of air temperature showed no other anomalies, such as gaps, missing values, or outliers.

2.3. Bias Correction of Model Data

We used a non-parametric quantile mapping technique to correct biases in the climate model outputs by adjusting their distribution to match the distribution of the observed data from the WMO station in Findel. In this approach, the Cumulative Distribution Function (CDF) of the model output was transformed to match the CDF of the observed data through empirical quantiles, without specifying a parametric form for the distributions [27]. In the first step, the corresponding model output and observed data were sorted separately in ascending order. Then, the empirical CDFs of the model output and observed data based on their respective rankings were calculated [28]. Afterwards, the quantile mapping function by matching the empirical quantiles of the model output with those of the observed data was calculated. Specifically, for each quantile value (e.g., the 10th percentile), the corresponding value of the observed data was matched with the value of the model output. The mapping function was achieved by interpolating between these pairs of quantiles [29]. Finally, a quantile mapping function was applied to the model output to correct the bias. Specifically, for each value of the model output, the quantile mapping function was used to find the corresponding quantile of the observed data, and this quantile was then transformed into the corrected value of the model output [30]. The non-parametric quantile mapping approach using empirical quantiles is a flexible method that can correct biases in the entire distribution of the model output, not just at specific quantiles. However, it requires enough observed data for an accurate estimation of the empirical CDF and mapping function. The method was implemented in the R programming language for statistical computing [31] by means of the R-package “qmap”, version 1.0-4 [32].

2.4. RayMan Pro 3.1 and Physiologically Equivalent Temperature

The RayMan Pro 3.1 model (radiation in the human body) was used is to calculate the mean radiant temperature and different thermal indices for the quantification of thermal conditions, such as thermal comfort and cold and heat stress. The micro-scale model—developed at the Chair for Environmental Meteorology, former Chair for Meteorology and Climatology of the Albert Ludwig University of Freiburg—was developed to calculate radiation fluxes in simple and complex environments. RayMan is a one-dimensional model that performs all calculations for one point. The model simulates the short- and long-wave radiation flux densities from the three-dimensional surroundings and is freely available. A detailed description of the model is given by Matzarakis et al. (2007, 2013) [4,33]. It requires the air temperature, air humidity, and wind speed as meteorological input variables. The mean radiant temperature can be calculated based on global radiation or cloud coverage.
In this study, the PET was used due to its widely known temperature unit (°C) as an indicator of thermal stress or thermal comfort. PET was introduced in 1987 [34] and adjusted to Middle Western Europe, based on the human energy balance [35]. The PET is based on the MEMI model [36] (Munich energy balance model for individuals) and provided the possibility to assess thermal–physiological perception due to thermal conditions. PET is defined to be equivalent to the air temperature that is required to reproduce in a standardized setting and, for a standardized person, the core and skin temperatures that are observed under the conditions being assessed [36]. The standardized person is characterized by a work metabolism of 80 W of light activity, in addition to basic metabolism, and by 0.9 clo (insulation effect of clothes, where 0.0 corresponds to a naked person and 1.0 corresponds to the insulating value of clothing needed to maintain a person’s comfort while sitting and at rest in a room at 21 °C with an air movement value of 0.1 m/s and humidity less than 50%) of heat resistance as a result of clothing. More details for the PET are given by Matzarakis et al., 2007 [33] or VDI 1998 [37].

2.5. Climate Indices

The Expert Team on Sector-Specific Climate Indices (ET-SCIs) of the World Meteorological Organization (WMO) Commission for Climatology (CCI) created a globally harmonized collection of fundamental climate indices. These indices were based on the daily values of minimum and maximum air temperatures, as well as daily precipitation totals. Their primary objective was to identify shifts in extreme climate conditions. They found widespread application in the identification and attribution of climate change trends in historical datasets [38,39,40], future climate change projections [27,41,42], and investigations into heat waves [43,44]. In Table 2, the indices used in this study are listed. The open source R software package ClimPACT2 (https://github.com/ARCCSS-extremes/climpact2 (accessed on 12 January 2022)) was used to calculate the indices related to heat waves.

3. Results

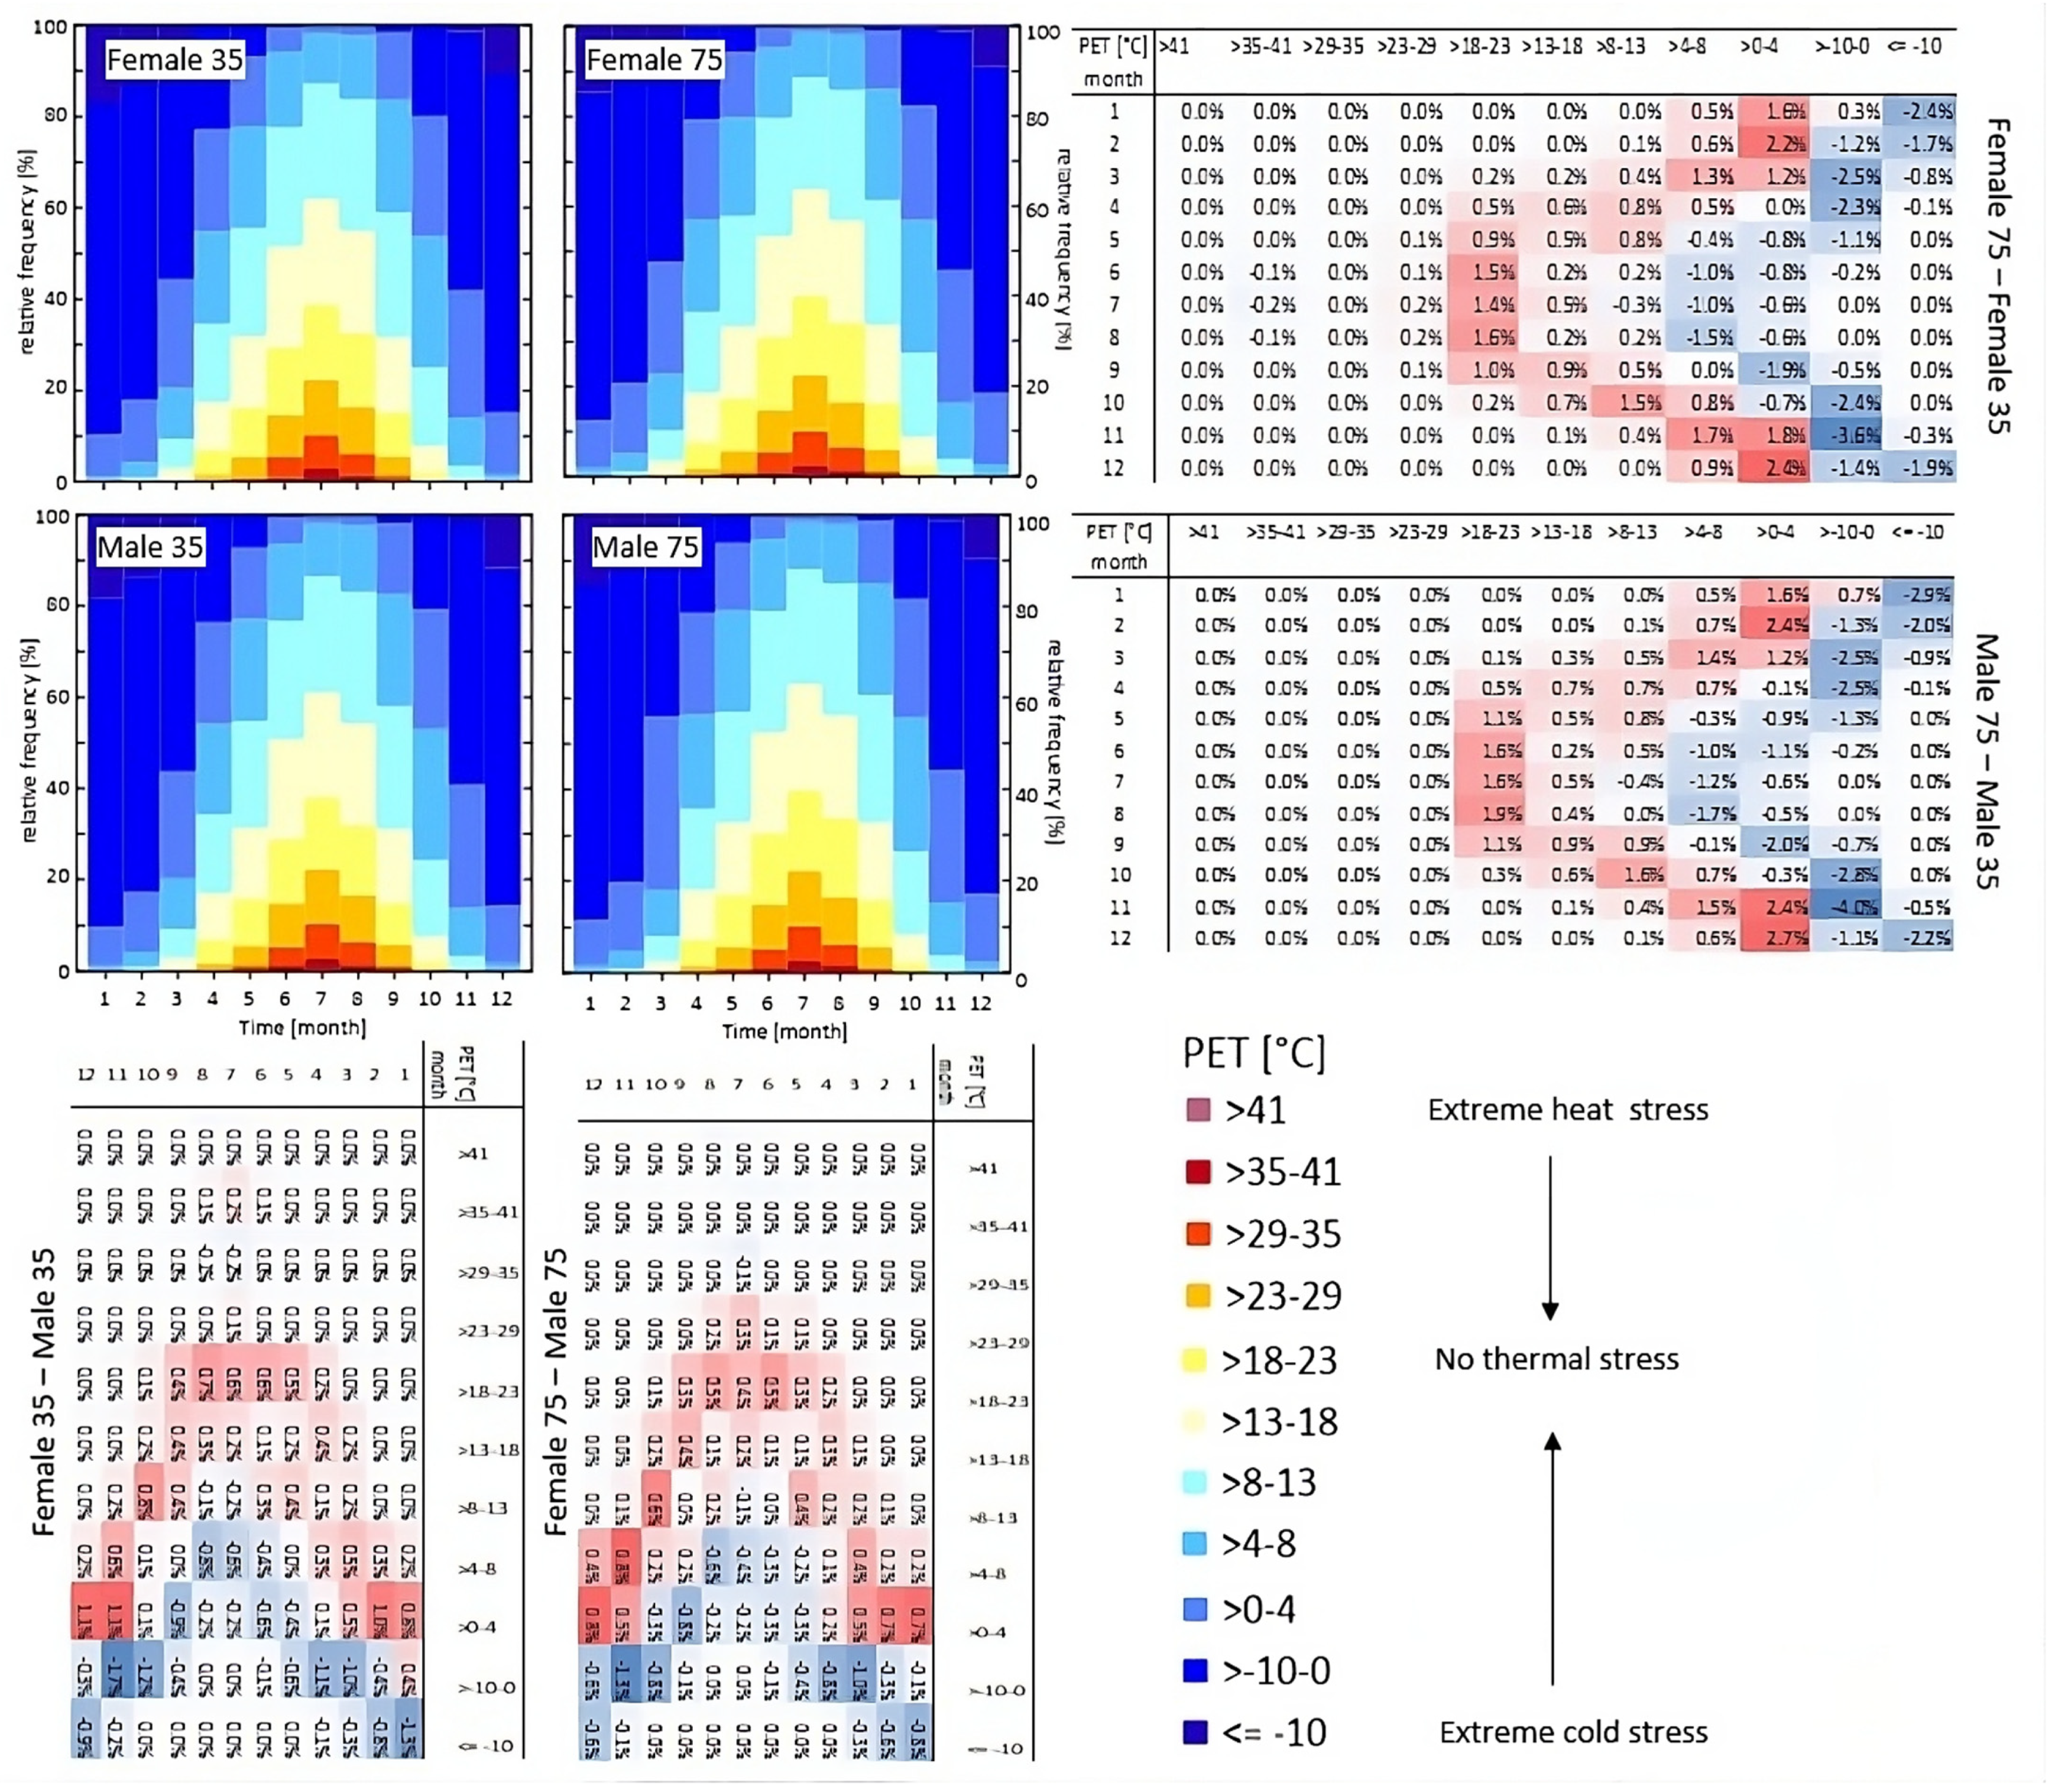
3.1. Thermal Stress Assessment Based on the Measured Data

For the evaluation of human thermal comfort, air temperature alone is insufficient [46]. Other atmospheric factors, such as the relative humidity, wind speed, and radiation fluxes, significantly influence human thermal perception. Therefore, we used long-term measurements of the hourly data of the official WMO station in Findel to calculate the PET with the RayMan Pro 3.1 model for 15 years, starting in 2006. Different genders and ages were considered to account for the different sensitivities of the human body. Figure 1 shows the results of the PET calculation for males and females at different ages as the relative frequency distribution (left side of the figure), as well as the differences in the tables on the right side and below the histograms. The distribution of the PET values shows a typical annual course for a location in Central Europe with the highest PET values in July and August indicating moderate to strong heat stress conditions during up to 10% of the hours. Only 48 h for females (35 years old) and 55 h for males (35 years old) with extreme heat stress were identified for the meteorological summer seasons. The maximum number of hours (up to 24%) with no thermal stress, indicated by PET values between 18° and 23°, also occurred in the summer months for both gender and age groups. In general, older people, independent of their gender, were more sensitive to heat stress. This is indicated by the positive differences (red shading) in the tables on the right side of the figure. The positive differences varied between 0.1% and 2.7% and showed the same pattern for both genders. The inter-gender differences showed the same pattern, but with slightly lower values ranging up to 1.1%. Comparing the results for male and female persons, a slightly higher vulnerability towards heat stress for female persons was observed.

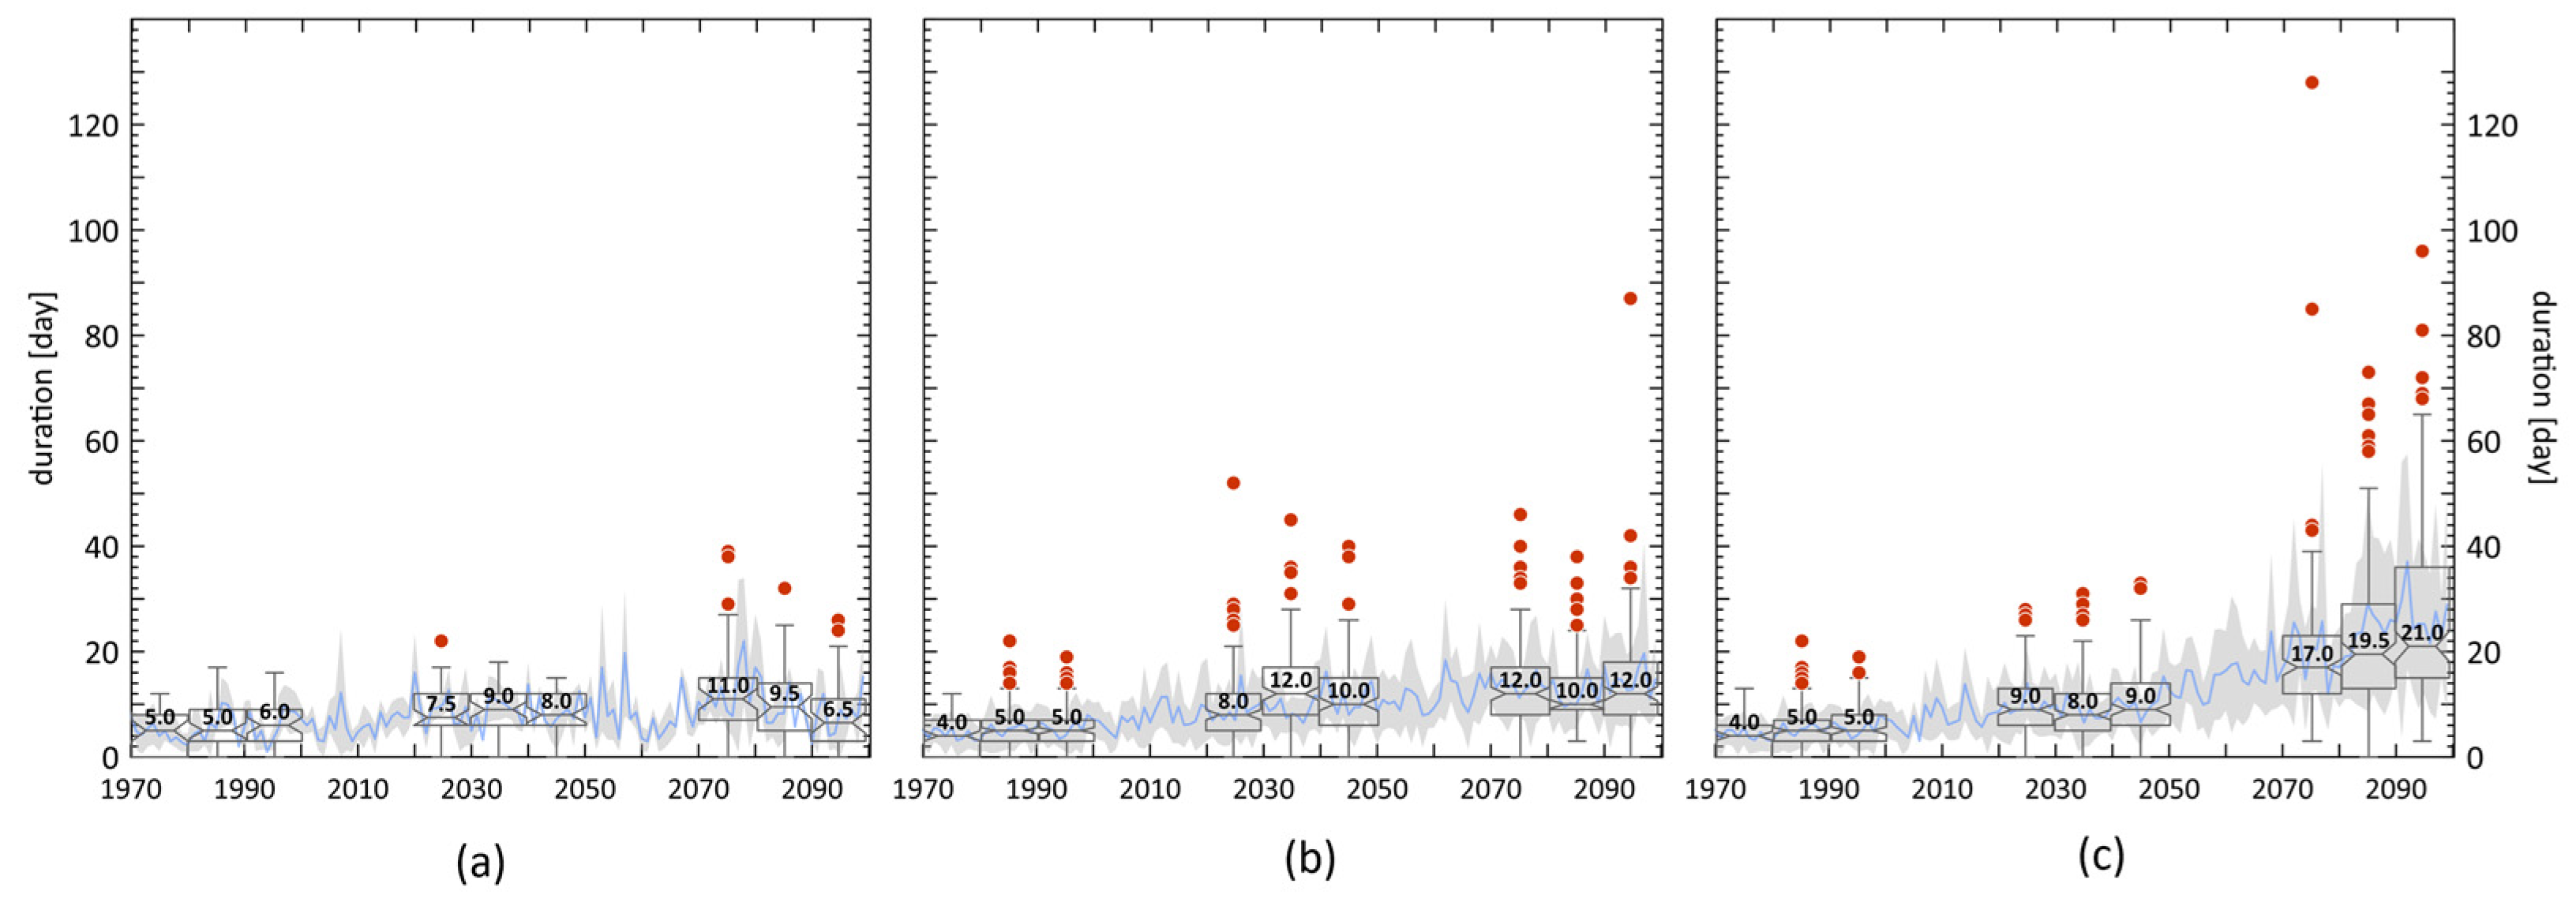
3.2. Results of the Regional Multi-Model Ensemble

Based on the bias-corrected transient CORDEX data, the annual mean values of mean, minimum, and maximum air temperatures for the three different RCPs were computed and are shown in Figure 2. Depending on the RCP that reflects the future emissions of greenhouse gases, the strength of the average air temperature increase varies. For RCP26, the increase in the mean air temperature until the end of this century for Luxembourg is projected to rise by 1.3 °C compared to the reference period (1971–2000). In that case, Luxembourg would be able to meet the ambitious target of keeping global warming below 1.5 °C, as agreed in the Paris Agreement. For RCP45 and RCP85, average increases of 2.1 °C and 3.8 °C were projected, respectively. Only for RCP26 was a stabilisation of air temperature values from the mid-century observed. While RCP45 and RCP85 showed significant parallel warming until the middle of this century, the temperatures based on RCP85 exhibited a more pronounced increase from 2050 to 2100. The mean annual values of the minimum and maximum air temperatures did not diverge from the pattern of the mean air temperature. While the differences between the reference period and the near and far future periods are almost constant for the mean and maximum air temperatures in all three RCPs, the increase in the minimum air temperature in the near and far future periods for RCP85 is 2.4 °C less than for the mean and maximum air temperatures for the same RCP. All the differences between the 30-year long-term averages (comparison between the reference period and the near and far future, as well as the near compared to the far future) were statistically significant (p < 0.001), exept for RCP26 where the differences between the near and far future periods for all three variables did not differ significantly from each other.
In general, the climate indices shown in Table 3 reflect the trend of increasing air temperature already shown in Figure 2. Five out of the first six indicators describe days above a certain temperature threshold and reflect the increase in the mean and maximum air temperatures depending on the emission scenario. In addition to the absolute numbers of the days in Table 3, the significance is also indicated as a p-value. If no p-value is given, the test failed and the differences between the reference period and the near or far future periods are not signifcant. For the assessment of potential negative health effects, the number of tropical nights was extremely important; hence, during those nights, the recovery function of the human body during sleep was reduced. On average, only two days per year for RCP26 and four days for RCP45 occurred. In contrast, on average, more than 13 tropical nights per year were projected for RCP85. As an alternative, using absolute threshold values for the defination of nights with potential heat stress, the index related to warm nights (number of warm nights) relied on the 90th percentile of the daily maximum air temperatures of the reference periods from each model. These thresholds were a little bit lower than the fixed one of 20 °C for the tropical nights, resulting in a higher number of event days, but still showing the same pattern as for the tropical nights.
Instead of counting single days, the Warm Spell Duration Indicator (WSDI) counts the number of days contributing to events where six or more consecutive days experience a maximum daily air temperature above the 90th percentile. That percentile was derived from the maximum air temperature time series of the 30-year reference period from 1971 to 2000. In the reference period, on average, one event with six consecutive days per year occurred, and for the near future, no evident differences between the three RCPs were observed. For the far future, the number of days contributing to such events increased to 32 for RCP45 and 65 for RCP85.
In addition to the direct impact on human health, increased heat stress can also have significant impacts on energy consumption, e.g., for cooling with air conditioners. A simple and widely used index for this is the cooling degree days index as an inicator of how much heating or cooling is needed to maintain a comfortable indoor temperature. They are based on the assumption that, when the outdoor temperature is 18 °C, no heating nor cooling is needed. This index is calculated by subtracting a base temperature, set at 18 °C, from daily mean air temperatures and accumulating the positive values for each year. A constant increase in all three emission scenarios is shown in Table 3. While for RCP26 an increase by 80% is projected until the end of this century, RCP45 and RCP85 reveal a higher positive increase of 135% and more than 300%, respectively.
In Figure 3, the annual Heat Wave Numbers (HWNs) for the three different RCPs are shown. In addition to the annual number for each year (blue line), the spread of the multi-model ensemble is definied as +/− one standadard deviation (gray shaded area). Moreover, boxplots for 10-year time slices for the references period (1971–2000), the near (2021–2050), and far future (2070–2098) are given. The whiskers are defined as 1.5-times the interquartile range; values beyond this threshold (outliers) are marked as red dots. The notches are a measure of the uncertainty of the median. If the notches of two box plots do not overlap, it is likely that the medians of the two groups are different. Based on the definition of a heat wave, a period of at least three years where the excess heat factor is positive is necessary. While for RCP26 a duplication for the near and far future periods compared to the reference period is shown, the number of heat waves constantly increases for RCP45 and RCP85. The HWN per year alone is not a sufficient indicator because the lengths of the individual heat waves are not considered. Therefore, in Figure 4, the number of days that contribute to the HWF are shown. For RCP26, a pattern comparable to the HWN can be found. For the other two RCPs, especially for RCP85, a more pronounced increase in the number of days that contribute to heat waves is evident. By dividing the HWF by the HWN, it is clear that the length of the heat waves increases for RCP45 and is even more noticeable for RCP85. This is supported by the results shown in Figure 5, where the lengths of the longest heat waves in days per year are shown. For RCP26, initially a slight increase in the length for the near future period can be observed, which remains at the same level as the far future. The same pattern with a more pronounced increase is visible for RCP45. The unique, remarkable difference is the increase in the number of outliers compared to RCP26, which can be partly attributed to the higher number of ensemble members of RCP45. For RCP85, the outlier numbers are even higher, with an median length of 21 days for the last decade of this century. As the last indicator in Figure 6, the Heat Wave Magnitude (HWM) is shown. The HWM is the average daily magnitude across all heat wave events within a year. For all RCPs, a slight increase from the reference period to the near future can be observed, followed by a stabilisation of RCP45 and only a marginal increase in RCP85. Also, the absolute differences between the three RCPs are less pronounced; hence, in this index, the influence of the absolute air temperature during the heat wave is negligible.

4. Discussion

First, we analyzed the thermal stress level in Luxembourg based on the long-term measurements from the WMO station at Findel Airport. In addition to the air temperature, other atmospheric variables, such as the humidity, wind speed, and radiation fluxes, are also essential for human thermal comfort. To assess the heat stress levels, the thermal index PET [33] was calculated for two different age groups, 35 and 75 years old, as well as male and female persons. The distribution of PET values throughout the year exhibited a typical annual pattern for a location in Central Europe. Peaks occurred in July and August and indicated moderate to strong heat stress conditions in up to 10% of the hours during these months. This is in line with a comparable investigation of the thermal bioclimatic conditions for Freiburg in Germany based on monthly intervals. The thermal stress levels during the summer months of June to August were within a comparable range. This study highlighted the importance of shade, where slight modifications of the conditions within urban structures could lead to great modifications of the bioclimatological conditions [47]. During the meteorological summer seasons, the highest number of hours with extreme heat stress was recorded. For females, this was up to 48 h, and for males up to 55 h. Furthermore, the summer months exhibited the highest number of hours with no thermal stress for both gender and age groups, indicated by the PET values between 18° and 23° (24% of all hours). It is well known that older individuals are more vulnerable to heat-related morbidity and mortality during summer days and especially during heat waves due to a combination of physiological and social factors [12]. Via the RayMan Pro model, only the physiological changes associated with aging, such as reduced sweat production and impaired thermoregulation, could be considered. The red shaded areas in the tables in Figure 1 indicate that there is a positive difference in vulnerability to heat stress between the two age groups. This difference ranges from 0.1% to 2.7%. Although the pattern is similar for both genders, the differences are slightly less for females, with a maximum value of 1.1%. Overall, the data show that females and older people are slightly more vulnerable to heat-related illnesses than males [48,49]. This could be due to the lower sweating capacity of women for a given amount of metabolic heat generation [50,51]. Additionally, social factors not captured by the model, such as limited access to medical care, chronic health conditions, certain medications, or a lack of air conditioning, can further exacerbate heat-related risks [52,53]. This, in combination with the increase in the longevity of the population, will exacerbate the problem in the future. By 2050, 21.1% of the population in Europe is expected to be older than 60 years. According to the latest Lancet report, the annual heat-related mortality of people +65 years old is projected to increase by 370% for the period ranging from 2041–2060 (compared to the period ranging from 1995–2014), under the assumption that the global air temperature increase will be limited to 2 °C, and by 433% in a scenario with no mitigation and adaptation measures [1].
Regional climate models exhibit systematic deviations from the observed data. To overcome these discrepancies and to avoid presenting only the relative changes between the reference period and the future climate conditions, a bias correction as a commonly used data post-processing technique was applied [54,55]. These methods typically involve adjusting the differences between predicted model values and observed values by applying correction factors. These factors are usually derived from historical data and then applied to the entire time series under the assumption that these differences remain consistent over time. We applied a non-parametric quantile mapping technique to correct the biases between the measurements from the Findel station and the outputs of all ensemble members.
To assess the future heat stress conditions in Luxembourg, we relied on a multi-physics and multi-model ensemble of different regional climate models listed in Table 1. The uncertainty of future anthropogenic forcing was considered by three Representative Concentration Pathways: RCP26, RCP45, and RCP85. No weighting of the individual model results was applied [56]. For the statistical analysis and significant tests, 30-year time spans were calculated to (i) make our findings easily comparable with other studies and (ii) to reduce the noise of the results [57]. The projected changes in the mean, minimum, and maximum air temperatures are shown in Figure 2, and are in line with the results of comparable studies for Luxembourg [15,58]. The projected increase in the mean air temperature varied, depending on the RCP, between +1.3 °C (RCP26), +2.1 °C (RCP45), and +3.8 °C (RCP85). The values of the minimum and maximum air temperatures followed the same structure, without any extraordinary patterns. The spread, shown as gray shaded areas in Figure 2, is more pronounced for RCP45 and RCP85. This was very likely due to the higher number of ensemble members. Our transient climate projections generally exhibited uncertainty levels comparable to those reported in other studies. This uncertainty stemmed from variations in the physical principles and parameterizations across the different climate models, leading to differing projections, even when exposed to the same amount of anthropogenic emissions [13,59].
The bias-corrected time series for daily minimum and maximum air temperatures were used as the input data to calculate the heat-related climate change indices presented in Table 3 with the open source R software package ClimPACT2. Most of the indices followed an increase in the maximum air temperatures shown in Figure 2. All the differences between the reference period and the two future time spans were statistically significant, except for the days above 35 °C for the near future in the RCP26 scenario. From a human health perspective, the indicators that not only address a single day, such as the warm-spell duration indicator and the number of consecutive hot days and nights, are more important because the related heat stress during the nighttime prevents the human body from recovering from daytime high-heat exposure [60]. While the increase in the number consecutive hot day and night events until the end of this century was only minor, from 0 to 2 (RCP 26), 0 to 4 (RCP45), and 0 to 7 (RCP85), the increase in the warm-spell duration indicator was more evident. The advantage of the warm-spell duration indicator is that not only are events during summertime identified, but also periods with extraordinarily high air temperatures for the rest of the year. Therefore, for each calendar year of the reference period, the 90th percentile of the maximum air temperature was calculated and used as a threshold. The warm-spell indicator was applied on a global scale for the period ranging from 1953 to 2003 with mostly positive trends for warm spells [61]. In Bangladesh, an annual increase in this indicator by 14% per year was observed based on the historical measurements (1981–2018) [62], and for the time series of weather stations in Turkey for the past century, positive trends and slightly higher absolute values than for Luxembourg were also identified [63].
In addition to the impacts on human health, the sector specific indices could also be used to analyze how air temperature changes affect, e.g., energy consumption. This is of great importance for heat waves because one of the most common adaptation strategies in developed countries is the use of air conditioning that can worsen outdoor heat stress. Our results for the cooling degree days inicator, which approximates how much cooling is needed to maintain a comfortable indoor temperature, show a strong increase between 80% (RCP26) and up to >300% (RCP85). However, in view of the urgent need for energy reductions, measures other than air conditioning, such as urban blue and green infrastructures, as well as individual behavior are prefered [64,65]. On the other hand, it should be noted that the demand or cooling expressed through this index does not automatically reflect the actual energy use. Factors, such as the energy efficiency of cooling systems, better-insulated homes, or behavior changes, were not considered.
The number of heat waves as well as the number of days that contributed to a heat wave (Figure 3, Figure 4 and Figure 5) were in a comparable range for the reference period as those identified for Potsdam, Germany [66]. The strong increase in the multi-model ensemble median of the number and duration of heat waves under far future climate conditions for RCP45 were similar to the results obtained for the A1B scenario [67]. Only the combined analysis of these two indices can lead to satisfying results, as the number of heat waves alone can present a wrong impression due to the significant increase in the duration of the heat waves in the future. One extreme long heat wave will have more severe impacts on human health than two short ones. Without adaptation measures, this can greatly increase the incidence of heat-related illnesses, negatively impact natural ecosystems, and reduce the outdoor working capacity. The results for the near future period for RCP45 and RCP85 do not differ considerably and reflect the air temperature increase indicated in Figure 2. The increase in the length of heat waves (Figure 5) will not only negatively impact human health, but also increase the probability of widespread wildfires [68]. Areas that are fire prone will extend to the north of Europe and the Mediterranean mountains [69,70]. Lin et al. (2022) investigated trends and associated uncertainties in the GCM-RCM model results for heat wave magnitudes for present and future climate conditions in Europe, showing that the uncertainties associated with the driving data are of a similar magnitude to those associated with different models, and that RCMs are reliable tools for simulating heat wave magnitudes [71]. The heat wave magnitude has been used to study the trends of heat wave intensity values in different parts of the world indicating increasing trends in many regions, including Europe, North America, and Asia [71,72,73,74]. The results for Luxembourg show that the absolute differences between the RCPs are less pronounced. Only for RCP45 and RCP85 was a doubling trend for the end of the century compared to the reference period found. Overall, the results for Luxemburg are comparable with those presented by Vargas et al. (2022) showing an increase in the exposure to dangerous heat by a factor of 3 to 10 in many regions throughout the mid-latitudes [13].
A direct comparison of the results between RCP26 and the other two RCPs was not possible due to the different numbers of ensemble members.
Limitations of the present study: despite the significance of the present study, there are some limitations that should be acknowledged. For instance, a direct comparison of the results for RCP26 and the other two RCPs was not possible due to the different numbers of ensemble members. In contrast to other studies, we decided not to exclude the RCP26 scenario that considered fast responses to climate adaptation and mitigation technologies, in order to cover the possible impacts of future heat exposure on Luxembourg’s population. Despite these limitations, our study provided important information that could inform policy- and decision-making processes in and outside Luxembourg. The findings highlight the urgent need for effective adaptation and mitigation measures to reduce the risks of heat exposure and protect vulnerable populations.

5. Conclusions

The intensification of heat waves, accompanied by rising air temperatures, will have more severe health consequences for vulnerable populations, such as the elderly, poor, and outdoor workers. In addition to the direct impact of meteorological variables on various genders and age groups, there are also other social factors that can worsen the situation, such as inadequate medical access, persistent health issues, or an insufficient availability of air conditioning. This may require a reorganization of the healthcare services, even in regions with moderate climates, due to the increasing life expectancy of the population.
To achieve this, a close collaboration between national meteorological and health services is crucial to provide easily understandable health information to the general public. Heat waves were already recognized as hazardous weather events, and national alerts are issued when severe heat waves occur. All the calculated indices indicate an increase in the future heat stress in Luxembourg. Moreover, the increase in the duration of future heat waves will pose significant risks related to morbidity and mortality to the Luxembourgish population. In high-income countries, like Luxembourg, technical measures, such as air conditioning, can mitigate heat-related morbidity and mortality. However, these measures, in most cases, contribute to increased energy consumption, exacerbating climate change, air pollution, and the urban heat island effect. Since more than 70% of the Luxemburgish population resides in urban areas, implementing city-level interventions, such as green and blue infrastructures, holds great potential for preventing the negative health impacts caused by excessive heat.
Despite decades of scientific warnings, the world has been slow to take action regarding climate change. Governments and industries have been reluctant to adopt strong policies and efficient practices that can reduce greenhouse gas emissions and help to mitigate the impacts of global warming. Insufficient actions have been taken to date and, therefore, the world is currently on track to warm up by 3 °C, while accepting the negative health impacts on society.

Author Contributions

Conceptualization, J.J. and I.T.; methodology, J.A.T.-M.; validation, I.T.; formal analysis, J.A.T.-M.; writing—original draft preparation, J.J.; writing—review and editing, J.A.T.-M., M.S. and I.T.; funding acquisition, J.J. All authors have read and agreed to the published version of the manuscript.

Funding

The research was funded by Ministère de l’Environnement, du Climat et du Développement durable (MECDD) of Luxembourg, in the framework of the CHAPEL project (https://www.list.lu/en/environment/project/chapel/ accessed on 15 January 2022).

Institutional Review Board Statement

Not applicable.

Informed Consent Statement

Not applicable.

Data Availability Statement

The observations from the WMO station presented in this study are openly available at https://data.public.lu/en/datasets/daily-meteorological-parameters-luxembourg-findel-airport-wmo-id-06590/ (accessed on 15 January 2023). Results of the RayMan Pro model in this paper are available on request from the corresponding author. The data for this model are not publicly available due to privacy. The CORDEX regional climate model data are available from the Copernicus Climate Data Store, https://doi-org.proxy.bnl.lu/10.24381/cds.bc91edc3 (accessed on 15 January 2023).

Conflicts of Interest

The authors declare no conflicts of interest. The funders had no role in the design of the study; in the collection, analyses, or interpretation of data; in the writing of the manuscript; or in the decision to publish the results.

Abbreviations

CCICommission for Climatology
CDDsCooling Degree Days
CDFCumulative Distribution Function
CDOsClimate Data Operators
cloInsulation effect of clothes
CORDEXCoordinated Regional Climate Downscaling Experiment
ESGFEarth System Grid Federation
ET-SCIsExpert Team on Sector-Specific Climate Indices
FFFar Future
GCMGlobal Climate Model
HWDLength of the longest heat wave
HWFsDays that contribute to heat waves
HWMHeat wave magnitude
HWNHeat Wave Number
MEMI modelMunich energy balance model
NFNear Future
PETPhysiologically Equivalent Temperature
RCMRegional Climate Model
RCPsRepresentative Concentration Pathways
RFReference Period
SYNOPSynoptic Observation
WMOWorld Meteorological Organization
WSDIWarm-Spell Duration Indicator

References

  1. Romanello, M.; Napoli, C.D.; Green, C.; Kennard, H.; Lampard, P.; Scamman, D.; Walawender, M.; Ali, Z.; Ameli, N.; Ayeb-Karlsson, S.; et al. The 2023 report of the Lancet Countdown on health and climate change: The imperative for a health-centred response in a world facing irreversible harms. Lancet 2023, 402, 2346–2394. [Google Scholar] [CrossRef] [PubMed]
  2. Tollefson, J. IPCC says limiting global warming to 1.5 °C will require drastic action. Nature 2018, 562, 172–173. [Google Scholar] [CrossRef]
  3. IPCC. Climate Change 2007: The Physical Science Basis: Contribution of Working Group I to the Fourth Assessment Report of the Intergovernmental Panel on Climate Change; Cambridge University Press: Cambridge, UK, 2007. [Google Scholar]
  4. Matzarakis, A.; Rammelberg, J.; Junk, J. Assessment of thermal bioclimate and tourism climate potential for central Europe—The example of Luxembourg. Theor. Appl. Climatol. 2013, 4, 193–202. [Google Scholar] [CrossRef]
  5. Matzarakis, A.; Graw, K. Human Bioclimate Analysis for the Paris Olympic Games. Atmosphere 2022, 13, 269. [Google Scholar] [CrossRef]
  6. Ahan, M.M.; Nouri, A.S.; Matzarakis, A. Investigating the Relationship of Outdoor Heat Stress upon Indoor Thermal Comfort and Qualitative Sleep Evaluation: The Case of Ankara. Atmosphere 2023, 14, 1407. [Google Scholar] [CrossRef]
  7. Santos Nouri, A.; Charalampopoulos, I.; Afacan, Y.; Matzarakis, A. Detection and quantification of seasonal human heat and cold stress frequencies in representative existing and future urban canyons: The case of Ankara. Theor. Appl. Climatol. 2023, 153, 593–620. [Google Scholar] [CrossRef]
  8. Tomczyk, A.M.; Matzarakis, A. Characteristic of bioclimatic conditions in Poland based on Physiologically Equivalent Temperature. Int. J. Biometeorol. 2023, 67, 1991–2009. [Google Scholar] [CrossRef] [PubMed]
  9. Oudin Åström, D.; Bertil, F.; Joacim, R. Heat wave impact on morbidity and mortality in the elderly population: A review of recent studies. Maturitas 2011, 69, 99–105. [Google Scholar] [CrossRef]
  10. Kenney, W.L.; Munce, T.A. Invited Review: Aging and human temperature regulation. J. Appl. Physiol. 2003, 95, 2598–2603. [Google Scholar] [CrossRef]
  11. Ballester, J.; Quijal-Zamorano, M.; Méndez Turrubiates, R.F.; Pegenaute, F.; Herrmann, F.R.; Robine, J.M.; Basagaña, X.; Tonne, C.; Antó, J.M.; Achebak, H. Heat-related mortality in Europe during the summer of 2022. Nat. Med. 2023, 29, 1857–1866. [Google Scholar] [CrossRef]
  12. Perčič, S.; Kukec, A.; Cegnar, T.; Hojs, A. Number of heat wave deaths by diagnosis, sex, age groups, and area, in Slovenia, 2015 vs. 2003. Int. J. Environ. Res. Public Health 2018, 15, 173. [Google Scholar] [CrossRef] [PubMed]
  13. Vargas Zeppetello, L.R.; Raftery, A.E.; Battisti, D.S. Probabilistic projections of increased heat stress driven by climate change. Commun. Earth Environ. 2022, 3, 183. [Google Scholar] [CrossRef]
  14. Spector, J.T.; Sheffield, P.E. Re-evaluating Occupational Heat Stress in a Changing Climate. Ann. Occup. Hyg. 2014, 58, 936–942. [Google Scholar] [CrossRef]
  15. Junk, J.; Goergen, K.; Krein, A. Future Heat Waves in Different European Capitals Based on Climate Change Indicators. Int. J. Environ. Res. Public Health 2019, 16, 3959. [Google Scholar] [CrossRef] [PubMed]
  16. Perkins, S.E.; Alexander, L.V.; Nairn, J.R. Increasing frequency, intensity and duration of observed global heatwaves and warm spells. Geophys. Res. Lett. 2012, 39, L20714. [Google Scholar] [CrossRef]
  17. Klein Tank, A.M.G.; Zwiers, F.W.; Zhang, X. Guidelines on Analysis of Extremes in a Changing Climate in Support of Informed Decisions for Adaptation; 72; WMO: Geneva, Switzerland, 2009; p. 53. [Google Scholar]
  18. Insaf, T.Z.; Lin, S.; Sheridan, S.C. Climate trends in indices for temperature and precipitation across New York State, 1948–2008. Air Qual. Atmos. Health 2012, 6, 247–257. [Google Scholar] [CrossRef]
  19. Busuioc, A.; Dumitrescu, A.; Iriza-Burca, A.; Chitu, Z.; Dumitrache, R.; Dima, A. Projection of future changes in the summer thermal stress index in Romania using statistical downscaling and associated uncertainties. Clim. Res. 2022, 87, 39–66. [Google Scholar] [CrossRef]
  20. Cardoso, R.M.; Lima, D.C.A.; Soares, P.M.M. How persistent and hazardous will extreme temperature events become in a warming Portugal? Weather Clim. Extrem. 2023, 41, 100600. [Google Scholar] [CrossRef]
  21. Kim, Y.H.; Ahn, J.B.; Suh, M.S.; Cha, D.H.; Chang, E.C.; Min, S.K.; Byun, Y.H.; Kim, J.U. Concurrent daytime and nighttime heatwaves in the late 21st century over the CORDEX-East Asia phase 2 domain using multi-GCM and multi-RCM chains. Int. J. Climatol. 2023, 43, 4687–4701. [Google Scholar] [CrossRef]
  22. Zhang, J.; You, Q.; Ren, G.; Ullah, S. Substantial increase in human-perceived heatwaves in eastern China in a warmer future. Atmos. Res. 2023, 283, 106554. [Google Scholar] [CrossRef]
  23. Wallenberg, N.; Rayner, D.; Lindberg, F.; Thorsson, S. Present and future heat stress of preschoolers in five Swedish cities. Clim. Risk Manag. 2023, 40, 100508. [Google Scholar] [CrossRef]
  24. Wedler, M.; Pinto, J.G.; Hochman, A. More frequent, persistent, and deadly heat waves in the 21st century over the Eastern Mediterranean. Sci. Total Environ. 2023, 870, 161883. [Google Scholar] [CrossRef] [PubMed]
  25. Cinquini, L.; Crichton, D.; Mattmann, C.; Harney, J.; Shipman, G.; Wang, F.; Ananthakrishnan, R.; Miller, N.; Denvil, S.; Morgan, M.; et al. The Earth System Grid Federation: An open infrastructure for access to distributed geospatial data. Future Gener. Comput. Syst. 2014, 36, 400–417. [Google Scholar] [CrossRef]
  26. Moss, R.H.; Edmonds, J.A.; Hibbard, K.A.; Manning, M.R.; Rose, S.K.; van Vuuren, D.P.; Carter, T.R.; Emori, S.; Kainuma, M.; Kram, T.; et al. The next generation of scenarios for climate change research and assessment. Nature 2010, 463, 747. [Google Scholar] [CrossRef]
  27. Rajczak, J.; Pall, P.; Schär, C. Projections of extreme precipitation events in regional climate simulations for Europe and the Alpine Region. J. Geophys. Res. Atmos. 2013, 118, 3610–3626. [Google Scholar] [CrossRef]
  28. Hempel, S.; Frieler, K.; Warszawski, L.; Schewe, J.; Piontek, F. A trend-preserving bias correction—The ISI-MIP approach. Earth Syst. Dyn. 2013, 4, 219–236. [Google Scholar] [CrossRef]
  29. Cannon, A.J. Multivariate quantile mapping bias correction: An N-dimensional probability density function transform for climate model simulations of multiple variables. Clim. Dyn. 2017, 50, 31–49. [Google Scholar] [CrossRef]
  30. Gudmundsson, L.; Bremnes, J.B.; Haugen, J.E.; Engen-Skaugen, T. Technical Note: Downscaling RCM precipitation to the station scale using statistical transformations—A comparison of methods. Hydrol. Earth Syst. Sci. 2012, 16, 3383–3390. [Google Scholar] [CrossRef]
  31. Team, R.C. R: A Language and Environment for Statistical Computing; R Foundation for Statistical Computing: Vienna, Austria, 2023. [Google Scholar]
  32. Gudmundsson, L. qmap: Statistical Transformations for Post-Processing Climate Model Output, R Package Version 1.0-4; CRAN Repository: Vienna, Austria, 2016. Available online: https://rdrr.io/cran/qmap/(accessed on 12 January 2022).
  33. Matzarakis, A.; Rutz, F.; Mayer, H. Modelling radiation fluxes in simple and complex environments--application of the RayMan model. Int. J. Biometeorol. 2007, 51, 323–334. [Google Scholar] [CrossRef]
  34. Ripamonti, R.E.M.; Junk, J. The role of climate change on Bemisia tabaci as a vector for ToLCNDV. Jul.-Kühn-Arc 2023, 475, 648. [Google Scholar]
  35. Matzarakis, A.; Mayer, H.; Iziomon, M.G. Applications of a universal thermal index: Physiological equivalent temperature. Int. J. Biometeorol. 1999, 43, 76–84. [Google Scholar] [CrossRef] [PubMed]
  36. Höppe, P. The physiological equivalent temperature—A universal index for the biometeorological assessment of the thermal environment. Int. J. Biometeorol. 1999, 43, 71–75. [Google Scholar] [CrossRef]
  37. VDI. Methods for the Human Biometeorological Evaluation of Climate and Air Quality for the Urban and Regional Planning; VDI: Berlin, Germany, 1998. [Google Scholar]
  38. Wang, B.-J.; Dong, S.-Y.; Hu, T.; Sun, Y. Changes of extreme cold events in China over the last century based on reanalysis data. Adv. Clim. Chang. Res. 2023, 19, 403–417. [Google Scholar] [CrossRef]
  39. Van der Walt, A.J.; Kruger, J.A.; Roffe, S.J. Fine-resolution analysis of the spatiotemporal characteristics of heatwaves in the Maloti-Drakensberg region, southern Africa: 1979–2021. Trans. R. Soc. S. Afr. 2023, 78, 5–15. [Google Scholar] [CrossRef]
  40. Nishant, N.; Di Virgilio, G.; Ji, F.; Tam, E.; Beyer, K.; Riley, M.L. Evaluation of Present-Day CMIP6 Model Simulations of Extreme Precipitation and Temperature over the Australian Continent. Atmosphere 2022, 13, 1478. [Google Scholar] [CrossRef]
  41. Zare, M.; Azam, S.; Sauchyn, D.; Basu, S. Assessment of Meteorological and Agricultural Drought Indices under Climate Change Scenarios in the South Saskatchewan River Basin, Canada. Sustainability 2023, 15, 5907. [Google Scholar] [CrossRef]
  42. Isa, Z.; Sawa, B.A.; Abdussalam, A.F.; Ibrahim, M.; Babati, A.H.; Baba, B.M.; Ugya, A.Y. Impact of climate change on climate extreme indices in Kaduna River basin, Nigeria. Env. Sci. Pollut. Res. Int. 2023, 30, 77689–77712. [Google Scholar] [CrossRef]
  43. Espín-Sánchez, D.; Conesa-García, C. Spatio-temporal Changes in the Heatwaves and Coldwaves in Spain (1950–2018): Influence of the East Atlantic Pattern. Geogr. Pannonica 2021, 25, 168–183. [Google Scholar] [CrossRef]
  44. Oliveira, A.; Lopes, A.; Soares, A. Excess Heat Factor climatology, trends, and exposure across European Functional Urban Areas. Weather Clim. Extrem. 2022, 36, 100455. [Google Scholar] [CrossRef]
  45. Perkins, S.E.; Alexander, L.V. On the Measurement of Heat Waves. J. Clim. 2013, 26, 4500–4517. [Google Scholar] [CrossRef]
  46. Matzarakis, A.; Amelung, B. Physiological Equivalent Temperature as Indicator for Impacts of Climate Change on Thermal Comfort of Humans. In Seasonal Forecasts, Climatic Change and Human Health; Thomson, M., Garcia-Herrera, R., Beniston, M., Eds.; Advances in Global Change Research; Springer: Dordrecht, The Netherlands, 2008; Volume 30, pp. 161–172. [Google Scholar]
  47. Matzarakis, A.; Endler, C. Climate change and thermal bioclimate in cities: Impacts and options for adaptation in Freiburg, Germany. Int. J. Biometeorol. 2010, 54, 479–483. [Google Scholar] [CrossRef]
  48. Kenney, W.L. A review of comparatve responses of woman and men to heat tress. Environ. Res. 1983, 37, 1–11. [Google Scholar] [CrossRef]
  49. Alele, F.; Malau-Aduli, B.; Malau-Aduli, A.; Crowe, M. Systematic review of gender differences in the epidemiology and risk factors of exertional heat illness and heat tolerance in the armed forces. BMJ Open 2020, 10, e031825. [Google Scholar] [CrossRef] [PubMed]
  50. Gagnon, D.; Kenny, G.P. Sex modulates whole-body sudomotor thermosensitivity during exercise. J. Physiol. 2011, 589, 6205–6217. [Google Scholar] [CrossRef] [PubMed]
  51. Gagnon, D.; Crandall, C.G.; Kenny, G.P. Sex differences in postsynaptic sweating and cutaneous vasodilation. J. Appl. Physiol. 2013, 114, 394–401. [Google Scholar] [CrossRef] [PubMed]
  52. Gronlund, C.J. Racial and socioeconomic disparities in heat-related health effects and their mechanisms: A review. Curr. Epidemiol. Rep. 2014, 1, 165–173. [Google Scholar] [CrossRef]
  53. Mayrhuber, E.A.-S.; Dückers, M.L.A.; Wallner, P.; Arnberger, A.; Allex, B.; Wiesböck, L.; Wanka, A.; Kolland, F.; Eder, R.; Hutter, H.-P.; et al. Vulnerability to heatwaves and implications for public health interventions—A scoping review. Environ. Res. 2018, 166, 42–54. [Google Scholar] [CrossRef]
  54. Junk, J.; Ulber, B.; Vidal, S.; Eickermann, M. Assessing climate change impacts on the rape stem weevil, Ceutorhynchus napi Gyll., based on bias- and non-bias-corrected regional climate change projections. Int. J. Biometeorol. 2015, 59, 1597–1605. [Google Scholar] [CrossRef] [PubMed]
  55. Piani, C.; Haerter, J.; Coppola, E. Statistical bias correction for daily precipitation in regional climate models over Europe. Theor. Appl. Climatol. 2010, 99, 187–192. [Google Scholar] [CrossRef]
  56. van Vuuren, D.P.; Edmonds, J.; Kainuma, M.; Riahi, K.; Thomson, A.; Hibbard, K.; Hurtt, G.C.; Kram, T.; Krey, V.; Lamarque, J.-F.; et al. The representative concentration pathways: An overview. Clim. Chang. 2011, 109, 5. [Google Scholar] [CrossRef]
  57. Meehl, G.A.; Tebaldi, C. More Intense, More Frequent, and Longer Lasting Heat Waves in the 21st Century. Science 2004, 305, 4. [Google Scholar] [CrossRef] [PubMed]
  58. Goergen, K.; Beersma, J.; Hoffmann, L.; Junk, J. ENSEMBLES-based assessment of regional climate effects in Luxembourg and their impact on vegetation. Clim. Chang. 2013, 119, 761–773. [Google Scholar] [CrossRef]
  59. Sherwood, S.C.; Webb, M.J.; Annan, J.D.; Armour, K.C.; Forster, P.M.; Hargreaves, J.C.; Hegerl, G.; Klein, S.A.; Marvel, K.D.; Rohling, E.J.; et al. An Assessment of Earth’s Climate Sensitivity Using Multiple Lines of Evidence. Rev. Geophys. 2020, 58, e2019RG000678. [Google Scholar] [CrossRef]
  60. Laaidi, K.; Zeghnoun, A.; Dousset, B.; Bretin, P.; Vandentorren, S.; Giraudet, E.; Beaudeau, P. The Impact of Heat Islands on Mortality in Paris during the August 2003 Heat Wave. Environ. Health Perspect. 2012, 120, 254–259. [Google Scholar] [CrossRef]
  61. Alexander, L.V.; Zhang, X.; Peterson, T.C.; Caesar, J.; Gleason, B.; Klein Tank, A.M.G.; Haylock, M.; Collins, D.; Trewin, B.; Rahimzadeh, F.; et al. Global observed changes in daily climate extremes of temperature and precipitation. J. Geophys. Res. 2006, 111. [Google Scholar] [CrossRef]
  62. Ahmed, I.; Ishtiaque, S.; Zahan, T.; Rashed, M.S.U.; Sen, R.; Hossain, M.F.; Brahma, S.; Ahmed, I.M.; Hossain, M.A.; Ali, M.A.; et al. Climate change vulnerability in Bangladesh based on trend analysis of some extreme temperature indices. Theor. Appl. Climatol. 2022, 149, 831–842. [Google Scholar] [CrossRef]
  63. Sensoy, S.; Demicran, M.; Alan, I. Trends in Turkey Climate Extreme Indices from 1971 to 2004. In Proceedings of the BALWOIS 2008, Ohrid, North Macedonia, 27–31 May 2008; p. 9. [Google Scholar]
  64. Viguié, V.; Lemonsu, A.; Hallegatte, S.; Beaulant, A.-L.; Marchadier, C.; Masson, V.; Pigeon, G.; Salagnac, J.-L. Early adaptation to heat waves and future reduction of air-conditioning energy use in Paris. Environ. Res. Lett. 2020, 15, 075006. [Google Scholar] [CrossRef]
  65. Biagini, B.; Bierbaum, R.; Stults, M.; Dobardzic, S.; McNeeley, S.M. A typology of adaptation actions: A global look at climate adaptation actions financed through the Global Environment Facility. Glob. Environ. Chang. 2014, 25, 97–108. [Google Scholar] [CrossRef]
  66. Fenner, D.; Holtmann, A.; Krug, A.; Scherer, D. Heat waves in Berlin and Potsdam, Germany—Long-term trends and comparison of heat wave definitions from 1893 to 2017. Int. J. Climatol. 2018, 39, 2422–2437. [Google Scholar] [CrossRef]
  67. Schoetter, R.; Cattiaux, J.; Douville, H. Changes of western European heat wave characteristics projected by the CMIP5 ensemble. Clim. Dyn. 2014, 45, 1601–1616. [Google Scholar] [CrossRef]
  68. Nolan, R.H.; Anderson, L.O.; Poulter, B.; Varner, J.M. Increasing threat of wildfires: The year 2020 in perspective: A Global Ecology and Biogeography special issue. Glob. Ecol. Biogeogr. 2022, 31, 1898–1905. [Google Scholar] [CrossRef]
  69. Dupuy, J.-L.; Fargeon, H.; Martin-StPaul, N.; Pimont, F.; Ruffault, J.; Guijarro, M.; Hernando, C.; Madrigal, J.; Fernandes, P. Climate change impact on future wildfire danger and activity in southern Europe: A review. Ann. For. Sci. 2020, 77, 35. [Google Scholar] [CrossRef]
  70. Turco, M.; Llasat, M.-C.; von Hardenberg, J.; Provenzale, A. Climate change impacts on wildfires in a Mediterranean environment. Clim. Chang. 2014, 125, 369–380. [Google Scholar] [CrossRef]
  71. Lin, C.; Kjellström, E.; Wilcke, R.A.I.; Chen, D. Present and future European heat wave magnitudes: Climatologies, trends, and their associated uncertainties in GCM-RCM model chains. EGUsphere 2022, 13, 1197–1214. [Google Scholar] [CrossRef]
  72. Russo, S.; Dosio, A.; Graversen, R.G.; Sillmann, J.; Carrao, H.; Dunbar, M.B.; Singleton, A.; Montagna, P.; Barbola, P.; Vogt, J.V. Magnitude of extreme heat waves in present climate and their projection in a warming world. J. Geophys. Res. Atmos. 2014, 119, 12500–12512. [Google Scholar] [CrossRef]
  73. Lyon, B.; Barnston, A.G.; Coffel, E.; Horton, R.M. Projected increase in the spatial extent of contiguous US summer heat waves and associated attributes. Environ. Res. Lett. 2019, 14, 114029. [Google Scholar] [CrossRef]
  74. Singh, S.; Mall, R.K.; Dadich, J.; Verma, S.; Singh, J.V.; Gupta, A. Evaluation of CORDEX-South Asia regional climate models for heat wave simulations over India. Atmos. Res. 2021, 248, 105228. [Google Scholar] [CrossRef]
Figure 1. Relative frequency of physiological equivalent temperature (PET) calculated with RayMan Pro 3.1, based on hourly input data from the WMO station in Findel, for male and female persons from two different age classes. Additionally, the differences of the relative frequency contributions are given below and on the right side of the figure (2006 to 2020).
Atmosphere 15 00112 g001
Figure 2. Multi-model ensemble of mean, minimum, and maximum air temperature values for Luxembourg for three different Representative Concentration Pathways (RCPs). The spread (gray) is defined as +/− one standard deviation of the ensemble. Red (lines and numbers) represents the 30-year long-term averages for the reference (1971–2000), near (2021–2050), and far future (2070–2099) periods.
Atmosphere 15 00112 g002
Figure 3. Annual multi-model mean values of the Heat Wave Numbers (HWNs) for RCP26 (a), RCP45 (b), and RCP85 (c) (blue lines). The spread of the ensemble is defined as +/− one standard deviation (gray shaded area), red dots = outliers. In addition, boxplots for 10-year time slices for the reference (1971–2000), near (2021–2050), and far future (2070–2098) periods are given; period: 1971–2099.
Atmosphere 15 00112 g003
Figure 4. Annual multi-model mean values of the number of days that contribute to heat waves (HWFs) for RCP26 (a), RCP45 (b), and RCP85 (c) (blue lines). The spread of the ensemble is defined as +/− one standard deviation (gray shaded area), red dots = outliers. In addition, boxplots for 10-year time slices for the reference (1971–2000), near (2021–2050), and far future (2070–2098) periods are given; period: 1971–2099.
Atmosphere 15 00112 g004
Figure 5. Annual multi-model mean values of the Longest Heat Wave (HWD) length for RCP26 (a), RCP45 (b), and RCP85 (c) (blue lines). The spread of the ensemble is defined as +/− one standard deviation (gray shaded area), red dots = outliers. In addition, boxplots for 10-year time slices for the reference (1971–2000), near (2021–2050), and far future (2070–2098) periods are given; period: 1971–2099.
Atmosphere 15 00112 g005
Figure 6. Annual multi-model mean values of the Heat Wave Magnitudes (HWMs) for RCP26 (a), RCP45 (b), and RCP85 (c) (blue lines). The spread of the ensemble is defined as +/− one standard deviation (gray shaded area), red dots = outliers. In addition, boxplots for 10-year time slices for the reference (1971–2000), near (2021–2050), and far future (2070–2098) periods are given; period: 1971–2099.
Atmosphere 15 00112 g006
Table 1. Regional climate change projection datasets used in this study. Given are the model abbreviations in the text, the driving Global Climate Model (GCM), the Regional Climate Model (RCM) used for the downscaling, the Representative Concentration Pathway (RCP), as well as the covered time span. RCM data spatial resolution: 25 km × 25 km; temporal resolution: daily means and totals. X = data used for this study.
Model
Abbreviation
Global Climate Model (GCM)Regional Climate Model (RCM)RCP26RCP45RCP85Time Span
M1CNRM-CERFACS-CNRM-CM5CNRM-ALADIN53_v1xxx1950–2100
M2CNRM-CERFACS-CNRM-CM5RMIB-UGent-ALARO-0_v1xxx1950–2100
M3MOHC-HadGEM2-ESKNMI-RACMO22E_v2xxx1950–2099
M4MOHC-HadGEM2-ESSMHI-RCA4_v1xxx1970–2099
M5MPI-M-MPI-ESM-LRMPI-CSC-REMO2009_v1xxx1950–2100
M6MPI-M-MPI-ESM-LRSMHI-RCA4_v1axxx1970–2100
M7NCC-NorESM1-MDMI-HIRHAM5_v2 xx1951–2100
M8MOHC-HadGEM2-ESCLMcom-CCLM4-8-17_v1 xx1949–2099
M9CNRM-CERFACS-CNRM-CM5SMHI-RCA4_v1 xx1970–2100
M10IPSL-IPSL-CM5A-MRIPSL-INERIS-WRF331F_v1 xx1951–2100
M11CNRM-CERFACS-CNRM-CM5CLMcom-CCLM4-8-17_v1 xx1950–2100
M12ICHEC-EC-EARTHKNMI-RACMO22E_v1 xx1950–2100
M13IPSL-IPSL-CM5ASMHI-RCA4_v1 xx1970–2100
M14MPI-M-MPI-ESM-LRCLMcom-CCLM4-8-17_v1 xx1949–2100
Table 2. Short and long names, definitions, and units of extreme temperature indices according to ClimPACT2.
Short NameLong NameDescriptionUnits
SUSummer daysDays when maximum air temperature exceeds 25 °Cdays
TRTropical nightsDays when minimum air temperature exceeds 20 °Cdays
TXxMax TXHottest day°C
WSDIWarm-spell duration indicatorAnnual number of days contributing to events where 6 or more consecutive days experience a TX > 90th percentiledays
TXge30TX of at least 30 °CDays when maximum air temperature is at least 30 °Cdays
TXge35TX of at least 35 °CDays when maximum air temperature is at least 35 °Cdays
TXdTNdUser-defined consecutive number of hot days and nightsAnnual count of d consecutive days where both the TX > 95th percentile and TN > 95th percentile, and where 10 ≥ d ≥ 2Events
CDDcoldnCooling degree daysAnnual sum of TM − n (where n is a user-defined location-specific base air temperature and TM > n)Degree-days
TNxMax TNHottest night°C
TXmMean TXAverage daily maximum air temperature°C
TX90pNumber of hot daysPercentage of days when TX > 90th percentile%
TN90pNumber of warm nightsPercentage of days when TN > 90th percentile%
HWN (EHF/Tx90/Tn90)Heat Wave Number (HWN) as defined by either the Excess Heat Factor (EHF), 90th percentile of TX, or the 90th percentile of TNThe number of individual heat waves that occur each summer (May–Sep). A heat wave is defined as 3 or more days where either the EHF is positive, TX > 90th percentile of TX, or where TN > 90th percentile of TN. Percentiles are calculated from the base periodevents
HWF (EHF/Tx90/Tn90Heat Wave Frequency (HWF) as defined by either the Excess Heat Factor (EHF), 90th percentile of TX, or the 90th percentile of TNThe number of days that contribute to heat waves as identified by the HWNdays
HWD (EHF/Tx90/Tn90)Heat Wave Duration (HWD) as defined by either the Excess Heat Factor (EHF), 90th percentile of TX, or the 90th percentile of TNThe length of the longest heat wave identified by the HWNdays
HWM (EHF/Tx90/Tn90)Heat Wave Magnitude (HWM) as defined by either the Excess Heat Factor (EHF), 90th percentile of TX, or the 90th percentile of TNThe mean air temperature of all heat waves identified by the HWN [45]°C (°C2 for EHF)
Table 3. Results of the different heat-related indices for three different emission scenarios (reference period = 1971–2000, near future (NF) = 2021–2050, and far future (FF) 2070–2099). For the statistically significant differences between the reference period and NF or RF, the p-values are given below the index numbers.
Index NameRCP26 Ref. PeriodRCP26
NF
RCP26
FF
RCP45 Ref. PeriodRCP45 NFRC45
FF
RCP85 Ref. PeriodRCP85
NF
RCP85
FF
Summer days, days2838
p < 0.001
39
p < 0.001
2840
p < 0.001
48
p < 0.001
2839
p < 0.001
69
p < 0.001
Tropical nights, days0.260.92
p < 0.001
1.90
p < 0.001
0.341.66
p < 0.001
3.8
p < 0.001
0.341.84
p < 0.001
13.22
p < 0.001
Max TX, °C31.533.0
p < 0.001
33.2
p < 0.001
31.532.9
p < 0.001
33.9
p < 0.001
31.533.0
p < 0.001
36.5
p < 0.001
Warm-spell duration indicator, days 617
p < 0.001
21
p < 0.001
618
p < 0.001
32
p < 0.001
619
p < 0.001
65
p < 0.001
TX of at least 30 °C, days48
p < 0.001
10
p < 0.001
49
p < 0.001
12
p < 0.001
49
p < 0.001
24
p < 0.001
TX of at least 35 °C, days0.130.520.850.140.64
p < 0.001
1.25
p < 0.001
0.140.68
p < 0.001
4.62
p < 0.001
Consecutive hot days and nights (d = 2)02
p < 0.001
2
p < 0.001
02
p < 0.001
4
p < 0.001
02
p < 0.001
7
p < 0.00
Cooling degree days, degree days100162
p < 0.001
179
p < 0.001
102174
p < 0.001
234
p < 0.001
102176
p < 0.001
407
p < 0.001
Max TN, °C18.619.8
p < 0.001
20.0
p < 0.001
18.719.9
p < 0.001
20.9
p < 0.001
18.720.1
p < 0.001
23.1
p < 0.001
Mean TX, °C12.713.9
p < 0.001
14.0
p < 0.001
12.713.9
p < 0.001
14.8
p < 0.001
12.713.9
p < 0.001
16.5
p < 0.001
Number of hot days, % (TX90p)10.616.3
p < 0.001
17.2
p < 0.001
10.617.2
p < 0.001
22.8
p < 0.001
10.617.2
p < 0.001
34.8
p < 0.001
Number of warm nights, % (TN90p)10.618.5
p < 0.001
18.9
p < 0.001
10.618.4
p < 0.001
26.0
p < 0.001
10.619.4
p < 0.001
41.9
p < 0.001
Disclaimer/Publisher’s Note: The statements, opinions and data contained in all publications are solely those of the individual author(s) and contributor(s) and not of MDPI and/or the editor(s). MDPI and/or the editor(s) disclaim responsibility for any injury to people or property resulting from any ideas, methods, instructions or products referred to in the content.

