Review

Farmstead-Specific Weather Risk Prediction Technique Based on High-Resolution Weather Grid Distribution

National Center for AgroMeteorology (NCAM), Seoul National University, Seoul 08826, Republic of Korea
*
Author to whom correspondence should be addressed.
Atmosphere 2024, 15(1), 116; https://doi.org/10.3390/atmos15010116
Submission received: 21 November 2023 / Revised: 29 December 2023 / Accepted: 16 January 2024 / Published: 18 January 2024

Abstract

:
In recent years, the importance and severity of weather-related disasters have escalated, attributed to rising temperatures and the occurrence of extreme weather events due to global warming. The focus of disaster management has shifted from crisis management (e.g., repairing and recovering from damage caused by natural disasters) to risk management (e.g., prediction and preparation) while concentrating on early warning, thanks to the development of media and communication conditions. The Rural Development Administration (Korea) has developed the “early warning service for weather risk management in the agricultural sector” that detects weather risks for crops from high-resolution weather information in advance and provides customized information to respond to possible disaster risks in advance in response to the increasing number of extreme weather events. The core technology of this service is damage prediction technology that determines the overall agricultural weather risk level by quantifying the current growth stage of cultivated crops and the probability of possible weather disasters according to the weather conditions of the farm. Agrometeorological disasters are damages caused by weather conditions that can affect crops and can be predicted by estimating the probability of damage that may occur from the interaction between hazardous weather and crop characteristics. This review introduces the classification of possible weather risks by their occurrence mechanisms, based on the developmental stage of crops and prediction techniques that have been developed or applied to date. The accumulated crop growth and weather risk information is expected to be utilized as support material for farming decision-making, which helps farmers proactively respond to crop damage due to extreme weather events by providing highly reliable disaster forecasts through the advancement of prediction technology.

1. Introduction

Ongoing climate change is characterized by changes in the mean values of temperature and precipitation, as well as increases in interannual variability and frequency of extreme events. For farmers growing crops, unusual weather conditions and extreme weather events are more threatening than increases in mean values over long periods of time [1,2]. Unusual weather conditions refer to weather events that fall outside the normal range of variability of the normal weather. The possibility of them causing damage to the crops being cultivated can be described as a “weather risk”.
Crops that have been cultivated in a specific area, particularly within a watershed, for an extended period are presumed to have adapted to distinct environmental factors, including soil and climate, to facilitate growth and reproduction. If these crops are cultivated in a different watershed for a longer period, their external forms and internal functions (e.g., plant height, leaf size, thickness, shape, stem thickness, and fruit sugar content) may change to adapt to the new environment. This diversity of ecotypes, which are genetically identical but phenotypically different, is well known and easily observed in South Korea, which has relatively many watersheds due to complex topography. The main production areas of fruits and vegetables are good examples of agriculturally utilizing the characteristics of environmental conditions at the watershed level. The weather outside of the long-acclimatized climate range almost always leads to crop failure [3,4].
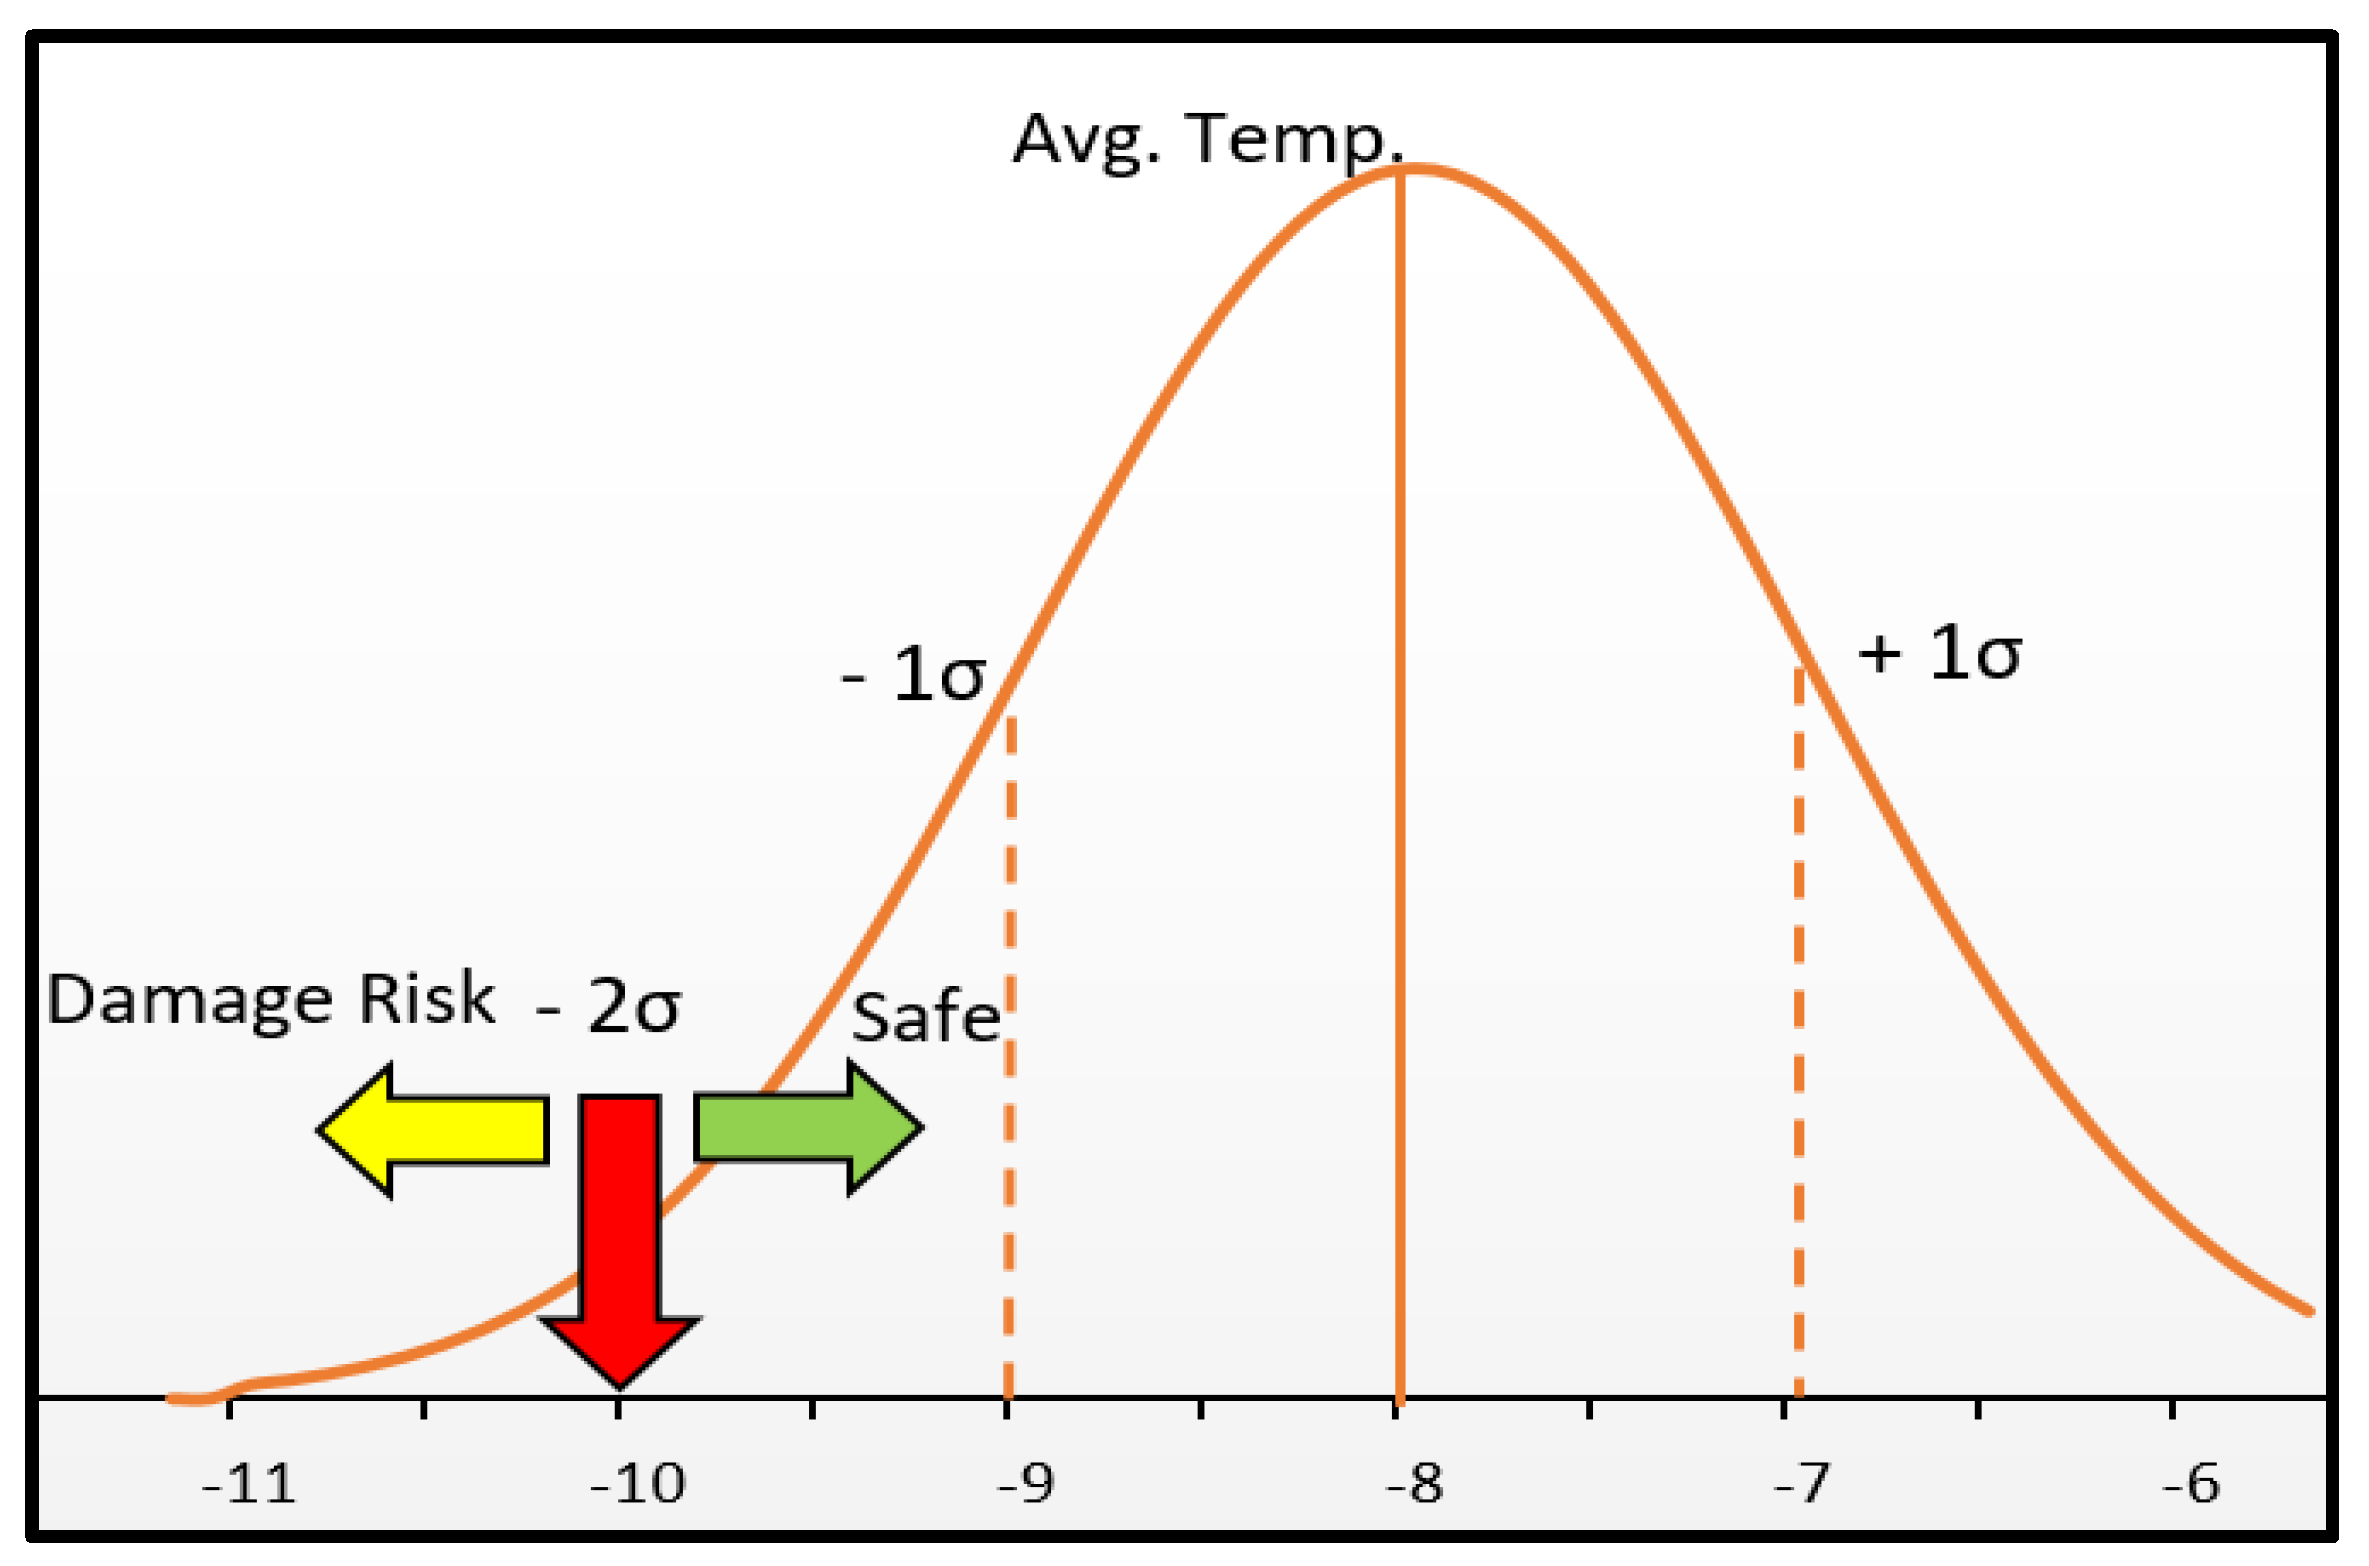
The WMO (World Meteorological Organization) evaluates these watershed-specific climatic conditions by using the mean climate data observed for at least 30 years [5], and high and low temperatures in the news media are based on an average year, and the growth of crops refers to fast or slow based on an average year, as well. An average year’s climate can be represented by the mean and standard deviation, and with enough observations, the frequency of occurrence will approximate a normal distribution curve with symmetrical left and right sides centered at the mean. If the observed values of a climate component follow a normal distribution, it will fall outside the normal range (±1 standard deviation from the mean (σ) = 84.1%) about once every 6 years (15.9%), and it will show a so-called “extreme event” that is two standard deviations away from the mean once every 30 years (2.1%) (Figure 1) [6].
Existing agricultural adaptation measures to extreme events typically focus on increased mean temperatures or precipitation. The current weather information system delivers only visible weather hazards or damages that have already occurred through multiple media, which makes it difficult for farmers to respond. The United Nations International Strategy for Disaster Reduction (UNDRR) announced a framework and targets for reducing weather-induced disasters internationally [7]. The Hyogo Framework 2005–2015, released in 2005, promoted a shift in disaster management from the traditional focus on rehabilitation to risk management for anticipation and preparedness [8]. The establishment of early warning systems is the center of risk management. The subsequent 2015 Sendai Framework (2015–2030) included the expansion of disaster early warning systems as one of the global targets for reducing weather-induced disasters to be sustained and increased for reducing weather-induced disasters (Figure 2) [9].
The Ministry of the Interior and Safety (Korea) and the Korea Meteorological Administration serve as the primary agencies governing the early warning and response system for urban floods and typhoons in South Korea. However, the agricultural sector, which is most affected by weather conditions, lacks specialized services for crop damage. Due to this issue, the Rural Development Administration (Korea) launched the “early warning service for weather risk management in the agricultural sector” in 2014, beginning with a pilot zone and extending it to target crops and areas. The “early warning service” is a novel concept of agricultural weather service that quantifies the weather conditions given to the farmland as a “weather risk index”, according to the type of crops being grown and their developmental stage, or delivers the possibility of disaster occurrence to the user one-on-one by comparing it with the average year. It does not consume additional resources other than the existing observation and forecasting system of the Korea Meteorological Administration [6,10].
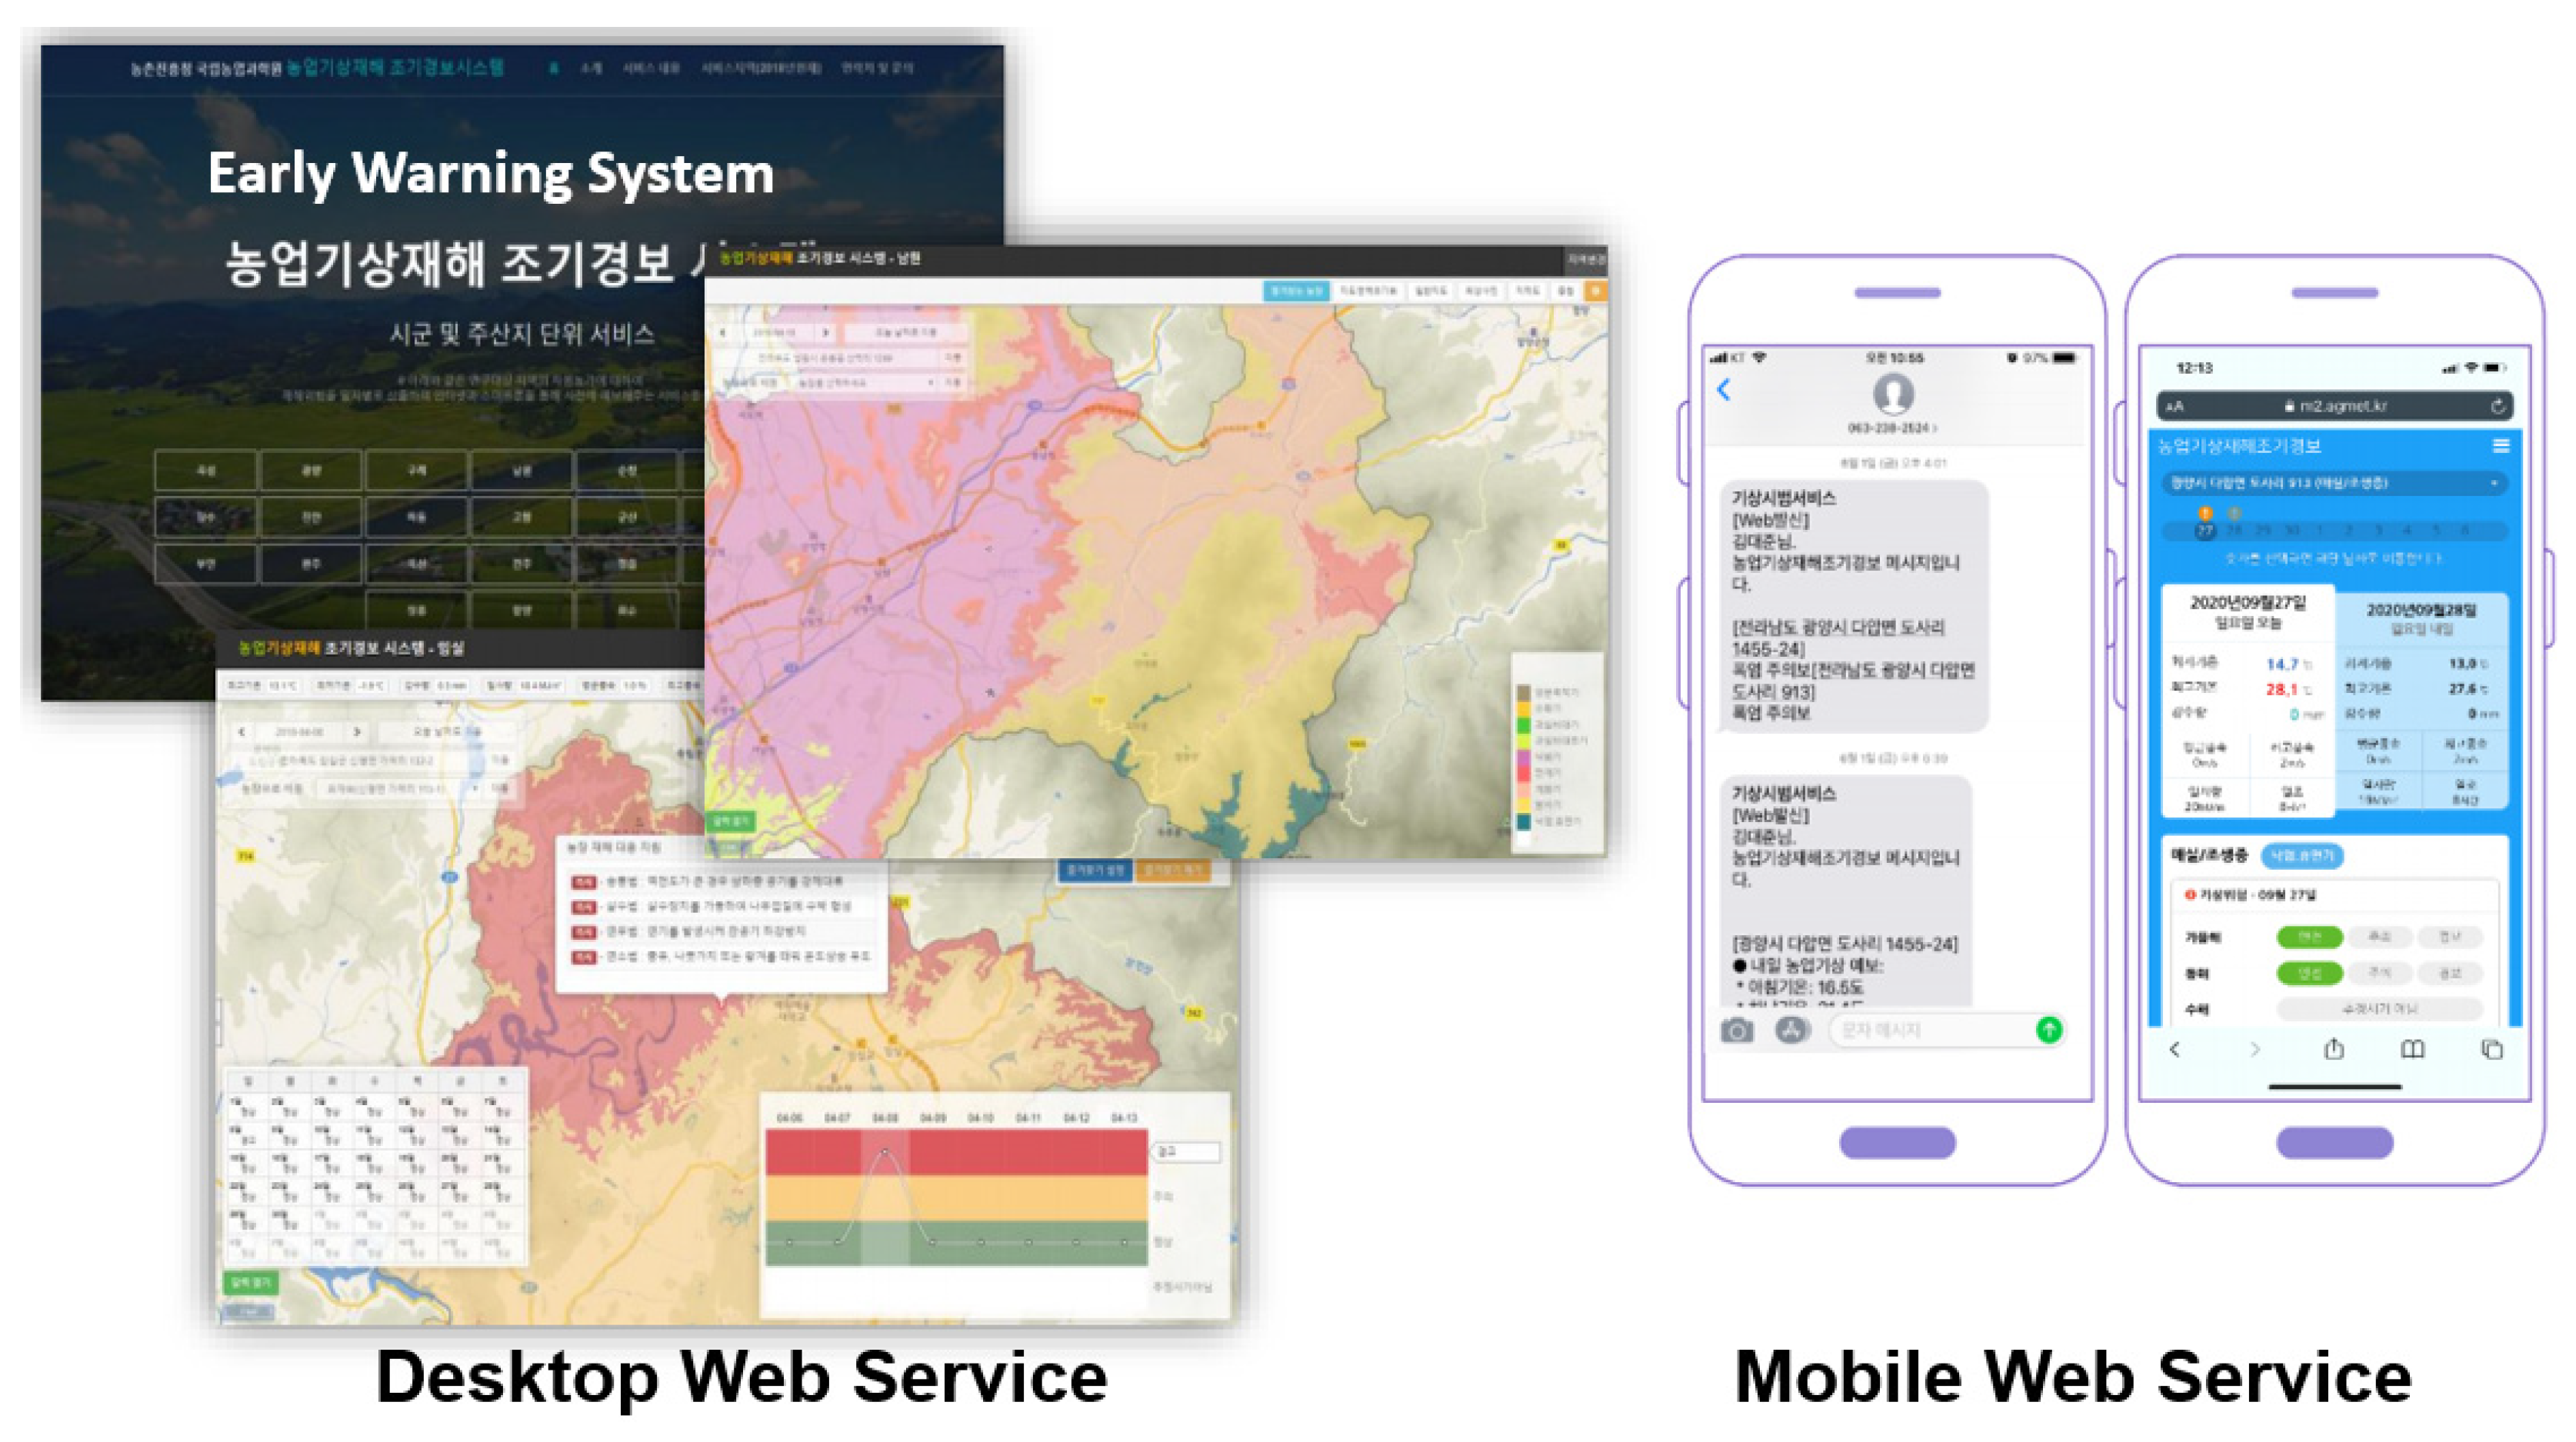
To provide prompt warnings to users in anticipation of disasters, an accurate standard for quantitatively assessing the risk of crop damage due to weather is imperative. This review aims to introduce the method of classifying and calculating the weather risk of crops applied by the “early warning service” for each crop according to its occurrence mechanism. This review also describes the principle of estimating developmental stages and the process of applying technology that allows weather information to be detailed at the farm scale (Figure 3).

2. Principles of Crop-Specific Weather Risk Assessment

It is necessary to accurately understand the biological characteristics of each crop to classify crop-specific hazardous weather by collecting information on the types of disasters, damage mechanisms, related hazardous weather and judgment criteria, and actual occurrences of each crop in the main production area. Universities and research institutions in South Korea and other countries have studied the weather conditions suitable for crop growth and the environments that may damage crops, including disaster-related studies and suitable cultivation site selection [12,13,14,15,16,17,18].
South Korea spans 33–38° north latitude and 126–132° east longitude, so the central region has a cold winter climate, and a temperate climate in the south. In winter, the northern region is affected by the Siberian and Mongolian highlands due to the westerly wind and has a continental climate, so it is dry and very cold, but the southern region is relatively warm. In summer, it is influenced by the Pacific Ocean and shows the characteristics of an oceanic climate, so it is hot and humid. There are four distinct seasons, and generally, summer and winter are long in the northern region, and spring and autumn are long in the southern region. In South Korea, weather disasters occur due to various meteorological elements. Frost injury occurs mainly in early spring (March–April), and flooding occurs mainly in the summer (July–September). In addition, sunburn can also occur in the summer. As such, temperature, precipitation, insolation, and wind speed are meteorological elements that can cause damage to crops. Depending on the meteorological elements, damage can be categorized into temperature-related damage (e.g., freezing and frost injury, chilling injury, and hot temperature injury), solar radiation-related damage (e.g., lack of sunlight and sunburn), precipitation-related damage (e.g., drought and flooding), and wind-related damage (e.g., strong wind damage and salt winds). Moreover, they can be divided into acute and chronic damage, according to the duration of the damage [6,10].

2.1. Acute Damages

Acute damages are usually caused by a sudden change in weather conditions over the course of a day or two (e.g., freezing, flood, strong wind damage, and sunburn). Typical examples are flood damage caused by flooding or a freezing injury due to a sudden cold wave. The flowering period of pears, one of South Korea’s representative fruit crops, usually occurs in early April, and pears are particularly vulnerable to low temperatures compared to the pre-flowering stage. At this time of year, they suffer from cold damage in sub-zero temperatures. If exposed to −1.7 °C or lower for more than 30 min, the ovary of the flower will freeze and die, and fertilization will not be possible. Even if the fruit is fertilized, it will not be marketable [19].
Acute damages can be forecasted through the establishment of thresholds that impact crop growth and the probability of damage based on the extent of departure from these thresholds. Furthermore, it is essential to consider the current growth progress, in addition to the weather environment, because the threshold may change as a plant grows throughout the year. For example, apples, a representative fruit tree grown in South Korea, have a risk of freezing damage during the dormant season when the temperature is below −25 °C or −30 °C. However, the threshold changes to −3 °C during germination, −1 °C during flowering, and 1 °C during fruit enlargement. These conditions may vary slightly depending on the variety and growing region [19].
In addition to simple temperature criteria, there are also methods for predicting damages by using risk indices. The freezing hardiness of plants varies depending on the external environment and developmental stage, even for the same variety or ecotype. In particular, the freezing hardiness during the dormant period can be expressed indirectly by the dormancy depth [20]. The dormancy–germination model for fruit trees developed by Cesaraccio et al. [21] is the most well-known model for calculating dormancy depth. This model calculates and accumulates chill days (Cd) by using daily maximum temperature, daily minimum temperature, and variety-specific standard temperature from the falling of fruits or harvesting date, and when the chill requirement is reached, the anti-chill days value is calculated and subtracted back. When this accumulated value becomes zero, germination is considered to begin.
Kim et al. [22] proposed a method to calculate the freezing injury risk index of peaches, which are widely cultivated in South Korea, using the minimum temperature and the accumulated chill days of the previous day. This method defines the temperature that induces freezing injury as the point at which more than 50% of total individuals at maximum dormancy depth during the peach germination period exhibit impaired germination, and the browning (necrosis) ratio (Risk (%)) is calculated as follows.
R i s k % = 100 1 + A · e ( X + T m i n ) · D c d
D c d = C · C d 108 2 + D
where Dcd means the cold resistance of the peach based on dormancy depth, Tmin means low temperature, and A and X are the shape factors of the curve. In addition, C and D are the parameters of the germination damage rate determined by the dormancy depth. Based on this formula, the degree of browning ratio is calculated according to the minimum temperature and dormancy depth. In other words, the risk of freezing damage is calculated differently under the same temperature conditions depending on the dormancy depth (Figure 4) (Equations (1) and (2)).
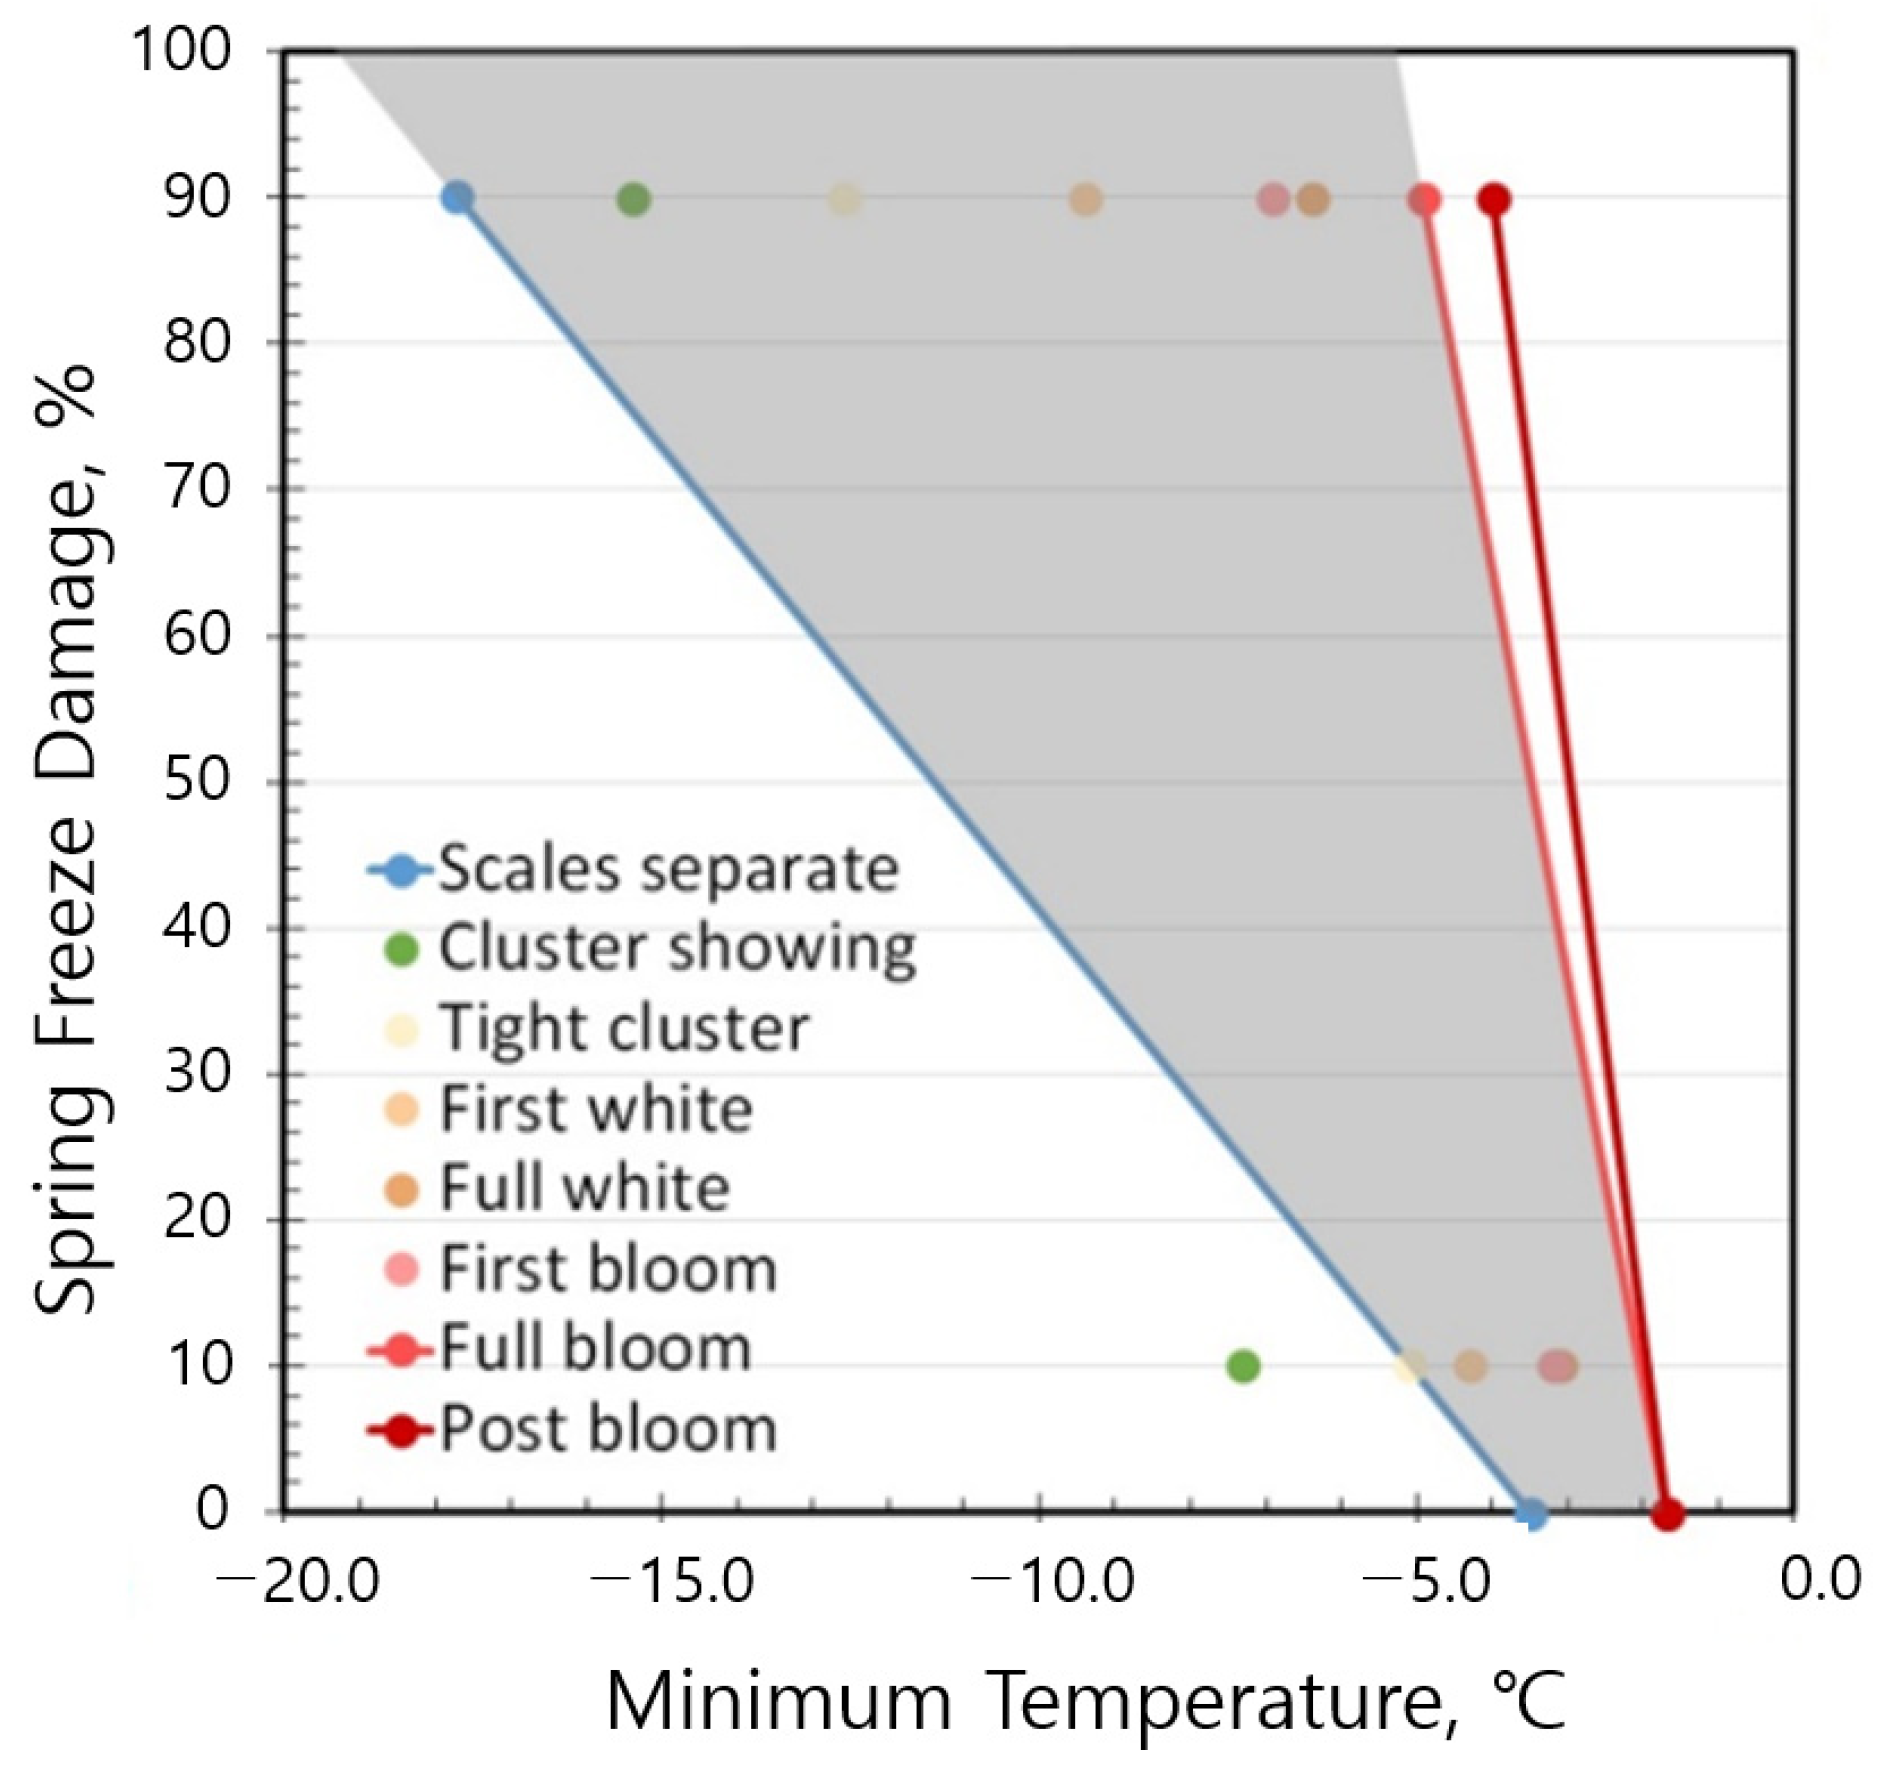
The method proposed by [23] can be used to calculate the risk of freezing and frost for the “Niitaka” pears. It uses the temperature at which 10% of flower buds are frozen and 90% of flower buds are frozen for each developmental stage and derives the relationships between the minimum temperature (Tmin) and freezing ratios (%) during budburst (Equation (3)), flowering (Equation (4)), and post-flowering (Equation (5)), according to conditions in South Korea [14]. where SFD means the spring frost damage in budburst periods (SFDb), in flowering periods (SFDf), and in post-flowering periods (SFDp).
S F D b = 6.34 · T m i n 22.18 ,
S F D f = 28.13 · T m i n 47.81 ,
S F D p = 39.13 · T m i n 66.52 ,
This method estimates the development stages (DVS) based on daily temperature to simulate the degree of damage at each stage between the budburst and full bloom of pear flower buds [24]. The daily damage rate can be estimated by using the heat unit for budburst (HUb: 108), flowering (HUf: 234.5), and the developmental stage DVS (HU) of the day (Figure 5). The damage risk from budburst to flowering can be calculated by Equation (6), while that after flowering can be calculated by Equation (7) [14].
R i s k % = S F D b + ( S F D f S F D b ) × H U H U b H U f H U b
R i s k % = S F D p

2.2. Chronic Damages

Crop growth is affected by prolonged exposure to non-routine weather conditions over a long period of time. Damages that can affect crop growth slowly over a long period are called chronic damages, and they do not damage crops in a day or two like acute damage. Chronic damages simulate the potential risk of damage to crops due to environmental conditions (e.g., low temperature, high humidity, drought, and lack of sunlight) that deviate from the average by more than two standard deviations (Figure 6) [25,26].
Chilling injury, which can occur during the summer months, is a representative example. Chilling injury is a growth disorder, but it is different from freezing or frost injury, which can occur in early spring or late fall. For example, rice, a staple food crop in South Korea, exhibits growth with high commercial value during the summer months under sufficient temperature conditions. However, if it is exposed to insufficient accumulated temperature conditions due to weather conditions different from normal (such as Changma (rainy season) or abnormal weather), the crop will undergo insufficient growth and may result in reduced commercial value. In the case of summer chilling, the damage can be predicted by using the following Equation (8) [26].
D H C = T m a x + T m i n 2 T b a s e T m i n < T b a s e     T m i n = T b a s e , T m a x > 30   ° C     T m a x = 30 , T m a x < T b a s e     D H C = 0
To assess low-temperature conditions over a long period, growing degree days (GDDs), a cumulative temperature, are used. It accumulates the daily heat contribution (DHC), the amount of heat per day that contributes to crop growth every four weeks using the maximum temperature, the minimum temperature, and growth base temperature (Tbase), and the mean and standard deviation are calculated for the past 30 years. The growth suitability of a crop can be simulated by comparing the cumulative temperature during the average year with the cumulative temperature at a specific time. In Equation (8), if the minimum temperature is lower than the growth base temperature, the minimum temperature is substituted for the growth threshold temperature to reflect the irreversibility of crop growth. Moreover, the daily maximum temperature is limited to 30 °C, considering that growth cannot accumulate due to increased respiration at high temperatures above 30 °C. The growth base temperature can be set to 10 °C for summer crops that are vulnerable to chilling [25].
Crop growth is also affected by prolonged lack of sunlight. The chronic sunlight deficit phenomenon, which occurs due to a prolonged lack of sunlight compared to normal, can be expressed as a probability variable based on the climate characteristics of the past 30 years (1991–2020 normal). The distribution characteristics of solar radiation in the target area are represented as a normal distribution with a 30-year mean and standard deviation. After converting it to a Z-value (the standard normal distribution), the relative position under the normal distribution curve is used as a criterion for determining damage. If the solar radiation in a particular year is below −2σ of the normal distribution, it means that there is a sunlight deficit that occurs about once every 30 years, like chronic chilling damage. When Xi represents the cumulative sunshine duration over 4 weeks, the formula for calculating the standardized normal distribution (Z-value) to determine whether it is abnormal (dangerous) or normal (safe) is the same as the formula for chronic chilling damage (Equation (9)).
Z i = X i μ i σ i
where μi and σi stand for mean cumulative solar radiation (4 weeks) and standard deviation over 30 years. This method predicts the risk of damage by using the deviation of the Z-value from the standard deviation (σ).
It is assumed that moisture supplied in the past is stored in the soil for a certain period and that plants can utilize this stored moisture. Ref. [27] used the concept of effective precipitation, which adds past daily precipitation while applying a weight to daily precipitation, to develop the effective drought index (EDI), which can determine drought on a daily basis. The agricultural drought index (ADI) is another method of predicting the risk of damage by entering the weather characteristics of a particular year.
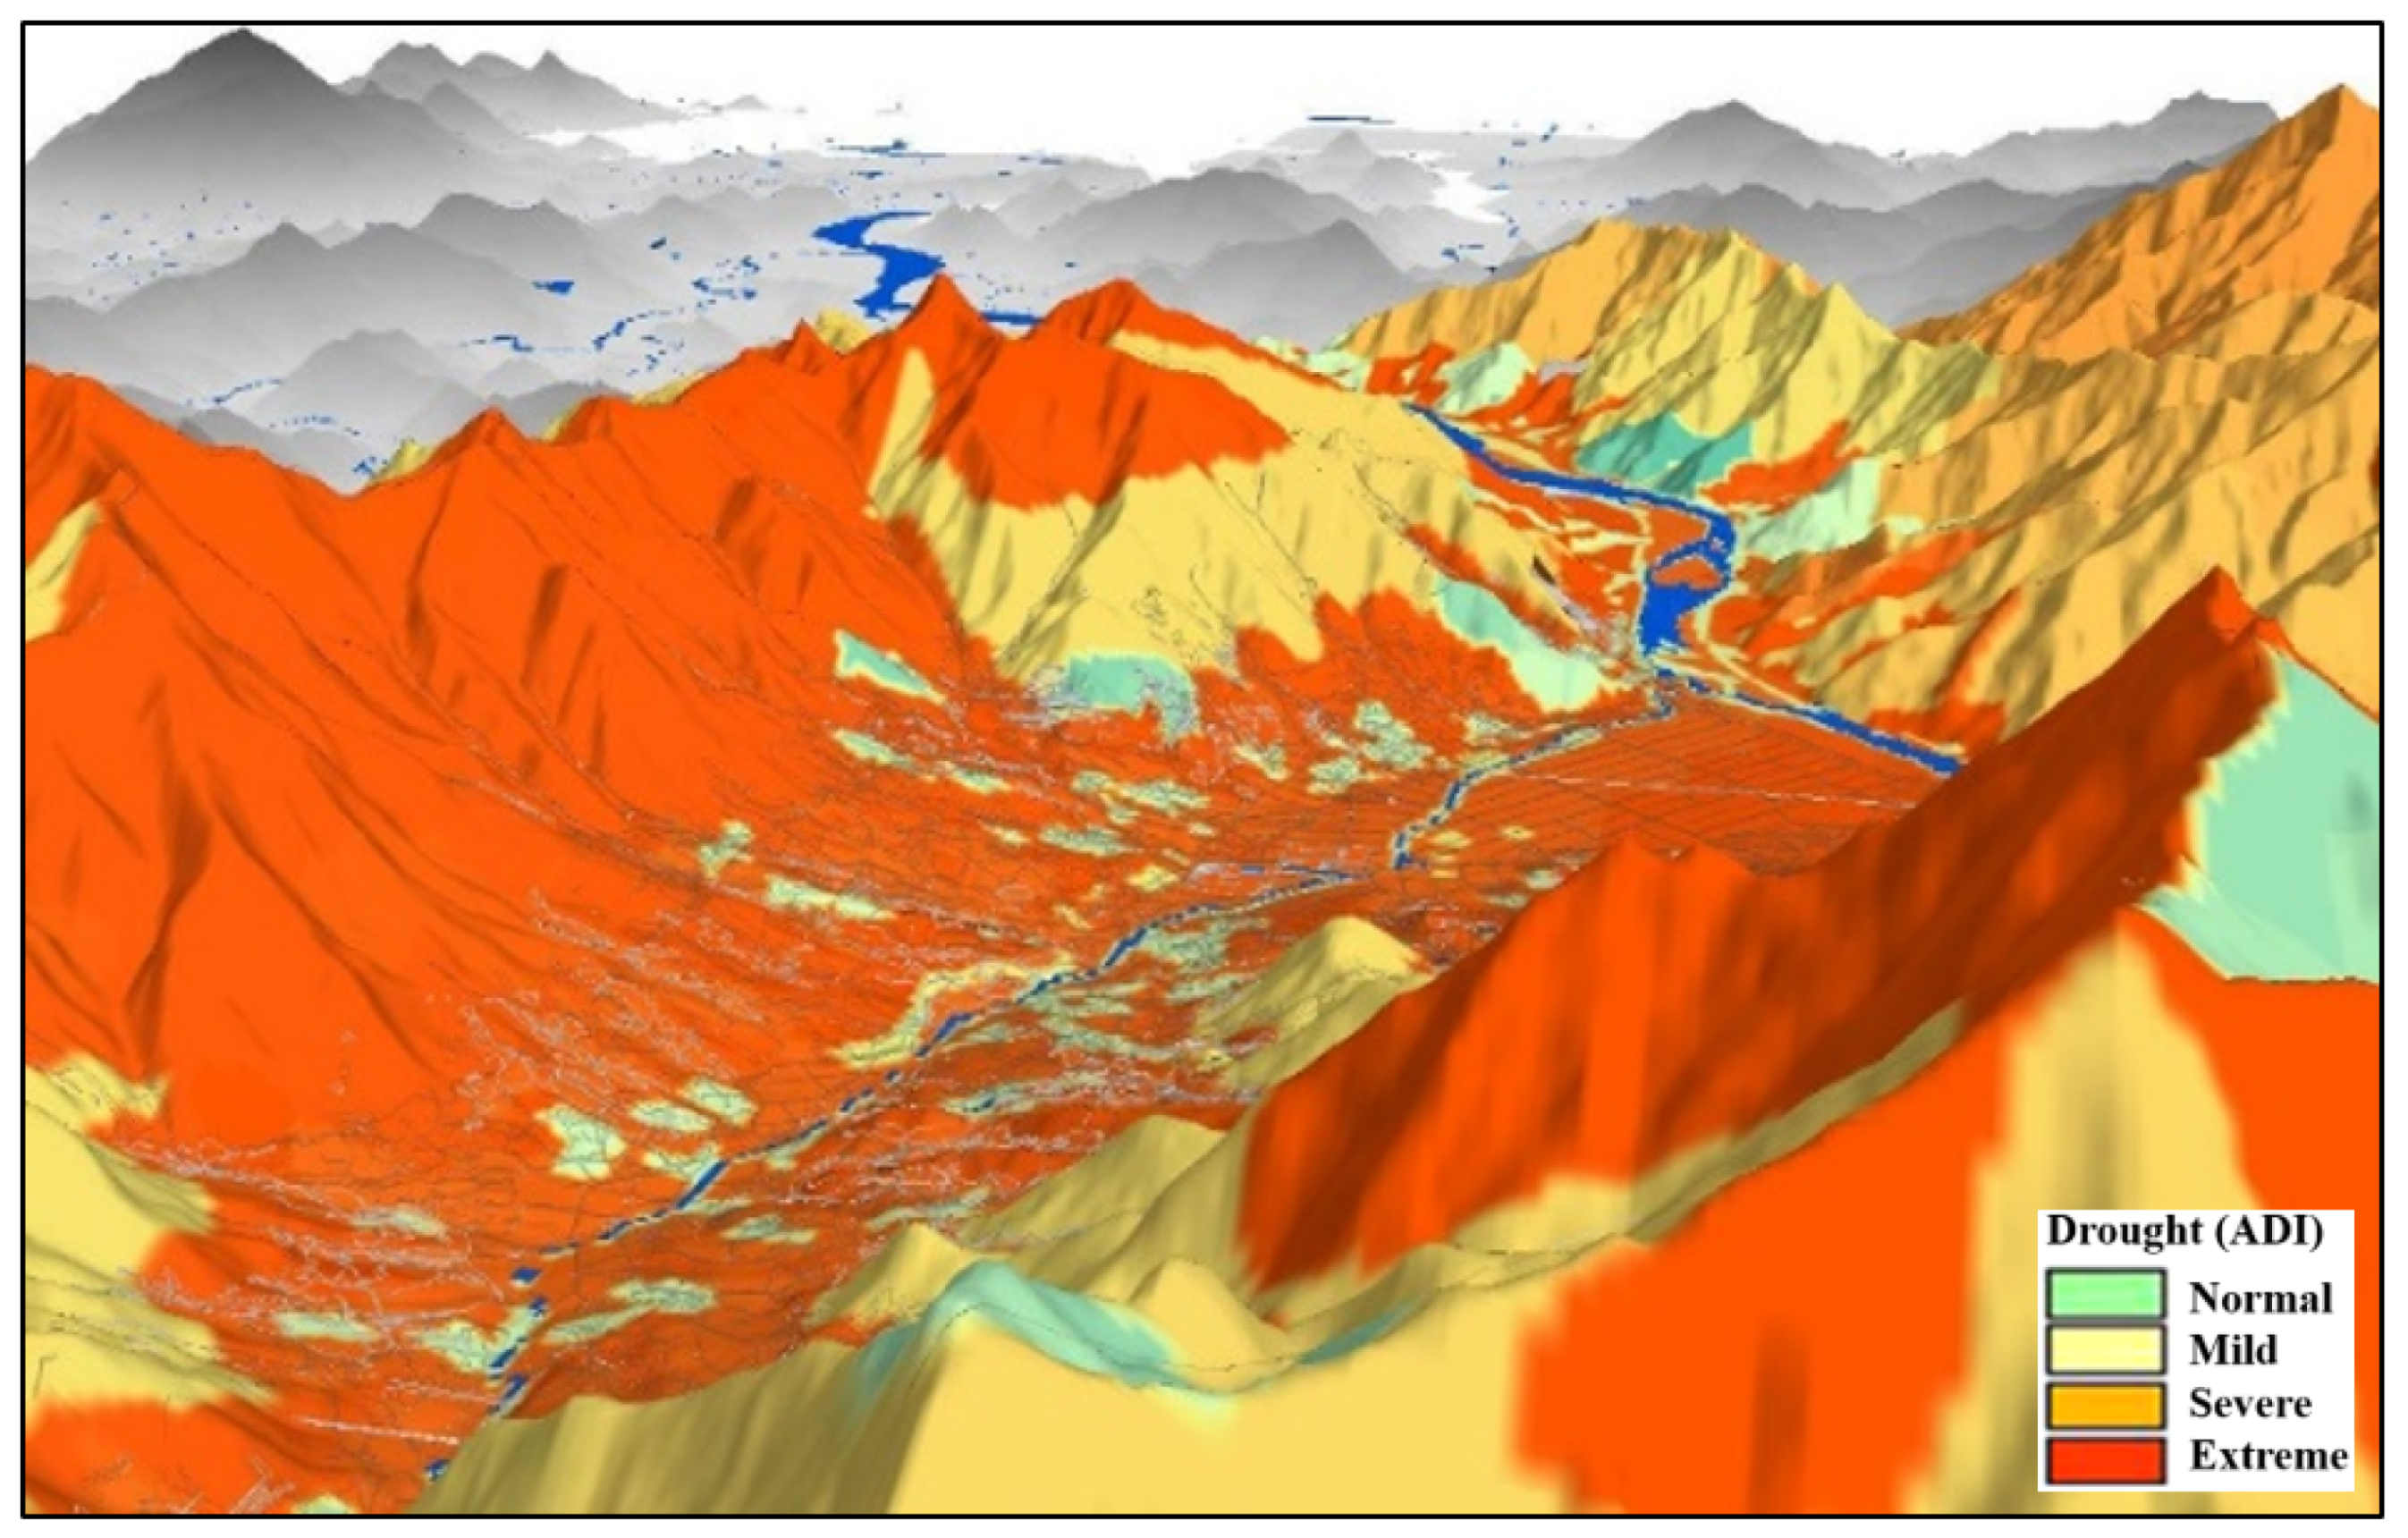
The ADI is a water balance index of the cultivation layer calculated by using the FAO Penman–Monteith reference evapotranspiration, crop evapotranspiration with a unique coefficient for each crop, and ground runoff estimated from the runoff curve number, based on the effective precipitation of the EDI [28]. In other words, the basis of the ADI is residual soil moisture, which subtracts crop evapotranspiration and ground runoff from effective precipitation. When the soil residual moisture is calculated for several decades and the frequency distribution is prepared, the natural logarithmic value is close to the normal distribution, which is the residual moisture index. The relative degree of drought can be determined by calculating the residual moisture index of a certain year based on the mean and standard deviation of residual moisture indices of a climatological normal year and comparing it with the distribution of an average year. Specifically, the severity of drought expressed by the ADI is categorized based on the standard deviation (σ) obtained from the average year data. If the calculated residual moisture index value is lower than −1σ from the mean of the average year, it indicates a “mild drought” stage, and if it is more than −2σ, it indicates a “severe drought” stage (Figure 7) [29].

3. Estimating Growth Stages

Growth stages that are important for farming operations, such as flowering and maturity, are usually expressed by months or “calendar time” (e.g., the first 10 days of a month and the last 10 days of a month). As the weather fluctuates due to climate change, there is a certain difference between the growth stage based on the calendar time and the actual growth. Therefore, it may become difficult to apply thresholds for each growth stage. In this case, “thermal time” can resolve this issue.
It is possible to estimate key growth stages based on thermal time by applying appropriate estimation models (e.g., phenology models, growth rate models, and GDD models) for major crops and cultivars. Phenology estimation studies are usually conducted on major food crops or fruit crops in a country. In South Korea, there are many studies on rice among food crops and apples and peaches among fruit crops. If a crop does not have enough studies on its phenology, it is possible to set a criterion by backtracking the cumulative temperature (GDD) after collecting observation dates of developmental stages (e.g., sowing, germination, and flowering) from cultivation test data conducted by relevant organizations and collecting weather data in the area from the Korea Meteorological Administration [30].

4. Detailed Farm-Scale Weather Information and Prediction of Agrometeorological Disasters at the Farm Level

The ground surface where plants grow creates a unique microclimate within a community, creating a local climate. In addition, the spatial and temporal variation of energy and material balance caused by different landscapes such as mountains and hills generates a local climate, or microclimate. South Korea has complex and diverse terrains consisting mostly of mountains, although there are some plains. Therefore, rural villages are generally on slopes, hills, or surrounding them, and small, intensive farming communities. This topography can create a wide range of climatic conditions even within a small watershed area [31]. In fact, South Korean farms are very small (an average parcel size per farm = 1.5 ha), which is only 2% of the United States (an average parcel size per farm = 78.6 ha) [32]. Moreover, these farms cultivate diverse crops on a small scale. Since agriculture and forestry are highly sensitive to weather conditions, it is difficult to reflect the localized topographic environment with mesoscale climatic conditions for agriculture and forestry in South Korea. Ref. [33] argued the need for a model that can estimate microclimates for complex and diverse terrain distributions such as South Korea.
To calculate area-level meteorological information and deliver it to users, weather information corresponding to random points that are not observed must be estimated in various ways, and a distribution map should also be generated from it. The technology of electronic climate mapping using a geospatial correction scheme. FS-GeST (Field Specific Geospatial Schemes based on Topo-climatology) has recently evolved to the level at which we can predict localized weather events in each farm or orchard and the resulting impact on crops [4].
In the past, it was possible to create a background distribution map through spatial interpolation after collecting approximately 600 weather observations from the ASOS and AWOS, which are observed on a point-by-point basis. For forecast data, it is possible to utilize local forecasts provided by the Korea Meteorological Administration at 3 h intervals, with a forecast lead time of up to 67 h. Since it is provided at a 5 × 5 km grid resolution for the entire Korean Peninsula, it can be used as a background distribution map.
For temperature, the first step in reflecting the effects of terrain onto the background distribution map is to correct for elevation deviation. This corrects the temperature using a temperature value at an observation point the temperature lapse rate at which the temperature changes with the changing altitude [34]. Moreover, the maximum temperature can be corrected by reflecting the increase in temperature through solar radiation reflecting the terrain effect [35,36]. The minimum temperature can be corrected by simulating the thermal belt or cold air drainage [37,38,39]. This was reported to have an RMSE of about 1.0 to 1.2 °C based on the study target area in South Korea [39].
Kim and Yun [40] devised a method to convert the near real-time or forecasted daily precipitation distribution provided by the Korea Meteorological Administration at a 5 km grid resolution into a precise distribution map at a 270 m grid resolution. The precipitation downscaling process consists of two steps: the first step was to increase the resolution to 1 km by applying weather radar data to 5 km grid local forecasts, and the second step was to reflect terrain characteristics using spatial statistical techniques based on the mountain precipitation model (PRISM; Parameter-elevation Regression on Independent Slopes Model) (Figure 8) [41,42,43]. According to Kim and Yun [40], the developed precipitation estimation model showed an improvement effect of about 28% compared to the existing model.
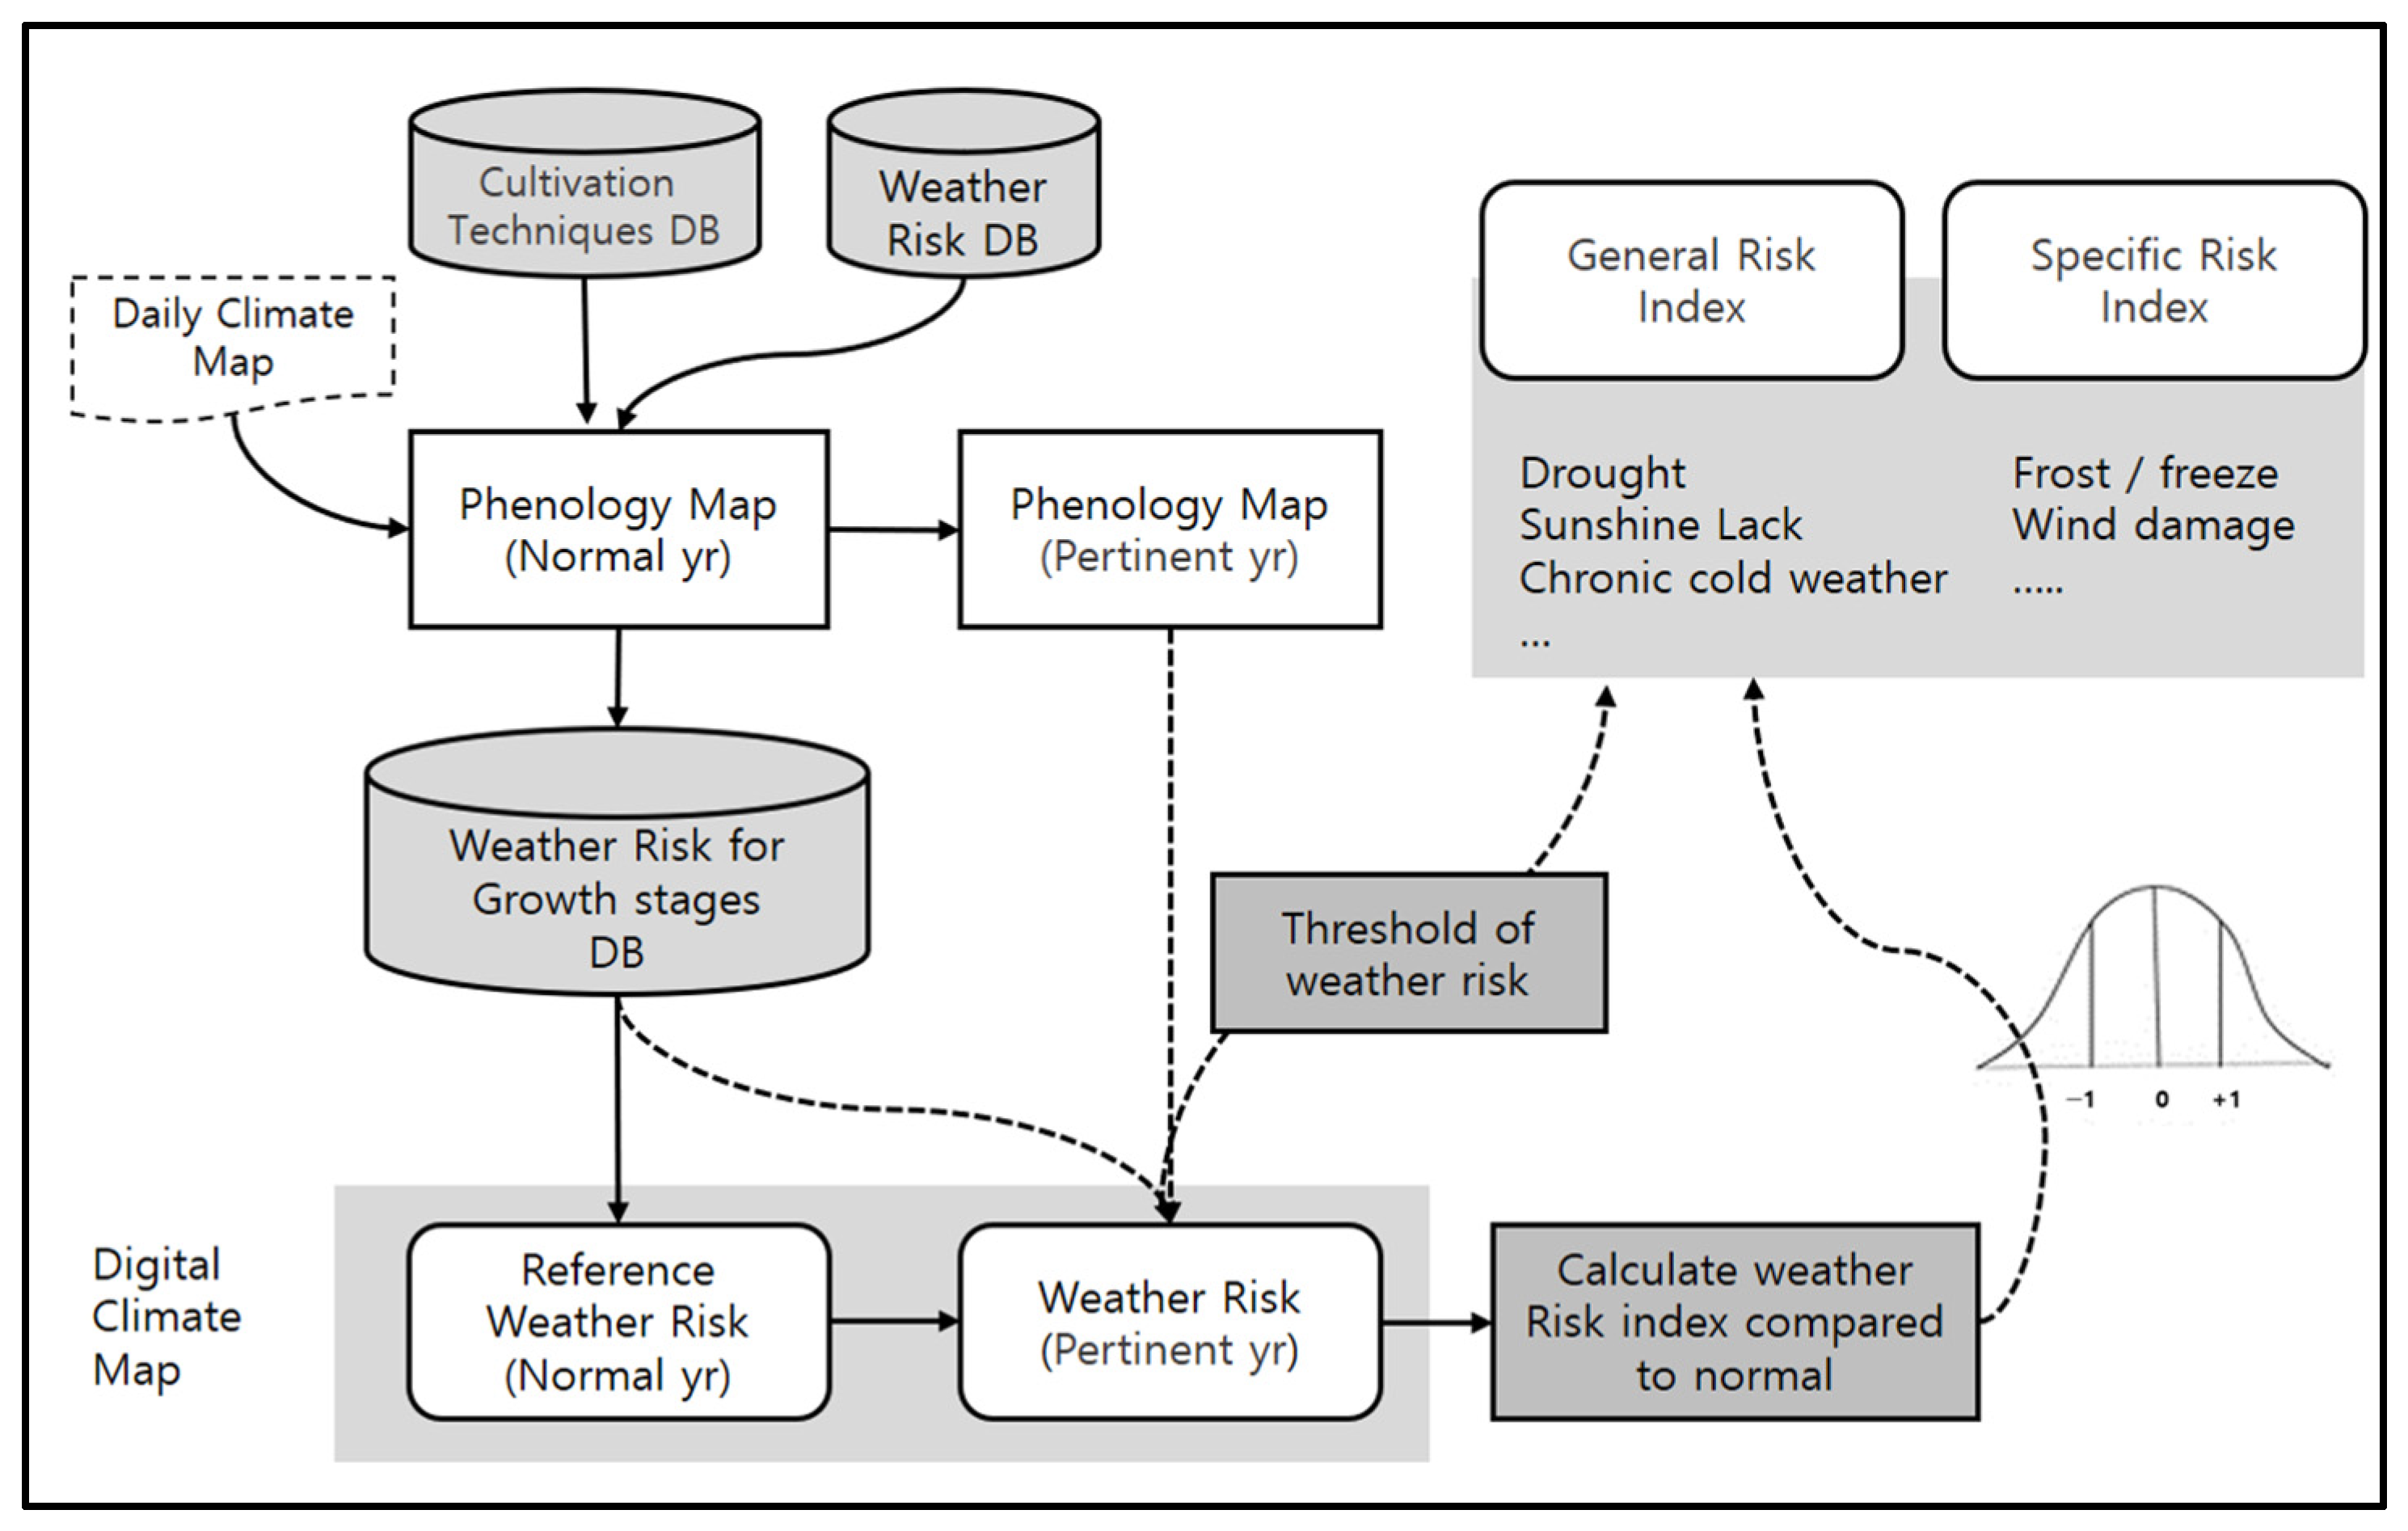
It is possible to produce and provide differentiated weather information at the farm level by using detailed weather information. If weather information is utilized effectively, it can enable real-time prediction and preparation for crop growth information and damage risks. In other words, grid-level weather information is calculated first, and the growth stage is estimated independently for each grid by using weather information. Then, it predicts the risk of potential damage by growth stage. The “early warning service for weather risk management in the agricultural sector” provides the risk of weather damages by crop, as well as detailed weather and forecast information. As a crop grows, the weather conditions it can adapt to change. If we apply the detailed weather information to thermal time, which can be used to estimate the developmental stages of a crop, we can depict the growth information on a high-resolution grid, and damage to crops can be applied differentially based on the growth stage (Figure 9 and Figure 10) [6].

5. Conclusions

This review introduces the method of calculating damage that is currently applied to the “early warning service” of the Rural Development Administration and the process of applying it by integrating it with detailed high-resolution meteorological data. Downscaling technology and disaster application technology optimized for complex terrain conditions such as in South Korea have been steadily developing due to their environmental characteristics. A geospatial correction scheme can be applied to past, present, and future scenarios and has been developed and improved for various spatial and temporal resolutions. Therefore, it has a positive impact on application in the agricultural field.
The “early warning service” reports the growth progress and potential damage by crops to individual farmers in advance, which is a unique technology in the world, and it is expected to continue to advance. It can provide detailed and differentiated disaster information by using detailed weather information, which enables the provision of “crop growth and damage predictions for your farm”. As of 2023, weather risk indices have been developed or applied to 40 crops according to their growth stages.
Assessment data of weather, growth stages, and weather risk are all made based on the weather information and forecast data of the Korea Meteorological Administration. In addition, each model of the “early warning service” has its own error. Therefore, each element has some errors. In the case of temperature, there is an RMSE of ±1 °C, and the growth stage shows an RMSE of ±2 days based on the blooming period of the peach. In addition, in the case of forecast data, errors may occur in the process of detailing them because errors are implied by themselves [4,22,34,35,38,39].
If various types of weather information and forecast data provided by the Korea Meteorological Administration improve, agrometeorological disaster prediction technology will also advance accordingly. For example, the “early warning service” uses daily weather data for damage prediction. If we can downscale hourly weather data to the farm level, it will be possible to determine the risk level based on exposure hours to hazardous weather conditions. We expect that it will become a major contributor to the development of disaster response by producing digital weather and climate information with high accuracy through the expansion of the applicable regions and the advancement of prediction technology and its application to agriculture and forestry in various ways.

Author Contributions

Conceptualization, D.-J.K.; methodology, D.-J.K. and J.-H.K.; software, D.G.K.; validation, D.-J.K.; formal analysis, E.-J.Y. and D.G.K.; investigation, D.-J.K., J.-H.K., E.-J.Y., D.G.K. and E.B.; resources, D.-J.K., J.-H.K., E.-J.Y., D.G.K. and E.B.; data curation, D.-J.K.; writing—original draft preparation, D.-J.K., J.-H.K., E.-J.Y., D.G.K. and E.B.; writing—review and editing, D.-J.K. and J.-H.K.; visualization, D.-J.K., E.-J.Y. and E.B.; supervision, J.-H.K.; project administration, J.-H.K.; funding acquisition, D.-J.K. All authors have read and agreed to the published version of the manuscript.

Funding

This study was funded by Rural Development Administration (PJ014879) in the Republic of Korea.

Institutional Review Board Statement

Not applicable.

Informed Consent Statement

Not applicable.

Data Availability Statement

The resulting data in this paper are accessible from the “early warning service for weather risk management in the agricultural sector” (https://agmet.kr) (accessed on 29 December 2023).

Acknowledgments

This work was carried out with the support of the “Cooperative Research Program for Agriculture Science and Technology Development (Project No. PJ014879)”, Rural Development Administration, Republic of Korea. The authors are grateful to the anonymous reviewers for their constructive comments and suggestions.

Conflicts of Interest

The authors declare no conflicts of interest.

References

  1. Gobin, A.; Tarquis, A.M.; Dalezios, N.R. Weather-related hazards and risks in agriculture. Nat. Hazards Earth Syst. Sci. 2013, 13, 2599–2603. [Google Scholar] [CrossRef]
  2. IPCC. Climate Change 2023: Synthesis Report. Contribution of Working Groups I, II and III to the Sixth Assessment Report of the Intergovernmental Panel on Climate Change; Core Writing Team, Lee, H., Romero, J., Eds.; IPCC: Geneva, Switzerland, 2023; pp. 35–115. [Google Scholar] [CrossRef]
  3. Yun, J.I. A Feasibility Study of a Field-specific Weather Service for Small-scale Farms in a Topographically Complex Watershed. Korean J. Agric. For. Meteorol. 2015, 17, 317–325, (In Korean with English abstract). [Google Scholar] [CrossRef]
  4. Kim, D.-J. Past, Present and Future of Geospatial Scheme based on Topo-Climatic Model and Digital Climate Map. Korean J. Agric. For. Meteorol. 2021, 23, 268–279, (In Korean with English abstract). [Google Scholar] [CrossRef]
  5. WMO. Available online: https://wmo.int/topics/climate (accessed on 1 November 2023).
  6. Yun, J.I. Agrometeorological Early Warning System: A Service Infrastructure for Climate-Smart Agriculture. Korean J. Agric. For. Meteorol. 2014, 16, 403–417, (In Korean with English abstract). [Google Scholar] [CrossRef]
  7. UNDRR. Available online: https://www.preventionweb.net/Sendai-Framework/Sendai-Framework-Monitor (accessed on 1 November 2023).
  8. Wilhite, D.A.; Hayes, M.J.; Knutson, C.; Smith, K.H. Planning for drought: Moving from crisis to risk management. J. Am. Water. Resour. Assoc. 2000, 36, 697–710. [Google Scholar]
  9. Pearson, L.; Pelling, M. The UN Sendai framework for disaster risk reduction 2015–2030: Negotiation process and prospects for science and practice. J. Extrem. Events 2015, 2, 157001. [Google Scholar] [CrossRef]
  10. Shim, K.M.; Kim, Y.S.; Jung, M.P.; Choi, I.T.; Kim, H.; Kang, K.K. Implementation of Agrometeorological Early Warning System for Weather Risk Management in South Korea. J. Clim. Chang. Res. 2017, 8, 171–175, (In Korean with English abstract). [Google Scholar] [CrossRef]
  11. Early Warning Service for Weather Risk Management in Agricultural Sector. Available online: https://agmet.kr (accessed on 1 November 2023).
  12. Shim, D.; Kwon, M.J.; Hwang, J.G.; Kang, E.-J.; Song, S.-H.; Son, Y.-H.; Kim, J.C.; Cho, K.H.; Im, H.J.; Shim, S.; et al. Effects of Lasting Periods of Low Temperature on the Growth and Physiological Activity in Tea Trees. J. Kor. Tea Soc. 2020, 26, 39–47, (In Korean with English abstract). [Google Scholar] [CrossRef]
  13. Kim, D.-J.; Kim, J.-H.; Yun, J.I. An Agrometeorological Reference Index for Projecting Weather-Related Crop Risk under Climate Change Scenario. Korean J. Agric. For. Meteorol. 2016, 18, 162–169, (In Korean with English abstract). [Google Scholar] [CrossRef]
  14. Kim, J.-H.; Kim, D.; Kim, S.; Yun, E.; Ju, O.; Park, J.S.; Shin, Y.S. Estimation of freeze damage risk according to developmental stage of fruit flower buds in spring. Korean J. Agric. For. Meteorol. 2019, 21, 55–64, (In Korean with English abstract). [Google Scholar] [CrossRef]
  15. Sagong, D.-H.; Kweon, H.-J.; Park, M.-Y.; Song, Y.-Y.; Ryu, S.; Kim, M.-J.; Choi, K.H.; Yoon, T.-M. Impacts of Urban High Temperature Events on Physiology of Apple Trees: A Case Study of ’Fuji’/M.9 Apple Trees in Daegu, Korea. Korean J. Agric. For. Meteorol. 2013, 15, 130–144, (In Korean with English abstract). [Google Scholar] [CrossRef]
  16. Warrington, I.J.; Fulton, T.A.; Halligan, E.A.; de Silva, H.N. Apple fruit growth and maturity are affected by early season temperatures. J. Am. Soc. Hortic. Sci. 1999, 124, 468–477. [Google Scholar] [CrossRef]
  17. Yamada, H.; Hamamoto, K.; Sugiura, A.; Tomana, T. Effect of controlled fruit temperature on maturation of apple fruits. J. Japan. Soc. Hort. Sci. 1988, 57, 173–177, (In Japanese with English abstract). [Google Scholar] [CrossRef]
  18. Parker, J. Seasonal changes in cold resistance and free sugars in some hardwood tree barks. For. Sci. 1963, 8, 225–235. [Google Scholar] [CrossRef]
  19. NONGSRO (Rural Development Administration). Available online: https://www.nongsaro.go.kr/ (accessed on 1 November 2023).
  20. Kwon, E.Y.; Jung, J.E.; Chung, U.; Lee, S.J.; Song, G.C.; Choi, D.G.; Yun, J.I. A Thermal Time-Driven Dormancy Index as a Complementary Criterion for Grape Vine Freeze Risk Evaluation. Korean J. Agric. For. Meteorol. 2006, 8, 1–9. Available online: https://koreascience.kr/article/JAKO200617033620816.page (accessed on 1 November 2023). (In Korean with English abstract).
  21. Cesaraccio, C.; Spano, D.; Snyder, R.L.; Duce, P. Chilling and forcing model to predict bud-burst of crop and forest species. Agric. For. Meteorol. 2004, 126, 1–13. [Google Scholar] [CrossRef]
  22. Kim, J.H.; Kim, S.O.; Chung, U.; Hwang, K.H.; Kim, J.B.; Yoon, I.K.; Yun, J.I. Geospatial assessment of frost and freeze risk in ‘Changhowon Hwangdo’ peach (Prunus perica) trees as affected by the projected winter warming in South Korea: II. Freezing risk index based on dormancy depth as a proxy for physiological tolerance to freezing temperature. Korean J. Agric. For. Meteorol. 2009, 11, 213–220, (In Korean with English abstract). [Google Scholar] [CrossRef]
  23. Westeood, M.N. Temperate-Zone Pomology; Physiology and Culture, 3rd ed.; Timber Press Inc.: Portland, OR, USA, 1993; pp. 428–429. Available online: https://books.google.co.kr/books?id=1SojAQAAMAAJ (accessed on 1 November 2023).
  24. Han, J.H.; Lee, S.H.; Choi, J.J.; Jung, S.B.; Jang, H.I. Estimation of dormancy breaking time by development rate model in ‘Niitaka’ pear (Pyrus pyrifolia Nakai). Korean J. Agric. For. Meteorol. 2008, 10, 58–64, (In Korean with English abstract). [Google Scholar] [CrossRef]
  25. Kim, D.J. Categorizing Likelihood of Agrometeorological Hazards into Risk Indices. In Proceedings of the 2012 Conference on Korean Society of Agricultural and Forest Meteorology, 2014, Hadong, Republic of Korea, 20 November 2014; pp. 61–73. Available online: https://koreascience.kr/article/CFKO201431262928623.page (accessed on 2 November 2023). (In Korean).
  26. Kim, S.O.; Kim, D.K.; Choi, Y.J. Forecasting the Likelihood of Chronic Chilling Injury in Crops Based on Daily Temperature Data. In Proceedings of the 2014 Conference on The Korean Society of Agricultural and Forest Meteorology 2014, Hadong, Republic of Korea, 20 November 2014; pp. 222–227. Available online: https://koreascience.kr/article/CFKO201431262928778.page (accessed on 2 November 2023). (In Korean).
  27. Byun, H.-R.; Wilhite, D.A. Objective Quantification of Drought Severity and Duration. J. Clim. 1999, 12, 2747–2756. [Google Scholar] [CrossRef]
  28. Kim, D.-J.; Moon, K.-H.; Yun, J.I. Drought Index Development for Agricultural Drought Monitoring in a Catchment. Korean J. Agric. For. Meteorol. 2014, 16, 359–367, (In Korean with English abstract). [Google Scholar] [CrossRef]
  29. Kim, D.J.; Kim, S.O.; Kim, J.H.; Shim, K.M.; Yun, J.I. A drought index designed for field-scale water management. Asia-Pac. J. Atmos. Sci. 2015, 51, 197–203. [Google Scholar] [CrossRef]
  30. National Institute of Agricultural Sciences. Technical Guide to Early Warning Service for Agricultural Meteorological Disasters; National Institute of Agricultural Sciences: Wanju, Republic of Korea, 2021; pp. 60–93. Available online: https://books.google.co.kr/books?id=Az2gzwEACAAJ (accessed on 1 November 2023). (In Korean)
  31. Yun, J.I. Agroclimatic maps augmented by a GIS technology. Korean J. Agric. For. Meteorol. 2010, 12, 63–73, (In Korean with English abstract). [Google Scholar] [CrossRef]
  32. Korea Rural Economic Institute. Available online: https://www.krei.re.kr/krei/index.do (accessed on 1 November 2023).
  33. Yun, J.I. Applications of “High Definition Digital Climate Maps” in Restructuring of Korean Agriculture. Korean J. Agric. For. Meteorol. 2007, 9, 1–16, (In Korean with English abstract). [Google Scholar] [CrossRef]
  34. Kim, S.O.; Yun, J.I. Improving the usage of the Korea Meteorological Administration’s digital forecasts in agriculture: V. Field validation of the sky-condition based lapse rate estimation scheme. Korean J. Agric. For. Meteorol. 2016, 18, 135–142, (In Korean with English abstract). [Google Scholar] [CrossRef]
  35. Kim, S.O.; Yun, J.I. Improving usage of the Korea Meteorological Administration’s digital forecasts in agriculture: III. Correction for advection effect on determination of daily maximum temperature over sloped surfaces. Korean J. Agric. For. Meteorol. 2014, 16, 297–303, (In Korean with English abstract). [Google Scholar] [CrossRef]
  36. Yun, E.J.; Kim, S.O. Improving Usage of the Korea Meteorological Administration’s Digital Forecasts in Agriculture: Correction Method for Daytime Hourly Air Temperature over Complex Terrain. Korean J. Agric. For. Meteorol. 2019, 21, 221–228, (In Korean with English abstract). [Google Scholar] [CrossRef]
  37. Thornton, P.E.; Running, S.W.; White, M.A. Generating surfaces of daily meteorological variables over large regions of complex terrain. J. Hydrol. 1997, 190, 214–251. [Google Scholar] [CrossRef]
  38. Kim, S.O.; Yun, J.I. A quantification method for the cold pool effect on nocturnal temperature in a closed catchment. Korean J. Agric. For. Meteorol. 2011, 13, 176–184, (In Korean with English abstract). [Google Scholar] [CrossRef]
  39. Kim, S.O.; Kim, J.H.; Kim, D.J.; Yun, J.I. Wind effect on daily minimum temperature across a cold pooling catchment. Korean J. Agric. For. Meteorol. 2012, 14, 277–282, (In Korean with English abstract). [Google Scholar] [CrossRef]
  40. Kim, D.-J.; Yun, J.I. Improving Usage of the Korea Meteorological Administration’s Digital Forecasts in Agriculture: 2. Refining the Distribution of Precipitation Amount. Korean J. Agric. For. Meteorol. 2013, 15, 171–177, (In Korean with English abstract). [Google Scholar] [CrossRef]
  41. Daly, C.; Neilson, R.P.; Phillips, D.L. A statistical topographic model for mapping climatological precipitation over mountainous terrain. J. Appl. Meteorol. Climatol. 1994, 33, 140–158. [Google Scholar] [CrossRef]
  42. Johnson, G.L.; Pasteries, P.A.; Taylor, G.H.; Daly, C. Spatial climate products—A new dimension for climate applications. In Proceedings of the 11th Conference on Applied Climatology 1999, Dallas, TX, USA, 10–15 January 1999; American Meteorological Society: Boston, MA, USA, 1999; pp. 107–113. Available online: https://ams.confex.com/ams/older/99annual/abstracts/1770.htm (accessed on 1 November 2023).
  43. Chung, U.-R.; Kim, J.H.; Kim, S.-O.; Choi, M.H.; Hwang, K.H.; Yun, J.I. Geospatial Assessment of Frost and Freeze Risk in ‘Changhowon Hwangdo’ Peach (Prunus persica) Trees as Affected by the Projected Winter Warming in South Korea: II. Freezing Risk Index Based on Dormancy Depth as a Proxy for Physiological Tolerance to Freezing Temperature. Korean J. Agric. For. Meteorol. 2009, 11, 206–212, (In Korean with English abstract). [Google Scholar] [CrossRef]
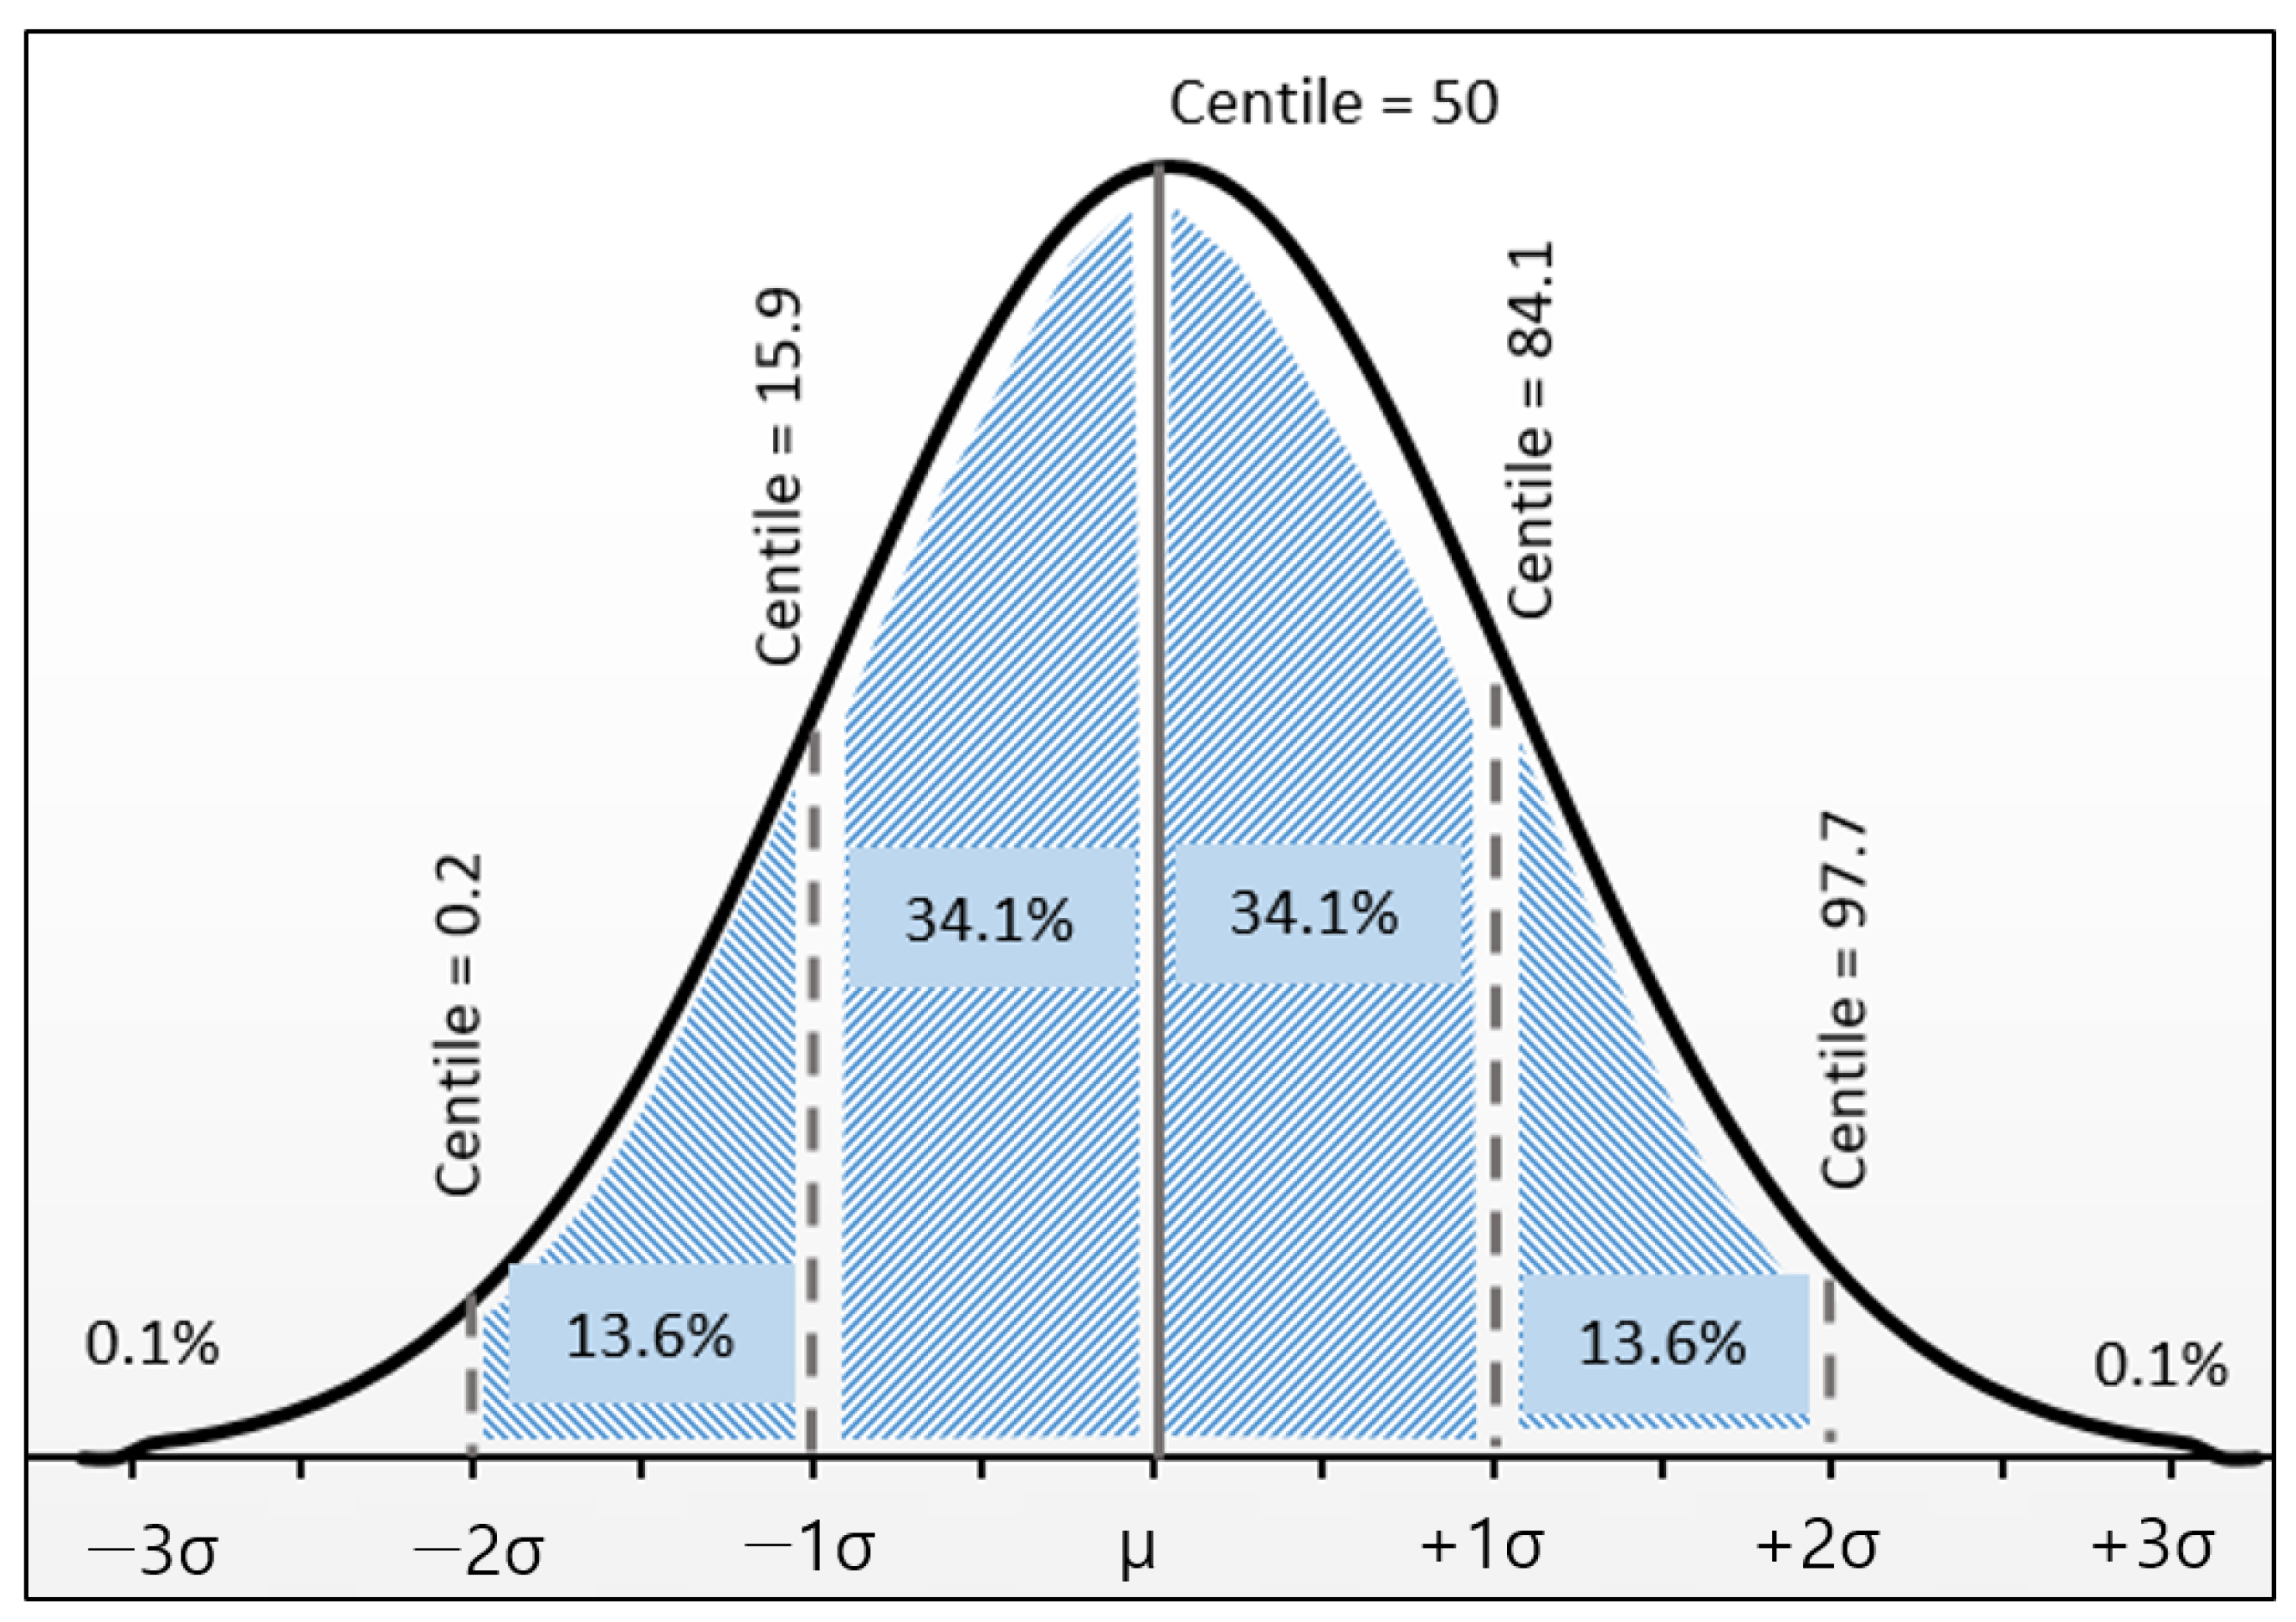
Figure 1. A normalized distribution of any climate variables with the standard deviation and corresponding percentiles.
Atmosphere 15 00116 g001
Figure 2. Global targets of Sendai Framework (Quoted from UNDRR [7]).
Atmosphere 15 00116 g002
Figure 3. Early warning service for weather risk management in the agricultural sector from the Rural Development Administration [11], which has been providing desktop web pages and mobile web services since 2020.
Atmosphere 15 00116 g003
Figure 4. Freezing risk represented by the percent of browning ratio in peach fruit branches across a range of daily minimum temperatures (Adapted from [22]).
Atmosphere 15 00116 g004
Figure 5. A linear graph showing damage-inducing temperatures associated with budburst, flowering, and post-flowering dates. These data were used to derive the actual risk index (Quoted from [14]).
Atmosphere 15 00116 g005
Figure 6. Overview of agrometeorological chronic damages.
Atmosphere 15 00116 g006
Figure 7. Spatial distribution in agricultural drought index (ADI). The relative degree of drought can be determined by comparing the residual moisture index with the distribution of a climatological normal year.
Atmosphere 15 00116 g007
Figure 8. Rainfall distribution maps projected by the Korea Local Analysis and Prediction System on the 5 km cell grids (left) and the radar-assisted topography and elevation revision scheme at 270 m grid cell resolution (right), respectively. The number and points (1–13) on the right of the figure are the validation points. (quoted from [40]).
Atmosphere 15 00116 g008
Figure 9. Flowchart of crop-specific weather risk assessments.
Atmosphere 15 00116 g009
Figure 10. Application of differentiation according to growth progress.
Atmosphere 15 00116 g010
Disclaimer/Publisher’s Note: The statements, opinions and data contained in all publications are solely those of the individual author(s) and contributor(s) and not of MDPI and/or the editor(s). MDPI and/or the editor(s) disclaim responsibility for any injury to people or property resulting from any ideas, methods, instructions or products referred to in the content.