Article

Evaluation of Multi-Source Precipitation Products in the Hinterland of the Tibetan Plateau

School of Geographical Sciences, Nanjing University of Information Science and Technology, 219 Ningliu Road, Nanjing 210044, China
*
Author to whom correspondence should be addressed.
Atmosphere 2024, 15(1), 138; https://doi.org/10.3390/atmos15010138
Submission received: 15 December 2023 / Revised: 7 January 2024 / Accepted: 18 January 2024 / Published: 22 January 2024
(This article belongs to the Topic Hydrology and Water Resources Management)

Abstract

:
High-resolution precipitation products have been crucial for hydrology, meteorology, and environmental ecosystems over the Tibetan Plateau (TP). However, these products are usually subject to systematic errors, which may vary with time and topographic conditions. The study evaluated the suitability of four satellite-derived products (GPM IMERG, GSMaP, CMORPH, and PERSIANN-CDR) and four fusion precipitation products (ERA5-Land, CHIRPS, CMFD, and TPHiPr) by comparing with 22 rain gauges at a daily scale from 1 January 2014 to 31 December 2018 over the hinterland of the TP. The main findings are as follows: (1) TPHiPr and CMFD are better than the satellite-derived products, while the performance of CHIRPS is worse; (2) among the satellite-derived products, the quality of GPM IMERG is the highest on different time scales, and PERSIANN-CDR is better in the months of June to October, while GSMaP and CMORPH have poor performance; (3) the eight precipitation products have weaker detection capability for heavy precipitation events, and the quality of each product decreases with the increase in the precipitation threshold, while the rate of descent of fusion precipitation products is slower than that of satellite-derived products. This study demonstrates the performance of eight precipitation products over the hinterland of the TP, which is expected to provide valuable information for hydrometeorology applications.

1. Introduction

Precipitation is a key component of the hydrological cycle. Precipitation is an important climate system indicator because the accuracy of precipitation data directly affects people’s productivity [1,2]. The Tibetan Plateau (TP) is known as the “third pole” of the earth, and its precipitation has a profound impact on global climate variation [3,4]. It is difficult to obtain a continuous spatial and temporal distribution of precipitation on the TP due to the sparsity of precipitation observation stations and the extreme scarcity of precipitation data. Therefore, it presents a huge challenge to the development of related research such as hydrology and water resources, disaster warning, and monitoring.
Currently, there is a fair amount of quasi-global and regional precipitation datasets, including gauge-based products, satellite-derived products, and reanalysis products, which have played an important role over the TP [5]. The datasets include satellite-derived products, such as the Tropical Rainfall Measurement Mission (TRMM) satellite, Integrated Multi-satellite Retrievals (IMERG) for Global Precipitation Measurement (GPM), Global Satellite Mapping of Precipitation (GSMaP), Climate Prediction Center Morphing Method (CMORPH), and Precipitation Estimation from Remotely Sensed Information using Artificial Neural Networks Climate Data Record (PERSIANN-CDR). Satellite-derived products provide uniform and continuous coverage [6], are less restricted by ground conditions, and thus compensate for the shortcomings of ground-based meteorological stations. However, there are obvious differences in detection accuracy and spatio-temporal applicability when estimating and inverting precipitation [7,8,9,10,11]. This is due to different detection principles and the influence of geographic environmental factors [12,13,14,15]. Therefore, satellite products must be validated against rain gauge data to better understand their capability for accurately reflecting the characteristics of precipitation.
Massive efforts have been made to evaluate precipitation products’ accuracy and uncertainty using rain gauges and gridded precipitation data at global, national, or regional scales during recent decades [6,7,11,16,17,18]. Validation in the China region showed that precipitation products and gauges had an overall agreement in the spatial distribution of mean precipitation. However, researchers had found that the performance of those will vary at different altitudes and seasons in western China [19,20,21]. Yan et al. [22] evaluated TRMM at station and basin scales in the Naqu River Basin of the Tibetan Plateau and found that TRMM was closer to the spatial distribution of actual precipitation, whereas Zhao and Yatagai [23] evaluated the accuracy of TRMM based on daily precipitation data by 756 rain gauges over China from 1998 to 2010 and found that TRMM underestimates the observed precipitation by 20~50% for most of western China. Lei et al. [21] compared the accuracy of six widely used precipitation products based on daily observations by 2372 rain gauges over mainland China from 2000 to 2017 and demonstrated that all products could reflect the spatial and temporal distribution of precipitation, and GSMaP exhibited the best performance. The study of the applicability of precipitation products in different regions showed that most of them could better reflect regional-scale spatial characteristics but had the phenomenon of overestimating light rain and underestimating heavy rain [18,24,25,26]. Their accuracy in summer was higher than that in winter [27]. In addition, their accuracy decreased with increasing altitude [28,29].
In addition to the revision of satellite-derived products, there are also numerous scholars who have evaluated grid data resulting from the reanalysis of meteorological data using observations, forecast models, and assimilation systems, such as the fifth-generation ECMWF atmospheric reanalysis (ERA5) and its downscaled version for land applications (ERA5-Land), the Climate Hazards Group InfraRed Precipitation with Station Data (CHIRPS), the China Meteorological Forcing Dataset (CMFD), and A Long-Term High-Resolution Precipitation Dataset for the Third Polar Region (TPHiPr). The ERA5-Land and ERA5 datasets well presented the spatial pattern of precipitation but generally overestimated precipitation [30,31]. Musie et al. [32] assessed the applicability of TRMM, PERSIANN-CDR, and CHIRPS and concluded that CHIRPS provided better precipitation estimates for use as input in hydrologic models in data-sparse regions. Liu et al. [18] found that the performance of CHIRPS on the monthly scale was better than that of GPM IMERG and GSMaP. Wen et al. [33] assessed the applicability of CRU, ERA5, and CMFD precipitation data for the TP on annual and seasonal scales and concluded that CMFD data have the best ability to simulate the distribution of annual, spring, summer, and winter precipitation on the Tibetan Plateau. A study to assess the applicability of satellite-derived products and fused precipitation products on the TP showed that there are differences in the accuracy of different types of products for the region at different scales. The accuracy of multi-source fused precipitation products was higher than that of satellite-derived products and performed better than satellite-derived products in winter and snow-covered areas [34,35]. However, due to the relatively recent release time, there was a lack of sufficient regional applicability studies, especially in mountainous areas with complex terrain.
The hinterland of the TP is located in the central part of the TP, traversed by the Tanggula Mountains, which is the confluence of the westerly wind and Indian Ocean monsoon. Rain gauges are quite limited, are situated in complex terrain and a harsh environment, and have an extremely uneven spatial distribution. Currently, few studies have been conducted to assess the accuracy of precipitation products in the hinterland of the TP, and the applicability of different precipitation products in this region is of great significance to the study of the spatial and temporal variability of the climate in the TP. In this study, we extensively evaluate four satellite-derived products (GPM IMERG, GSMaP, CMORPH, and PERSIANN-CDR) and four fusion precipitation products (ERA5-Land, CHIRPS, CMFD, and TPHiPr) by comparing them with 22 rain gauges at a daily scale from 1 January 2014 to 31 December 2018 over the hinterland of the TP. The objective is to assess the quality of eight precipitation products through various quantitative and classification indicators on a multi-scale. Moreover, the impact of altitude and precipitation intensity on the quality of precipitation products is explored. This study can provide reliable precipitation data for the hydrological application over the hinterland of the TP.

2. Materials and Methods

2.1. Study Area and Data

2.1.1. Study Area

The TP, which features the highest mean elevation and most complex terrain in the world, has a sensitive region experiencing rapid climate change and is the most unique ecosystem and geographical unit in the world [36]. As the origin of many rivers in China, it is relatively significant that the precipitation of the TP mainly originates from the westerly wind belt and the monsoon zone in the southeastern part of the TP [37,38]. The precipitation of the TP gradually decreases from the southeastern side to the area around the Qaidam Basin, which shows strong regional and seasonal variability under the interaction of the westerly wind and monsoon [28,37,39,40].
The hinterland of the TP is the intersection of two major circulation systems, with an elevation of over 4500 m, traversed by the Tanggula Mountains. There is an east–west north–south wind shear line near the Tanggula Mountains, which is an important symbol of the north–south boundary of the TP. The convergence of the north–south air flow causes different geographical conditions on the north and south sides, resulting in significant spatial and temporal differences in precipitation between the north and south. At the same time, the rainfall of it is influenced by a combination of the westerly wind and Indian Ocean monsoon. Uncertainties in the spatial and temporal variability of precipitation in the region are more pronounced because of complex topographic features, special weather, climate characteristics, variable circulation situation, and water vapor transport structure. Based on the distribution of observation stations, in this paper, we select the hinterland of the TP (Figure 1) with latitudes of 31° to 36° N and longitudes of 90° to 95° E as the study area. The terrain in the hinterland of the TP is very complex, which is mountain plateau climate and is composed of mountains, plain basins, and river valleys. Permafrost and perigla-permafrost exist in the south-central part, and periglacial and glacial landforms are interspersed with each other. In addition, the study area is characterized by many features, such as high average altitude, inconvenient transportation, and sparse sites. The spatial continuity of the data is poor, as the sites are concentrated in the central region and placed less in the surrounding area.

2.1.2. Data

  • Rain gauge data
In order to evaluate the accuracy of the precipitation products, 22 rain gauges (Table 1) are collected from the daily observation dataset published by the National Oceanic and Atmospheric Administration, a synthesis dataset of permafrost for the Qinghai–Xizang (Tibet) Plateau, China, (2002–2018) published by the National Tibetan Plateau Science Data Center (NTPSDC) [41], and hydrologic station data derived from the People’s Republic of China Hydrographic Yearbook (Figure 1a). The missing data of five integrated observation sites were interpolated by establishing the linear equations with the surrounding stations. The precipitation data were selected from 1 January 2014 to 31 December 2018 by comprehensive consideration of the time series of the three types of rain gauge data.
2.
Precipitation products
Precipitation data used in this study can be grouped into satellite-derived products and fusion precipitation products.
Satellite-derived data include four products. The Global Precision Measurement Mission (GPM) is an international satellite mission jointly carried out by the National Aeronautics and Space Administration (NASA) and the Japan Aerospace Exploration Agency (JAXA). It utilizes multi-sensor, multi-satellite, and multi-algorithm methods combined with satellite networks and rain gauges to obtain more accurate precipitation data. Integrated Multi-satellite Ratrievals (IMERG) is a tertiary product of GPM, which not only inherits the algorithms and detection techniques of TRMM but also greatly improves the monitoring capability and spatio-temporal resolution [42]. The Global Satellite Mapping of Precipitation (GSMaP) is based on the research heritage of using satellite data to produce high-precision and high-resolution global precipitation maps. The research was sponsored by the Evolutionary Science and Technology Core Research (CREST) of the Japan Agency for the Promotion of Science and Technology (JST) between 2002 and 2007. Since 2007, the development of GSMaP has been driven by the Precipitation Measurement Mission (PMM) scientific group of the Japan Aerospace Exploration Agency [43]. The Climate Prediction Center Morphing Method (CMORPH) is a global high-spatio-temporal resolution precipitation dataset developed by the Climate Prediction Center (CPC) of the United States based on various microwave precipitation data and infrared data [6]. It is suitable for studying precipitation and its spatio-temporal changes from mesoscale to interannual ranges. Precipitation Estimation from Remotely Sensed Information using Artificial Neural Networks Climate Data Record (PERSIANN-CDR) is a multi-satellite rainfall dataset extracted using artificial neural network algorithms which estimates precipitation based on GridSat-B1 infrared satellite data [44]. It is developed by the Center for Hydrologic Sciences at the University of California, Irvine (CHRS). PERSIANN-CDR is a climate data record defined by the National Research Council (NRC) as a time series of measurement data with sufficient length, consistency, and continuity to determine climate change.
Meanwhile, fusion precipitation data include four products. ERA5-Land is based on the atmospheric variables of the land field simulated by the fifth-generation reanalysis product ERA5 as forcing to simulate using modified land hydrological models HTESSEL and CY45R1 [45]. These reanalysis data provide many meteorological elements, including 50 meteorological elements such as temperature, relative humidity, dew point temperature, and wind field. Climate Hazards Group InfraRed Precipitation with Station Data (CHIRPS) is a quasi-global precipitation dataset covering 30 years by the Center for Earth Resources Observation and Climate Disasters, USGS [32]. CHIRPS combines 0.25° resolution satellite images and in situ station data to form a grid-based rainfall time series for trend analysis and seasonal drought monitoring [46,47,48,49,50,51]. The China Meteorological Forcing Dataset (CMFD) was produced by integrating the routine meteorological observation data of the China Meteorological Administration (CMA) using the Princeton reanalysis data, the GLDAS data, GEWEX-SRB radiometric data, and TRMM precipitation data as the background field [52]. A Long-Term High-Resolution Precipitation Dataset for the Third Polar Region (TPHiPr) was obtained by downscaling the ERA5 precipitation data using a machine-learning approach based on simulations and fusing the observations over 9000 rain gauges [53].
Precipitation products and observed rainfall data are available for different periods (Table 2). Hence, the overlapping period 2014–2018 is selected for the current work.

2.2. Methods

In this study, the nearest-neighbor algorithm is used by selecting the raster precipitation data that are closest to the ground station as the corresponding precipitation value for the station. If multiple grids have the same distance from the station, the average of multiple grids will be used as the corresponding precipitation product value for the station. According to Yim et al.’s [54] utilization of climatological annual cycle of precipitation rate, it was found that the precipitation rate was above average from May to October. Thus, we consider May to October as the wet season and November to April of the following year as the dry season.
For a comprehensive description of accuracy characteristics of precipitation products, quantitative indicators and classification indicators are adopted in daily, monthly, wet, and dry seasonal scales. The quantitative indicators include Pearson correlation coefficient (CC) and root mean square error (RMSE), which can show the consistency of quantity between the precipitation products and observations. The classification indicators include precision (PC), probability of detection (POD), false alarm ratio (FAR), and critical success index (CSI), which can reflect the detection capability of precipitation products to capture precipitation events. The following formulas are used to calculate the metrics (Table 3). According to the standard of the Chinese Meteorological Administration, we set 0.1 mm/d as a threshold to differentiate precipitation from non-precipitation events [55].
In order to reflect the performance of the precipitation products in different precipitation intensities, in this study, the daily precipitation is classified into five categories [16]: <0.1 mm/d (non-precipitation), 0.1–1 mm/d (tiny precipitation), 1–5 mm/d (light precipitation), 5–10 mm/d (moderate precipitation), and >10 mm/d (heavy precipitation). The classification indicators of precipitation products for each precipitation intensity are calculated and compared.
Based on the above six evaluation indexes, the accuracy of the precipitation product is ranked by using the Brunke’s comprehensive rank ranking method [56,57]. The higher the values of CC, PC, POD, and CSI, the higher the ranking, while the smaller the values of RMSE and FAR, the higher the ranking. The comprehensive ranking formula is as follows:
B r = 1 1 1 × m × n i = 1 n r a n k i
where m , n denote the number of evaluation indicators and precipitation products, respectively. r a n k i indicates the ranking of precipitation products under different evaluating indicators.

3. Results

3.1. The Precision Evaluation of Daily Precipitation

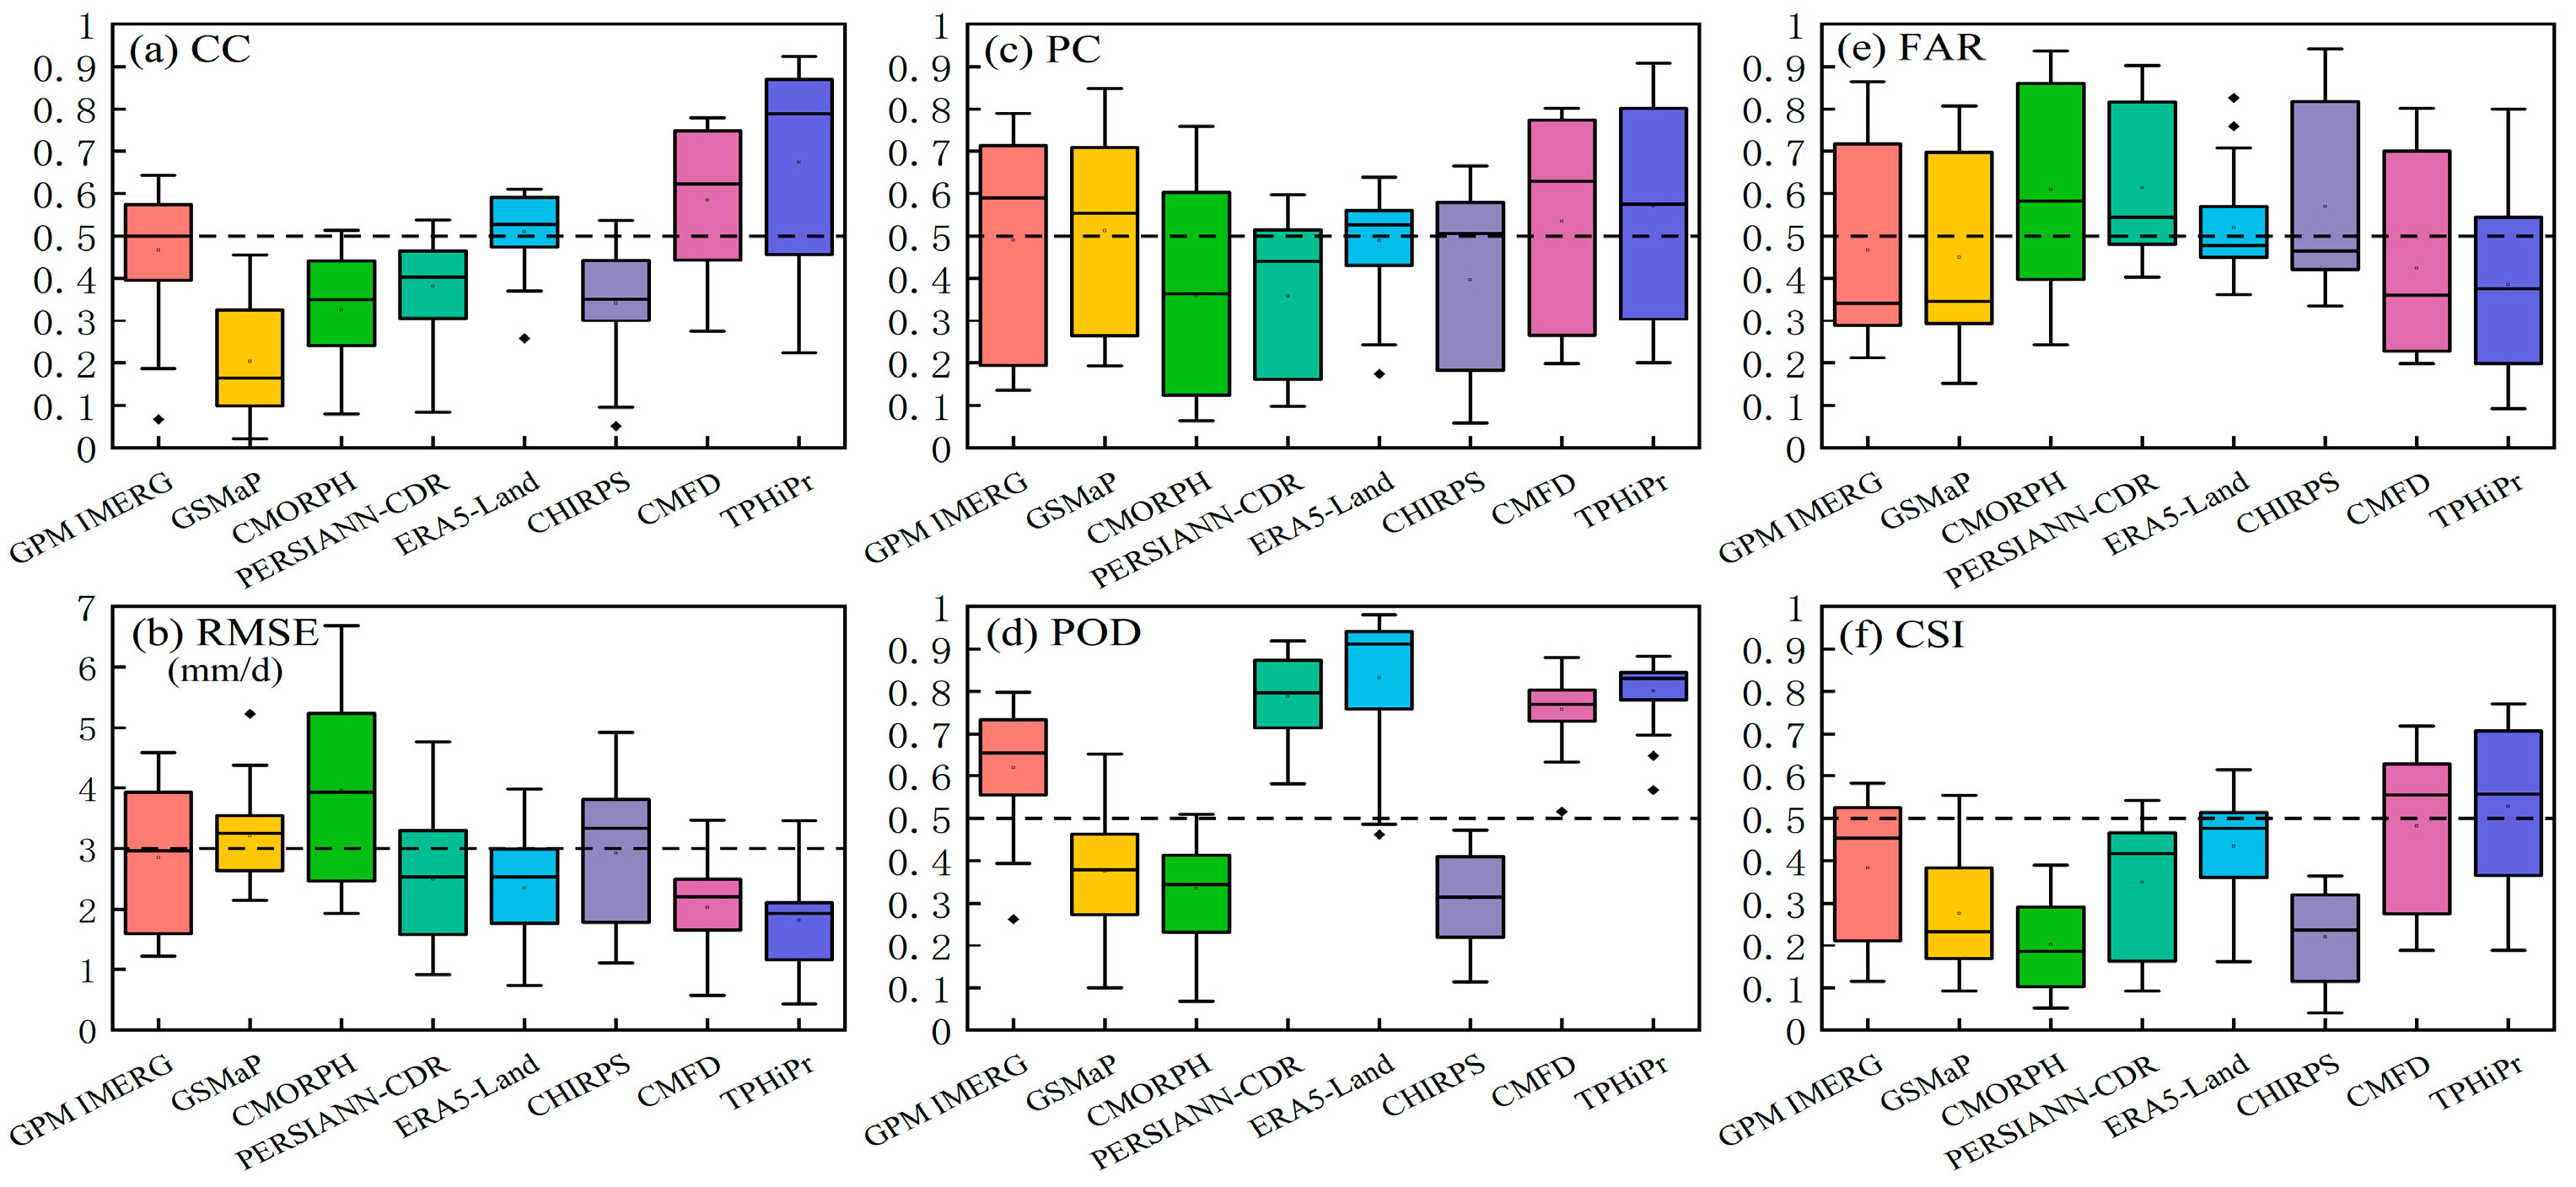
3.1.1. The Performance of Daily Scale

In terms of quantitative indicators (Figure 2a,b and Figure 3), among the fused precipitation products, the median CC values of TPHiPr, CMFD, and ERA5-Land are all above 0.5. The RMSE values of TPHiPr and CMFD are lower, which indicates that their prediction of daily precipitation is more accurate. The overall CHIRPS’s CC values are the lowest, with low CC values predominantly appear in the northeast, while its RMSE values are the largest and show a decreasing trend from southeast to northwest. In the satellite-derived products, GPM IMERG has the best overall correlation with observation sites, followed by PERSIANN-CDR. The performance of GSMap and CMORPH is similar, among which GSMaP has the worst correlation with observation stations.
In terms of classification indicators (Figure 2c–f and Figure 3), among the fused precipitation products, TPHiPr and CMFD were the best, with high PC, high POD, high CSI, and low FAR, while the POD values of 90% of the stations were between 0.6 to 1.0. ERA5-Land had the highest POD, but it had a lower PC value, smaller spatial differences, and larger overall errors. CHIRPS had lower PC, lower POD, lower CSI, and higher FAR so it performed the worst. In the satellite-derived products, GPM IMERG performed best, which may be related to its dual-frequency precipitation radar (DPR) and GPM Microwave Imager (GMI) [42]. PERSIANN-CDR and CMORPH have larger errors and similar spatial distribution characteristics, while CMORPH performed worst.

3.1.2. The Performance of Different Precipitation Intensities

In order to further refine the performance of each precipitation product in different precipitation intensities, 0.5, 1, 2, 5, 10, 15, and 20 mm/d are selected as the precipitation threshold to calculate the PC, POD, FAR, and CSI.
It can be seen from the change chart of precipitation product classification indicators at different thresholds (Figure 4) that the PC, POD, and CSI all show a downward trend when the precipitation threshold increases. Meanwhile, the rate of FAR shows an upward trend. When the precipitation threshold exceeds 2 mm/d, the PC, POD, and CSI of most precipitation products decline steeply, and their FAR increases at a larger rate. This phenomenon indicates that these precipitation products have good detection capabilities for weak precipitation events, while they have poor detection abilities for moderate precipitation and heavy precipitation events.
Among the fused precipitation products, TPHiPr and CMFD have integrated the routine meteorological observation data of the China Meteorological Administration, so their performance capabilities are better than other products in four indicators under different thresholds. After the threshold of ERA5-Land detection rate exceeds 15 mm/d, there is a decline in both POD and FAR values. This decline is accompanied by an increase in PC value. CHRIPS performs poorly overall and shows a change pattern of first increasing and then decreasing, in which the highest POD value appears at the threshold of 5 mm/d. In the satellite-derived products, GPM IMERG has the best overall performance, and its curve changes are similar to those of fused precipitation products. PERSIANN-CDR and GSMaP have relatively consistent performances, among which the POD value of PERSIANN-CDR decreases significantly as the precipitation threshold increases. This shows that its detection ability for moderate precipitation and heavy precipitation events is poor. CMORPH has the worst overall detection ability.

3.2. The Precision Evaluation of Monthly Precipitation

Among the fused precipitation products (Figure 5), TPHiPr has the best ability for estimating and capturing precipitation, with the highest CC and CSI and the lowest RMSE in all seasons. However, its FAR in winter is higher than CMFD, and its POD is lower than ERA5-Land. For CMFD, its overall performance is relatively moderate, worse than TPHiPr. Nevertheless, CMFD’s PC in winter is better than TPHiPr. ERA5-Land has the highest POD in all seasons due to the non-zero values exhibited by ERA5-Land [32,45], which may explain the significantly higher POD and FAR values of ERA5-Land. Regarding CHIRPS, it performs badly in all seasons and the change of its POD is different from other products. Meanwhile, CHIRPS’s performance is worse than satellite-derived products from May to October and better than satellite-derived products from January to April and November to December. This indicates that the precipitation detection ability of CHIRPS in winter is relatively good, due to an advantage of IR that could better detect information during the cold season.
From the satellite-derived products (Figure 5), their overall performance is poor, but the performance of mostly satellite-derived products from May to October is better than other months. GPM IMERG and PERSIANN-CDR have the higher capability for estimating and accurately capturing precipitation. PERSIANN-CDR has the highest POD in all seasons due to an advantage of IR that could better detect information, but PERSIANN-CDR’s FAR is higher. In addition, the general quality of GSMaP and CMORPH are worse; the reason is that GSMaP and CMORPH use passive microwaves to estimate precipitation, while IR is used only to create cloud motion vectors. Ice and snow are easily misclassified for clouds by PMW [22].

3.3. The Precision Evaluation of Wet and Dry Seasonal Precipitation

Figure 6 shows that the performance of most precipitation products in the wet season is higher than that in the dry season.
TPHiPr and CMFD have higher CC and CSI and lower RMSE in the wet and dry seasonal precipitation. Although ERA5-Land has the highest POD, its FAR is high. Meanwhile, CHIRPS’s performance is the worst, but its POD in the wet season is lower than that in the dry season, indicating that the precipitation detection ability of CHIRPS in the dry season is relatively good. PERSIANN-CDR and GPM IMERG have the good capability of precipitation estimate and capture in the dry and wet seasons. GSMaP has poor performance with a CC value below 0.1. In addition, the general quality of CMORPH is the worst, with a CC value close to 0 during the dry season due to mainly solid precipitation during this period.

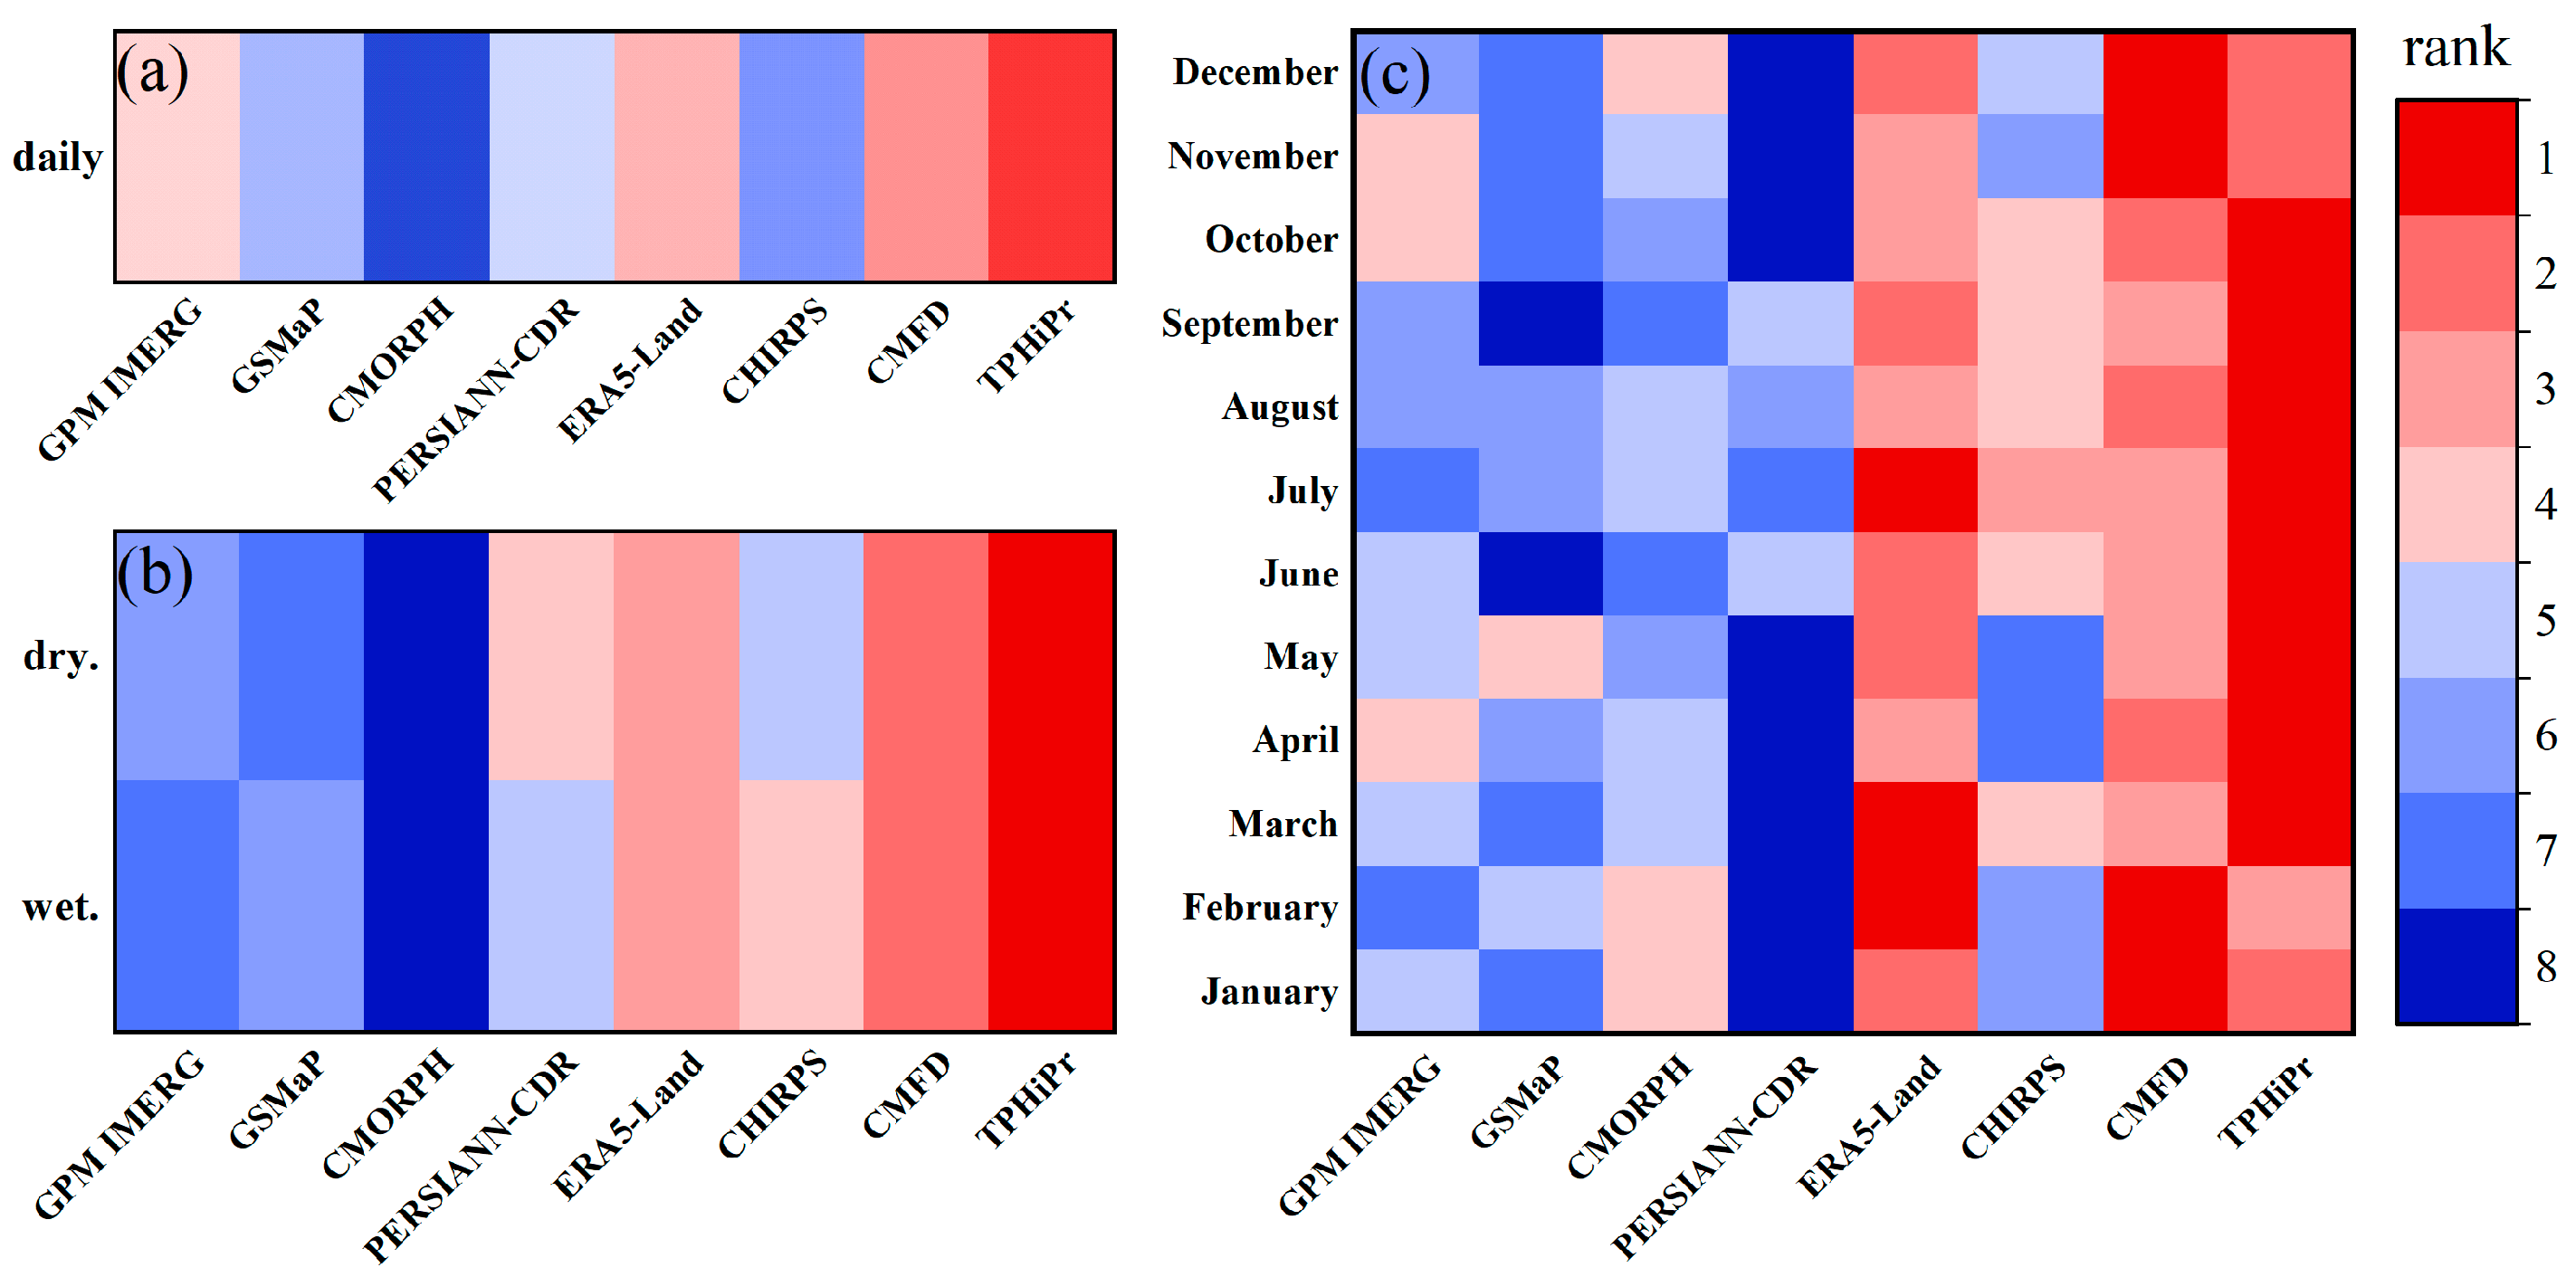
3.4. The Ranking of Applicability

Brunke’s comprehensive ranking method is used to rank the different precipitation products (Figure 7). From a horizontal perspective, most fused precipitation products (except CHIRPS) perform better than satellite-derived products, which may be due to the poor retrieval capabilities of satellites for trace precipitation and heavy precipitation. From a vertical perspective, the rankings are not significantly different, indicating that precipitation products perform similarly at different time scales.
At the daily scale, TPHiPr ranks first, while CMFD, ERA5-Land, and GPM IMERG have better applicability. GSMaP, PERSIANN-CDR, and CHRIPS have poor applicability. CMORPH has the worst applicability. At the monthly scale, TPHiPr, CMFD, and ERA5-Land are all ranked in the top three. Among them, TPHiPr’s applicability rankings are all first from March to November. The applicability performance of GPM IMERG and CMORPH in each month is close to each other, while GSMaP and CHRIPS have poor applicability. PERSIANN-CDR has the worst applicability from January to May and October to December. In the dry and wet seasonal scale, TPHiPr, CMFD, and ERA5-Land were listed, respectively, in the top three. CHRIPS is not as suitable as PERSIANN-CDR in the dry season, but its applicability in the wet season is better than PERSIANN-CDR. GPM IMERG is better than PERSIANN-CDR in the dry season, but its applicability in the wet season is not as good as GSMaP. In addition, CMORPH has the worst performance in the dry and wet seasons, ranking eighth in both comprehensive grades.

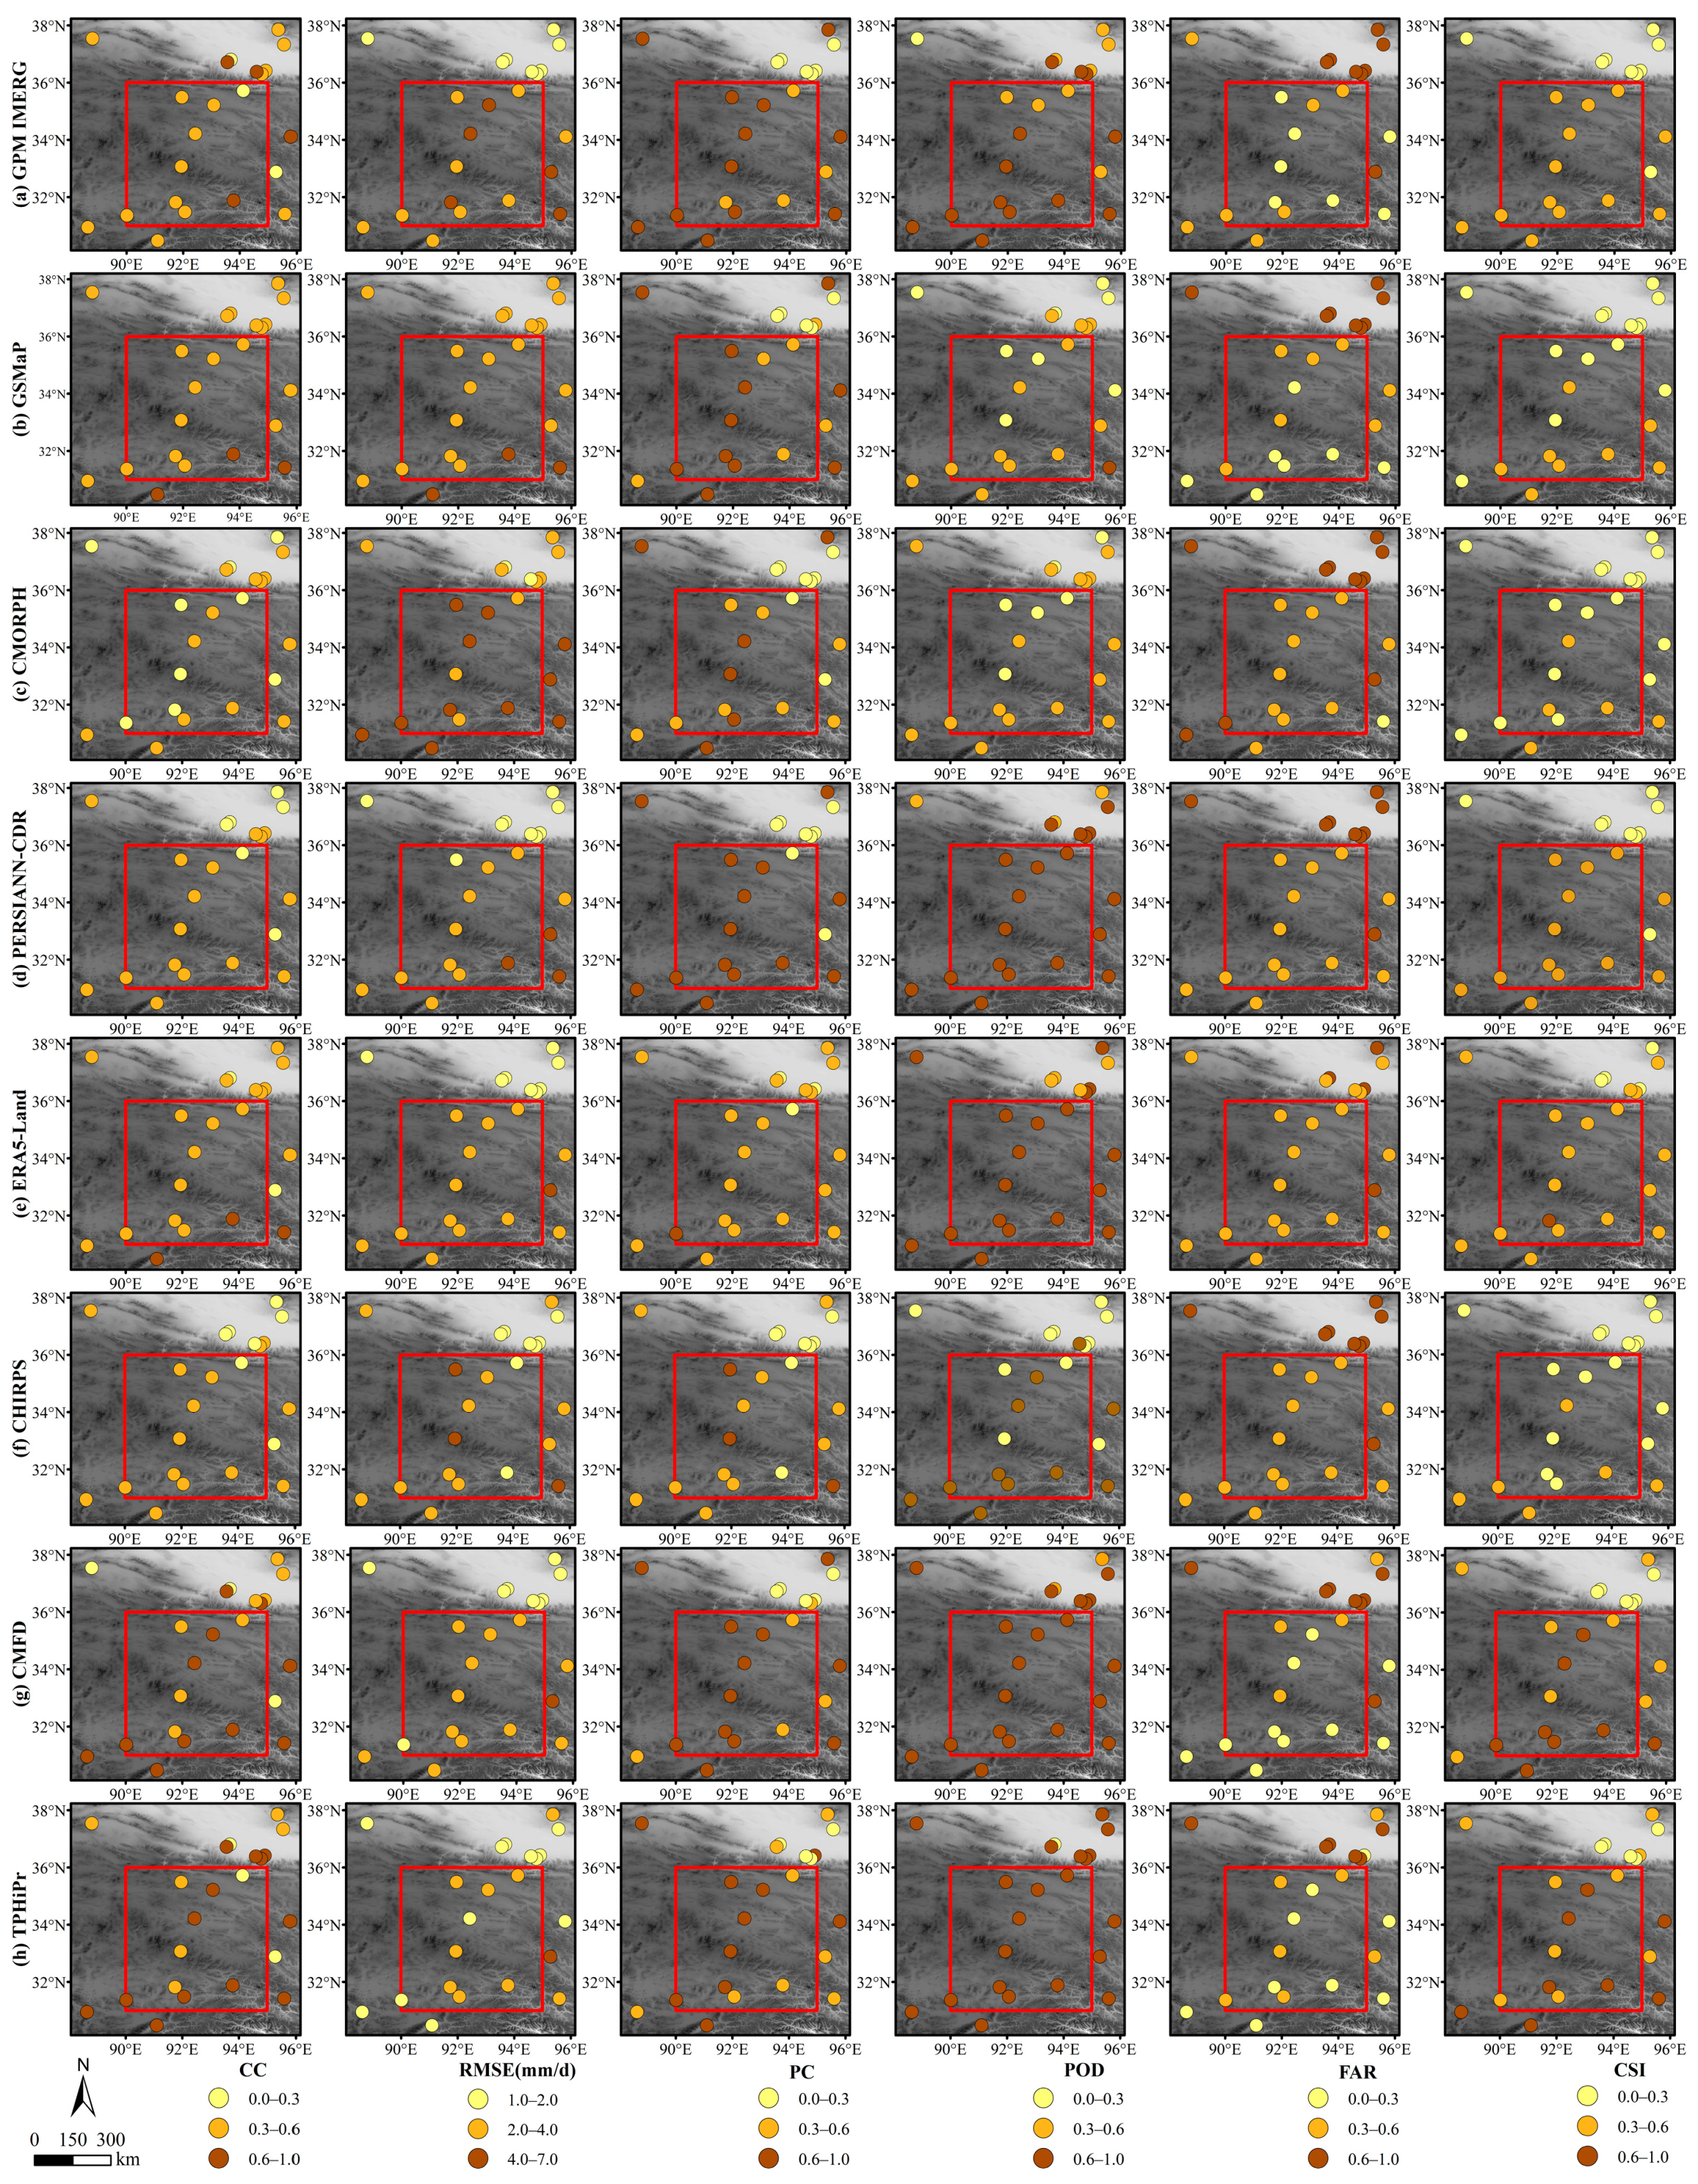
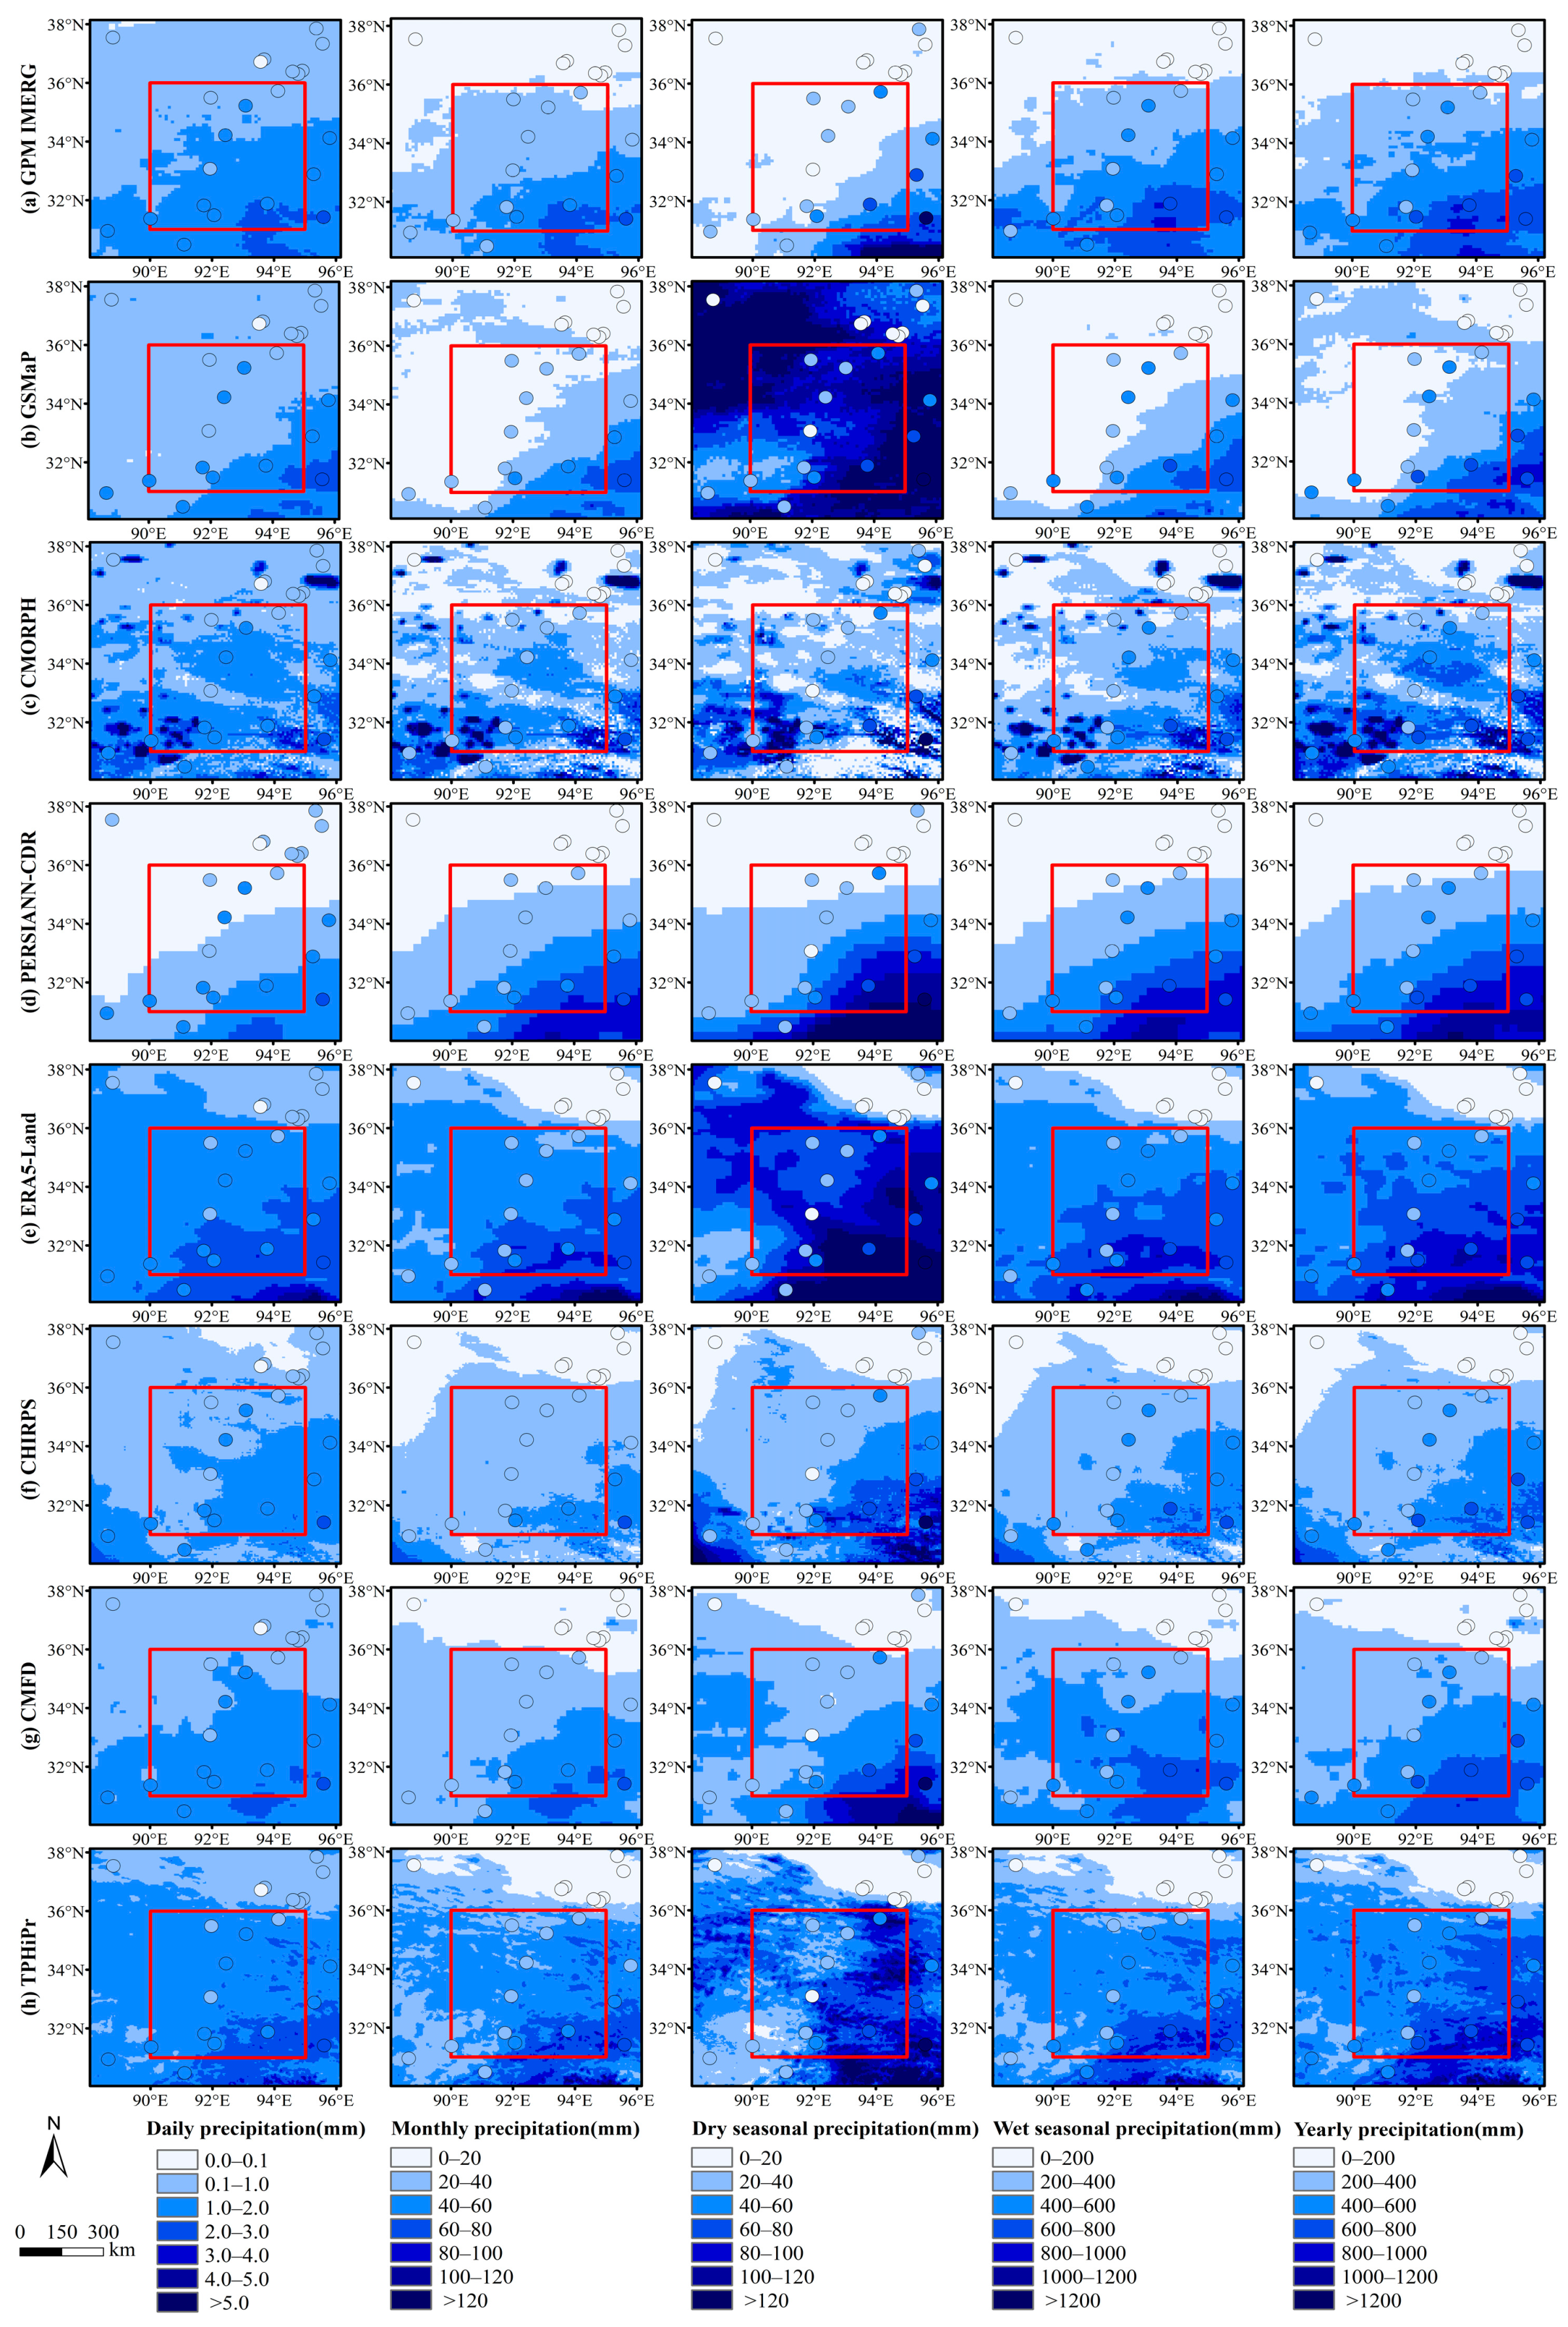
3.5. The Performance of Spatial Distribution of Precipitation Products

The spatial distribution of the eight products is similar to that of the rain gauges on the whole (Figure 8), all decreasing from the southeast to the northwest, but the local difference are large.
From the perspective of precipitation values, there are differences among different products. The precipitation inversion results are close for the northern region of the study area, while there are significant differences in the central region. ERA5-Land has the highest precipitation, followed by TPHiPr and GPM IMERG, while CHIRPS has the lowest precipitation. The resolution of CMORPH is relatively high, but there are obvious regional precipitation calculation errors, mainly in the northeast and southwest. PERSIANN-CDR is relatively low, and the overall trend is decreasing from southeast to northwest, but it has relatively poor performance. The precipitation magnitude of TPHiPr and CMFD is consistent across different periods. The spatial distribution characteristics of CMFD and GPM IMERG are consistent, but the precipitation magnitude of GPM IMERG is relatively high. The spatial distribution characteristics of TPHiPr and ERA5-Land are consistent, but TPHiPr better reflects precipitation details. In addition, GSMaP has higher precipitation during the dry season and has lower precipitation during the wet season.

4. Discussion

4.1. Error Characteristics and Error-Source Analysis of the Precipitation Products

The evaluation results (Table 4) show that from the fused precipitation products, ERA5-Land slightly outperforms the others in terms of the value of POD, whereas TPHiPr has better performance considering the quantitative indicators and classification indicators. This phenomenon may be attributable to the fact that ERA5-Land is a downscaled dataset produced through a single simulation driven by near-surface atmospheric fields from ERA5, with thermo-dynamical orographic adjustment of temperature [31,45]. TPHiPr has been calibrated by gridded ground truth over mainland China, based on the improved WRF model, combined the results of this simulation with a machine-learning approach to downscale the ERA5 precipitation data [55]. The deviation between CMFD and the observed annual and seasonal precipitation in the Tibetan Plateau is relatively small [33]. Jiang et al. [53] found that TPHiPr can better reflect actual precipitation conditions, its CC value was 0.84, and the CSI was 0.67. The evaluation of CMFD and TPHiPr needs to be discussed due to their integration with meteorological stations over mainland China. From satellite-derived products, the different sources of ground-based calibration datasets and different inversion algorithms of GPM IMERG, GSMaP, CMORPH, and PERSIANN-CDR may be the critical reason for the difference in accuracy between the four precipitation products [6,58]. GPM IMERG had the phenomenon of overestimating light rain and underestimating heavy rain [25,59]. Quan et al. [60] analyzed a case of hourly intensity precipitation in the Three Rivers Source Area and found that GPM IMERG had serious misjudgments or underestimations of short-time heavy precipitation. They perform worse than fusion precipitation products. Therefore, the satellite remote-sensing precipitation sensor and its inversion algorithm itself still need further improvement. In addition, the high POD value indicates that ERA5-Land and PERSIANN -CDR are better at detecting precipitation, but it is important to note that POD values alone cannot be used to determine which precipitation product is superior. It may also be helpful to look at other evaluation metrics such as CC, RMSE, PC, and CSI to get a more comprehensive understanding of the performance of each product.

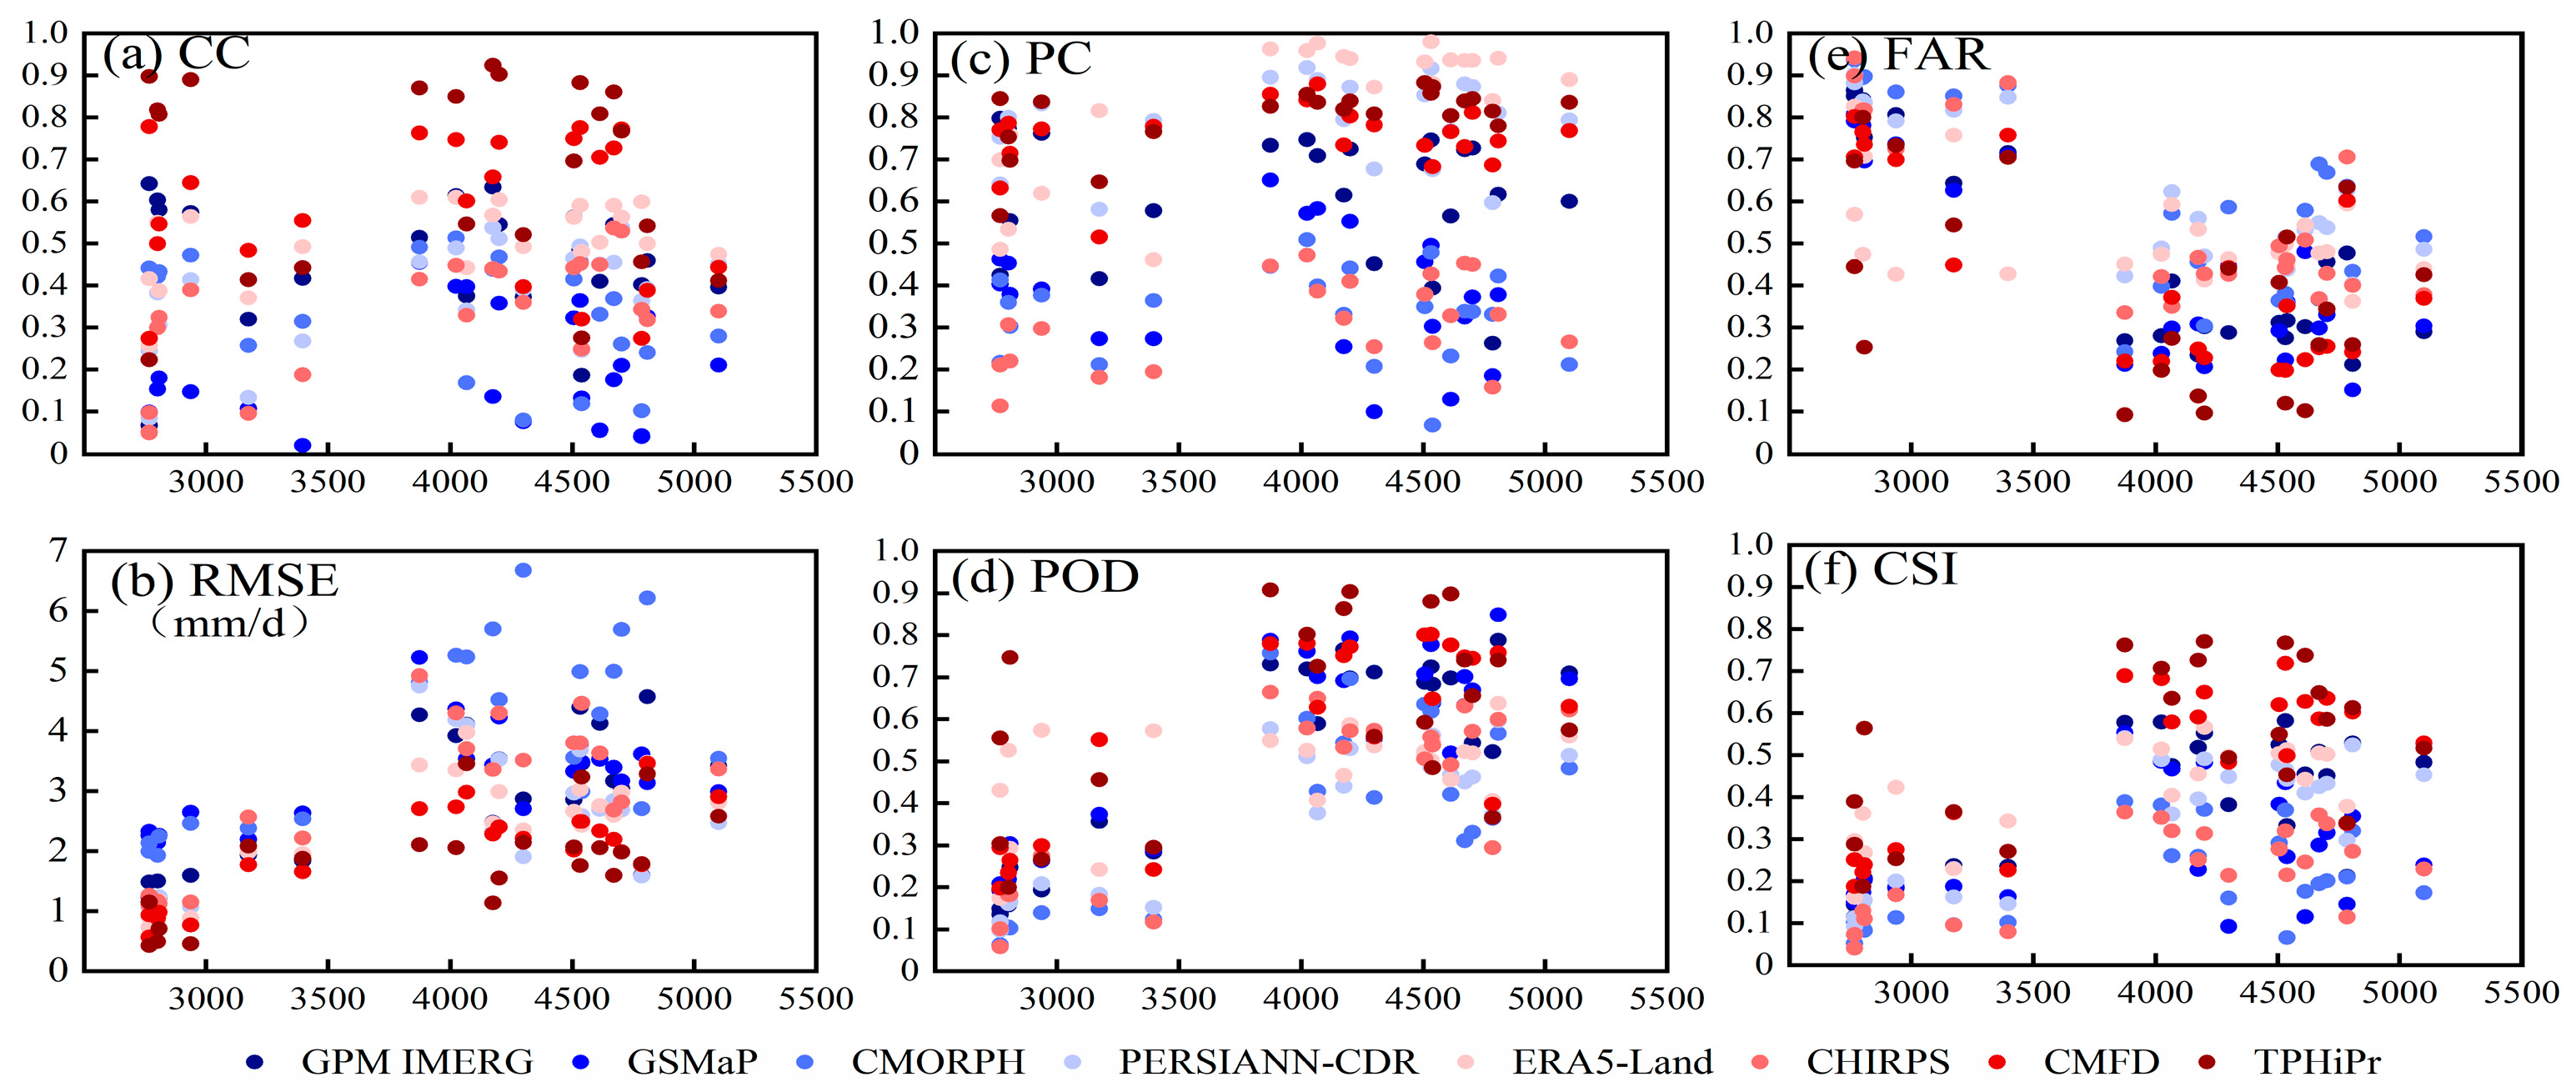
4.2. The Characteristics of Precipitation Products Changing with Elevation

Due to the complex terrain of the hinterland of the TP, precipitation is greatly affected by elevation [20,29,61]. Therefore, accuracy evaluation is conducted on the variation of different satellite precipitation products with elevation. The overall performance of fused precipitation products is better than that of satellite-derived products (Figure 9). When the elevation increases, the CC and PC of eight satellite precipitation products do not show significant changes; the POD and CSI of those products both exhibit an upward trend, while the RMSE also shows a similar upward trend. However, the FAR of those products displays a downward trend. Further, the relationship between altitude and the accuracy of precipitation products is explored, while dividing the stations into three elevation ranges (Figure 10). There are significant differences in the accuracy of eight satellite precipitation products at different elevation ranges. The CC, RMSE, PC, POD, and CSI of those have significant differences, but the FAR of three elevation ranges has no significant differences. Overall, the accuracy of high-elevation areas is higher than that of low-elevation areas. The spatial distribution of stations in the study area is uneven, mostly located in the central, southeastern, and basin areas. The elevation (above 4500 m) of stations is mostly located on the southwest–northeast line of the study area. Therefore, there are certain limitations in studying the patterns of precipitation products and the change of elevation within the study area. In addition, snowfall is the main form of precipitation in the TP; however, such an assessment was not fulfilled due to the lack of snowfall observation stations, which is a task that warrants investigation and inclusion in future research.

5. Conclusions

Observation stations provide relatively accurate and credible single-point precipitation measurements but are heterogeneous in spatial distribution and precipitation observations and are biased by the influence of instrumental and environmental factors. Remotely sensed precipitation products provide large-scale coverage of precipitation data and homogeneous spatial coverage of precipitation data but are affected by sensors, cloud physical characteristics, and less-than-optimal accuracy in the inversion process. The main means of obtaining continuous precipitation in space are to combine stations and precipitation products. Therefore, it is crucial to evaluate precipitation products. Taking the hinterland of the TP as the research area, based on observation stations, a variety of quantitative indicators and classification indicators are used to construct a precipitation product accuracy evaluation index system. Four satellite-derived products and four fusion precipitation products are evaluated for accuracy on daily, monthly, wet, and dry seasonal scales. The accuracy characteristics of the eight precipitation products from 2014 to 2018 were comprehensively analyzed. The following main conclusions are drawn:
From the perspective of fused precipitation products, TPHiPr has the highest applicability in the hinterland of the TP at different time scales, while CMFD has a higher judgment quality on precipitation events in winter. ERA5-Land has relatively stable applicability at different time scales, and it has high detection capability. But the overall performance of CHIRPS is poor and not easily affected by timescale.
From the perspective of satellite-derived products, GPM IMERG has the highest quality at different time scales, while PERSIANN-CDR has better applicability from June to October. In addition, GSMaP and CMORPH have poor applicability.
Under different precipitation thresholds, there are similarities and differences in the detection capabilities of eight precipitation products for precipitation events. As the threshold increases, the quality of each precipitation product decreases, and the decline rate of the fused precipitation product is smaller than that of the satellite inversion product. Meanwhile, both have better detection capabilities for weak precipitation events. ERA5-Land has better detection capabilities for heavy precipitation events than moderate precipitation events.
The applicability evaluation of eight precipitation products in this study lays the foundation for subsequent precipitation correction, whose method combines reanalysis data and remote-sensing precipitation products with ground station data.

Author Contributions

Conceptualization, M.S. and A.L.; data curation, M.S.; funding acquisition, L.Z.; methodology, M.S.; project administration, A.L., L.Z. and C.W.; software, M.S. and Y.Y.; validation, A.L.; visualization, M.S.; writing—original draft, M.S.; writing—review and editing, A.L., L.Z., C.W. and Y.Y. All authors have read and agreed to the published version of the manuscript.

Funding

This research was funded by the Second Tibetan Plateau Scientific Expedition and Research (STEP) program, grant number 2019QZKK0201.

Institutional Review Board Statement

Not applicable.

Informed Consent Statement

Not applicable.

Data Availability Statement

Publicly available datasets were analyzed in this study. The precipitation datasets used in our work can be freely accessed at the following websites: GPM IMERG: https://disc.gsfc.nasa.gov/datasets/GPM_3IMERGHH_06/summary (accessed on 12 October 2022); GSMaP:https://sharaku.eorc.jaxa.jp/GSMaP/index.htm (accessed on 11 November 2022); CMORPH: https://www.ncei.noaa.gov/products/climate-data-records/precipitation-cmorph (accessed on 20 October 2022); PERSIANN-CDR: http://chrsdata.eng.uci.edu/climate-data/ (accessed on 3 November 2022); ERA5-Land: https://cds.climate.copernicus.eu/ (accessed on 3 December 2022); CHIRPS: https://www.chc.ucsb.edu/data/chirps (accessed on 13 December 2022); CMFD: https://data.tpdc.ac.cn/en/data/8028b944-daaa-4511-8769-965612652c49 (accessed on 23 November 2022); TPHiPr: https://data.tpdc.ac.cn/zh-hans/data/e45be858-bcb2-4fea-bd10-5c2662cb34a5 (accessed on 20 December 2022).

Acknowledgments

The authors thank the researchers and their teams for all of the datasets used in this study. We also thank the anonymous reviewers for their valuable comments to improve the quality of the paper.

Conflicts of Interest

The authors declare no conflicts of interest.

References

  1. Lobell, D.B.; Burke, M.B. Why are agricultural impacts of climate change so uncertain? The importance of temperature relative to precipitation. Environ. Res. Lett. 2008, 3, 034007. [Google Scholar] [CrossRef]
  2. Meynecke, J.-O.; Lee, S.Y.; Duke, N.C.; Warnken, J. Effect of rainfall as a component of climate change on estuarine fish production in Queensland, Australia. Estuar. Coast. Shelf Sci. 2006, 69, 491–504. [Google Scholar] [CrossRef]
  3. Latif, A.; Ilyas, S.; Zhang, Y.; Xin, Y.; Zhou, L.; Zhou, Q. Review on global change status and its impacts on the Tibetan Plateau environment. J. Plant Ecol. 2019, 12, 917–930. [Google Scholar] [CrossRef]
  4. Madsen, D.B. Conceptualizing the Tibetan Plateau: Environmental constraints on the peopling of the “Third Pole”. Archaeol. Res. Asia 2016, 5, 24–32. [Google Scholar] [CrossRef]
  5. Saemian, P.; Hosseini-Moghari, S.-M.; Fatehi, I.; Shoarinezhad, V.; Modiri, E.; Tourian, M.J.; Tang, Q.; Nowak, W.; Bárdossy, A.; Sneeuw, N. Comprehensive evaluation of precipitation datasets over Iran. J. Hydrol. 2021, 603, 127054. [Google Scholar] [CrossRef]
  6. Hussain, Y.; Satgé, F.; Hussain, M.B.; Martinez-Carvajal, H.; Bonnet, M.-P.; Cárdenas-Soto, M.; Roig, H.L.; Akhter, G. Performance of CMORPH, TMPA, and PERSIANN rainfall datasets over plain, mountainous, and glacial regions of Pakistan. Theor. Appl. Climatol. 2017, 131, 1119–1132. [Google Scholar] [CrossRef]
  7. Shen, Y.; Xiong, A.; Wang, Y.; Xie, P. Performance of high-resolution satellite precipitation products over China. J. Geophys. Res. Atmos. 2010, 115, D02114. [Google Scholar] [CrossRef]
  8. Castro, L.M.; Miranda, M.; Fernández, B. Evaluation of TRMM multi-satellite precipitation analysis (TMPA) in a mountainous region of the central Andes range with a Mediterranean climate. Hydrol. Res. 2015, 46, 89–105. [Google Scholar] [CrossRef]
  9. Chen, R.; Liu, J.; Kang, E.; Yang, Y.; Han, C.; Liu, Z.; Song, Y.; Qing, W.; Zhu, P. Precipitation measurement intercomparison in the Qilian Mountains, north-eastern Tibetan Plateau. Cryosphere 2015, 9, 1995–2008. [Google Scholar] [CrossRef]
  10. Chen, J.; Wang, Z.; Wu, X.; Chen, X.; Lai, C.; Zeng, Z.; Li, J. Accuracy evaluation of GPM multi-satellite precipitation products in the hydrological application over alpine and gorge regions with sparse rain gauge network. Hydrol. Res. 2019, 50, 1710–1729. [Google Scholar] [CrossRef]
  11. Gu, P.; Wang, G.; Liu, G.; Wu, Y.; Liu, H.; Jiang, X.; Liu, T. Evaluation of multisource precipitation input for hydrological modeling in an Alpine basin: A case study from the Yellow River Source Region (China). Hydrol. Res. 2022, 53, 314–335. [Google Scholar] [CrossRef]
  12. Huffman, G.J.; Bolvin, D.T.; Braithwaite, D.; Hsu, K.L.; Joyce, R.J.; Kidd, C.; Nelkin, E.J.; Sorooshian, S.; Stocker, E.F.; Tan, J.; et al. Integrated multi-satellite retrievals for the global precipitation measurement (GPM) mission (IMERG). In Satellite Precipitation Measurement; Springer: Cham, Switzerland, 2020; Volume 1, pp. 343–353. [Google Scholar]
  13. Yang, M.; Liu, G.; Chen, T.; Chen, Y.; Xia, C. Evaluation of GPM IMERG precipitation products with the point rain gauge records over Sichuan, China. Atmos. Res. 2020, 246, 105101. [Google Scholar] [CrossRef]
  14. Wei, L.; Jiang, S.; Ren, L.; Wang, M.; Zhang, L.; Liu, Y.; Yuan, F.; Yang, X. Evaluation of seventeen satellite-, reanalysis-, and gauge-based precipitation products for drought monitoring across mainland China. Atmos. Res. 2021, 263, 105813. [Google Scholar] [CrossRef]
  15. Valencia, S.; Marín, D.E.; Gómez, D.; Hoyos, N.; Salazar, J.F.; Villegas, J.C. Spatio-temporal assessment of Gridded precipitation products across topographic and climatic gradients in Colombia. Atmos. Res. 2023, 285, 106643. [Google Scholar] [CrossRef]
  16. Wu, L.; Zhai, P. Validation of daily precipitation from two high-resolution satellite precipitation datasets over the Tibetan Plateau and the regions to its east. Acta Meteorol. Sin. 2012, 26, 735–745. [Google Scholar] [CrossRef]
  17. Mianabadi, A. Evaluation of long-term satellite-based precipitation products for developing intensity-frequency (IF) curves of daily precipitation. Atmos. Res. 2023, 286, 106667. [Google Scholar] [CrossRef]
  18. Liu, C.Y.; Aryastana, P.; Liu, G.R.; Huang, W.R. Assessment of satellite precipitation product estimates over Bali Island. Atmos. Res. 2020, 244, 105032. [Google Scholar] [CrossRef]
  19. You, Q.; Fraedrich, K.; Ren, G.; Ye, B.; Meng, X.; Kang, S. Inconsistencies of precipitation in the eastern and central Tibetan Plateau between surface adjusted data and reanalysis. Theor. Appl. Climatol. 2012, 109, 485–496. [Google Scholar] [CrossRef]
  20. Yu, C.; Hu, D.; Liu, M.; Wang, S.; Di, Y. Spatio-temporal accuracy evaluation of three high-resolution satellite precipitation products in China area. Atmos. Res. 2020, 241, 104952. [Google Scholar] [CrossRef]
  21. Lei, H.; Zhao, H.; Ao, T. Ground validation and error decomposition for six state-of-the-art satellite precipitation products over mainland China. Atmos. Res. 2022, 269, 106017. [Google Scholar] [CrossRef]
  22. Yan, D.; Liu, S.; Qin, T.; Weng, B.; Li, C.; Lu, Y.; Liu, J. Evaluation of TRMM precipitation and its application to distributed hydrological model in Naqu River Basin of the Tibetan Plateau. Hydrol. Res. 2017, 48, 822–839. [Google Scholar] [CrossRef]
  23. Zhao, T.; Yatagai, A. Evaluation of TRMM 3B42 product using a new gauge-based analysis of daily precipitation over China. Int. J. Climatol. 2014, 34, 2749–2762. [Google Scholar] [CrossRef]
  24. Sharifi, E.; Steinacker, R.; Saghafian, B. Multi time-scale evaluation of high-resolution satellite-based precipitation products over northeast of Austria. Atmos. Res. 2018, 206, 46–63. [Google Scholar] [CrossRef]
  25. Wang, H.; Yuan, Y.; Zeng, S.; Li, W.; Tang, X. Evaluation of satellite-based precipitation products from GPM IMERG and GSMaP over the three-river headwaters region, China. Hydrol. Res. 2021, 52, 1328–1343. [Google Scholar] [CrossRef]
  26. Weng, P.; Tian, Y.; Jiang, Y.; Chen, D.; Kang, J. Assessment of GPM IMERG and GSMaP daily precipitation products and their utility in droughts and floods monitoring across Xijiang River Basin. Atmos. Res. 2023, 286, 106673. [Google Scholar] [CrossRef]
  27. Pirmoradian, R.; Hashemi, H.; Fayne, J. Performance evaluation of IMERG and TMPA daily precipitation products over CONUS (2000–2019). Atmos. Res. 2022, 279, 106389. [Google Scholar] [CrossRef]
  28. Lin, O.; Yang, K.; Lu, H.; Chen, Y.; Lazhu; Zhou, X.; Wang, Y. Ground-Based Observations Reveal Uniqu-e Valley Precipitation Patterns in the Central Himalaya. J. Geophys. Res. Atmos. 2020, 125, e2019JD031502. [Google Scholar] [CrossRef]
  29. Kumar, M.; Hodnebrog, Ø.; Sophie Daloz, A.; Sen, S.; Badiger, S.; Krishnaswamy, J. Measuring precipitation in Eastern Himalaya: Ground validation of eleven satellite, model and gauge interpolated gridded products. J. Hydrol. 2021, 599, 126252. [Google Scholar] [CrossRef]
  30. Li, G.; Yu, Z.; Wang, W.; Ju, Q.; Chen, X. Analysis of the spatial Distribution of precipitation and topography with GPM data in the Tibetan Plateau. Atmos. Res. 2021, 247, 105259. [Google Scholar] [CrossRef]
  31. Xu, J.; Ma, Z.; Yan, S.; Peng, J. Do ERA5 and ERA5-land precipitation estimates outperform satellite-based precipitation products? A comprehensive comparison between state-of-the-art model-based and satellite-based precipitation products over mainland China. J. Hydrol. 2022, 605, 127353. [Google Scholar] [CrossRef]
  32. Musie, M.; Sen, S.; Srivastava, P. Comparison and evaluation of gridded precipitation datasets for streamflow simulation in data scarce watersheds of Ethiopia. J. Hydrol. 2019, 579, 124168. [Google Scholar] [CrossRef]
  33. Wen, T.; Guo, Y.; Dong, S.; Lai, X. Assessment of CRU, ERA5, CMFD grid precipitation data for the Tibetan Plateau from 1979 to 2017. Arid Zone Res. 2022, 39, 684–697. [Google Scholar] [CrossRef]
  34. Beck, H.E.; van Dijk, A.I.J.M.; Levizzani, V.; Schellekens, J.; Miralles, D.G.; Martens, B.; de Roo, A. MSWEP: 3-hourly 0.25◦ global gridded precipitation (1979–2015) by merging gauge, satellite, and reanalysis data. Hydrol. Earth Syst. Sci. 2017, 21, 589–615. [Google Scholar] [CrossRef]
  35. Nawaz, N.; Gull, R.; Elnashar, A. Spatio-Temporal Assessment of Global Precipitation Products over the Largest Agriculture Region in Pakistan. Remote Sens. 2020, 12, 3650. [Google Scholar] [CrossRef]
  36. Yao, T.; Chen, F.; Cui, P.; Ma, Y.; Xu, B.; Zhu, L.; Zhang, F.; Wang, W.; Ai, L.; Yang, X. From Tibetan Plateau to Third Pole and Pan-Third Pole. Bull. Chin. Acad. Sci. 2017, 32, 924–931. [Google Scholar] [CrossRef]
  37. Wan, G.; Yang, M.; Liu, Z.; Wang, X.; Liang, X. The Precipitation Variations in the Qinghai-Xizang (Tibetan) Plateau during 1961–2015. Atmosphere 2017, 8, 80. [Google Scholar] [CrossRef]
  38. Wu, P.; Liu, Y.-J.; Wang, J.; Ding, Y.-H. Revisiting the variations of precipitation and water vapour budget over the Tibetan Plateau. Adv. Clim. Chang. Res. 2023, 14, 77–84. [Google Scholar] [CrossRef]
  39. Chen, Y.; Sharma, S.; Zhou, X.; Yang, K.; Li, X.; Niu, X.; Hu, X.; Khadka, N. Spatial performance of multiple reanalysis precipitation datasets on the southern slope of central Himalaya. Atmos. Res. 2021, 250, 105365. [Google Scholar] [CrossRef]
  40. Li, C.; Zhao, T.; Shi, C.; Liu, Z. Evaluation of Daily Precipitation Product in China from the CMA Global Atmospheric Interim Reanalysis. J. Meteorol. Res. 2020, 34, 117–136. [Google Scholar] [CrossRef]
  41. Zhao, L.; Hu, G.; Zou, D.; Wu, T.; Du, E.; Liu, G.; Xiao, Y.; Li, R.; Pang, Q.; Qiao, Y.; et al. A Synthesis Dataset of Permafrost for the Qinghai-Xizang (Tibet) Plateau, China (2002–2018); National Tibetan Plateau Data Center: Beijing, China, 2021. [Google Scholar]
  42. Skofronick-Jackson, G.; Petersen, W.A.; Berg, W.; Kidd, C.; Stocker, E.F.; Kirschbaum, D.B.; Kakar, R.; Braun, S.A.; Huffman, G.J.; Iguchi, T.; et al. The Global Precipitation Measurement (Gpm) Mission for Science and Society. Bull. Am. Meteorol. Soc. 2017, 98, 1679–1695. [Google Scholar] [CrossRef]
  43. Okamoto, K.I.; Iguchi, T.; Hanado, H.; Takahashi, N.; Ushio, T. The global satellite mapping of precipitation (GSMaP) project. In Proceedings of the International Geoscience and Remote Sensing Symposium, Seoul, Republic of Korea, 29 July 2005; pp. 3414–3416. [Google Scholar] [CrossRef]
  44. Ashouri, H.; Hsu, K.L.; Sorooshian, S.; Braithwaite, D.K.; Knapp, K.R.; Cecil, L.D.; Nelson, B.R.; Prat, O.P. PERSIANN-CDR: Daily precipitation climate data record from multisatellite observations for hydrological and climate studies. Bull. Am. Meteorol. Soc. 2015, 96, 69–83. [Google Scholar] [CrossRef]
  45. Muñoz-Sabater, J.; Dutra, E.; Agustí-Panareda, A.; Albergel, C.; Arduini, G.; Balsamo, G.; Boussetta, S.; Choulga, M.; Harrigan, S.; Hersbach, H.; et al. ERA5-Land: A state-of-the-art global reanalysis dataset for land applications. Earth Syst. Sci. Data 2021, 13, 4349–4383. [Google Scholar] [CrossRef]
  46. Guo, H.; Bao, A.; Liu, T.; Ndayisaba, F.; He, D.; Kurban, A.; De Maeyer, P. Meteorological Drought Analysis in the Lower Mekong Basin Using Satellite-Based Long-Term CHIRPS Product. Sustainability 2017, 9, 901. [Google Scholar] [CrossRef]
  47. Gao, F.; Zhang, Y.; Ren, X.; Yao, Y.; Hao, Z.; Cai, W. Evaluation of CHIRPS and its application for drought monitoring over the Haihe River Basin, China. Nat. Hazards 2018, 92, 155–172. [Google Scholar] [CrossRef]
  48. Aksu, H.; Cavus, Y.; Aksoy, H.; Akgul, M.A.; Turker, S.; Eris, E. Spatiotemporal analysis of drought by CHIRPS precipitation estimates. Theor. Appl. Climatol. 2022, 148, 517–529. [Google Scholar] [CrossRef]
  49. Mianabadi, A.; Salari, K.; Pourmohamad, Y. Drought monitoring using the long-term CHIRPS precipitation over Southeastern Iran. Appl. Water Sci. 2022, 12, 183. [Google Scholar] [CrossRef]
  50. Shalishe, A.; Bhowmick, A.; Elias, K.; Krakauer, N.Y. Meteorological Drought Monitoring Based on Satellite CHIRPS Product over Gamo Zone, Southern Ethiopia. Adv. Meteorol. 2022, 2022, 1–13. [Google Scholar] [CrossRef]
  51. Sa’adi, Z.; Yusop, Z.; Alias, N.E.; Shiru, M.S.; Muhammad, M.K.I.; Ramli, M.W.A. Application of CHIRPS dataset in the selection of rain-based indices for drought assessments in Johor River Basin, Malaysia. Sci. Total Environ. 2023, 892, 164471. [Google Scholar] [CrossRef]
  52. He, J.; Yang, K.; Tang, W.; Lu, H.; Qin, J.; Chen, Y.; Li, X. The first high-resolution meteorological forcing dataset for land process studies over China. Sci. Data 2020, 7, 25. [Google Scholar] [CrossRef]
  53. Jiang, Y.; Yang, K.; Qi, Y.; Zhou, X.; He, J.; Lu, H.; Li, X.; Chen, Y.; Li, X.; Zhou, B.; et al. TPHiPr: A long-term (1979–2020) high-accuracy precipitation dataset (1∕30°, daily) for the Third Pole region based on high-resolution atmospheric modeling and dense observations. Earth Syst. Sci. Data 2023, 15, 621–638. [Google Scholar] [CrossRef]
  54. Yim, S.-Y.; Wang, B.; Liu, J.; Wu, Z. A comparison of regional monsoon variability using monsoon indices. Clim. Dyn. 2013, 43, 1423–1437. [Google Scholar] [CrossRef]
  55. Jiang, Q.; Li, W.; Fan, Z.; He, X.; Sun, W.; Chen, S.; Wen, J.; Gao, J.; Wang, J. Evaluation of the ERA5 reanalysis precipitation dataset over Chinese Mainland. J. Hydrol. 2021, 595, 125660. [Google Scholar] [CrossRef]
  56. Brunke, M.A.; Fairall, C.W.; Zeng, X.; Eymard, L.; Curry, J.A. Which Bulk Aerodynamic Algorithms are Least Problematic in Computing Ocean Surface Turbulent Fluxes? J. Clim. 2003, 16, 619–635. [Google Scholar] [CrossRef]
  57. Brunke, M.A.; Wang, Z.; Zeng, X.; Bosilovich, M.; Shie, C.-L. An Assessment of the Uncertainties in Ocean Surface Turbulent Fluxes in 11 Reanalysis, Satellite-Derived, and Combined Global Datasets. J. Clim. 2011, 24, 5469–5493. [Google Scholar] [CrossRef]
  58. Kidd, C.; Levizzani, V. Status of satellite precipitation retrievals. Hydrol. Earth Syst. Sci. 2011, 15, 1109–1116. [Google Scholar] [CrossRef]
  59. Hong, Z.; Han, Z.; Li, X.; Long, D.; Tang, G.; Wang, J. Generation of an improved precipitation data set from multisource information over the Tibetan Plateau. J. Hydrometeorol. 2021, 22, 1275–1295. [Google Scholar] [CrossRef]
  60. Quan, C.; Zhou, B.; Shen, X.; Shen, Y.; Zhu, S.; Zhao, T. Applicability Evaluation of IMERG and GSMaP Satellite Precipitation Data in the Three-River Source Region. Plateau Mt. Meteorol. Res. 2022, 42, 102–108. [Google Scholar] [CrossRef]
  61. Lin, Z.; Yao, X.; Du, J.; Zhou, Z. Refined Evaluation of Satellite Precipitation Products against Rain Gauge Observations along the Sichuan—Tibet Railway. J. Meteor. Res. 2022, 36, 779–797. [Google Scholar] [CrossRef]
Figure 1. Study area map depicting (a) The distribution of observation stations in the study area. (b) The boundary of the TP, and (c) Digital elevation (in m) map of the TP.
Atmosphere 15 00138 g001
Figure 2. The performances of eight precipitation products in terms of (a) CC, (b) RMSE, (c) PC (d) POD (e) FAR (f) CSI (Horizontal dashed lines are the medium scores) at daily scale.
Atmosphere 15 00138 g002
Figure 3. The spatial distribution of performances in terms of CC (the first column), RMSE (the second column), PC (the third column), POD (the fourth column), FAR (the fifth column), and CSI (the sixth column) estimated by GPM IMERG (the first row), GSMaP (the second row), CMORPH (the third row), PERSIANN-CDR (the fourth row), ERA5-Land (the fifth row), CHIRPS (the sixth row), CMFD (the seventh row), and TPHiPr (the eighth row) at the daily scale over the hinterland of the TP.
Atmosphere 15 00138 g003
Figure 4. The performances of eight precipitation products in terms of (a) PC, (b) POD, (c) FAR (d) CSI at different precipitation thresholds.
Atmosphere 15 00138 g004
Figure 5. The performances of eight precipitation products in terms of (a) CC, (b) RMSE, (c) PC (d) POD (e) FAR (f) CSI at monthly scale.
Atmosphere 15 00138 g005
Figure 6. The performances of eight precipitation products in terms of (a) CC, (b) RMSE, (c) PC (d) POD (e) FAR (f) CSI in wet and dry seasonal scale.
Atmosphere 15 00138 g006
Figure 7. Brunke’s comprehensive ranking of eight precipitation products at (a) daily scale, (b) wet and dry seasonal scale, and (c) monthly scale.
Atmosphere 15 00138 g007
Figure 8. The spatial distribution of mean daily precipitation (the first column), mean monthly precipitation (the second column), mean dry seasonal precipitation (the third column), mean wet seasonal precipitation (the fourth column), and mean yearly precipitation (the fifth column) over the hinterland of the TP.
Atmosphere 15 00138 g008
Figure 9. The change of eight precipitation products in terms of (a) CC, (b) RMSE, (c) PC (d) POD (e) FAR (f) CSI by elevation.
Atmosphere 15 00138 g009
Figure 10. The performances of eight precipitation products in terms of (a) CC, (b) RMSE, (c) PC (d) POD (e) FAR (f) CSI in different elevation ranges.
Atmosphere 15 00138 g010
Table 1. The main characteristics of 22 rain gauges.
TypeCodeLatitudes (°)Longitudes (°)Elevation (m)
Meteorological stations5270736.893.682767
5271337.8595.373174
5281836.4294.922808
5290935.2293.084612
5527931.3790.024701
5529931.4892.074507
5547230.9588.634670
5549330.4891.14200
5600434.2292.434533
5601832.8895.284066
5602134.795.484175
5610631.8893.784024
5611631.4295.63874
Integrated observation stationXDT35.7294.084538
TGL33.0491.565100
LDH31.4991.444808
AYK37.3288.484300
ZNH35.2991.584784
Hydrologic station0115300037.3395.573396
0122822036.394.782937
0122830036.3994.62801
0122840036.7293.572767
Table 2. The main characteristics of eight precipitation products.
Data TypeAbbreviations
of the Dataset
Temporal ResolutionSpatial ResolutionPeriod Covered in TimeReference
Satellite-derived productsGPM IMERG V06Half-hourly0.1°2000.6–2021.6NASA
GSMaPDaily0.1°2001.1.1–presentJAXA
CMORPHHalf-hourly8 km1998.1–presentNOAA
PERSIANN-CDRDaily0.25°1998.1–presentCHRS
Fusion precipitation productsERA5-LandHourly0.1°1981.1–presentECMWF
CHIRPSDaily0.05°2000.1–presentUSGS
CMFDThree-hourly0.1°1979.1–2018.12NTPSDC
TPHiPrDaily1/30°1979.1–2020.12NTPSDC
Table 3. The parameters of evaluating indicators.
NameFormulaPerfect Value
Correlation Coefficient   C C = i = 1 n ( P i P ¯ ) ( S i S ¯ ) i = 1 n ( P i P ¯ ) 2 i = 1 n ( S i S ¯ ) 2 1
Root Mean Square Error   R M S E = i = 1 n ( P i S i ) 2 n 0
Precision   P C = H + Z H + F + M + Z 1
Probability of Detection P O D = H H + M 1
False Alarm Ratio   F A R = F H + F 0
Critical Success Index C S I = H H + F + M 1
Notation: n is the number of samples; P i represents the estimated precipitation of each product; S i represents the data of observation; P ¯ denotes the mean of estimated precipitation of each product; S ¯ shows the mean of values of observation; H is the number of hit events detected by gauge and precipitation product simultaneously; M is the number of missed events; F is the number of false alarm events; Z is the number of non-precipitation events detected by gauge and precipitation product.
Table 4. The summary of evaluating indicators for eight products at the daily resolution.
Data TypeProductCCRMSE (mm/d)PCPODFARCSI
Satellite-derived productsGPM IMERG0.493.060.560.620.440.42
GSMaP0.283.300.610.380.390.31
CMORPH0.354.220.390.340.610.22
PERSIANN-CDR0.462.720.420.810.580.38
Fusion precipitation productsERA5-Land0.552.520.500.900.500.47
CHIRPS0.413.160.480.340.520.25
CMFD0.662.170.610.770.390.52
TPHiPr0.732.010.620.820.380.55
Disclaimer/Publisher’s Note: The statements, opinions and data contained in all publications are solely those of the individual author(s) and contributor(s) and not of MDPI and/or the editor(s). MDPI and/or the editor(s) disclaim responsibility for any injury to people or property resulting from any ideas, methods, instructions or products referred to in the content.

