Abstract
The present study employs the k-epsilon turbulence model to investigate the influence of stable stratification with different Richardson numbers (Rib) on flow patterns and pollutant dispersion near tall buildings. The results show that thermal stratification significantly affects the flow pattern around buildings. As Rib increases, the leeward stagnation point gradually shifts upward toward the top of the building, while the recirculation region on the top of the building moves downward, and the length of the recirculation region on the windward side initially increases and then decreases. The vortex position gradually moves above the building. The region with high TKE/uH2 is primarily concentrated on the top of the building and within the downwind recirculation area. As Rib increases, the TKE/uH2 decreases in the top and wake regions of the building. With increasing Rib, the ground-level pollutant concentration first increases and then decreases, the height of the downwind plume gradually reduces, while the maximum concentration in the plume rises.
1. Introduction
At present, society is facing the acceleration of urbanization, the rapid growth of the urban population, and increasingly prominent urban environmental problems. Accordingly, the investigation of flow patterns and pollutant distribution around residential buildings, particularly skyscrapers and tall buildings, has become a hot research topic. Among urban environmental problems, the leakage of harmful gases will have a serious impact on human health, environmental quality and climate change. There are many factors affecting pollutant diffusion, such as the wind speed, building shape, and thermal stratification. The thermal stratification is one of the main factors affecting the atmospheric boundary layer structure, wind speed, temperature and turbulence profile.
In atmospheric boundary layers, buoyancy can either suppress or intensify vertical motion in stratified flows. As stratified airflow encounters obstacles, the disturbed air generates downstream back waves, resulting in significant alterations to the flow field. The study of thermal stratification is of great significance in atmospheric science. Stable atmospheric conditions are often caused by the occurrence of high-intensity temperature inversion. Temperature inversions are primarily caused by the sinking of air and adiabatic warming. Temperature inversion and stable atmospheric stratification can lead to deterioration of urban ventilation and the urban heat island effect, resulting in negative impacts on the urban environment and human health. In areas affected by temperature inversion, the atmosphere tends to be stable, inhibiting convective processes. Generally, temperature inversion are accompanied by weak surface winds (except those caused by cold waves), which prevent the dispersion of urban pollutants. This leads to even more severe air pollution and a decline in air quality. Under conditions of light wind, thermal buoyancy or thermal forcing can influence or dominate the airflow structure and the dispersion of pollutants. Three types of flow patterns can be classified based on the Richardson number (Ri). When Ri < 0.1, wind dynamics dominate urban airflow. When Ri > 10, thermal buoyancy dominates urban ventilation. When 0.1 < Ri < 10, both forces are important, and their interactions determine the intensity of urban turbulence and the dispersion of pollutants. However, due to the experimental limitations, most investigations in this field have concentrated on the atmospheric boundary layer under neutral stratification [1,2,3,4,5]. Furthermore, investigations into stable stratification primarily involve weakly stable stratification, with limited research conducted on the flow characteristics and turbulent flows within stable boundary layers. Yassin et al. [6] studied the influence of buildings under weak stable stratification on the surrounding flow field and pollutant dispersion through wind tunnel experiments. However, the influence of buildings under strong stable stratification on pollutant diffusion needs further study. Mavroidis et al. [7] conducted experiments and investigated the impact of building shapes under weakly unstable and neutral stratification conditions on pollutant diffusion and found that the concentration upwind of different obstacles depends on the proportion of the plume involved and the size of the circulating flow area. The larger the obstacle is, the lower the ground concentration. Uehara et al. [8] carried out experiments to investigate the influence of regular cubic buildings stratified at a different Richardson number (Rib) from −0.21 to 0.79 on pollutant diffusion and found that the turbulent kinetic energy in street valleys under stable stratification is lower than that under unstable stratification. Due to buoyancy, the downward flow into the street valley is weakened. Ohya et al. [9,10] studied flow patterns in stable atmospheric boundary layers and demonstrated that a stable layer can suppress the formation of turbulence. Consequently, both the momentum and heat flux in the entire boundary layer approach zero. Under strong stable stratification, a low turbulence intensity and intermittent turbulence play dominant roles, turbulence caused by shear force is significantly suppressed, and the vortex size is reduced. In addition, there will be gravity waves in the boundary layer, which further increases the difficulty and complexity of the study of stable stratification.
With the development of computational algorithms, CFD techniques have been widely used to simulate pollutant diffusion around urban buildings. For instance, Olvera [11] numerically studied the impact of skyscrapers on pollutant diffusion under different thermal stratifications. Nakamura and Oke [12] measured the temperature distribution in the street valley under unstable stratification, and Roach [13] analyzed the turbulence changes in the street valley. The vertical component decreased with increasing height under neutral stratification. Mahuixin et al. [14] utilized steady Reynolds-averaged Navier-Stokes (SRANS) and large eddy simulation (LES) techniques to analyze the airflow patterns around isolated buildings, taking into account the impact of buoyancy originating from variations in density between pollutants and the surrounding air. Unstable stratification increases the concentration fluctuation above the pollution source, and stable stratification can inhibit the diffusion of pollutants. Jeong et al. [15] conducted a numerical investigation to explore the effects of a cubic building on the pollutant dispersion in the nearby area, considering various atmospheric stability conditions. They found that during stable stratification, the pollutant plume behind the building spreads horizontally, thereby increasing the concentration of pollutants near the ground compared to unstable and neutral stratifications. Guo Dongpeng et al. [16] numerically studied the influence of isolated buildings and buildings under various thermal stratifications on airflow patterns and verified the results through experimental data. The results show that the velocity and turbulent kinetic energy (TKE) in the wake region of buildings decrease under stable stratification, and the slight decrease in turbulent kinetic energy in the atmosphere under stable stratification is related to the change in the temperature gradient. The impact of buildings on airflow patterns is especially more pronounced along the horizontal direction, while the influence in the vertical direction is relatively small. Shi Xuefeng et al. [17,18] simulated the influence of isolated buildings on airflow patterns and pollutant diffusion across various Rib numbers and verified the results through experiments. It was found that with the increase in Rib numbers, the static point in front of buildings moved up, the distribution range of pollutants in the vertical direction reduced, and the peak concentration raised gradually. Bazdidi-Tehrani et al. [19] employed the LES method to explore the influence of various thermal stratifications on airflow patterns and pollutant diffusion around a 1:1:2 tall building. However, they only focused on weak stable stratification. The performed comprehensive literature survey reveals that a systematic investigation is required to explore the influence of stable layers on the flow pattern and diffusion around tall buildings. Rahmatmand et al. [20] and Tavakol et al. [21] conducted wind tunnel experiments on airflow distribution around dome-roof models. Ntinas et al. [22] discovered that the airflow and velocity of arched-roof buildings shows dramatic variation from the upstream corners of the roof, while for pitched roof buildings, the airflow shows dramatica variation from the roof itself. The findings suggest that different building shapes have a significant impact on the airflow patterns around them.
In the study of buildings under different thermal stratifications mentioned above, most building models were cubic simplified building models. In fact, the height–width ratio of buildings in urban areas is usually greater than 1. The majority of tall buildings are rectangular. In this study, tall buildings with a ratio of 1:1:2 (length:width:height) were chosen as the research object. The influence of buildings has been widely studied, and the coupling effect of the two factors of building and atmospheric stability is the current research hotspot. Previous research on simplifying tall buildings is often conducted under neutral or weakly stable atmospheric conditions, while the research under the condition of stable stratification is relatively limited. In particular, the flow pattern and diffusion of pollutants around the tall buildings under the strong stable stratification still need to be studied systematically. Therefore, it is meaningful to study the influence of stable stratification on the flow pattern and diffusion around tall buildings, providing an effective reference database for the influence of buildings on pollutant diffusion, pedestrian comfort and wind loads on structures. In this paper, the combined influence of tall buildings and thermal stratification is considered, and the k-ε model is used to simulate the influence of tall buildings on flow. On this basis, CFD is used to study the influence of different stable stratification, especially strong stable stratification, on the flow pattern and pollutant diffusion around 1:1:2 (length:width:height) tall buildings.
2. Numerical Method
In this study, the RANS method is used to simulate atmospheric flow and pollutant diffusion. Low-velocity flows can be considered incompressible, resulting in simplified conservation equations in the form below:
where SB, Sr and Sm are defined by the following formula:
The Reynolds number (Re) is calculated with formula:
The TKE (k) and turbulent dissipation (ε) are defined as follows:
where Cµ is an empirical constant. In this article, this parameter is set to Cµ = 0.09.
The k-ε model and the SIMPLE and QUICK algorithms are employed to obtain turbulence stresses and solve the governing equations, respectively [23]. The convergence is achieved when the residuals of all variables drop below 10−4.
3. Simulation Setting
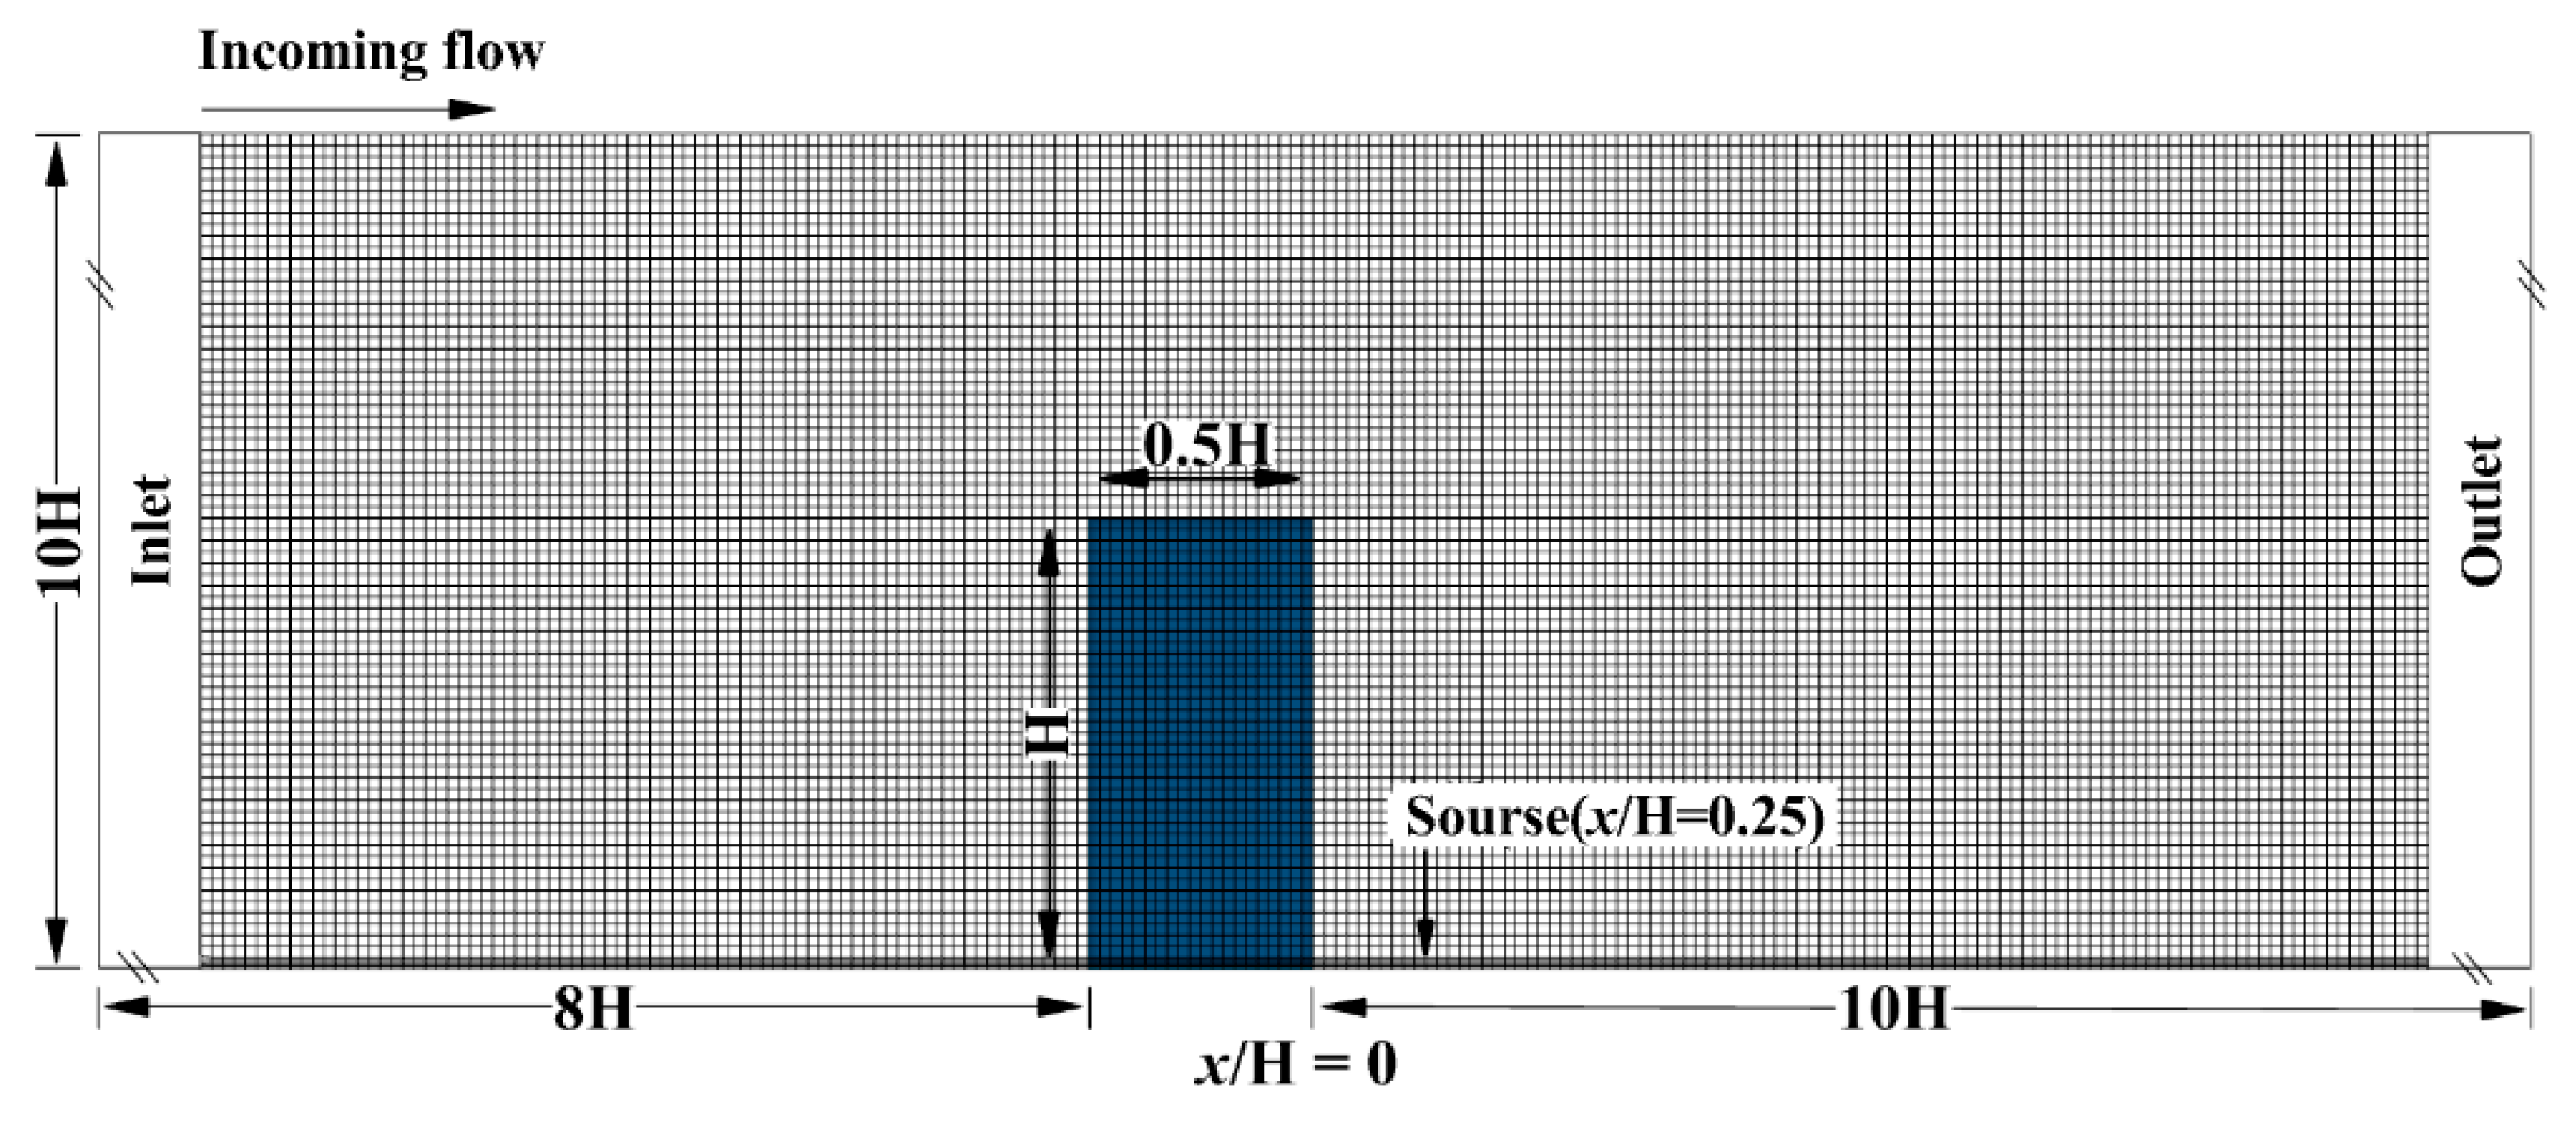
The computational domain is set to 18 H × 10 H × 10 H (length × width × height), and a hexahedral structured mesh is adopted. Figure 1 shows the meshed domain. The boundary conditions follow the guidelines of the Japanese Architectural Society (AIJ) (2008) [24]. The inlet boundary conditions are based on the wind speed profile and temperature profile, which are completely consistent with those used in wind tunnel experiments, and different thermal stratifications are realized by adjusting the temperature gradient. The outlet boundary is fully developed, through which all fluids flow out. Symmetrical wall conditions are set on both sides of the calculation domain. The top boundary is a smooth wall. The ground boundary is defined as the non-slip wall condition. The inlet boundary condition wind speed changes exponentially with height, and the temperature gradient is formed by adjusting the temperature at different heights to simulate the atmospheric boundary layer under different thermal stratifications.
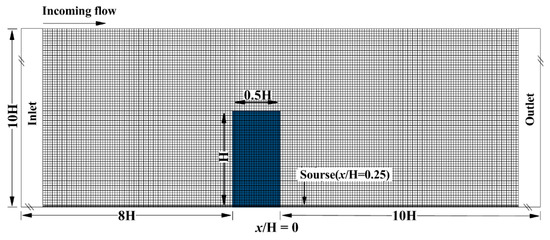
Figure 1.
Schematic diagram of building, pollutant location and grid division.
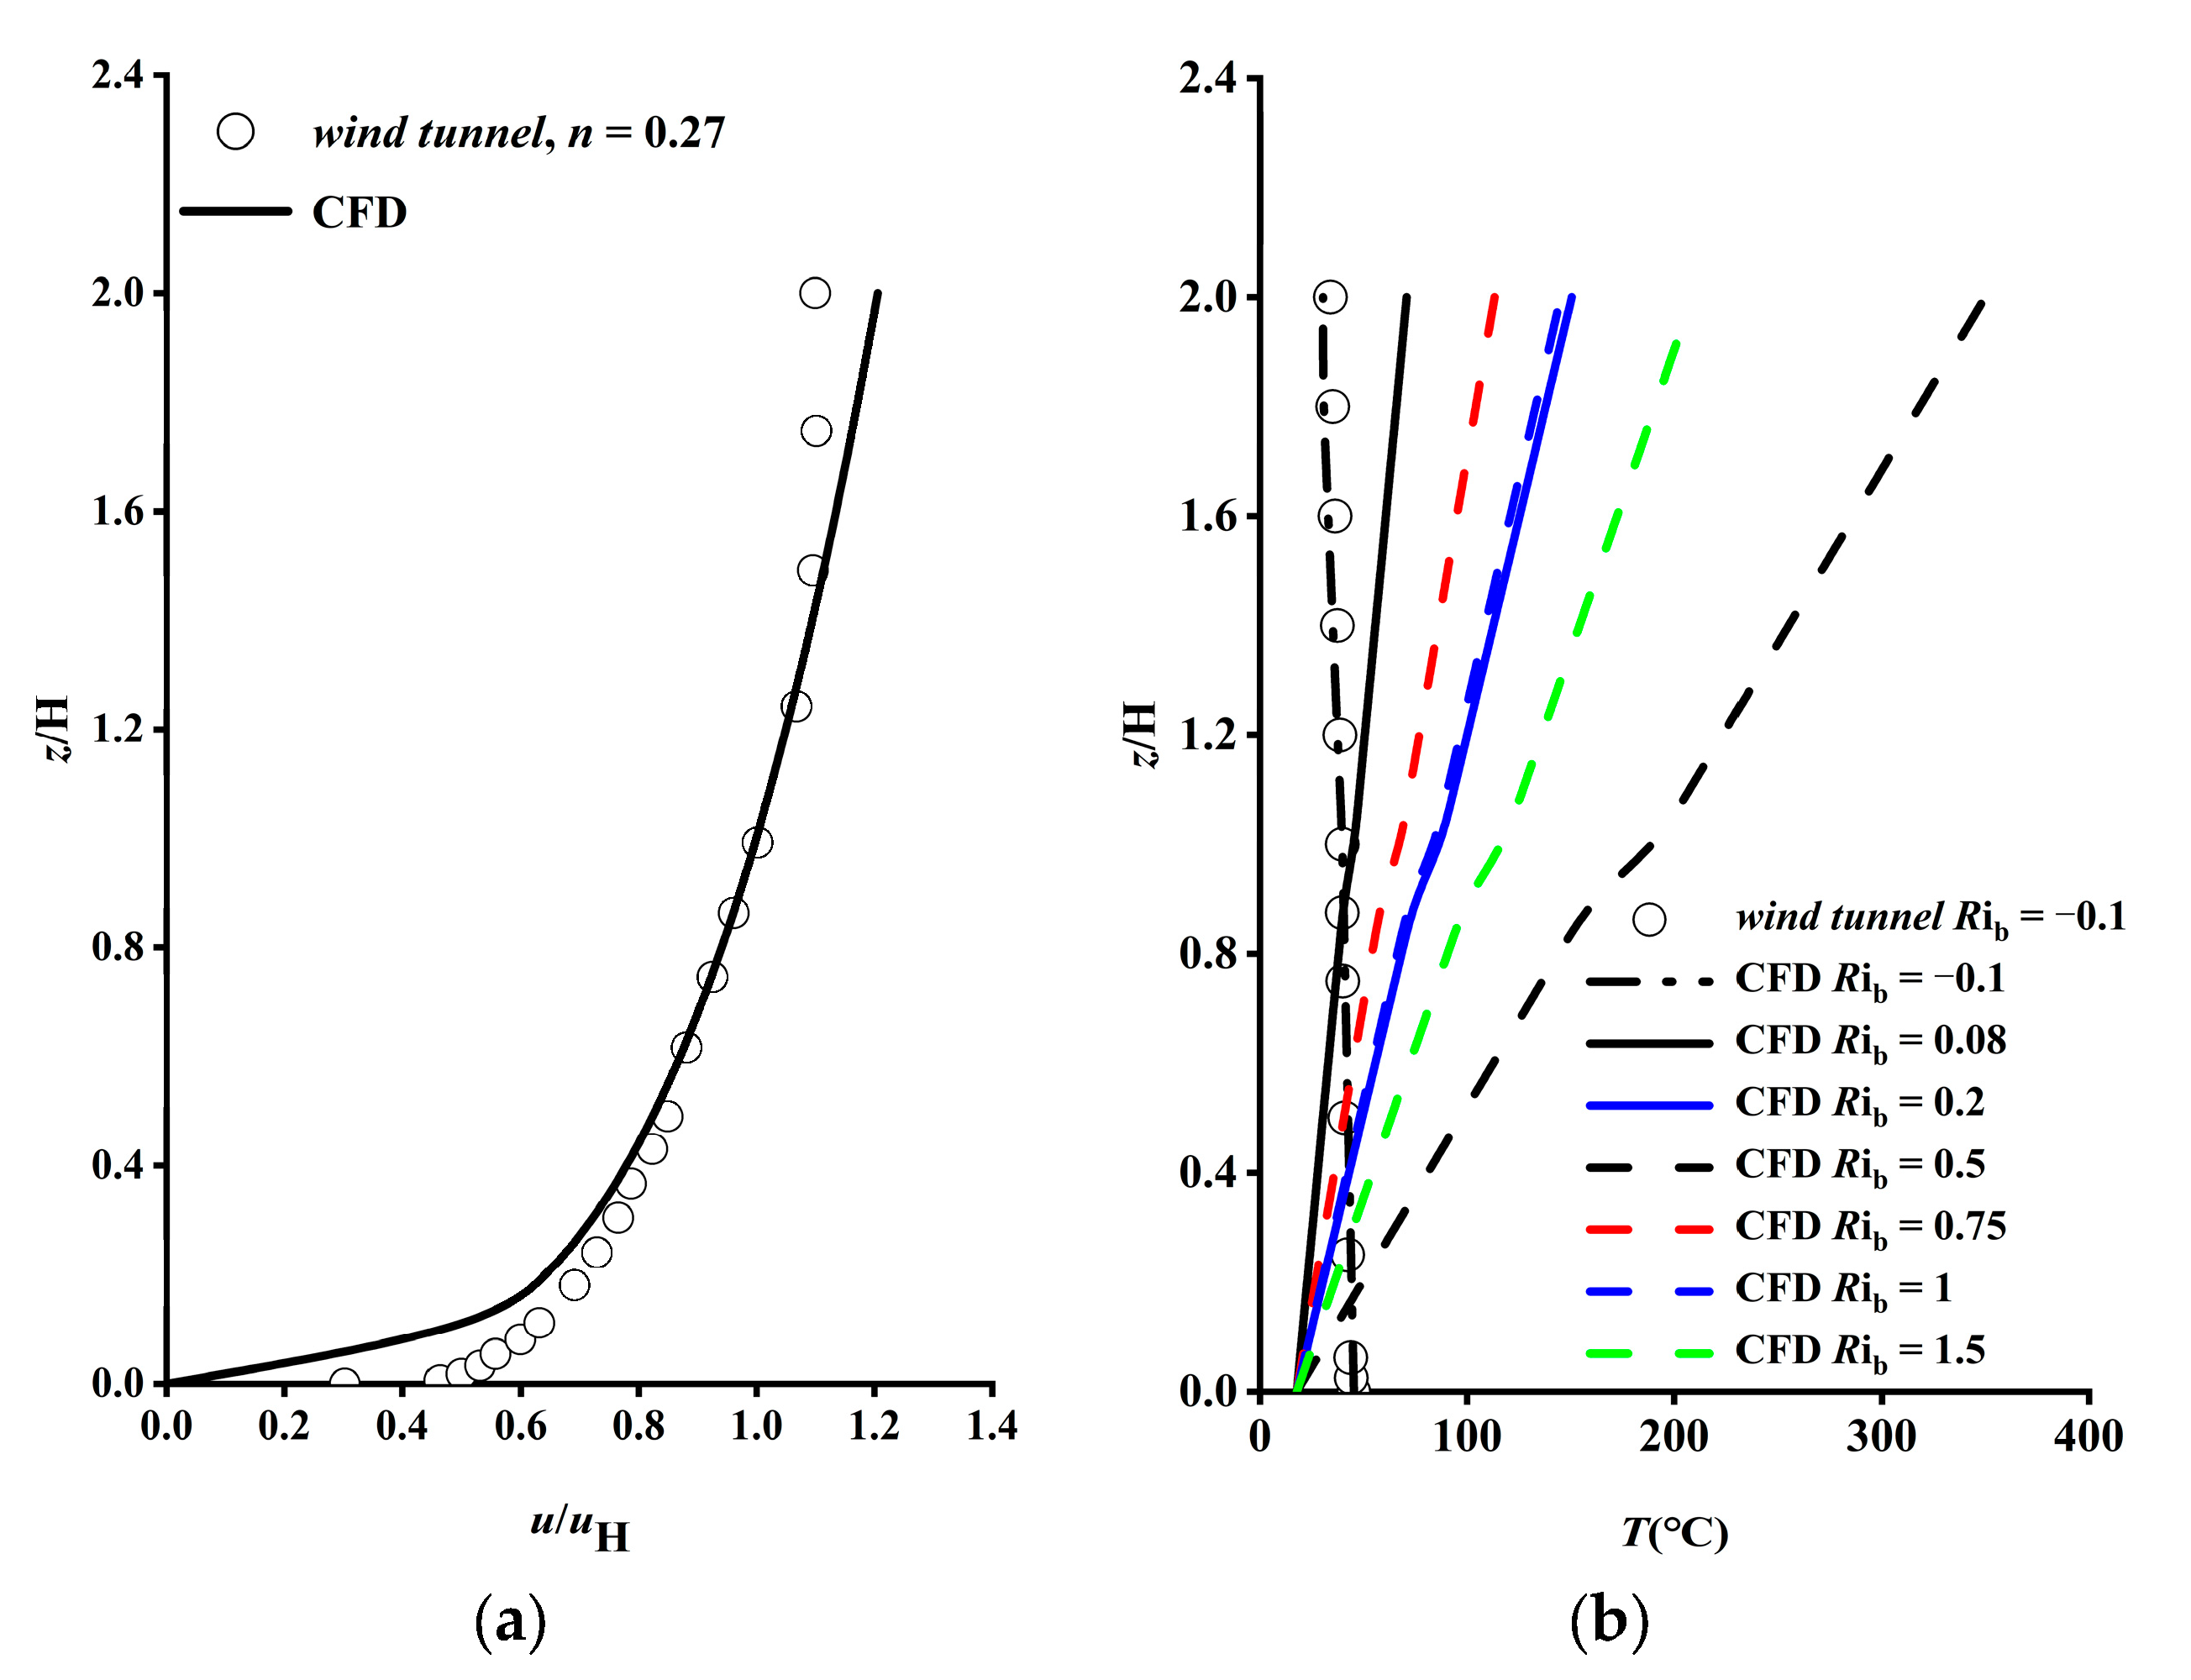
The profiles of the inlet air velocity and temperature are illustrated in Figure 2. The wind profile in Figure 2 is consistent with the wind tunnel experiments. The basic principle of wind tunnel experiments is the similarity theory, and the similarity of thermal stratification is to ensure that the bulk Richardson number is similar. At the same time, in order to study the influence of different thermal stratification on flow pattern and pollutant diffusion, the temperature profile was changed in the CFD simulation process, then different stable stratification types were obtained. At this time, the numerical simulation conditions are based on the scale of wind tunnel experiments. Under the same wind speed, in order to simulate different stable stratification types, it was necessary to ensure that the bulk Richardson number was equal, and the temperature gradient needs to be increased, so large values appear here.
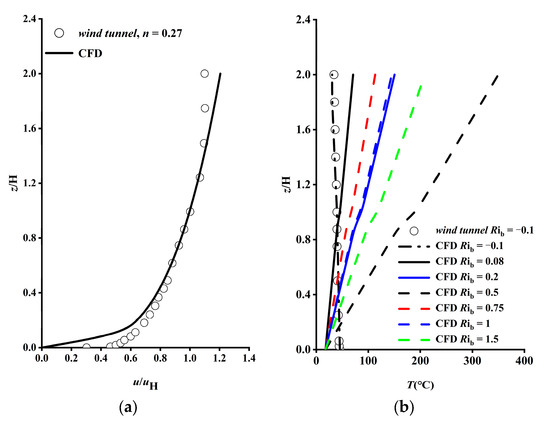
Figure 2.
Inlet wind profile (a) and temperature profile (b).
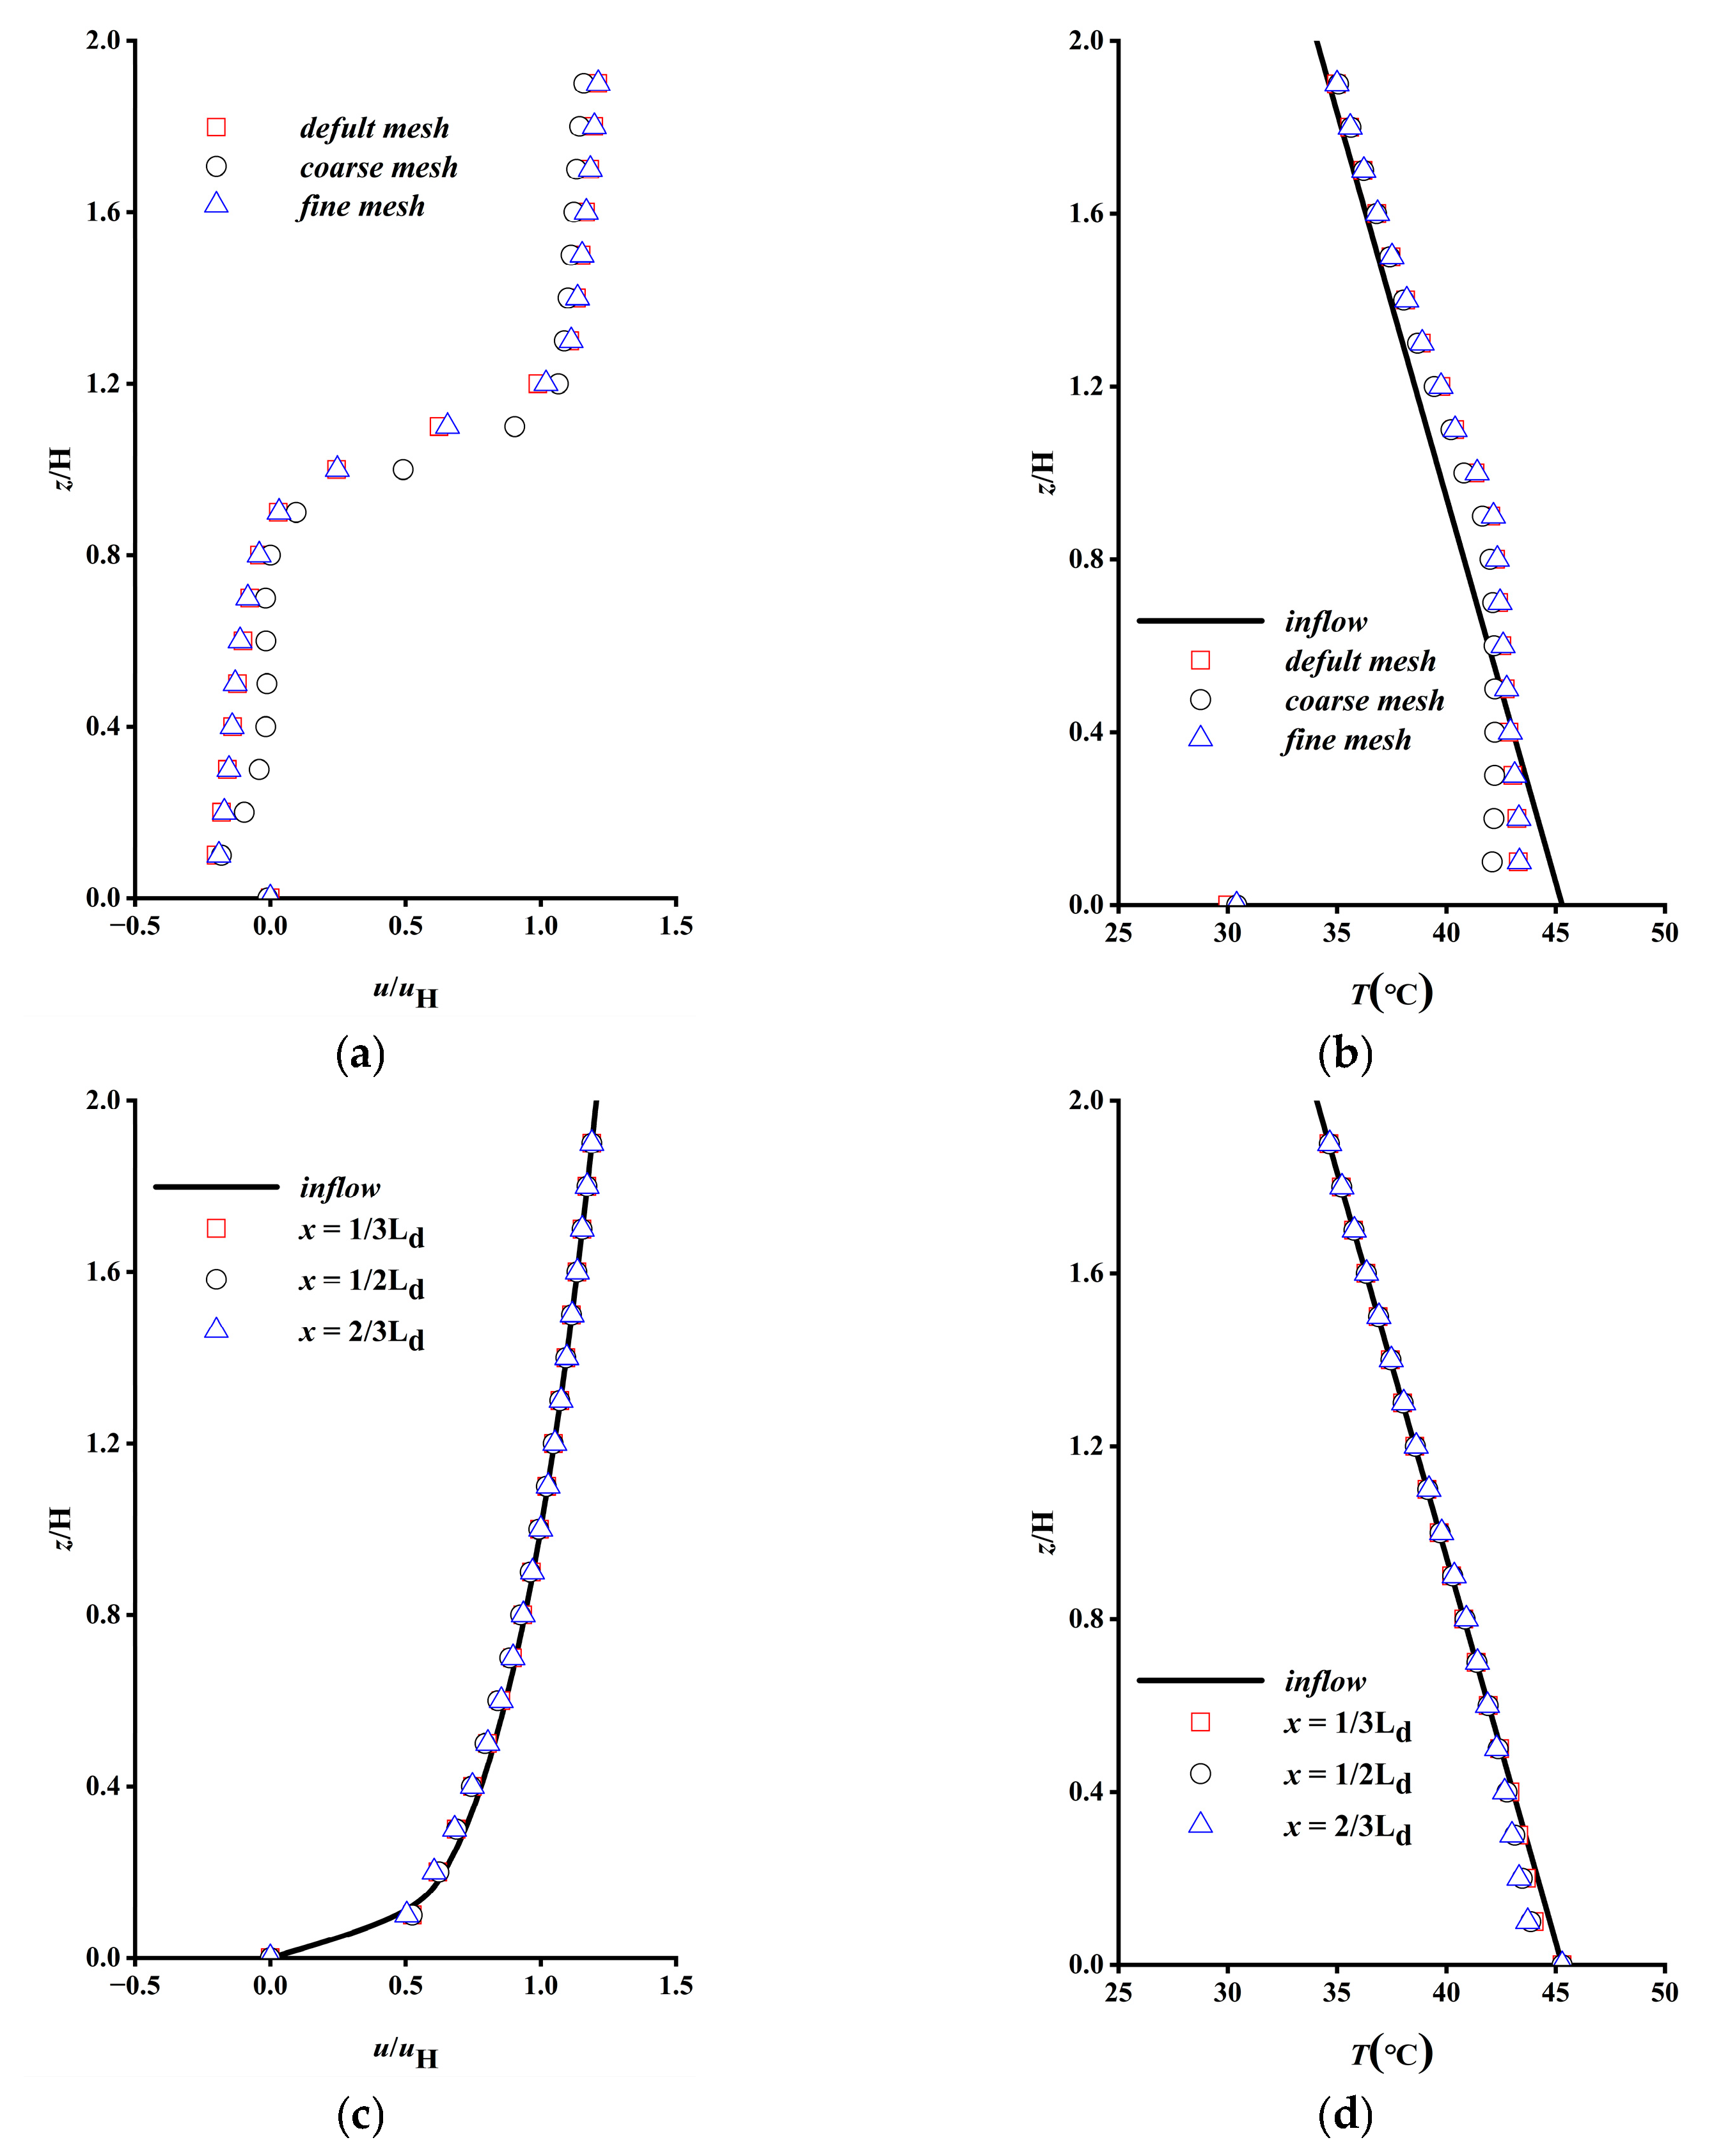
In this paper, the independence analysis of three kinds of grids at 0.25 H on the leeward side of the building under unstable stratification is carried out, in which the number of coarse grids is approximately 320,000 and the size of the building surface grids is 0.016 m. The total number of default grids is approximately 7 million, and the grid size on the building surface is set to 0.004 m. The total number of fine grids is approximately 12 million, and the size of the building surface grid is 0.002 m. Figure 3a,b illustrate the normalized longitudinal wind speed and temperature at various altitudes, demonstrating achieving results independent of the grid size. Considering the calculation time and computational costs, the default grid is used in all simulations.
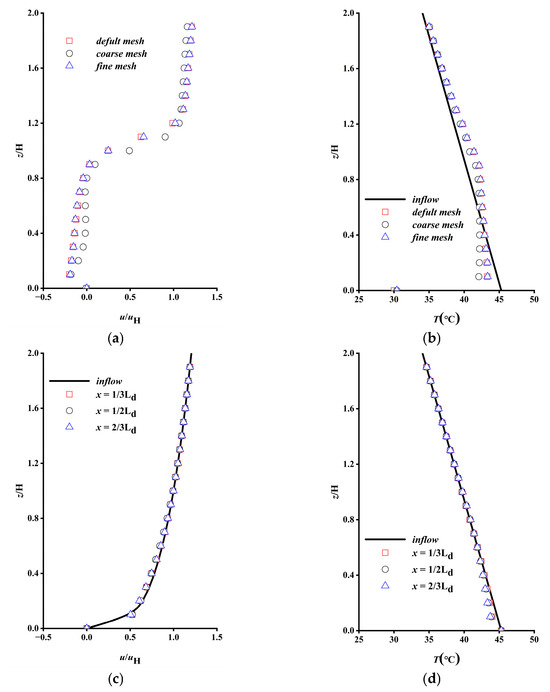
Figure 3.
Grid dependence verification((a) Vertical profile velocity distribution. (b) Vertical profile temperature distribution. (c) Velocity vertical profiles at different locations in the cavity area. (d) Temperature distribution at different locations in the cavity area). Note: Where Ld is the length of the computational field.
The equilibrium atmospheric boundary layer is the most important link in the CFD simulation process. Figure 3c,d illustrate the longitudinal wind velocity and temperature at various heights, respectively. It is observed that the atmospheric boundary layer exhibits a good retention effect at various heights.
4. Model Validity Analysis
In this study, wind tunnel experiment results from AIJ’s open dataset are used to analyze the model’s validity. The dimensions of the wind tunnel experimental building are as follows: a width (W) of 0.08 m, a length (D) of 0.08 m and a height (H) of 0.16 m (W:D:H = 1:1:2). The inflow velocity profile exponent is approximately 0.27, and the Reynolds number (Re) at the top of the building is approximately 15,000. The point source of pollution is located at a height of 0.04 m on the leeward side with a diameter of 0.005 m. The tracer gas used is C2H4, and the emission rate is . Table 1 provides the setting of the main parameters.

Table 1.
Wind tunnel experiments and CFD main parameters.
The diffusion of tracer gas is analyzed using the passive diffusion method, comparing the normalized concentration . In this analysis, represents the gas concentration, , represents the concentration of the released tracer gas, , and represents the source strength.
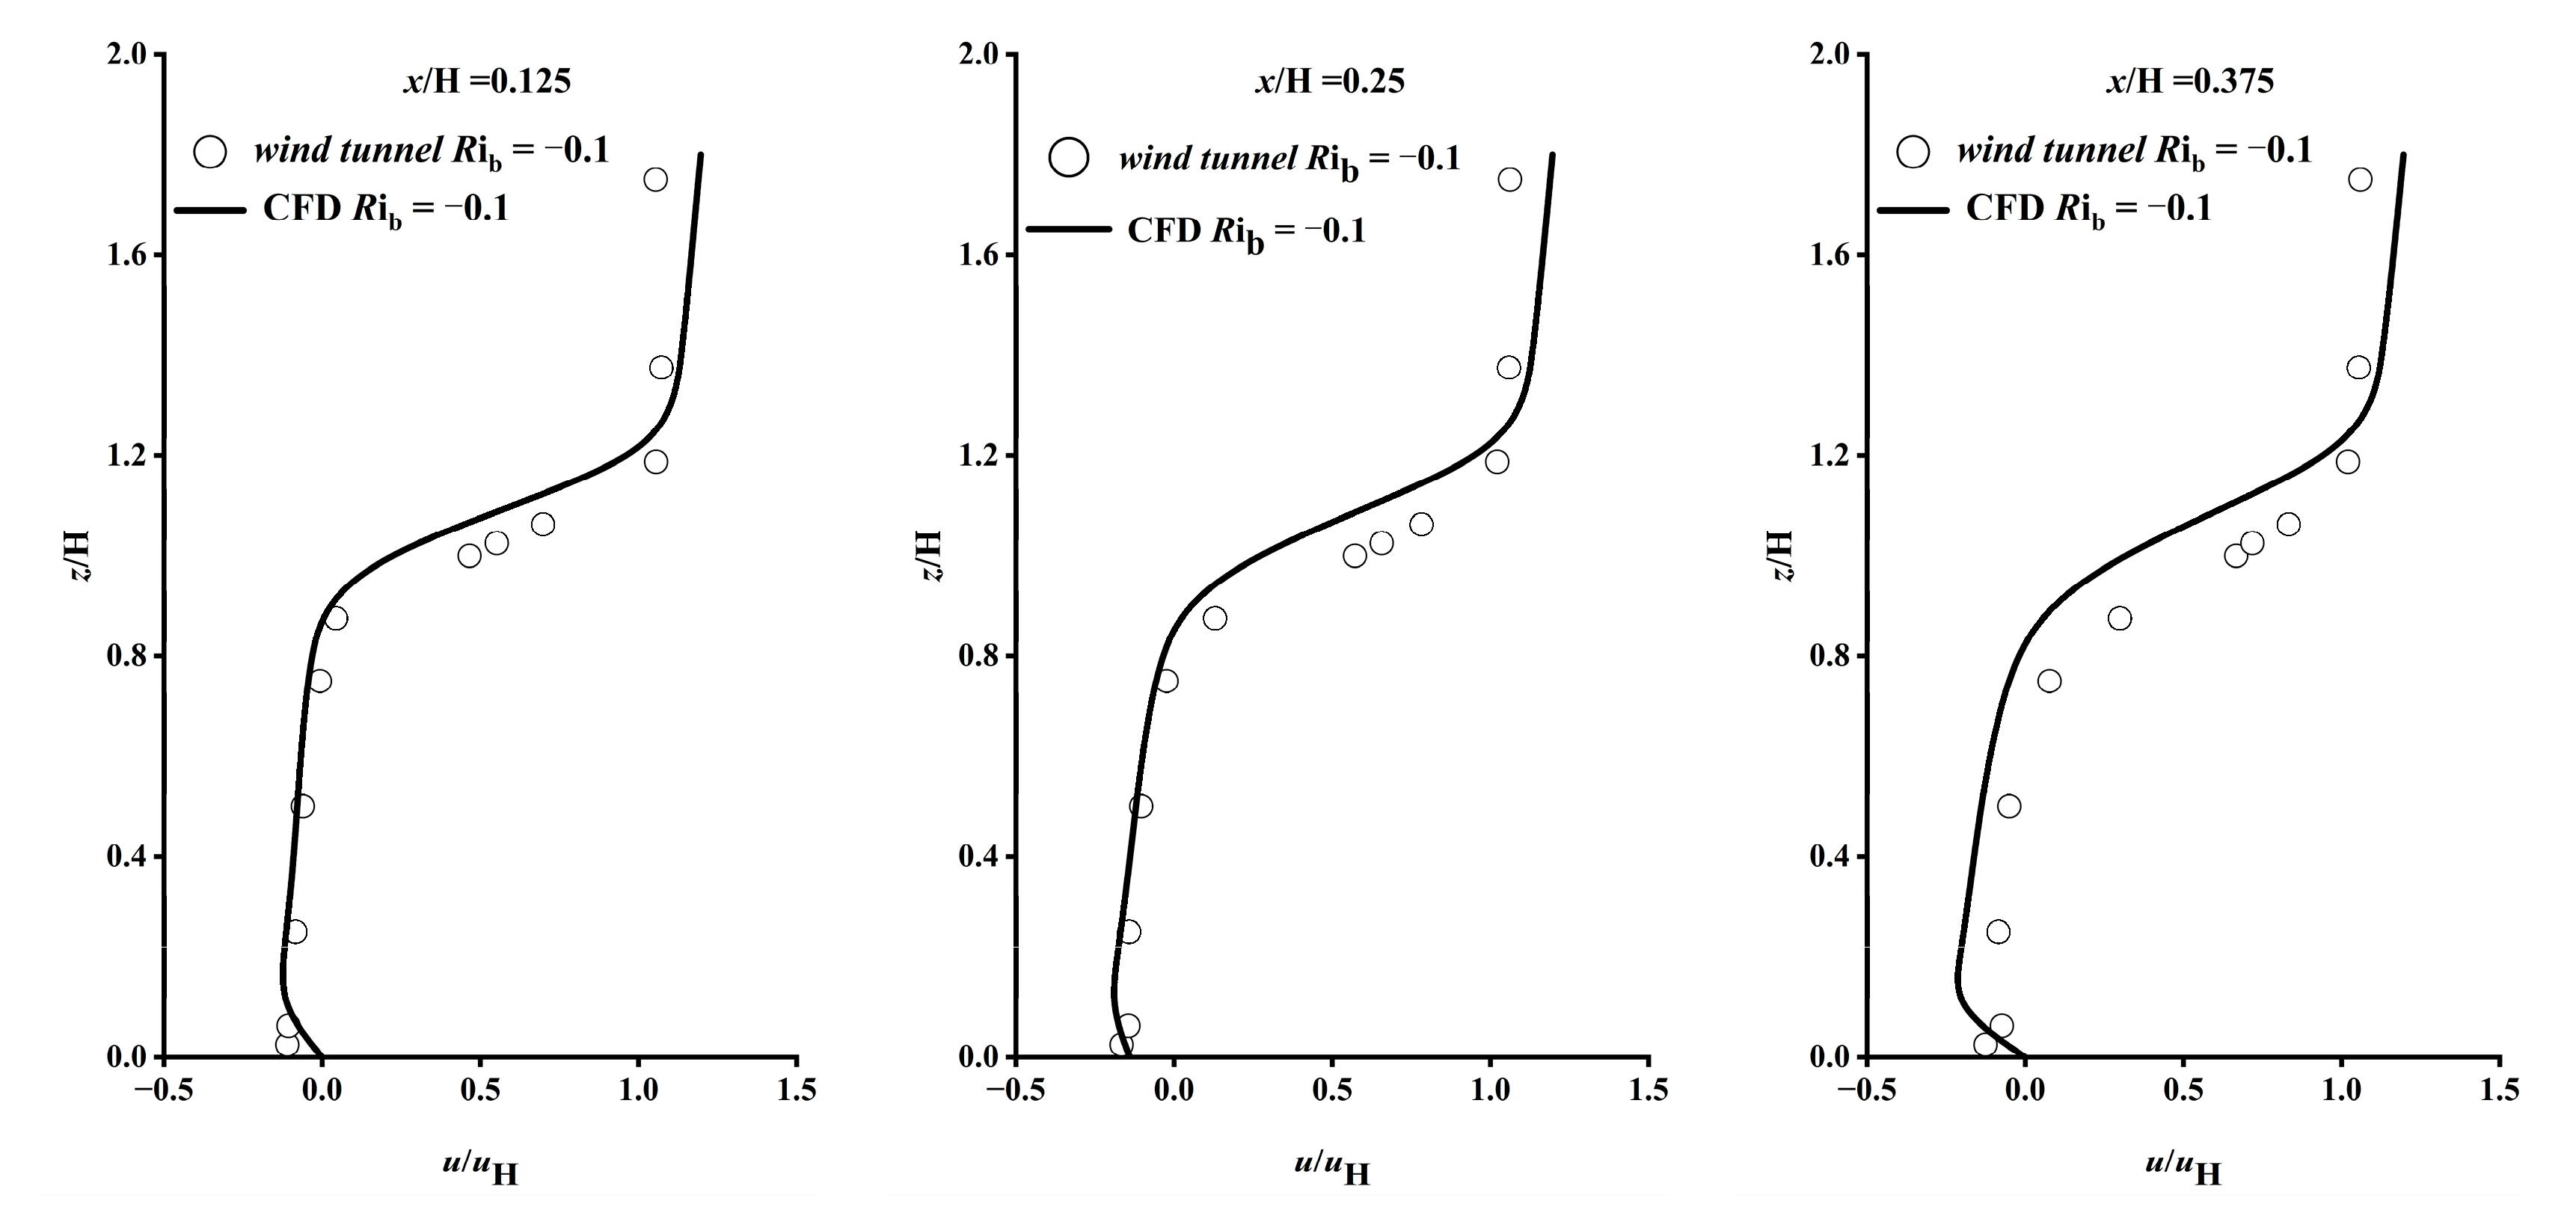
Figure 4 and Figure 5 illustrate the normalized velocity and pollutant concentration at x/H = 0.125, 0.25 and 0.375 along the wind direction centerline. The graphs exhibit excellent consistency between the numerical results and experimental data. The small variations may be attributed to uncertainties in estimating the influence of shear forces on the recirculation region caused by the windward side. Additionally, CFD cannot accurately simulate the anisotropic turbulence stresses in the recirculation region, resulting in an underestimation of the concentration in the windward face of the building and the high concentration gradient in that area [25,26].
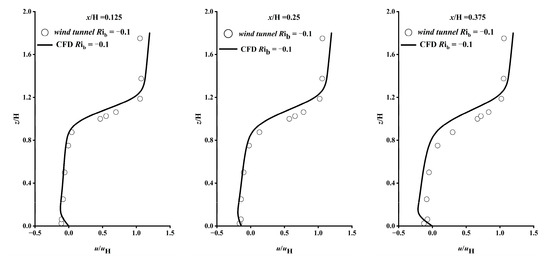
Figure 4.
Comparison of wind tunnel experiment and CFD normalized velocity u/uH at different locations.
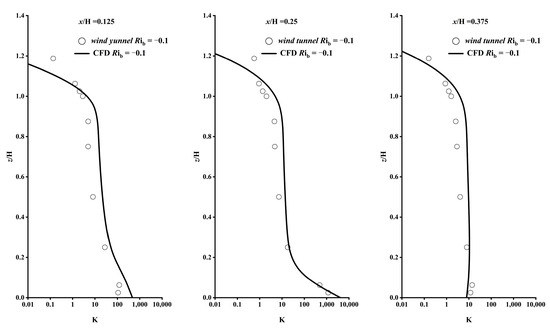
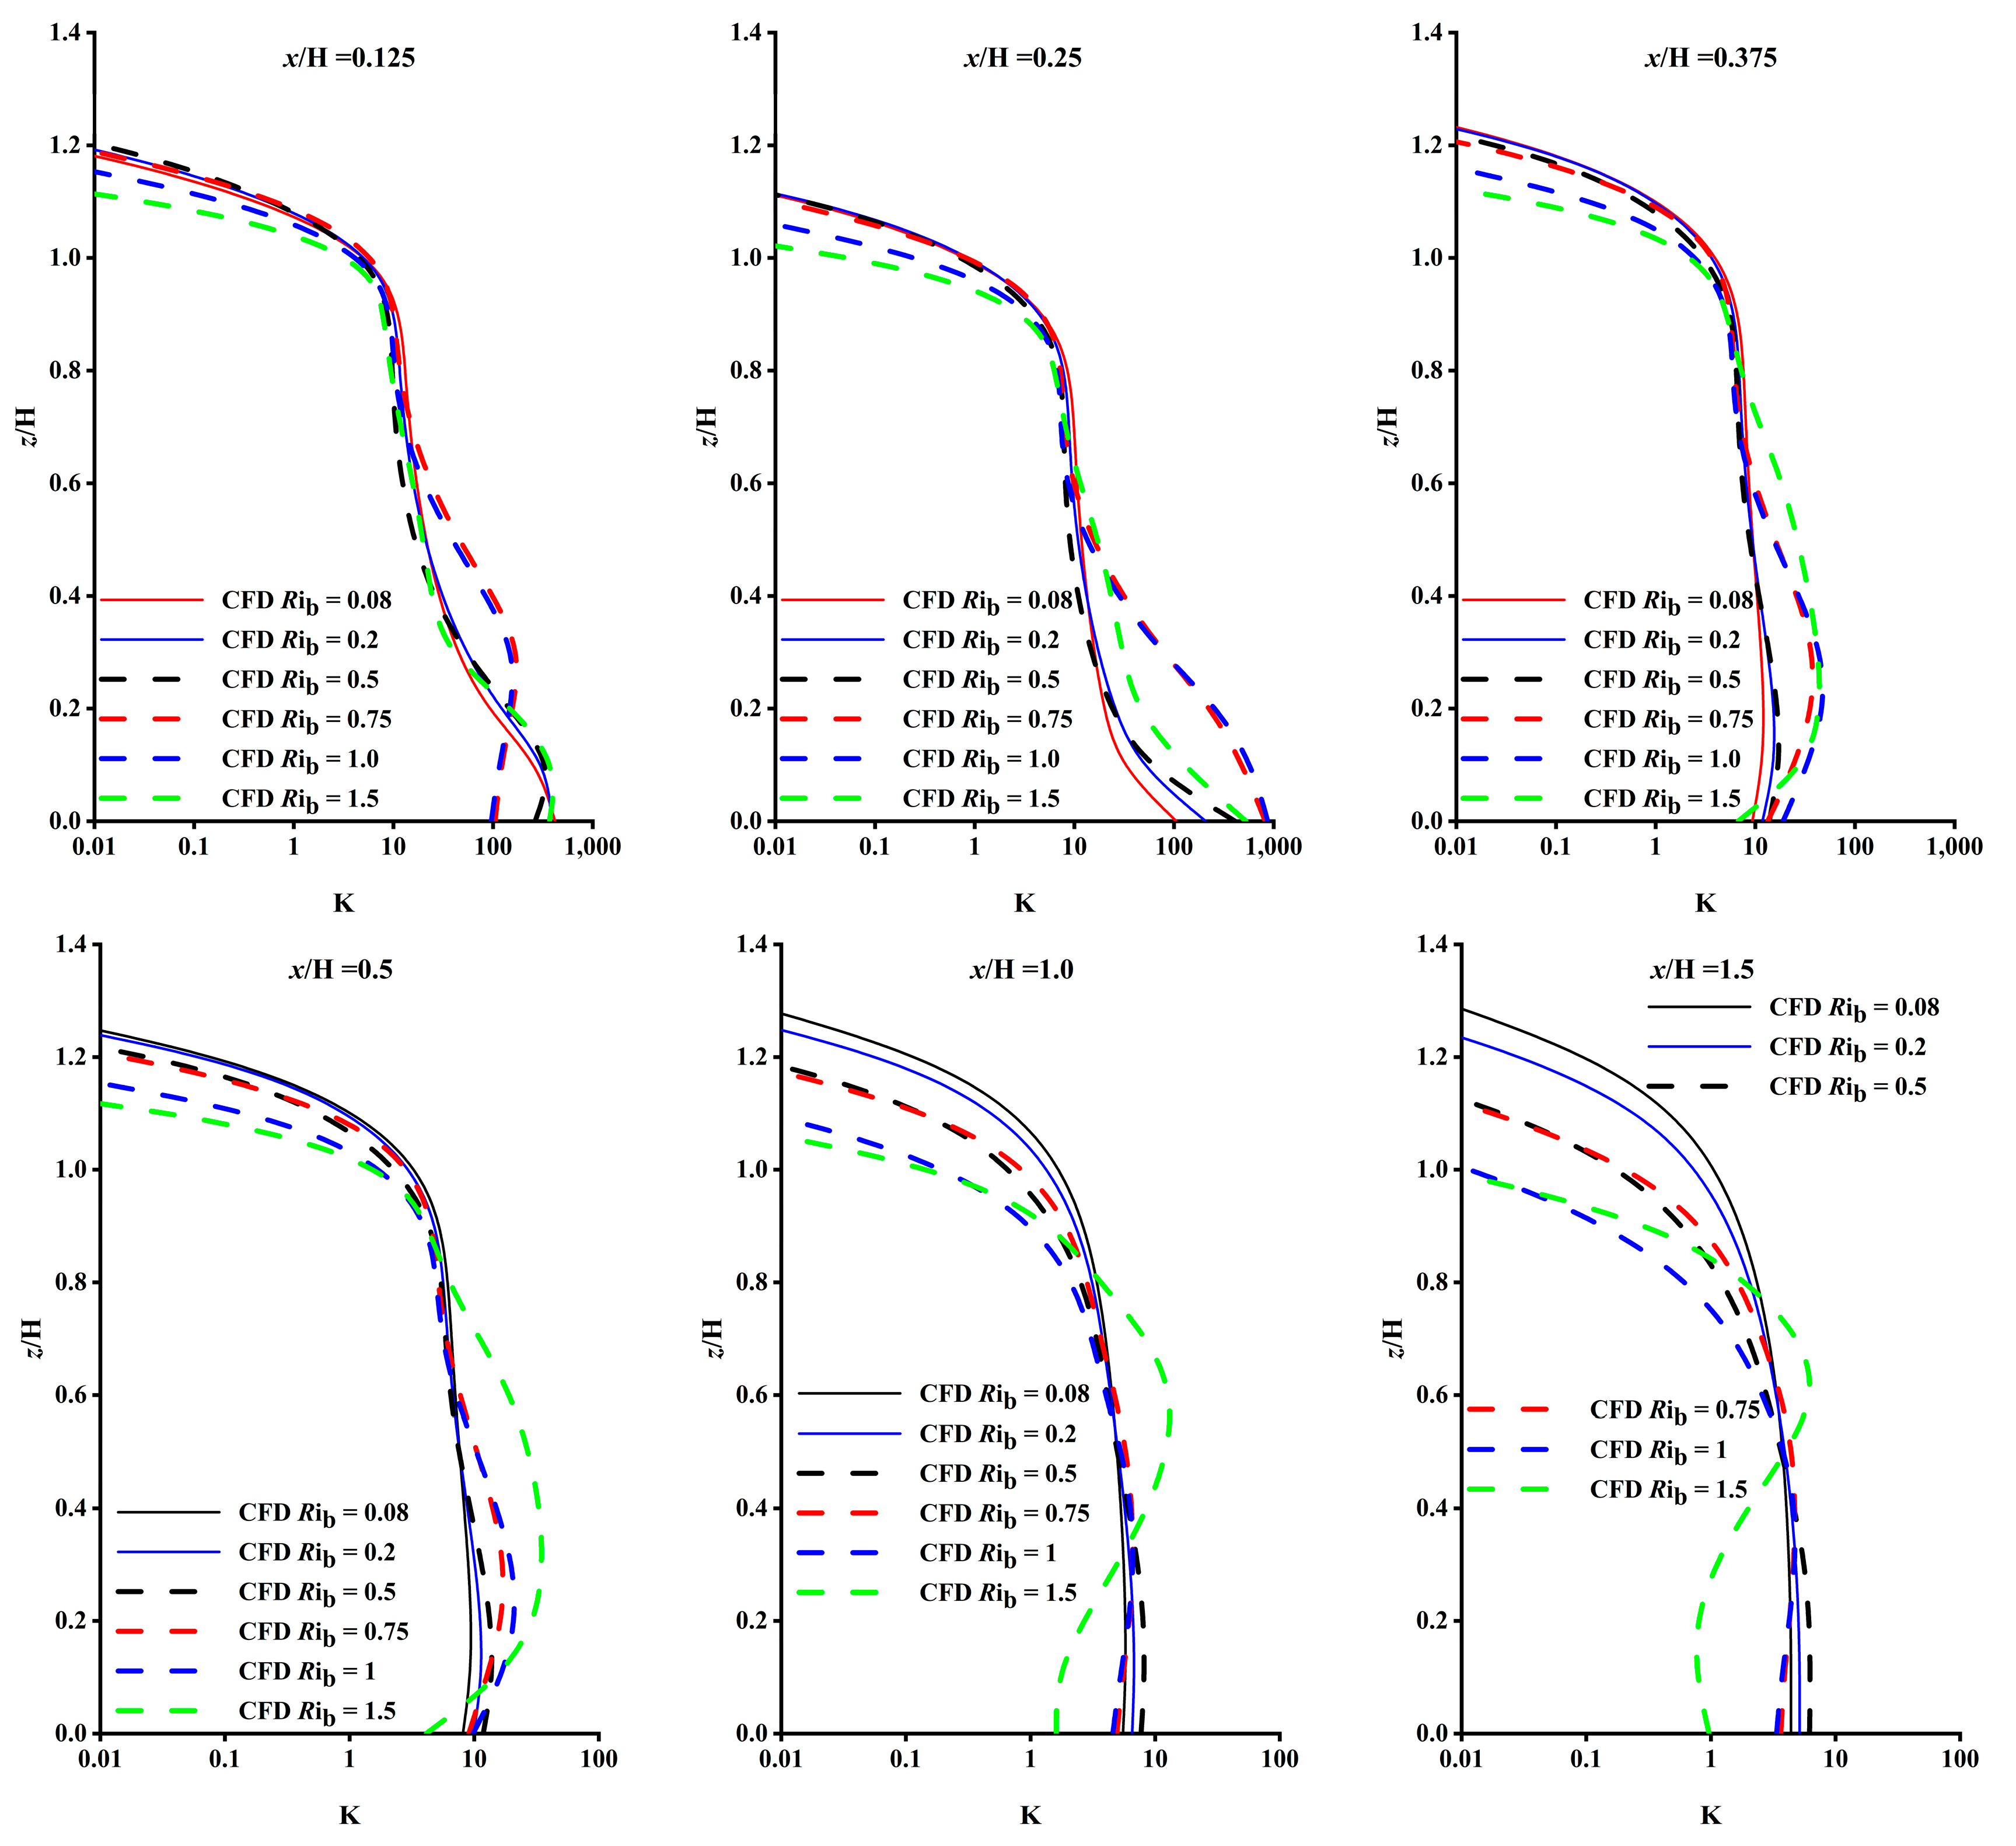
Figure 5.
Comparison of wind tunnel experiment and CFD normalized concentration K at different locations.
5. Results and Discussion
The present article explores the influences of different Rib on the airflow pattern and pollutant dispersion around buildings under stable atmospheric stratification. The normalized longitudinal and vertical velocities and concentration distributions are obtained at x/H = 0.125, 0.25, 0.375, 0.5, 1.0 and 1.5. The flow field, concentration field and TKE at vertical (y/H = 0) and horizontal (z/H = 0.025) profiles are analyzed.
5.1. Flow Field
5.1.1. Distribution of the Mean Longitudinal Velocity
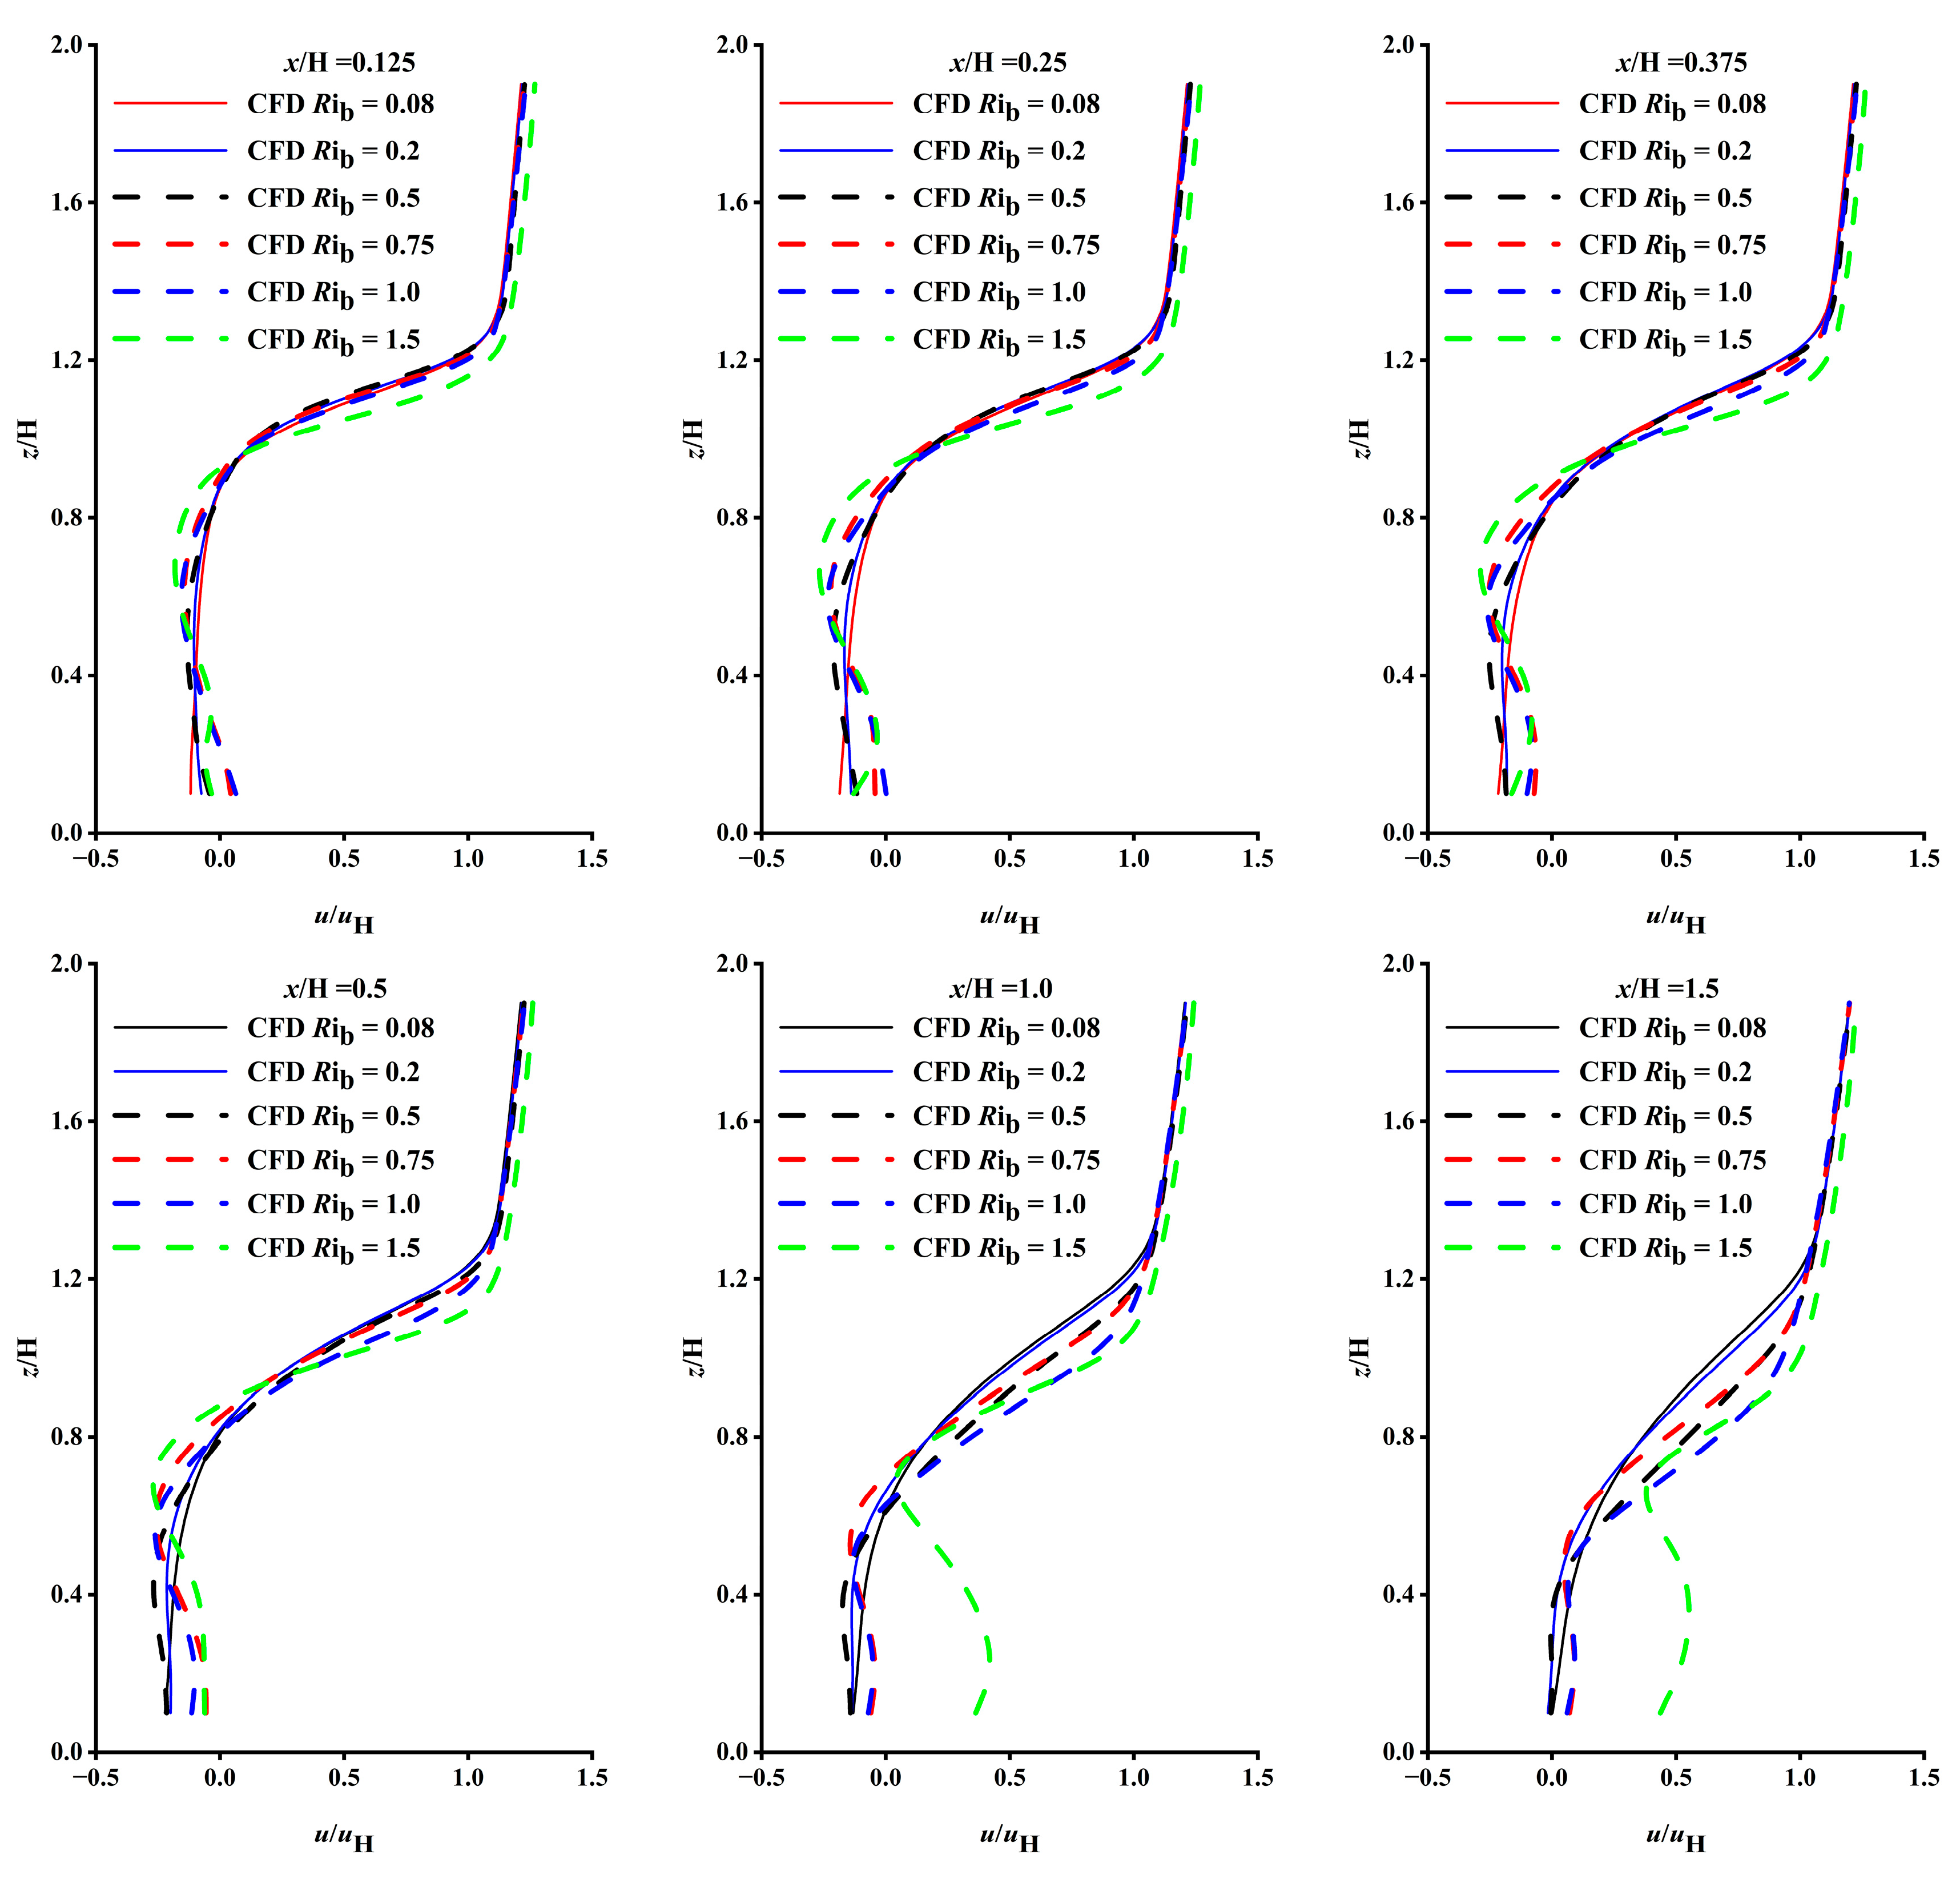
Figure 6 shows the normalized longitudinal velocity (u/uH) at various positions on the leeward side for varying Rib values. It is observed that when x/H < 1.0, z/H < 0.4 and Rib ≤ 0.5, the airflow is affected by the turbulence induced by the building, and variations in the flow field are not significant. When Rib ≥ 0.75, the effect of strong stable stratification starts to appear, and the value of u/uH gradually increases. When x/H = 1.5 and Rib ≥ 0.75, the buoyancy effect generated by strong stable stratification suppresses the vertical movement of the airflow, leading to the formation of a secondary recirculation zone near the ground on the leeward side of the building, where u/uH > 0 at different heights.
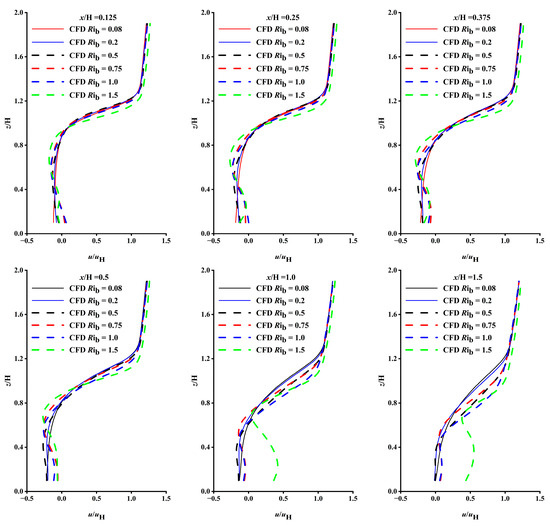
Figure 6.
Comparison of u/uH numerical simulation of normalized longitudinal velocities at different.
5.1.2. Distribution of the Mean Vertical Velocity
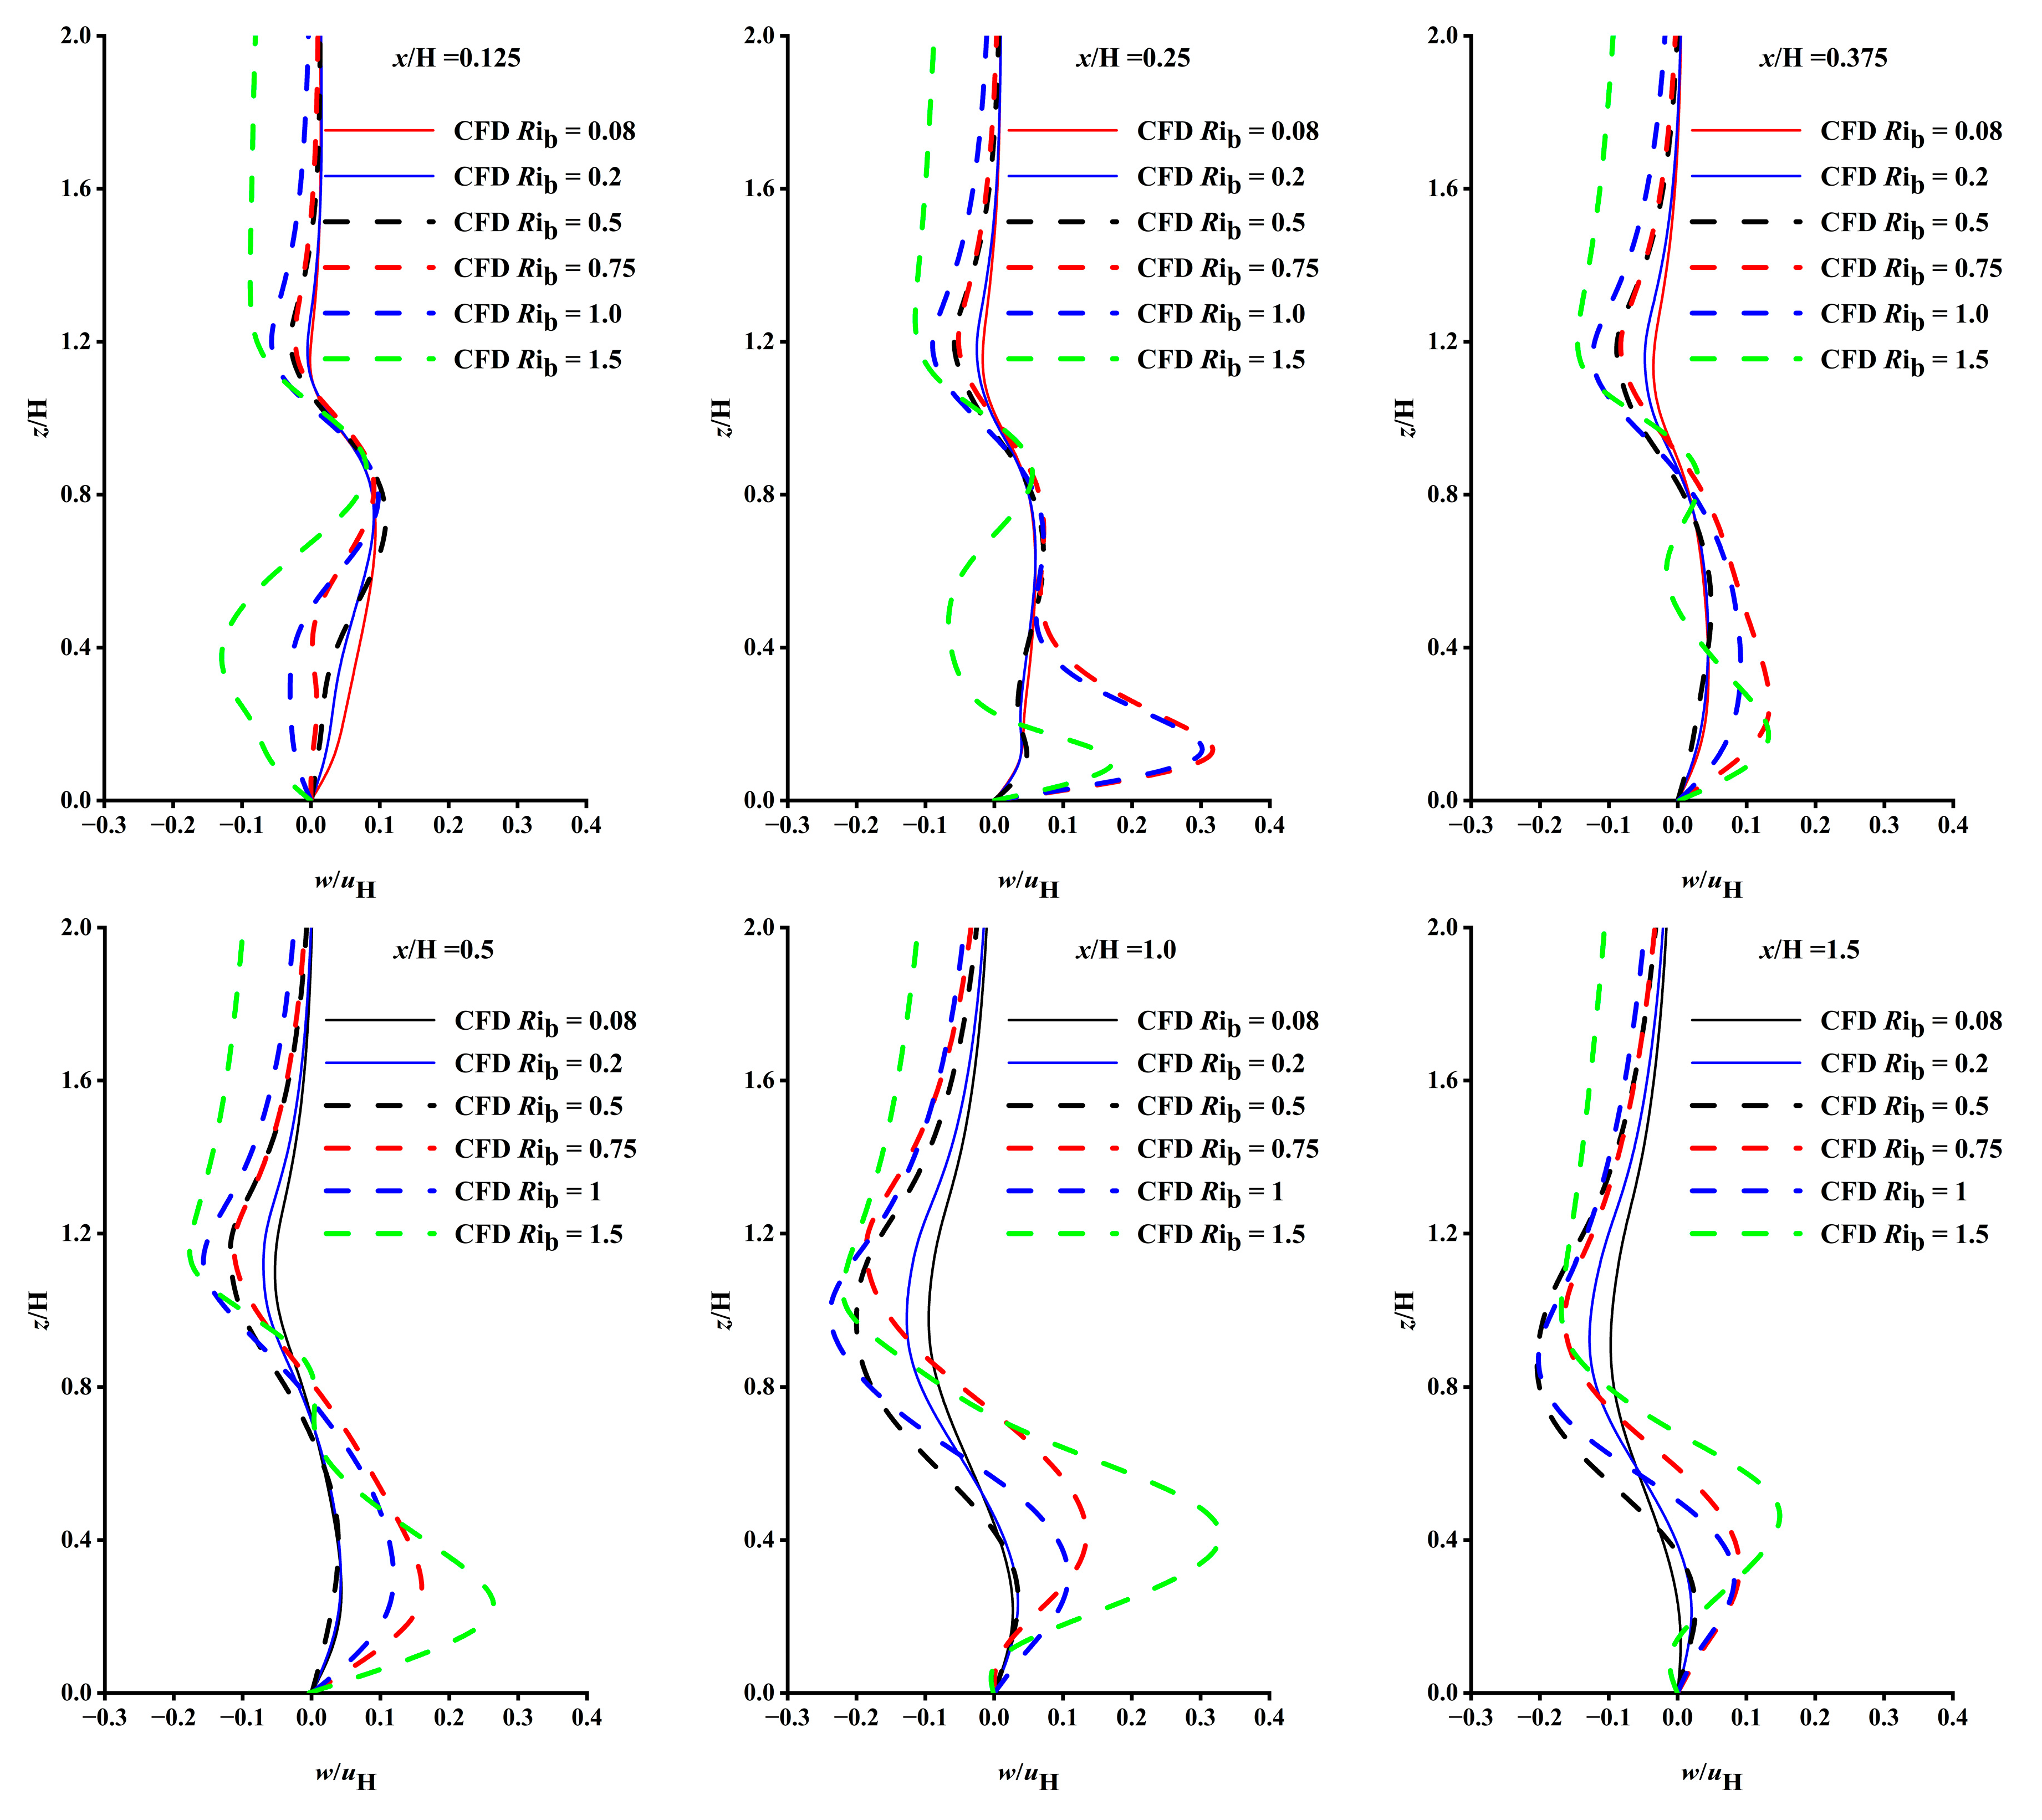
Figure 7 illustrates the normalized vertical velocity (w/uH) at various positions on the leeward side of buildings for Rib values. It is observed that when z/H < 0.5 and Rib ≤ 0.5, the bottom airflow is affected by wind shear, resulting in no significant difference in w/uH. However, when Rib ≥ 0.75, w/uH changes rapidly. This is mainly because, under strong stable stratification, the dominant role of buoyancy inhibits the vertical movement of the airflow. When z/H > 1.0, as Rib increases, w/uH gradually rises due to the inhibiting effect of strong stable layers. For x/H ≤ 0.375, there is a noticeable variation in w/uH due to the influence of the building’s recirculation zone. When x/H ≥ 0.5, the influence of thermal stratification on the flow field gradually becomes apparent, and when Rib ≥ 0.75, the peak height of w/uH gradually increases.
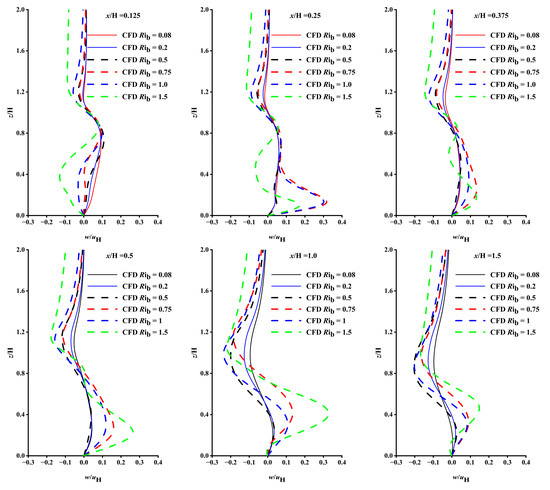
Figure 7.
The normalized vertical mean velocity w/uH at different locations on the leeward side of the building.
5.1.3. Flow Pattern
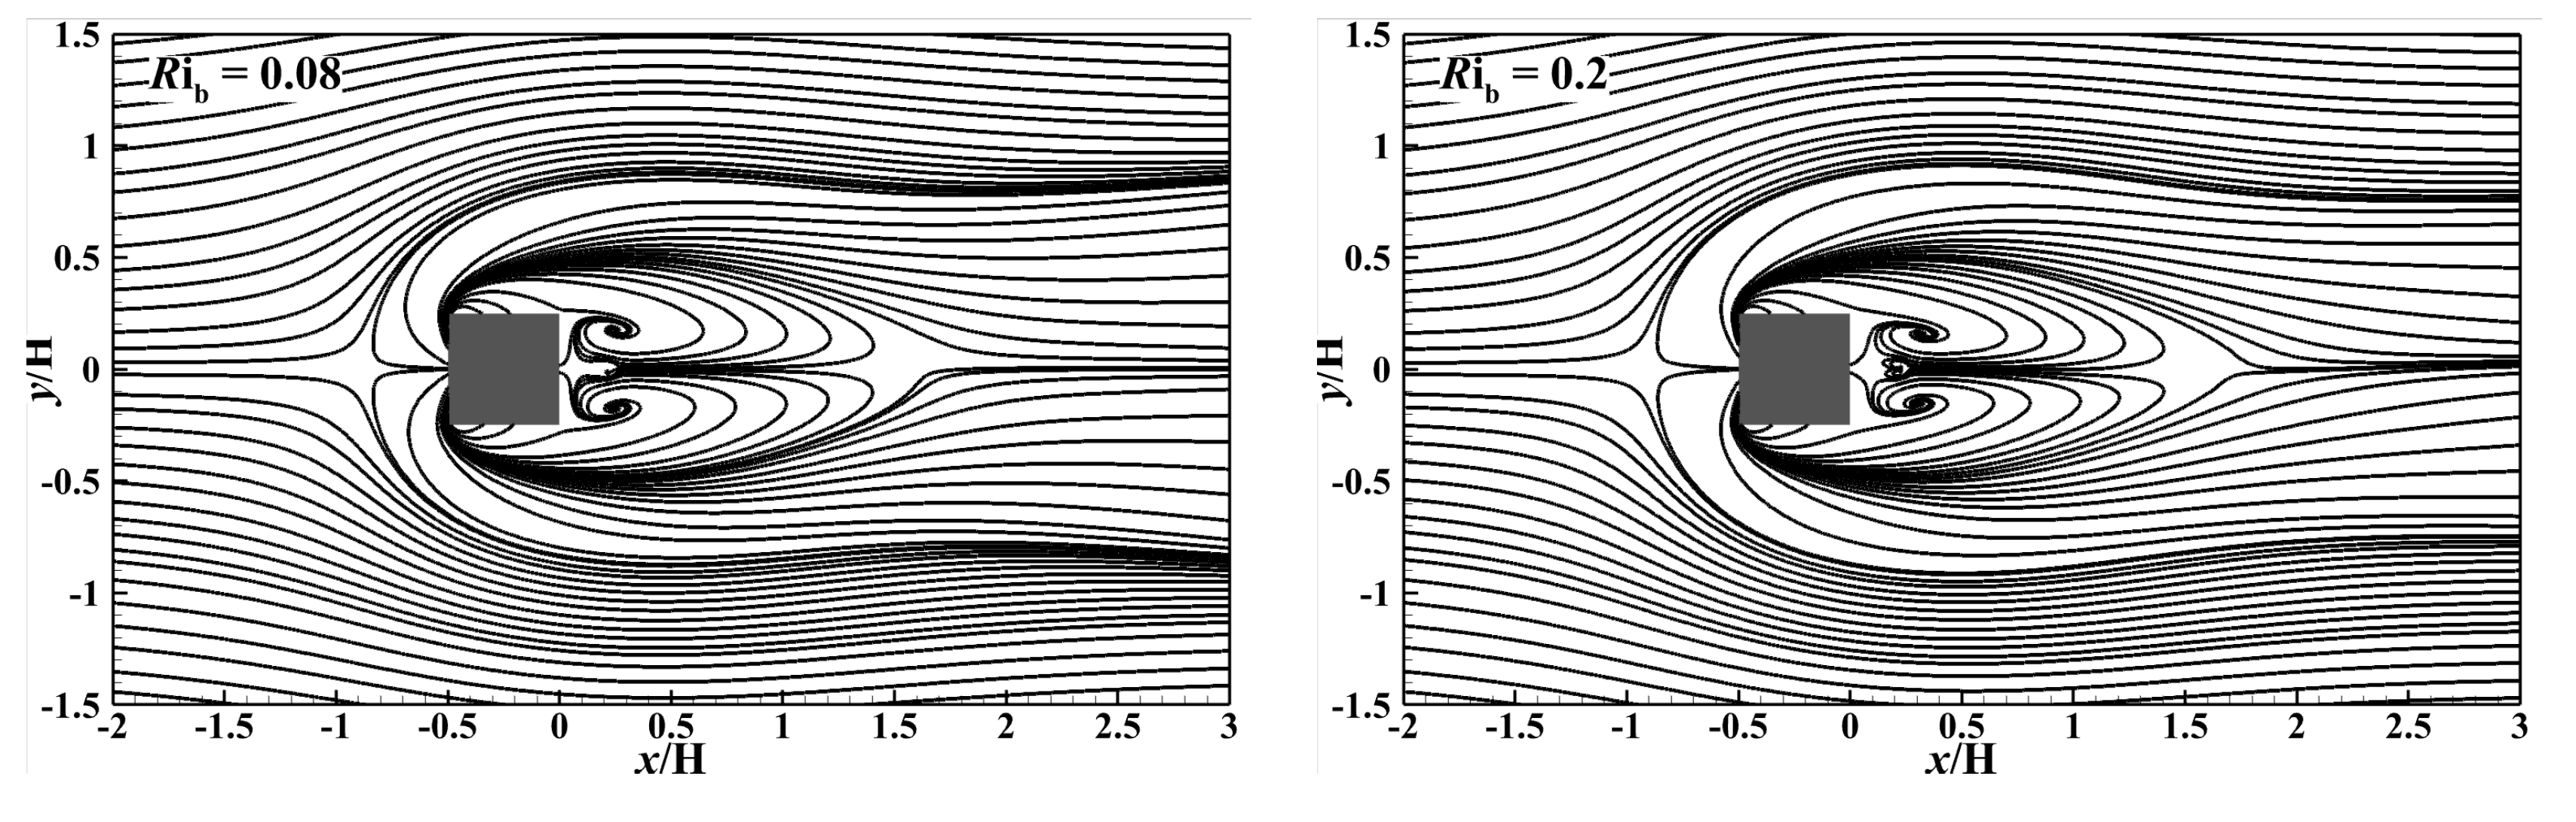
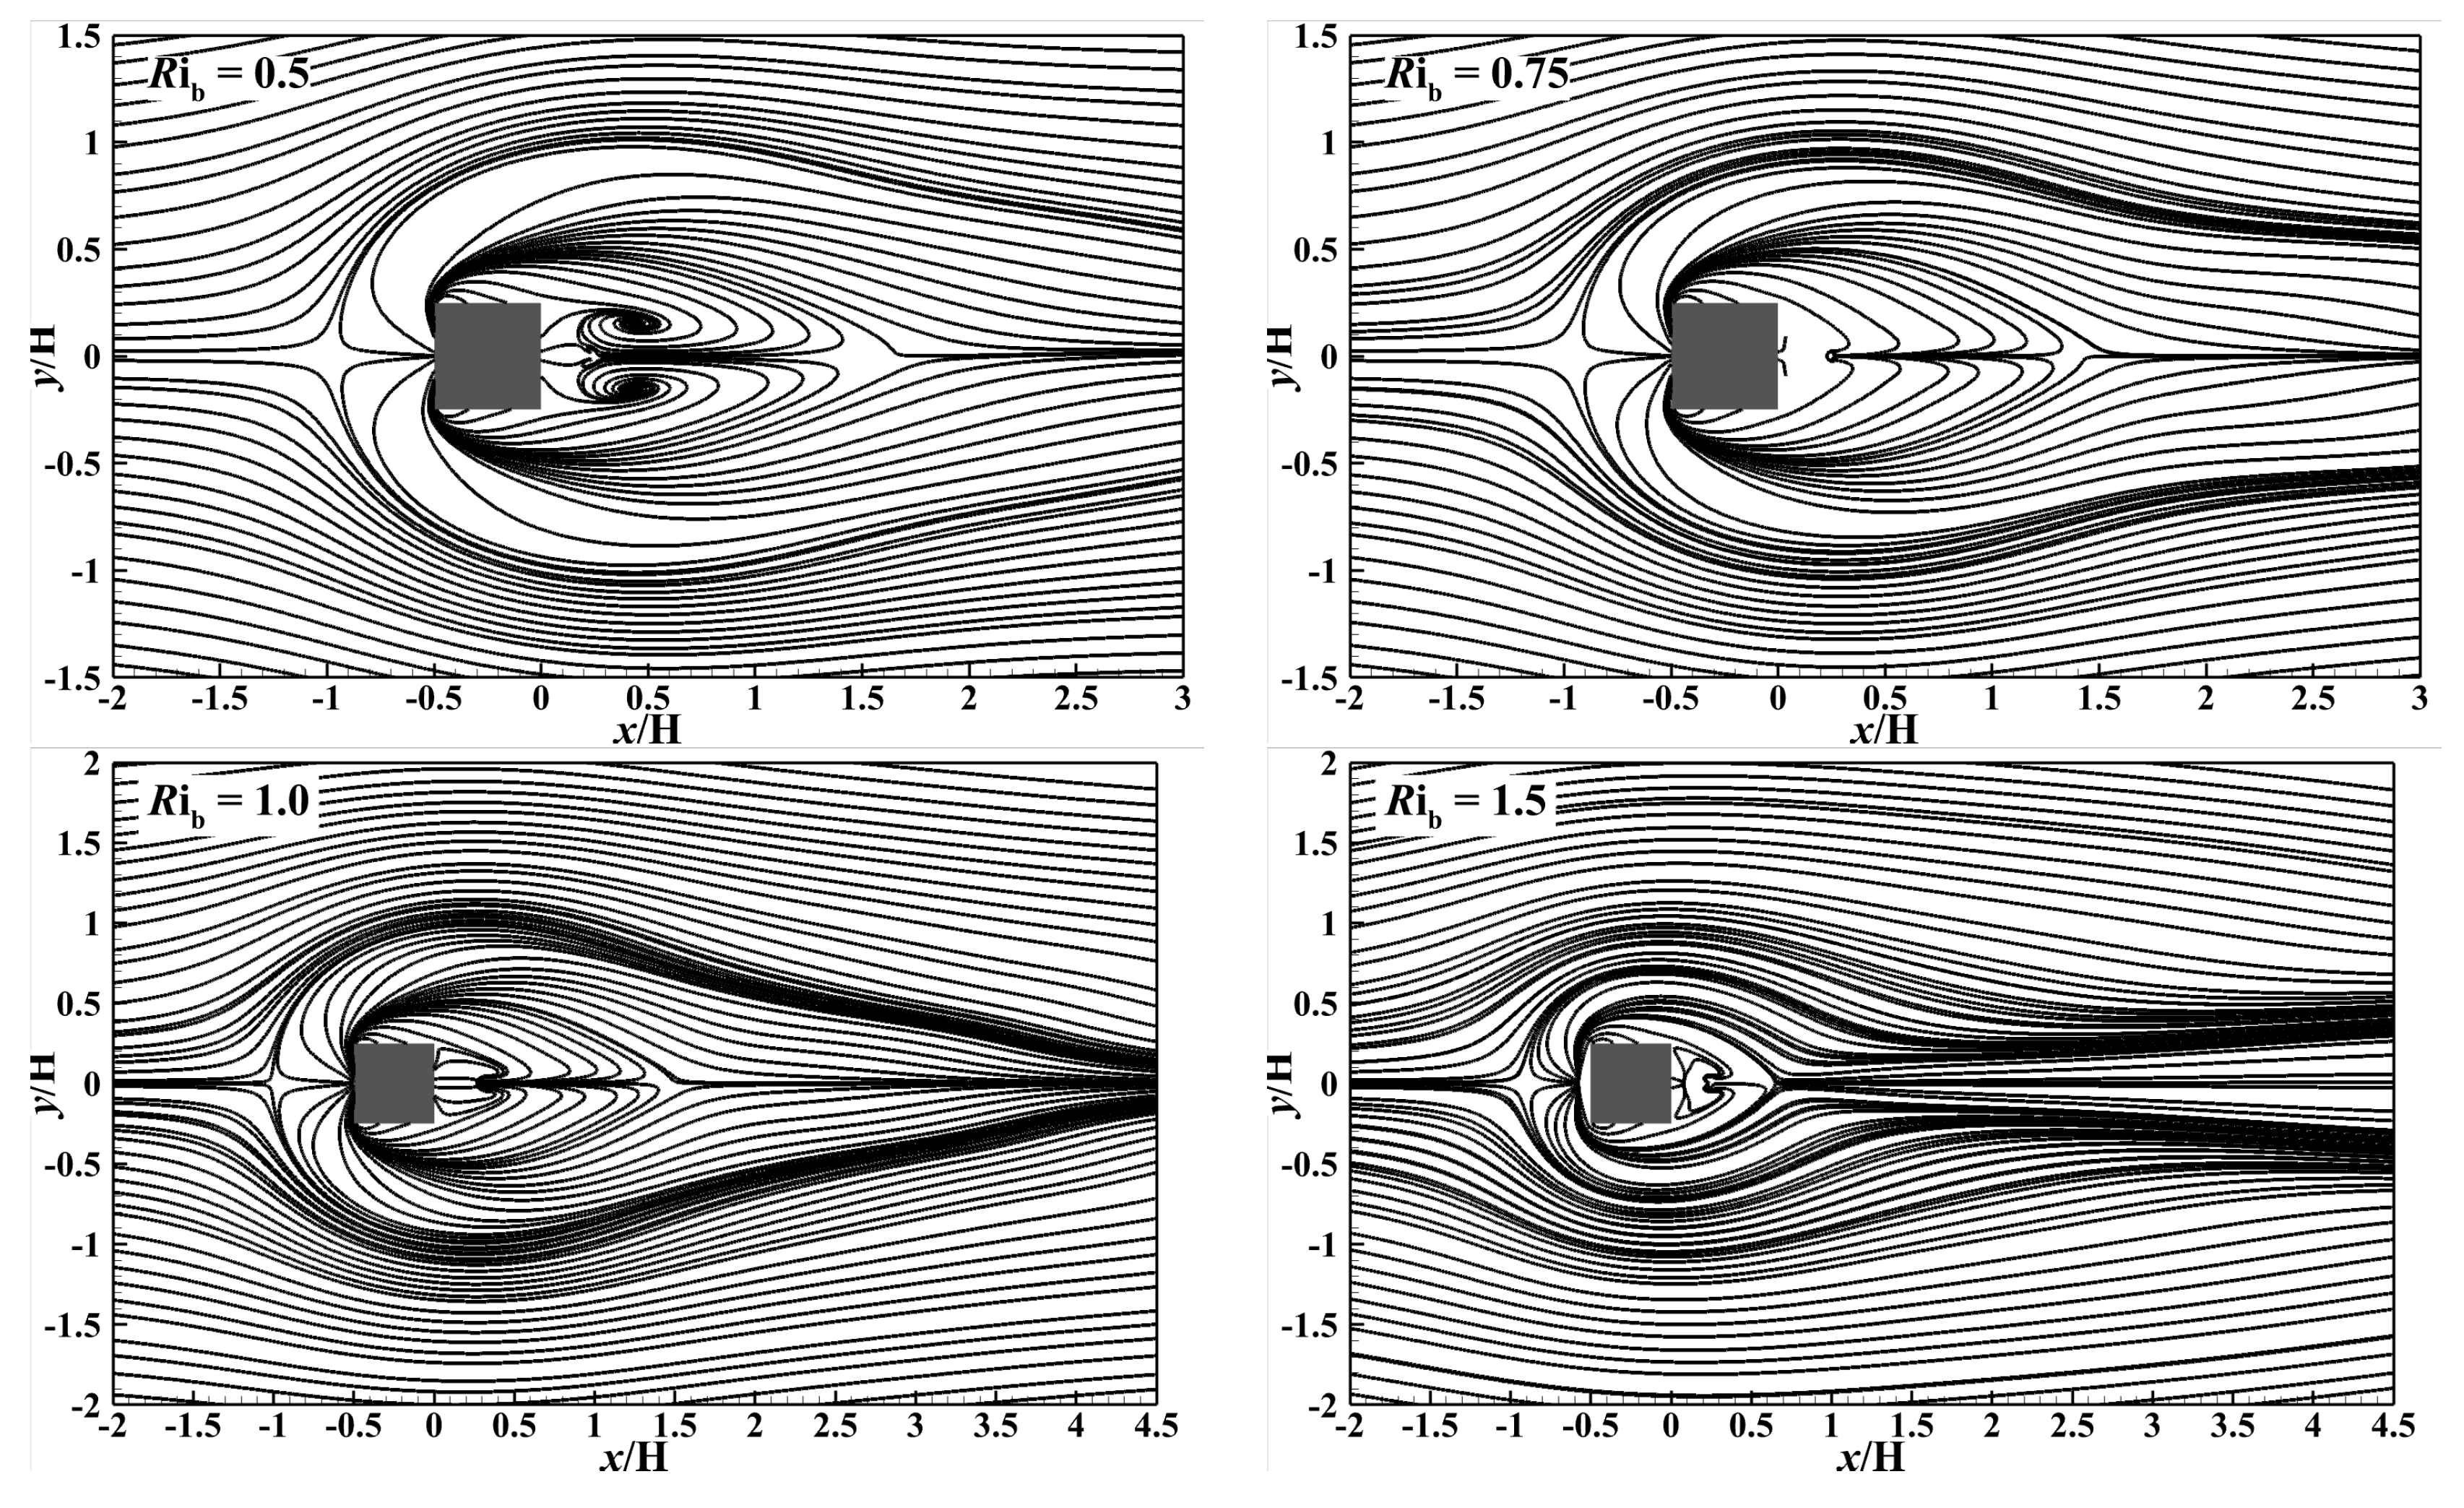
Figure 8 and Figure 9 show streamlines around the building for different Rib values at y/H = 0 and z/H = 0.025, respectively. As seen from Figure 8 and Figure 9, when Rib = 0.08, the height of the static stagnation point in front of the building is approximately 0.6 H, the reattached length of the wake on the leeward side of the building is 1.4 H, a vortex is generated in the backflow area behind the building and a small cavity is also generated under the leeward side of the building. The range of the horizontal direction affected by the disturbance of the building is approximately 1.6 H. When Rib = 0.2, the static stagnation point in front of the building moves upward and reaches 0.8 H, the length of the wake area on the leeward side increases to 1.7 H and the range of the horizontal direction affected by building-induced disturbances increases to 1.8 H. When Rib = 0.5~1.0, the strong stable stratification inhibits the flow movement, and a laminar flow pattern appears. The transition between the two mechanisms occurrs near Rib = 0.2. The airflow pattern changes near the building, the static stagnation point in front of the building moves upward, and the recirculation zone at the top of the building gradually moves backward. Meanwhile, the wake reattachment length on the leeward side of the building begins to shorten, the vortex on the leeward side gradually moves to the top of the building, the cavity area under the leeward side also gradually moves up and the influence range in the horizontal direction begins to decrease. In particular, when Rib = 1.5, the height of the static stagnation point approaches 0.9 H, the attachment length reduces to 0.5 H, the height of the vortex on the leeward side is the highest, the cavity area reduces, and the influence range in the horizontal direction reduces to 1.4 H.
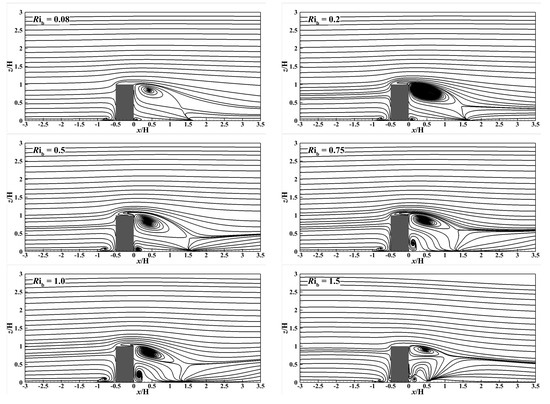
Figure 8.
Streamlines in a vertical section (y/H = 0) for various Rib values.
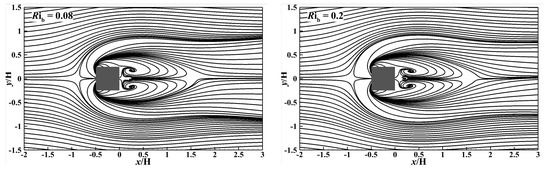
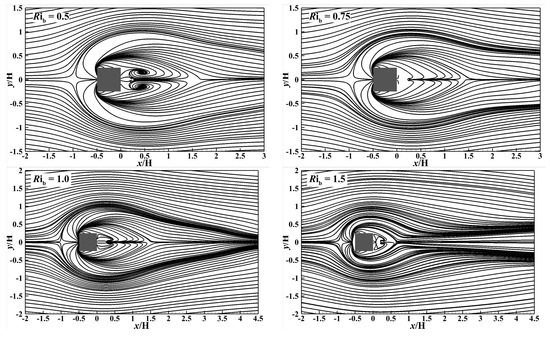
Figure 9.
Streamlines in a horizontal section (z/H = 0.025) for different values of Rib.
In summary, when Rib < 0.5, the static point front of the building moves up, and the reattachment length of the wake area on the leeward side and the disturbed range along the horizontal direction increase; when Rib ≥ 0.5, the recirculation zone located at the top of the building shifts back, and the reattachment length of the wake on the leeward side and the disturbed range in the horizontal direction show a decreasing trend. The position of the vortex in the recirculation zone on the leeward side gradually increases. CFD can be used to simulate the changes in the static stagnation point on the windward side, the top and the recirculation zone on the leeward side, and the development trend of the near wake area and the recirculation zone on the leeward side.
In conclusion, stronger ambient turbulence induces reattachment at the top of buildings and decreases the size of cavities on the leeward side. Guo et al. [17] conducted CFD simulations to study the influence of flow patterns and pollutant dispersion in buildings for various thermal stratifications. Zhang et al. [27] carried out experiments and performed simulations to explore the flow patterns affected by buildings for various thermal stratifications. The results revealed that strong stable stratification inhibits the development of turbulent kinetic energy. Meanwhile, it was found that the leeward side exhibits a shorter length of the recirculation zone. The results in this paper show that as Rib increases, the recirculation zone on the leeward side first expands and then diminishes.
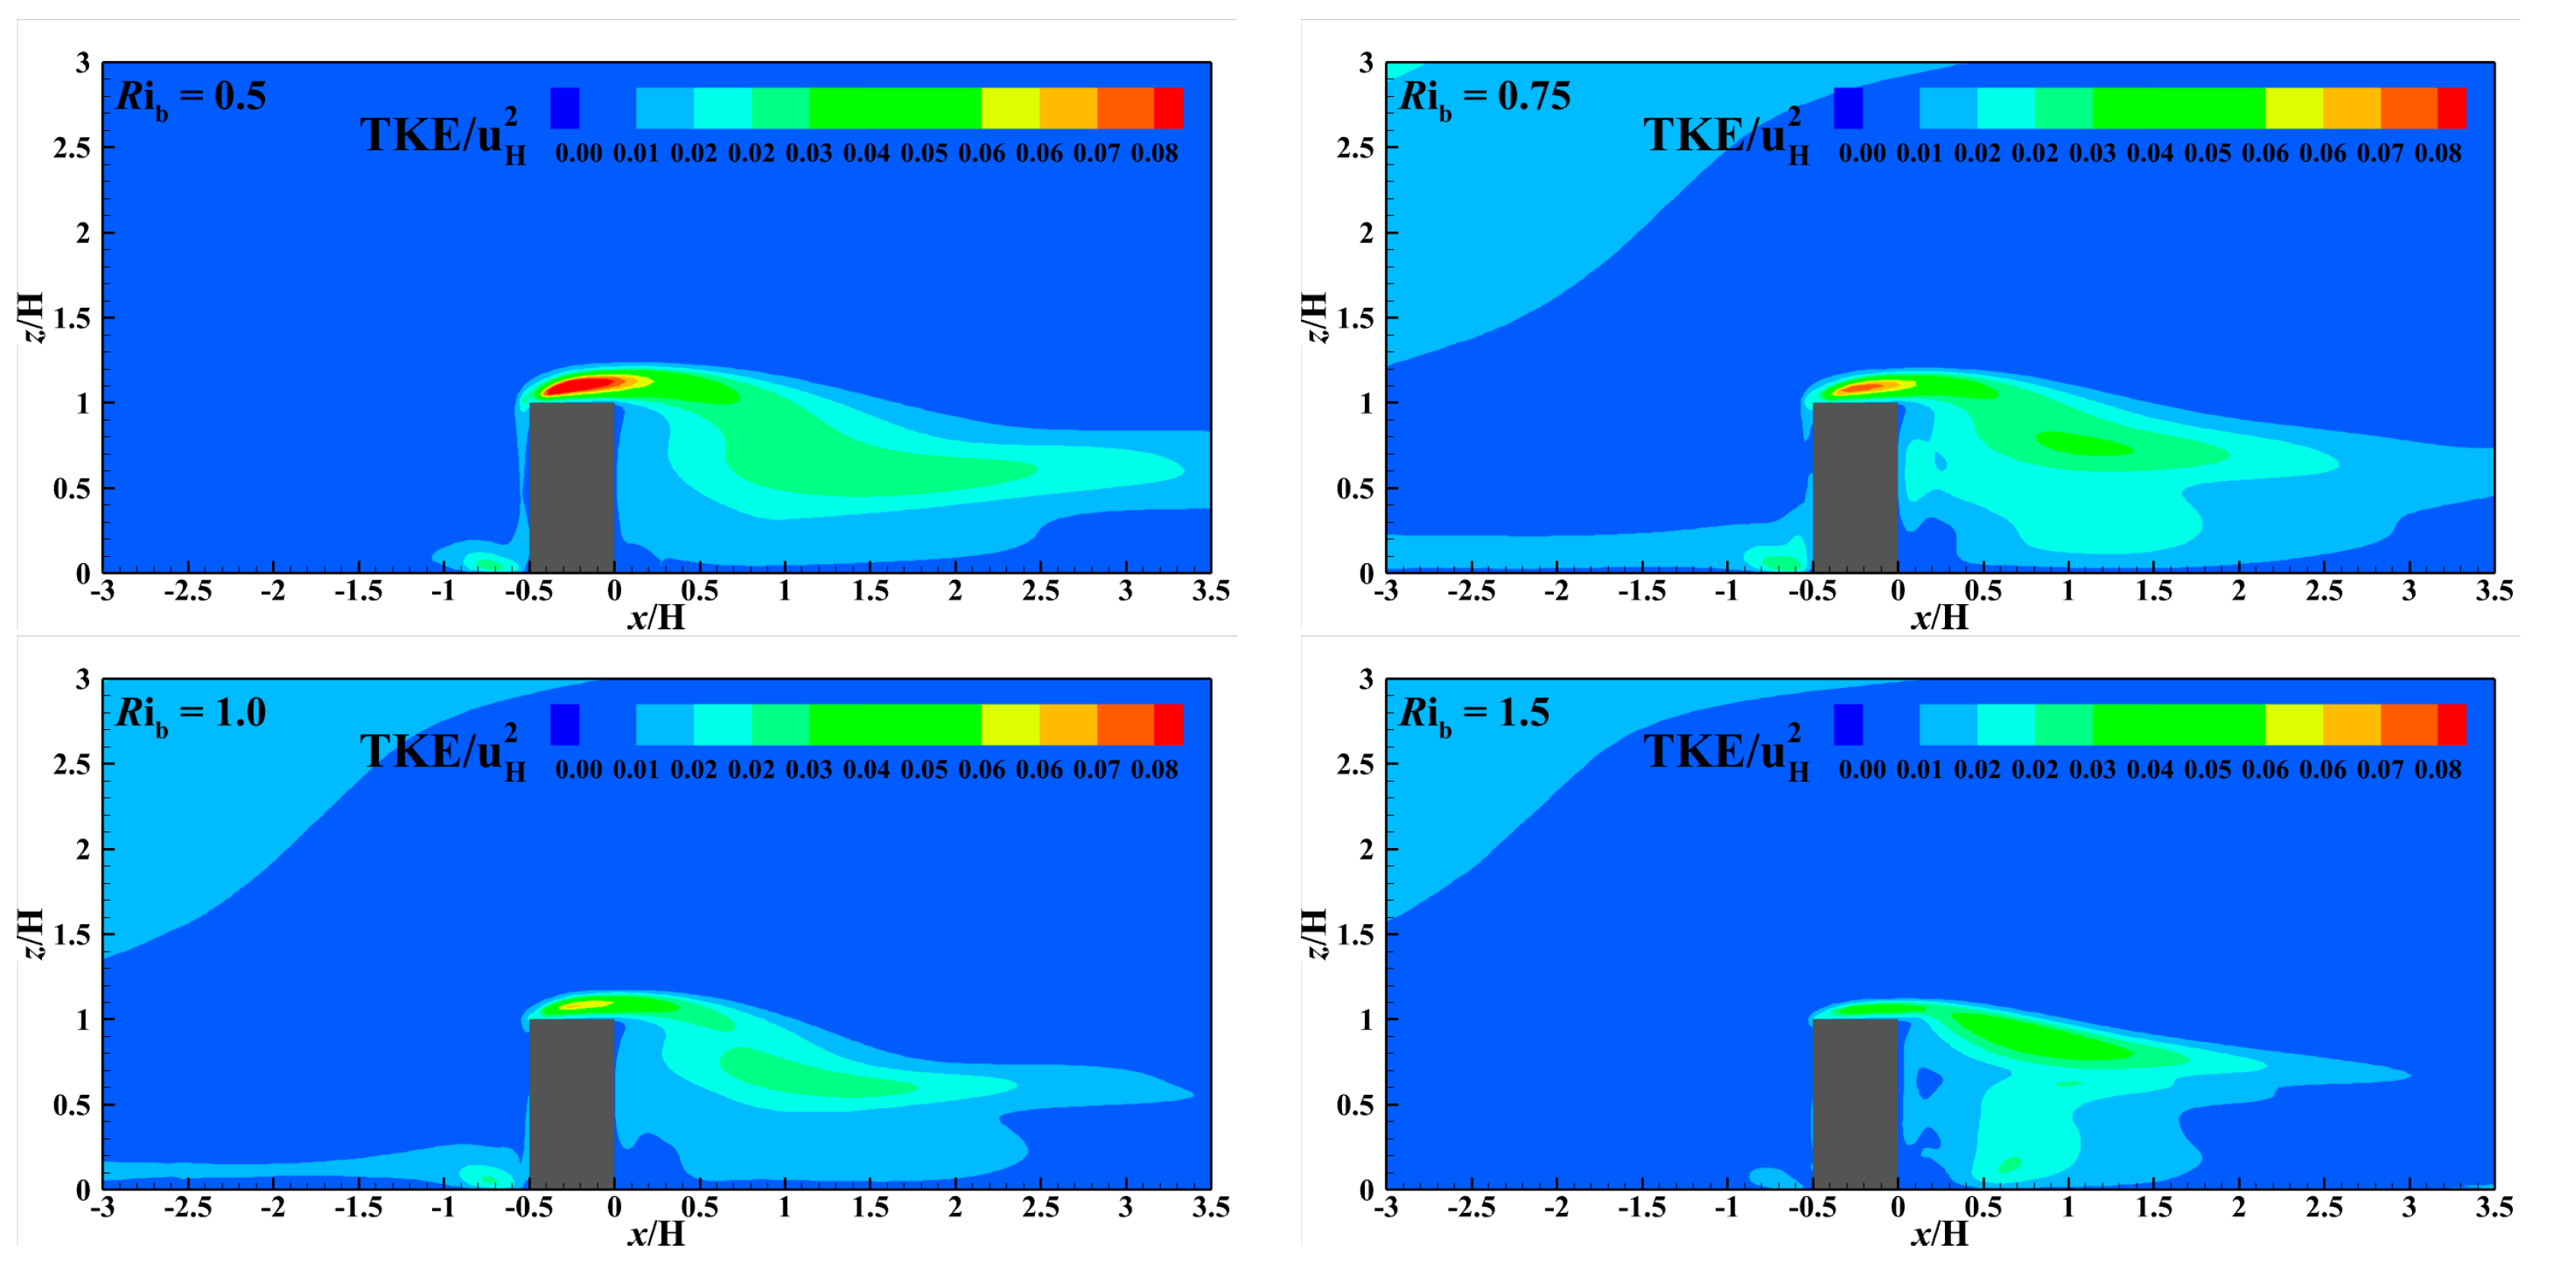
5.2. Turbulent Kinetic Energy TKE/uH2
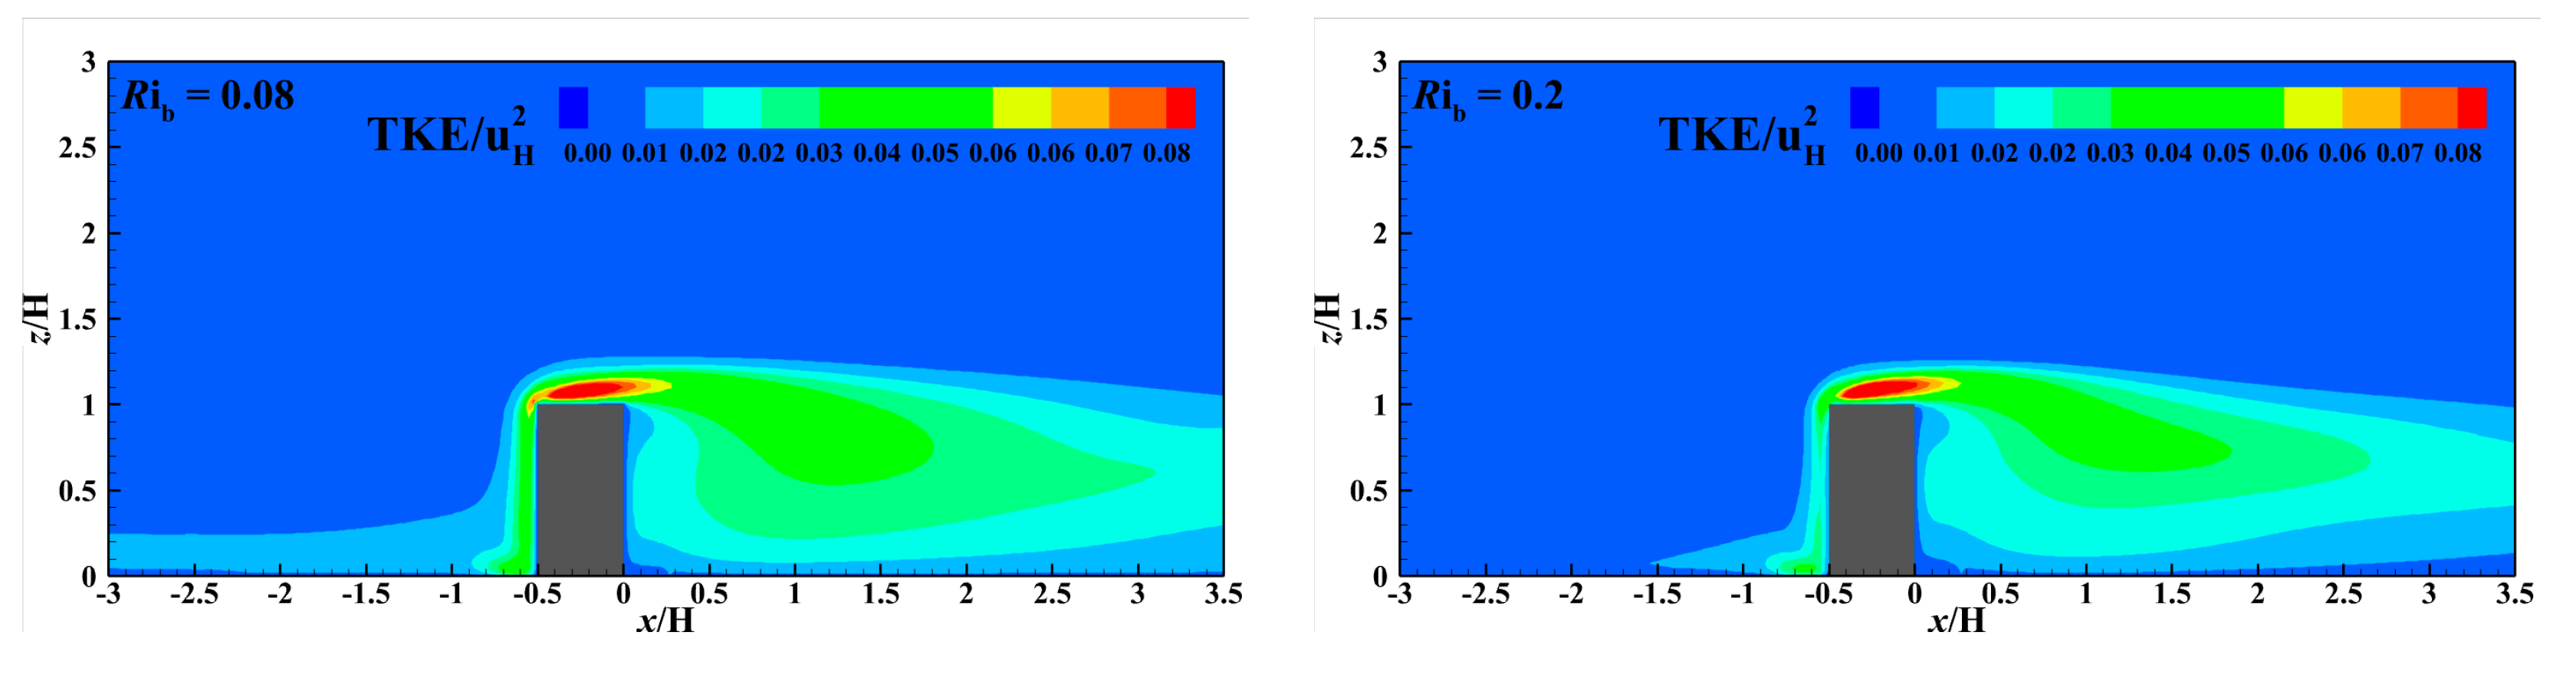
Figure 10 shows the influence of buildings on normalized TKE (TKE/uH2) for various Rib values. It is observed that the region with high TKE/uH2 values surrounding the building is predominantly concentrated in the windward corner of the building. When Rib = 0.08~0.5, the TKE/uH2 distribution around the building changes significantly. In particular, the TKE/uH2 in the cavity area decreases significantly. When Rib increases from 0.5 to 1.5, the buoyancy generated by the strong stable stratification plays a dominant role, suppressing the vertical turbulent motion and reducing the TKE/uH2 in the wake area of the leeward side, while the high TKE/uH2 area in the leeward side and the recirculation zone gradually disappear with increasing Rib.
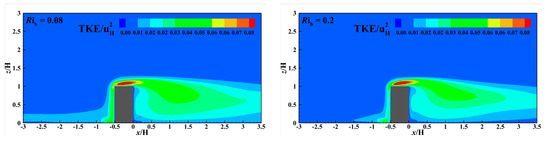

Figure 10.
Vertical profile (y/H = 0) of turbulent kinetic energy (TKE/uH2).
5.3. Concentration Field
Figure 11 illustrates the normalized vertical distribution of the pollutant concentration at different positions along the central axis. It is observed that when z/H < 0.8 and x/H = 0.125, Rib = 0.08~0.2. Due to the influence of strong mechanical turbulence, the maximum ground concentration is the same, and the height of the peak concentration value in the center of the plume is also basically the same. When Rib = 0.5, the thermal stratification slightly affects the pollutant dispersion, and the ground concentration value decreases. When Rib = 0.75~1.0, the ground concentration decreases further; however, the height of the peak concentration in the center of the plume increases. When Rib = 1.5, the plume center concentration increases. When x/H = 0.25~0.375 and Rib = 0.08~1.0, the ground concentration and plume height gradually increases; however, when Rib = 1.5, the ground concentration decreases. When x/H= 0.5~1.5, the airflow gradually breaks away from the influence of the building and returns to the inflow state, and the change in the pollutant concentration under different Rib tends to be stable. When Rib = 0.08~0.5, the ground concentration increases, and when Rib = 0.75~1.5, the ground concentration decreases. When z/H > 0.8, with the increase in Rib, the height of the plume gradually decreases at different downwind distances.
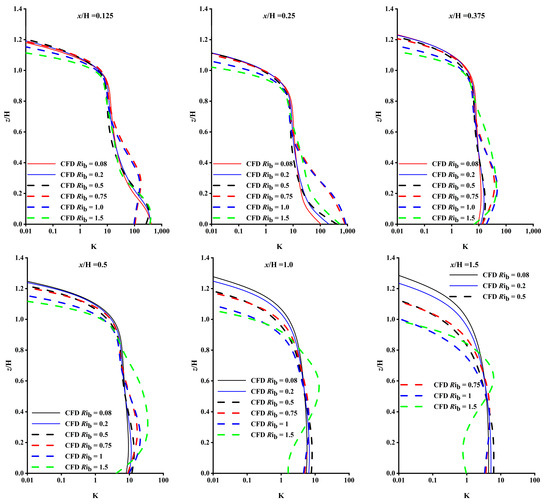
Figure 11.
Normalized concentration K at different locations on the leeward side.
Comprehensive analysis showed that with increasing Rib, the vertical distribution range of the plume decreased, and the height of the peak concentration in the center of the plume gradually increased. Meanwhile, the ground concentration rose initially and then decreased. This is because vertical motion is inhibited under a strong stable stratification atmosphere, and the influence of thermal stability increases the concentration of pollutants in the wake zone.
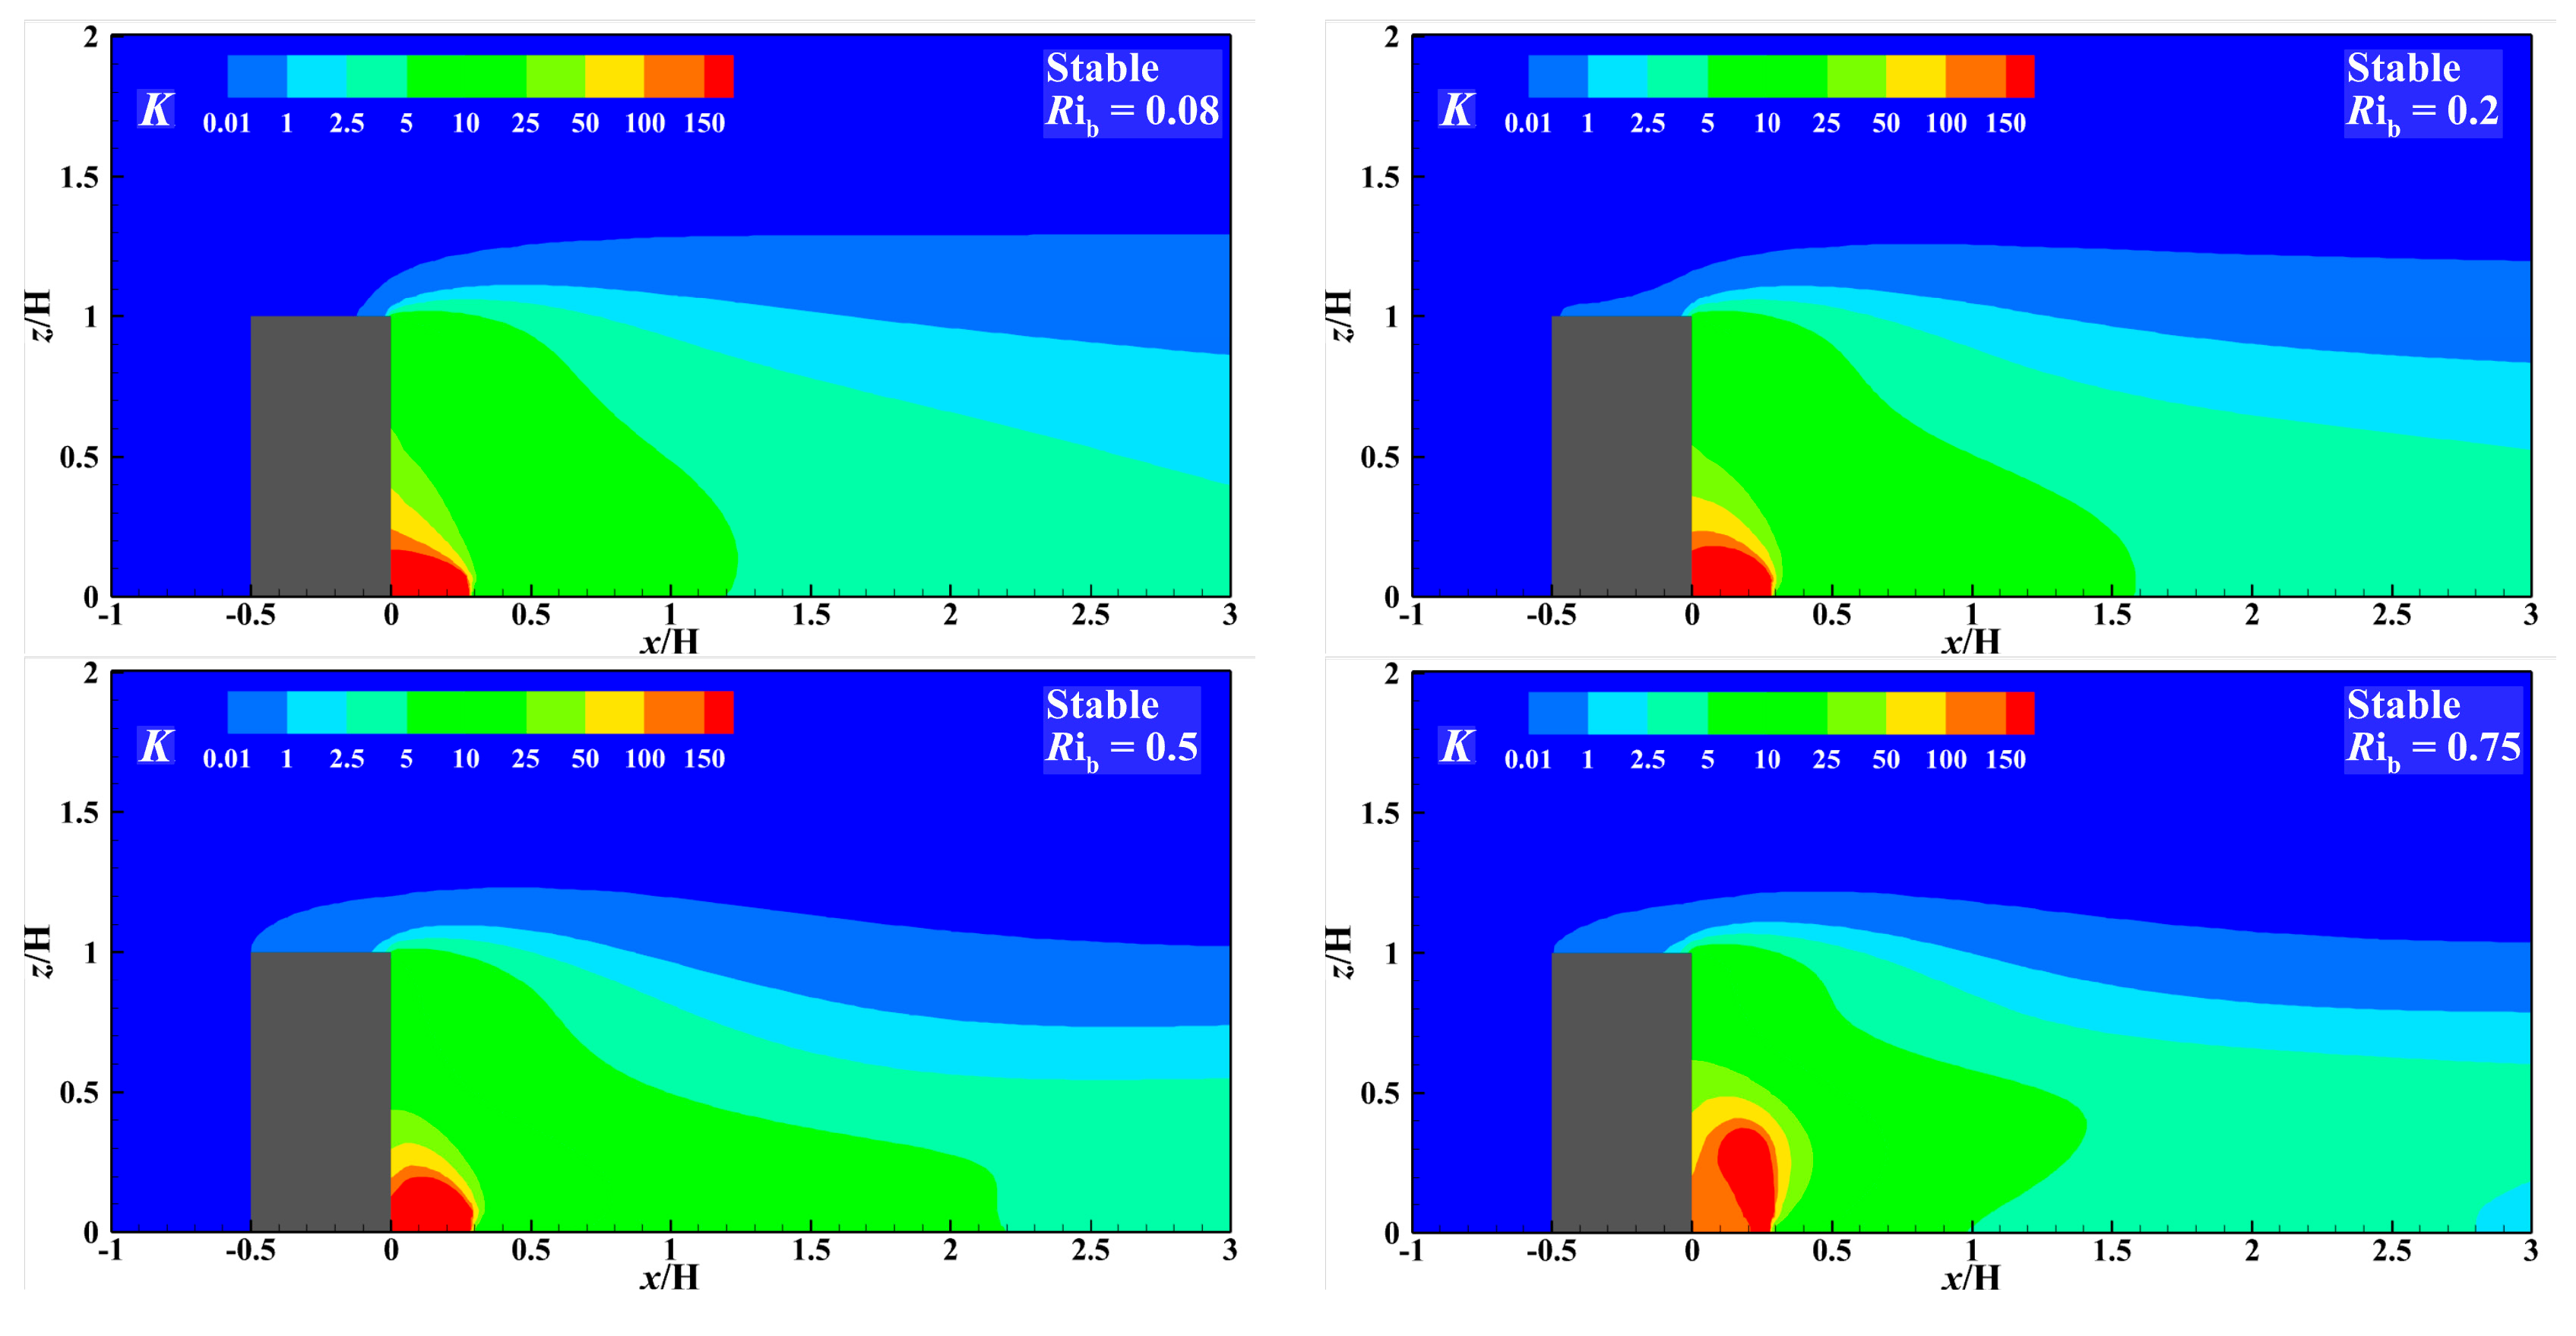
Figure 12 demonstrates that at z/H = 0.025, as the Rib increases from 0.08 to 0.75, the ground concentration range decreases along the horizontal direction, while it increases perpendicular along the y direction. In particular, at Rib = 1.5, the area with high pollutant concentrations is larger than that at Rib = 0.75, and this high-concentration region is predominantly situated near the leeward side. This is because, under the strong stable stratification, a small return cavity area is formed under the leeward side, and pollutants are adhered near the leeward, resulting in an increase in the near-ground concentration of the building.
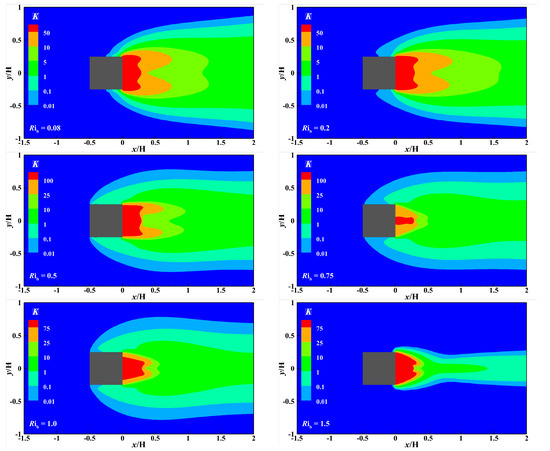
Figure 12.
Horizontal profile (z/H = 0.025) of normalized concentration K around the building.
Figure 13 illustrates that along the vertical direction (y = 0), the peak concentration near the emission source gradually shifts from the upwind side to the downwind side, the central axis of the plume gradually reduces and the plume height gradually tilts to the ground. This observation may be attributed to the presence of strong stable stratification, which creates a backflow cavity below the leeward side, preventing pollutants from diffusing upwind.
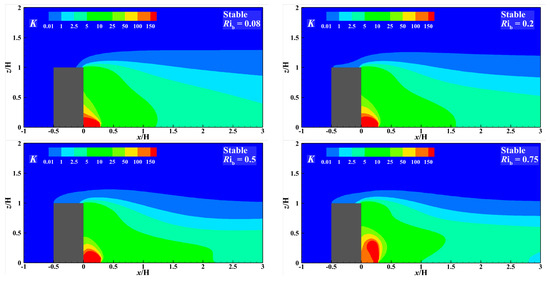
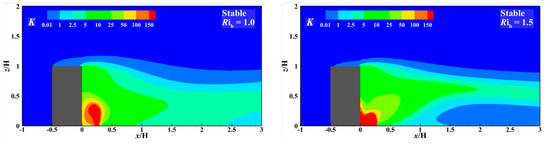
Figure 13.
Vertical profile (y/H = 0) of normalized concentration K around the building.
Figure 12 and Figure 13 show the pollutant diffusion results for various values of Rib at y/H = 0 and z/H = 0.025. It is observed that when Rib decreases from 0.2 to 0.08, there is little difference in the concentration change around the building. When Rib increases from 0.5 to 1.5, due to significant changes in the flow, turbulence is greatly inhibited, and the diffusion of pollutants also changes greatly. Strong stable stratification inhibited the pollutant dispersion and reduced the plume spread range, and the pollutants remained on the leeward side. Horizontally, the plume width decreased as Rib increased, and the region with high concentrations gradually shifted toward the leeward side. When Rib = 1.5, the more stable the stratification is, the more obvious the reduction in turbulence. The disappearance of the backflow cavity on the top and windward sides results in a sharp decrease in vertical and lateral diffusion and an increase in the concentration of pollutants on the ground. Influenced by the flow field, pollutants adhere to the leeward wall of the building.
In summary, when Rib = 0.08~0.5, the flow around the building is strongly affected by the wind shear force, resulting in a vortex dominated by mechanical turbulence, which causes the horizontal diffusion of pollutants. When Rib ≥ 0.75, the thermal turbulence generated by temperature plays a leading role and inhibits the development of mechanical turbulence under stable stratification, causing pollutants near the wall to move closer to the leeward side, adhere to the leeward side, and be affected by buoyancy. The high-concentration area of pollutants downwind of buildings is mainly concentrated near the height of z/H = 0.6.
6. Conclusions
The present study investigates the effects of the flow patterns and pollutant dispersion around buildings for various Rib values. The main achievements can be summarized as follows:
When Rib = 0.08, 0.2 and 1.5, the heights of the stagnation points in front of the building are 0.6 H, 0.8 H and 0.9 H, respectively. The lengths of the wake reattachment on the leeward side of the building are 1.4 H, 1.7 H and 0.5 H, respectively. The range of the horizontal flow field affected by the tall building is 1.6 H, 1.8 H and 1.4 H, respectively. When Rib > 0.2, the buoyancy generated by the stable stratification inhibits the airflow movement around the building. Accordingly, temperature stratification significantly affects the flow pattern. As Rib increases, the static point on the windward side and the vortex position in the recirculation zone on the leeward side gradually move to the upper part of the building, the length of the recirculation zone on the leeward side first increases and then decreases and the influence range of the disturbance in the horizontal direction first increases and then decreases.
The high TKE/uH2 area around the building is mainly located on the top of the building, and the recirculation zone is downwind. When Rib ranges from 0.08 to 0.5, the TKE/uH2 in the cavity area around the building significantly decreases. When Rib increases from 0.5 to 1.5, the high TKE/uH2 area in the leeward side and the recirculation zone gradually disappear.
With the increase in Rib, the concentration of ground pollutants first increased and then decreased, the height of the plume gradually reduced and the height of the peak concentration of the plume center raised. When Rib = 0.08~0.5, the flow around the building is strongly affected by the wind shear force, resulting in a vortex dominated by mechanical turbulence, which causes the horizontal diffusion of pollutants. When Rib ≥ 0.75, stable stratification suppresses the development of mechanical turbulence, causing pollutants near the wall to move closer to the leeward side and adhere to the leeward sidewall of the building. Additionally, affected by buoyancy, the high concentration area of pollutants downwind of the building is mainly concentrated near the height of z/H = 0.6.
Author Contributions
Conceptualization, R.L.; methodology, Y.L.; software, R.L.; validation, J.Z.; formal analysis, Y.L.; investigation, Y.P.; resources, J.Z.; data curation, R.L.; writing—original draft preparation, Y.L.; writing—review and editing, D.G. and D.W.; visualization, Y.L.; supervision, Y.P. and R.Y.; project administration, D.W.; funding acquisition, D.G. All authors have read and agreed to the published version of the manuscript.
Funding
This research was funded by the National Natural Science Foundation of China (U21A20524) and supported by the special fund for Science and Technology Innovation Teams of Shanxi Province (202204051002026).
Institutional Review Board Statement
Not applicable.
Informed Consent Statement
Not applicable.
Data Availability Statement
The data presented in this study are available on request from the corresponding author. The data are not publicly available due to privacy.
Conflicts of Interest
The authors declare no conflicts of interest.
Nomenclature
Description of symbols
| velocity vector | viscous stress tensor | ||
| density | specific heat at a constant pressure | ||
| pressure | thermal conductivity | ||
| mass fraction | diffusion coefficient of | ||
| temperature | Velocity | ||
| friction velocity | height | ||
| ground roughness | reference height | ||
| potential temperature | Monin–Obukhov length | ||
| temperature scale | ground sensible heat flux | ||
| average flow velocity at the reference height | kinematic viscosity coefficient |
References
- White, B.R.; Stein, W. Wind-tunnel studies of variable stack heights for a low-profile building. J. Wind. Eng. Ind. Aerodyn. 1990, 36, 675–687. [Google Scholar] [CrossRef]
- Wilson, D.J.; Fabris, I.; Ackerman, M.Y. Measuring adjacent building effects on laboratory exhaust stack design. Trans.-Am. Soc. Heat. Refrig. Air Cond. Eng. 1998, 104, 1012–1030. [Google Scholar]
- Chavez, M.; Hajra, B.; Stathopoulos, T.; Bahloul, A. Near-field pollutant dispersion in the built environment by CFD and wind tunnel simulations. J. Wind. Eng. Ind. Aerodyn. 2011, 99, 330–339. [Google Scholar] [CrossRef]
- Tominaga, Y.; Stathopoulos, T. CFD simulation of near-field pollutant dispersion in the urban environment: A review of current modeling techniques. Atmos. Environ. 2013, 79, 716–730. [Google Scholar] [CrossRef]
- Vardoulakis, S.; Fisher, B.E.A.; Pericleous, K.; Gonzalez-Flesca, N. Modeling air quality in street canyons: A review. Atmos. Environ. 2003, 37, 155–182. [Google Scholar] [CrossRef]
- Yassin, M.F. A wind tunnel study on the effect of thermal stability on flow and dispersion of rooftop stack emissions in the near wake of a building. Atmos. Environ. 2013, 65, 89–100. [Google Scholar] [CrossRef]
- Mavroidis, I.; Griffiths, R.F.; Hall, D.J. Field and wind tunnel investigations of plume dispersion around single surface obstacles. Atmos. Environ. 2003, 37, 2903–2918. [Google Scholar] [CrossRef]
- Uehara, K.; Murakami, S.; Oikawa, S.; Wakamatsu, S. Wind tunnel experiments on how thermal stratification affects flow in and above urban street canyons. Atmos. Environ. 2000, 34, 1553–1562. [Google Scholar] [CrossRef]
- Ohya, Y. Wind-tunnel study of atmospheric stable boundary layers over a rough surface. Bound.-Layer. Meteorol. 2001, 98, 57–82. [Google Scholar] [CrossRef]
- Ohya, Y.; Nakamura, R.; Uchida, T. Intermittent bursting of turbulence in a stable boundary layer with low-level jet. Bound.-Layer. Meteorol. 2008, 126, 349–363. [Google Scholar] [CrossRef]
- Olvera, H.A.; Choudhuri, A.R. Numerical simulation of hydrogen dispersion in the vicinity of a cubical building in stable stratified atmospheres. Int. J. Hydrogen Energy 2006, 31, 2356–2369. [Google Scholar] [CrossRef]
- Nakamura, Y.; Oke, T.R. Wind, temperature and stability conditions in an east-west oriented urban canyon. Atmos. Environ. 1988, 22, 2691–2700. [Google Scholar] [CrossRef]
- Rotach, M.W. Profiles of turbulence statistics in and above an urban street canyon. Atmos. Environ. 1995, 29, 1473–1486. [Google Scholar] [CrossRef]
- Ma, H.; Zhou, X.; Tominaga, Y.; Gu, M. CFD simulation of flow fields and pollutant dispersion around a cubic building considering the effect of plume buoyancies. Build. Environ. 2022, 208, 108640. [Google Scholar] [CrossRef]
- Jeong, S.J.; Kim, A.R. CFD Study on the influence of atmospheric stability on near-field pollutant dispersion from rooftop emissions. Asian J. Atmos. Environ. 2018, 12, 47–58. [Google Scholar] [CrossRef]
- Guo, D.; Wang, R.; Zhao, P.; Li, Y.; Yao, R.; Liu, Y. Numerical simulation of the influence of flow field around buildings under temperature formation. Radiat. Prot. 2020, 40, 290–300. [Google Scholar]
- Guo, D.; Yang, F.; Shi, X.; Li, Y.; Yao, R. Numerical simulation and wind tunnel experiments on the effect of a cubic building on the flow and pollutant diffusion under stable stratification. Build. Environ. 2021, 205, 108222. [Google Scholar] [CrossRef]
- Shi, X.; Guo, D.; Li, Y.; Yao, R. Numerical simulation of the influence of building objects on flow field under stable stratification. Radiat. Prot. 2022, 42, 317–325. [Google Scholar]
- Bazdidi-Tehrani, F.; Gholamalipour, P.; Kiamansouri, M.; Jadidi, M. Large eddy simulation of thermal stratification effect on convective and turbulent diffusion fluxes concerning gaseous pollutant dispersion around a high-rise model building. J. Build. Perform. Simul. 2019, 12, 97–116. [Google Scholar] [CrossRef]
- Rahmatmand, A.; Yaghoubi, M.; Rad, E.G.; Tavakol, M.M. 3D experimental and numerical analysis of wind flow around domed-roof buildings with open and closed apertures. Build. Simulat. 2014, 7, 305–319. [Google Scholar] [CrossRef]
- Tavakol, M.M.; Yaghoubi, M.; Motlagh, M.M. Air flow aerodynamic on a wallmounted hemisphere for various turbulent boundary layers. Exp. Therm. Fluid. Sci. 2010, 34, 538–553. [Google Scholar] [CrossRef]
- Ntinas, G.K.; Zhang, G.; Fragos, V.P.; Bochtis, D.D.; Nikita-Martzopoulou, C. Airflow patterns around obstacles with arched and pitched roofs: Wind tunnel measurements and direct simulation. Eur. J. Mech. B Fluid. 2014, 43, 216–229. [Google Scholar] [CrossRef]
- Patankar, S.V.; Spalding, D.B. A calculation procedure for heat, mass and momentum transfer in three-dimensional parabolic flows. J. Heat Mass Transf. 1972, 15, 1787–1806. [Google Scholar] [CrossRef]
- Tominaga, Y.; Mochida, A.; Yoshie, R.; Kataoka, H.; Nozu, T.; Yoshikawa, M.; Shirasawa, T. AIJ guidelines for practical applications of CFD to pedestrian wind environment around buildings. J. Wind. Eng. Ind. Aerodyn. 2008, 96, 1749–1761. [Google Scholar] [CrossRef]
- Tominaga, Y.; Stathopoulos, T. Numerical simulation of dispersion around an isolated cubic building: Comparison of various types of k–ɛ models. Atmos. Environ. 2009, 43, 3200–3210. [Google Scholar] [CrossRef]
- Santos, J.M.; Reis, N.C., Jr.; Goulart, E.V.; Mavroidis, I. Numerical simulation of flow and dispersion around an isolated cubical building: The effect of the atmospheric stratification. Atmos. Environ. 2009, 43, 5484–5492. [Google Scholar] [CrossRef]
- Zhang, Y.Q.; Arya, S.P.; Snyder, W.H. A comparison of numerical and physical modeling of stable atmospheric flow and dispersion around a cubical building. Atmos. Environ. 1996, 30, 1327–1345. [Google Scholar] [CrossRef]


Disclaimer/Publisher’s Note: The statements, opinions and data contained in all publications are solely those of the individual author(s) and contributor(s) and not of MDPI and/or the editor(s). MDPI and/or the editor(s) disclaim responsibility for any injury to people or property resulting from any ideas, methods, instructions or products referred to in the content. |
© 2023 by the authors. Licensee MDPI, Basel, Switzerland. This article is an open access article distributed under the terms and conditions of the Creative Commons Attribution (CC BY) license (https://creativecommons.org/licenses/by/4.0/).