Article

Relationship between Greenhouse Gas Budget and Soil Carbon Storage Measured on Site in Zhalainuoer Grassland Mining Area

School of Environment Science and Spatial Informatics, China University of Mining and Technology, Xuzhou 221116, China
*
Author to whom correspondence should be addressed.
Atmosphere 2024, 15(1), 25; https://doi.org/10.3390/atmos15010025
Submission received: 24 October 2023 / Revised: 15 December 2023 / Accepted: 19 December 2023 / Published: 25 December 2023
(This article belongs to the Section Biosphere/Hydrosphere/Land–Atmosphere Interactions)

Abstract

:
Grassland has great potential for carbon sequestration; however, the relationship between carbon storage (CS) and greenhouse gas (GHG) budget and their influencing factors in the natural restoration process in grassland mining areas are rarely studied. In this study, taking Zhalainuoer mining area in Inner Mongolia as an example, the subsidence soil for 1-, 2-, 5-, 10-, and 15-year and non-subsidence soil were selected as the research objects to explore the relationship between CS and the GHG budget and their influencing factors. The results show that there is a significant negative correlation between CS and the GHG budget. Soil organic carbon storage accounts for 99% of CS. CS is positively correlated with SOM and AP, and with the bacteria Entotheonellaeota. The GHG budget is mainly affected by CO2 emission, which is positively correlated with subsidence time, plant biomass, and coverage, negatively correlated with the bacteria Actinobacteriota and Deinococcota, and positively correlated with Cyanobacteria. In summary, soil plays a major role in storing carbon. Carbon sequestration is a physiological process produced by plants and organisms. Subsidence affects soil CS by changing soil properties and thus affecting its aboveground vegetation and soil microorganisms. This study investigates the changes in soil carbon storage following subsidence caused by mining activities. The findings contribute to our understanding of the impact of mining subsidence on soil CS and can inform the development of low-carbon remediation technologies.

1. Introduction

Grassland carbon storage (CS) accounts for about one third of the global terrestrial carbon pool, following forests, plantations, and shrubs [1,2]. At the same time, the organic carbon storage of grassland will increase significantly over time [3]. Importantly, compared with the short-lived plant biomass carbon on grassland, soil carbon is capable of persisting for extended periods ranging from several years to several centuries, indicating its long-term CS capability [4]. Considering the facts discussed above, grassland has the greatest potential for organic carbon sequestration [1,3], and it is qualified as a significant soil carbon sink [2].
Reasonable grassland policy, as well as scientific measures aimed at preserving and restoring grassland ecosystems, can significantly improve its capability to function as a carbon sink and reduce emissions. Research has been conducted to examine the changes in grassland organic carbon storage (CS) and greenhouse gas (GHG) budget under different management modes [5,6,7,8,9], the effects of climate warming on GHG in grassland [10,11], and the restoration of the carbon sink potential of degraded grassland [12,13,14]. In terms of the soil CS and the GHG budget in mining areas, the carbon sequestration potential of different reclamation methods (forest/grassland) has been explored [15,16]. Most of the research is conducted from the perspective of LULC’s (the land-use/land-cover) contribution to the change in carbon storage [17,18,19], and the actual carbon storage and greenhouse gas flux in the process of natural recovery after subsidence in primary grassland mining areas are less studied.
Soil is the product of the comprehensive action of the climate, parent material, vegetation (biology), topography, and time. In addition to solid particles composed of minerals and humus, there are various animals, plants, and microorganisms. Therefore, the study of soil carbon storage and greenhouse gas budget can be further subdivided. The current research shows that soil microorganisms, as an important medium of soil carbon and the nitrogen cycle, play an important role in the carbon cycle of grassland ecosystems. On the one hand, autotrophic microorganisms can sequester CO2 in the atmosphere of the soil and increase the capacity of the soil carbon pool; on the other hand, microorganisms can transfer organic carbon in the soil into the atmosphere through respiration and decomposition. CH4 production is mainly completed by hydrogen-trophic methanogens (1/3) and acetic acid-trophic methanogens (2/3) [20]. In addition, Geotrichum can form a symbiotic and competitive relationship with methanogens and participate in the conversion of intermediate metabolites, thus promoting the production of CH4 [21]. The relationship between CS and GHG flux of soil microorganisms in the same environment is less studied.
To fill this gap, the damaged grassland in a grassland mining area was taken as an example. Its carbon storage and greenhouse gas flux were calculated with data from field sampling and detection, and the relationships between them and the soil properties, plants, and microorganisms were explored. The findings can serve as a guide for developing criteria pertaining to grassland carbon sinks and aid in our comprehension of how mining subsidence affects soil carbon sinks.

2. Materials and Methods

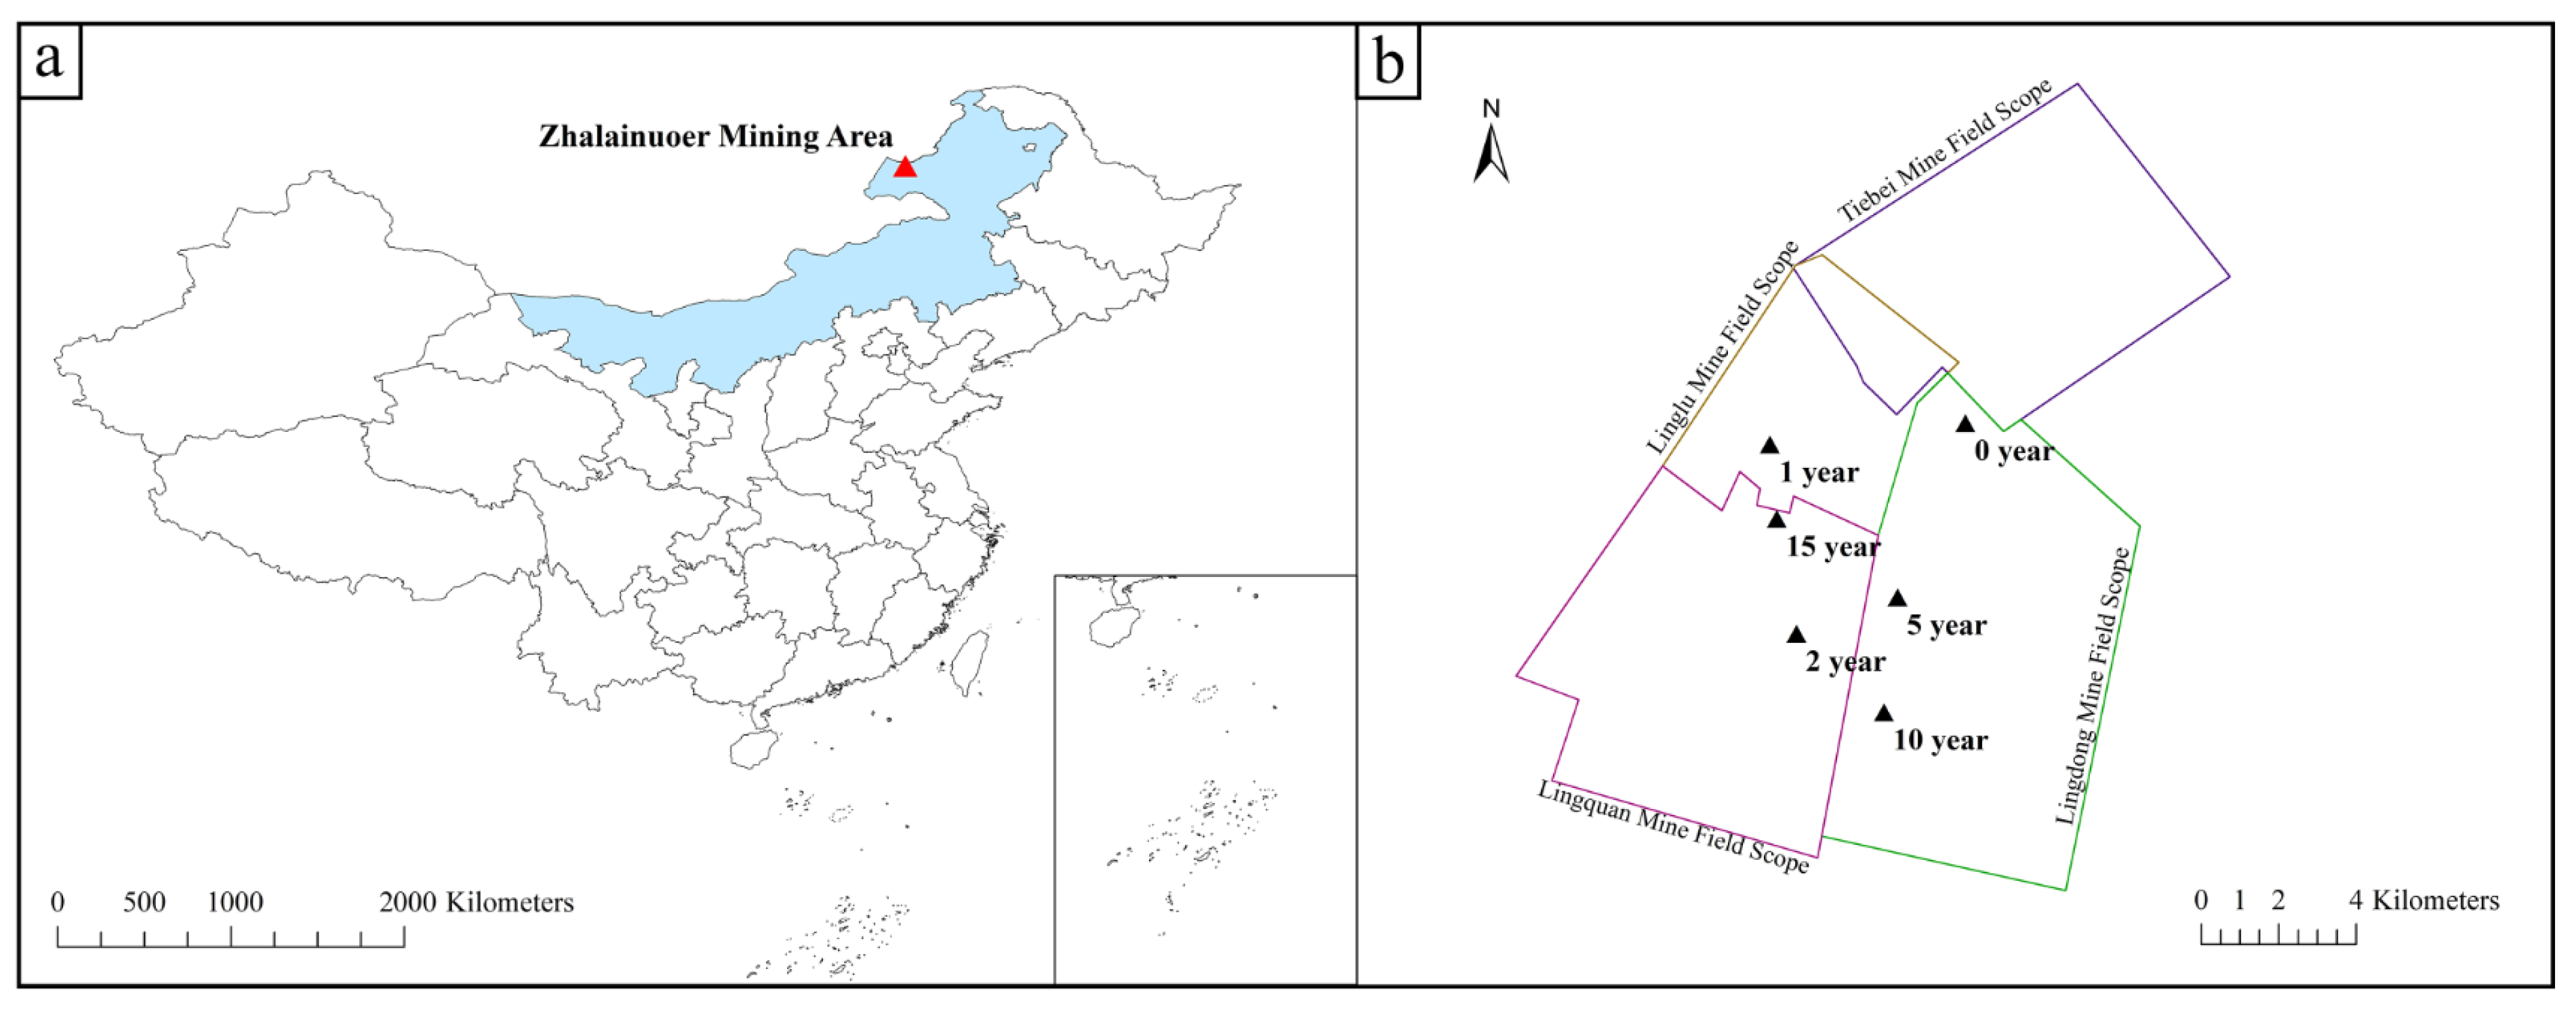
2.1. Overview of the Study Area

The research area (Figure 1) is located in the Zhalainuoer Mining Area, Hulunbeier City, Inner Mongolia Autonomous Region (117°42′4″–117°48′ 37″ E, 49°22′18″–49°26′12″ N), with a temperate and semi-arid continental monsoon climate, which is characterized by cold winters and hot summers, and marked temperature differences between these seasons. In the study area, the lowest temperature is −42.7 °C, the highest is +37.8 °C, and the average annual temperature is 0.2–2 °C. It is located on the high plains of Hulunbeier, with a flat and open terrain. The surface is covered by Quaternary, and the natural vegetation is cold–temperate meadow grassland. The four production coal mines in the research area are all underground, and the mining subsidence situation is caused by conventional underground mining, with no influences from other human activities.

2.2. Research Methods

2.2.1. Sample Collection

In July, 2022, six sampling points of typical characteristic soil in the subsidence area for 1-, 2-, 5-, 10-, 15-year, and 0.6 m × 0.6 m quadrat were set. Soil samples were collected through a multi-point mixing method, and after removing the surface plants, the upper 10 cm of soil was taken. Each soil sample was divided into two parts; one fresh sample was stored in a sterile centrifuge tube at low temperature for the determination of soil microorganisms, and the other was used for the determination of the soil’s physical and chemical properties after being dried in natural air. The removed surface plants were put into aseptic bags and weighed fresh and then brought back to the laboratory for drying to constant weight; then, their dry weight were measured.
The GHG observation in the study area adopted a static box method [22]. The static box is made of plexiglass, with a built-in micro-fan, and the top of the box was provided with gas collection holes (Figure 2). Two treatment methods were included: a black box (the shading treatment) and a white box. Under each method, a volume of 1000 mL of gas was extracted at 0, 15, 30, and 45 min intervals and stored in aluminum foil gas bags for the purpose of calculating CO2 and CH4 gas fluxes.

2.2.2. Determination of the Soil’s Physical and Chemical Properties

Soil pH, moisture, and electrical conductivity were determined using a soil temperature, moisture, and salt pH quick measuring instrument (HM-WSYP, Shandong Hengmei Electronic Technology Co., Ltd., Weifang, China). The probe part of the sensor was inserted vertically into the soil, the sensor was buried, a certain amount of water was poured around the soil to be measured, we waited for a few minutes, and then we read the pH data when the water soaked into the probe. Before determining the chemical properties of the soil, the collected soil samples were air-dried and screened using a 2 mm sieve. The mechanical composition was determined through the specific gravity method; soil organic matter (SOM) was determined through the potassium dichromate oxidation–external heating method [23]. The total potassium (TK), available potassium (AK), total phosphorus (TP), available phosphorus (AP), total nitrogen (TN), ammonium nitrogen (NH4N), and nitrate nitrogen (NO3N) were determined using a soil fertilizer and nutrient tester according to the manufacturer’s instructions (HM-GT3, Shandong hengmei electronic technology Co., Ltd., Weifang, China).

2.2.3. Determination of Soil Microorganisms

1.
DNA extraction and PCR amplification
Following the manufacturer’s instructions, the total microbial genomic DNA was extracted from six samples using the E.Z.N.A.® soil DNA Kit (Omega Bio-tek, Norcross, GA, USA). The quality and concentration of the DNA were determined using 1.0% agarose gel electrophoresis and a NanoDrop 2000 spectrophotometer (Thermo Scientific, Waltham, MA, USA) and kept at −80 °C prior to further use. The hypervariable regions V3-V4 of the bacterial 16S rRNA gene were amplified with primer pairs 338F (5′-ACTCCTACGGGAGGCAGCAG-3′) and 806R(5′-GGACTACHVGGGTWTCTAAT-3′) [24] using the T100 Thermal Cycler PCR thermocycler (BIO-RAD, Hercules, CA, USA). The PCR reaction mixture included 4 μL of 5 × Fast Pfu buffer, 2 μL of 2.5 mM dNTPs, 0.8 μL of each primer (5 μM), 0.4 μL of Fast Pfu polymerase, 10 ng of template DNA, and ddH2O to a final volume of 20 µL. PCR amplification cycling conditions were as follows: initial denaturation at 95 °C for 3 min, followed by 27 cycles of denaturing at 95 °C for 30 s, annealing at 55 °C for 30 s, extension at 72 °C for 45 s, single extension at 72 °C for 10 min, and end at 4 °C. The PCR product was extracted from 2% agarose gel, purified using the PCR Clean-Up Kit (YuHua, Shanghai, China) according to the manufacturer’s instructions, and quantified using Qubit 4.0 (Thermo Fisher Scientific, USA).
2.
Illumina PE300/PE250 sequencing
Purified amplicons were pooled in equimolar amounts and paired-end sequenced on an Illumina PE300/PE250 platform (Illumina, San Diego, CA, USA) according to the standard protocols from Majorbio Bio-Pharm Technology Co., Ltd. (Shanghai, China).
3.
Amplicon sequence processing
After demultiplexing, the resulting sequences were quality filtered with fastp (0.19.6) [25] and merged with FLASH (v1.2.11) [26]. Then, the high-quality sequences were de-noised using the DADA2 [27] plugin in the Qiime2 [28] pipeline with recommended parameters, which obtains a single nucleotide resolution based on error profiles within samples. DADA2-denoised sequences are usually called amplicon sequence variants (ASVs).

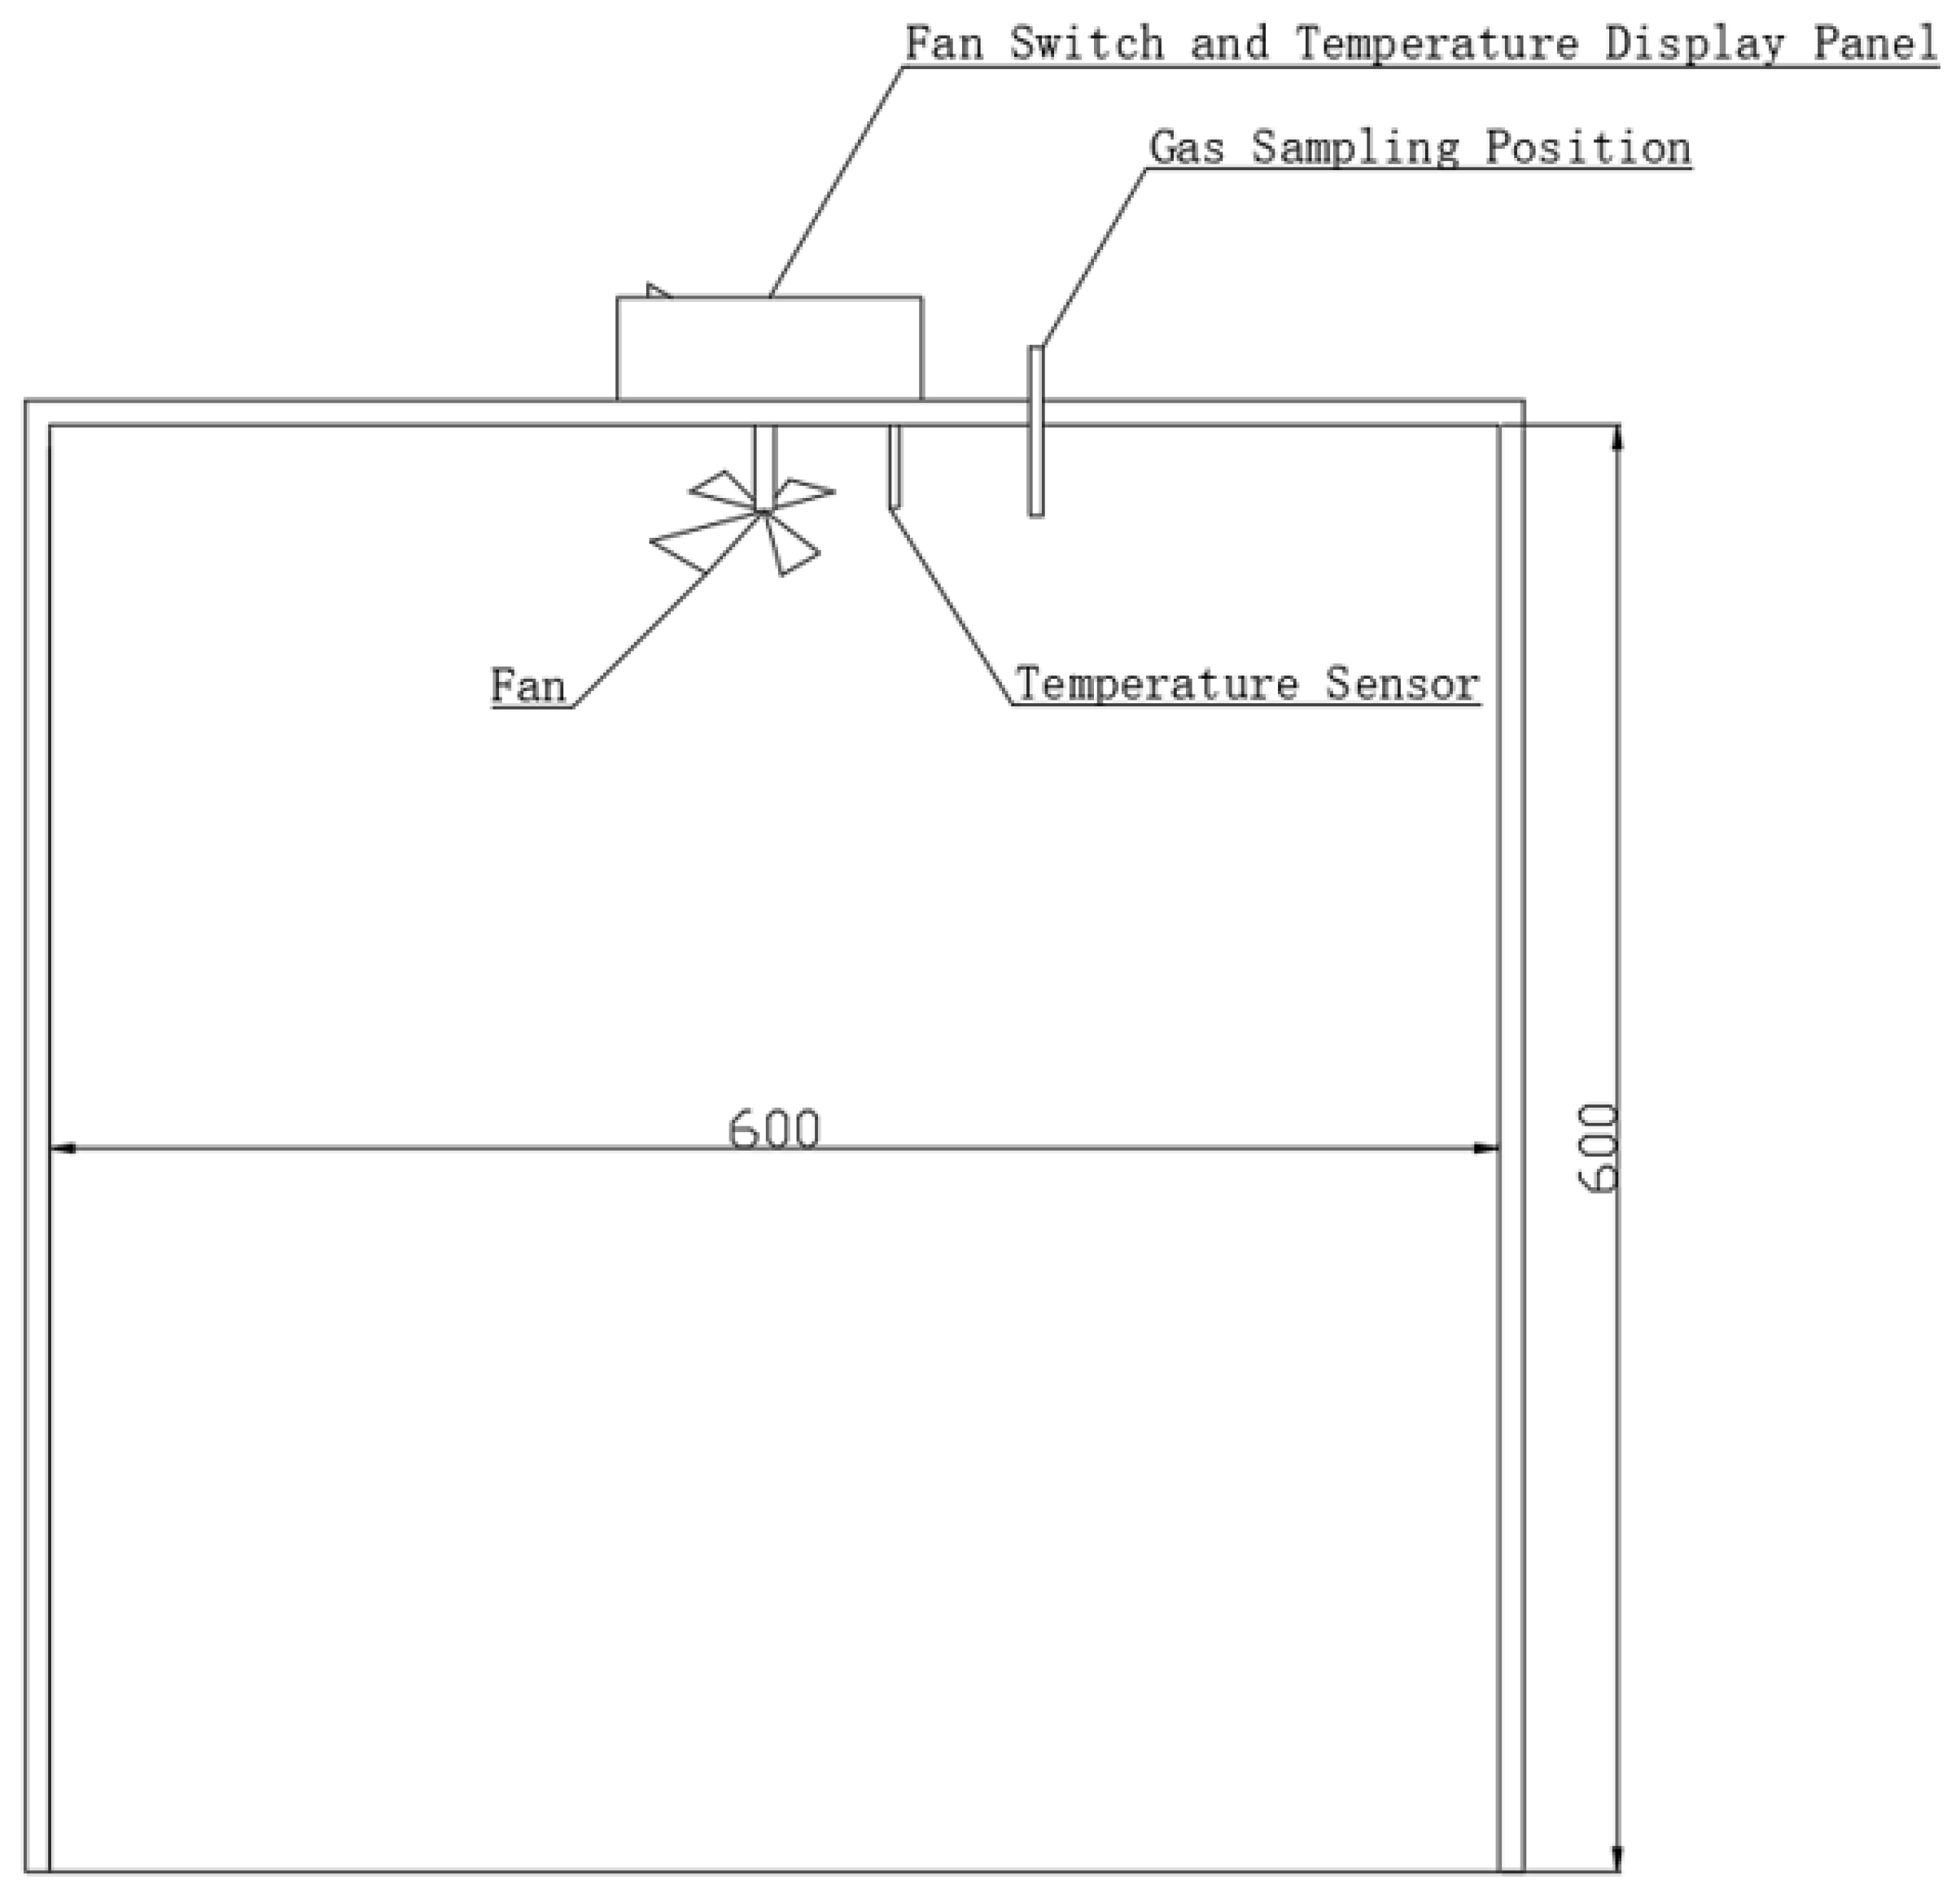
2.2.4. Determination of Gas

The detection method for CO2 was the Non-dispersive Infrared Absorption Method (HJ 870-2017), and the portable CO2 infrared analyzer was used for the determination (GXH-3010E, Beijing Huayun Analytical Instrument Institute Co., Ltd., Beijing, China). The detection method for CH4 was Determination of Total Hydrocarbons, CH4, and Non-CH4 Hydrocarbons in Ambient Air through Direct Injection–Gas Chromatography (HJ 604-2017). The model of the gas chromatograph was Agilent 8890, and the minimum detection limit was 0.06 mg/m3.

2.2.5. Calculation of CS and the GHG Budget

  • CS
The calculation of CS was based on the calculation of relevant contents in the Guide to Carbon Sequestration Measurement and Monitoring of Afforestation Projects and the Guide to CS Measurement of Forest Ecosystem (LY/T 2988-2).
  • (1)
    Selecting a carbon pool
Carbon pool = aboveground biomass + underground biomass + litter + dead wood + soil organic matter
The carbon pool of herbaceous vegetation litter and dead trees in the study area was not considered in the calculation due to their small amount and difficulty in separation. Additionally, it was also difficult to separate the underground biomass, which consisted solely of herbaceous roots, and hence its carbon pool was also disregarded.
  • (2)
    Calculation of CS
Grassland CS = aboveground CS of herb layer + soil organic CS
The calculation formula of aboveground CS of the herb layer is:
C aboveground = B aboveground × C F herb × S
Among them:
  • Caboveground: The aboveground CS of the herb layer (tC);
  • Baboveground: The mean biomass per unit area of the aboveground part of the herb layer (t.d.m/hm2);
  • CFherb: The average carbon content of herbs (tC/t.d.m). The reference value of herbaceous vegetation is 0.47.
The calculation formula of the soil organic CS is:
C soil = S O C C × B D × 1 F D e p t h × S
Among them:
  • Csoil: Soil organic carbon storage per unit area (tC/hm2);
  • SOCC: Soil organic carbon density (gC/(100 g of soil));
  • BD: Volume weight of soil (g/cm3);
  • F: Volume percentage of gravel, roots, and other dead residues with a soil layer diameter greater than 2 mm in the sample plot (%);
  • Depth: Soil thickness (cm).
2.
GHG Budget
  • (1)
    Calculation of CO2 and CH4 emission
The emission was calculated according to the standard of the “Technical Specification and Data Quality Control for Monitoring CH4 and Nitrous Oxide Emission in Agricultural Ecosystem by Static Box Method (T/LCAA 008-2020)”, and the specific calculation method was as follows:
For nonlinear algorithms:
F N L = k 1 k 2 × C 0 × V A × M V 0 × P P 0 × T 0 T × c
For linear algorithms:
F L = a × V A × M V 0 × P P 0 × T 0 T × c
Among them:
  • A: Average change rate of target gas concentration in gas chamber during sealing of sampling box.
  • k1k2 × C0: Instantaneous change rate of target gas concentration in the gas chamber at the beginning of sealing the sampling box.
  • C0: Gas concentration in the air chamber of the sampling box at the beginning of sealing.
  • V: Air chamber volume of sampling box.
  • A: Sampling box bottom area.
  • M: Molar mass of target gas.
  • V0: Molar volume of target gas under standard conditions.
  • T and P: They are the air temperature and air pressure in the air chamber when collecting gas samples, respectively. Considering that the sampling box has an insulation design and an air pressure balance tube, the measured values of air temperature and air pressure outside the box can be used instead.
  • T0 and P0: Air temperature (273 K) and air pressure (1013 hPa) under standard conditions.
  • C: Dimension conversion coefficient.
The values of the parameters a, k1, and k2 are given by the least square fitting results of the measured gas concentration in the gas chamber, varying with the sampling time.
  • (2)
    The calculation of the GHG budget
According to the Fifth Assessment Report of the Intergovernmental Panel on Climate Change, the intensity of GHG sources and sinks is expressed by the Global Warming Potential (GWP). The GWP is determined by the GHG flux in and out of the atmosphere. Taking the GWP value of CH4 as 25, the calculation formula of the GHG budget is as follows:
  • GHG = CO2 + (CH4 × 25);
  • GHG: The GHG flux in and out of the atmosphere, taking the GWP value of CH4 as 25;
  • CO2: The carbon dioxide mission flux;
  • CH4: CH4 emission.

2.3. Data Processing and Analysis

Excel, Origin, and Minitab were used to process and draw the gas data and the soil’s physical and chemical properties. Correlation analyses were performed using the SPSS program (SPSS, Chicago, IL, USA).
The bioinformatic analysis of the soil microbiota was carried out using the Majorbio Cloud platform (https://cloud.majorbio.com from 1 Match 2023 to 28 Match 2023). Based on the ASVs’ information, alpha diversity indices, including the observed Ace, Chao richness, Shannon index, and Simpson index, were calculated with Mothur v1.30.1 [29]. Based on the obtained ASVs data, the species were classified by using the species annotation database of silva138/16s_bacteria and the species annotation method of classify-sklearn (Naive Bayes), and the classified data were obtained, in which the classification confidence was 0.7. Based on the data, the species community composition map was made by using the tool of R language (version 3.3.1). The calculated environmental data of the gas and soil were imported into the Meggie system, and the correlation heatmap was drawn based on the environmental data and the obtained microbial data by using the PHEATMAP (1.0.8) package in R language (version 3.3.1).
Through the cloud platform of Meggie Shengxin, the species taxonomy, community diversity, species difference analysis, correlation analysis, phylogenetic analysis, and function prediction analysis were carried out to obtain the sequence and abundance information represented by ASV. The α diversity index of microorganisms used in this paper includes Ace, chao, shannon, simpson, and sobs.

3. Results

3.1. Physical and Chemical Properties of Vegetation and Soil and Distribution Characteristics of Microbial Communities

3.1.1. Distribution Characteristics of Physical and Chemical Properties of Vegetation and Soil

The statistical results of the physical and chemical properties of the vegetation and soil at sampling points with different subsidence years are shown in Table 1. The subsidence resulted in a notable reduction in vegetation coverage and biomass. Specifically, the biomass and coverage underwent changes from 21.29 g to 8.20 g, and from 40% to 10%, respectively, after 1 year of subsidence. Subsequently, as the subsidence time increased, there was a gradual increase in vegetation coverage and biomass.
The soil moisture content in the study area was basically maintained at about 15%, and the soil pH was acidic at 5.92 after 1 year of subsidence, and then it returned to neutral at about 7. The highest content of TP in soil was 1.44 g/kg, which was observed at the time of the 1-year subsidence period, and then it decreased to about 0.12 g/kg at the time of the 15-year subsidence period. Compared with the non-subsidence soil, the subsidence soil exhibited noticeably higher contents of SOM, AP, and TK. Over the time of subsidence, the content of NO3N in the soil decreased, and no regular fluctuation trend can be identified in the changes of SOM, TN, NH4N, TK, AK, or AP.

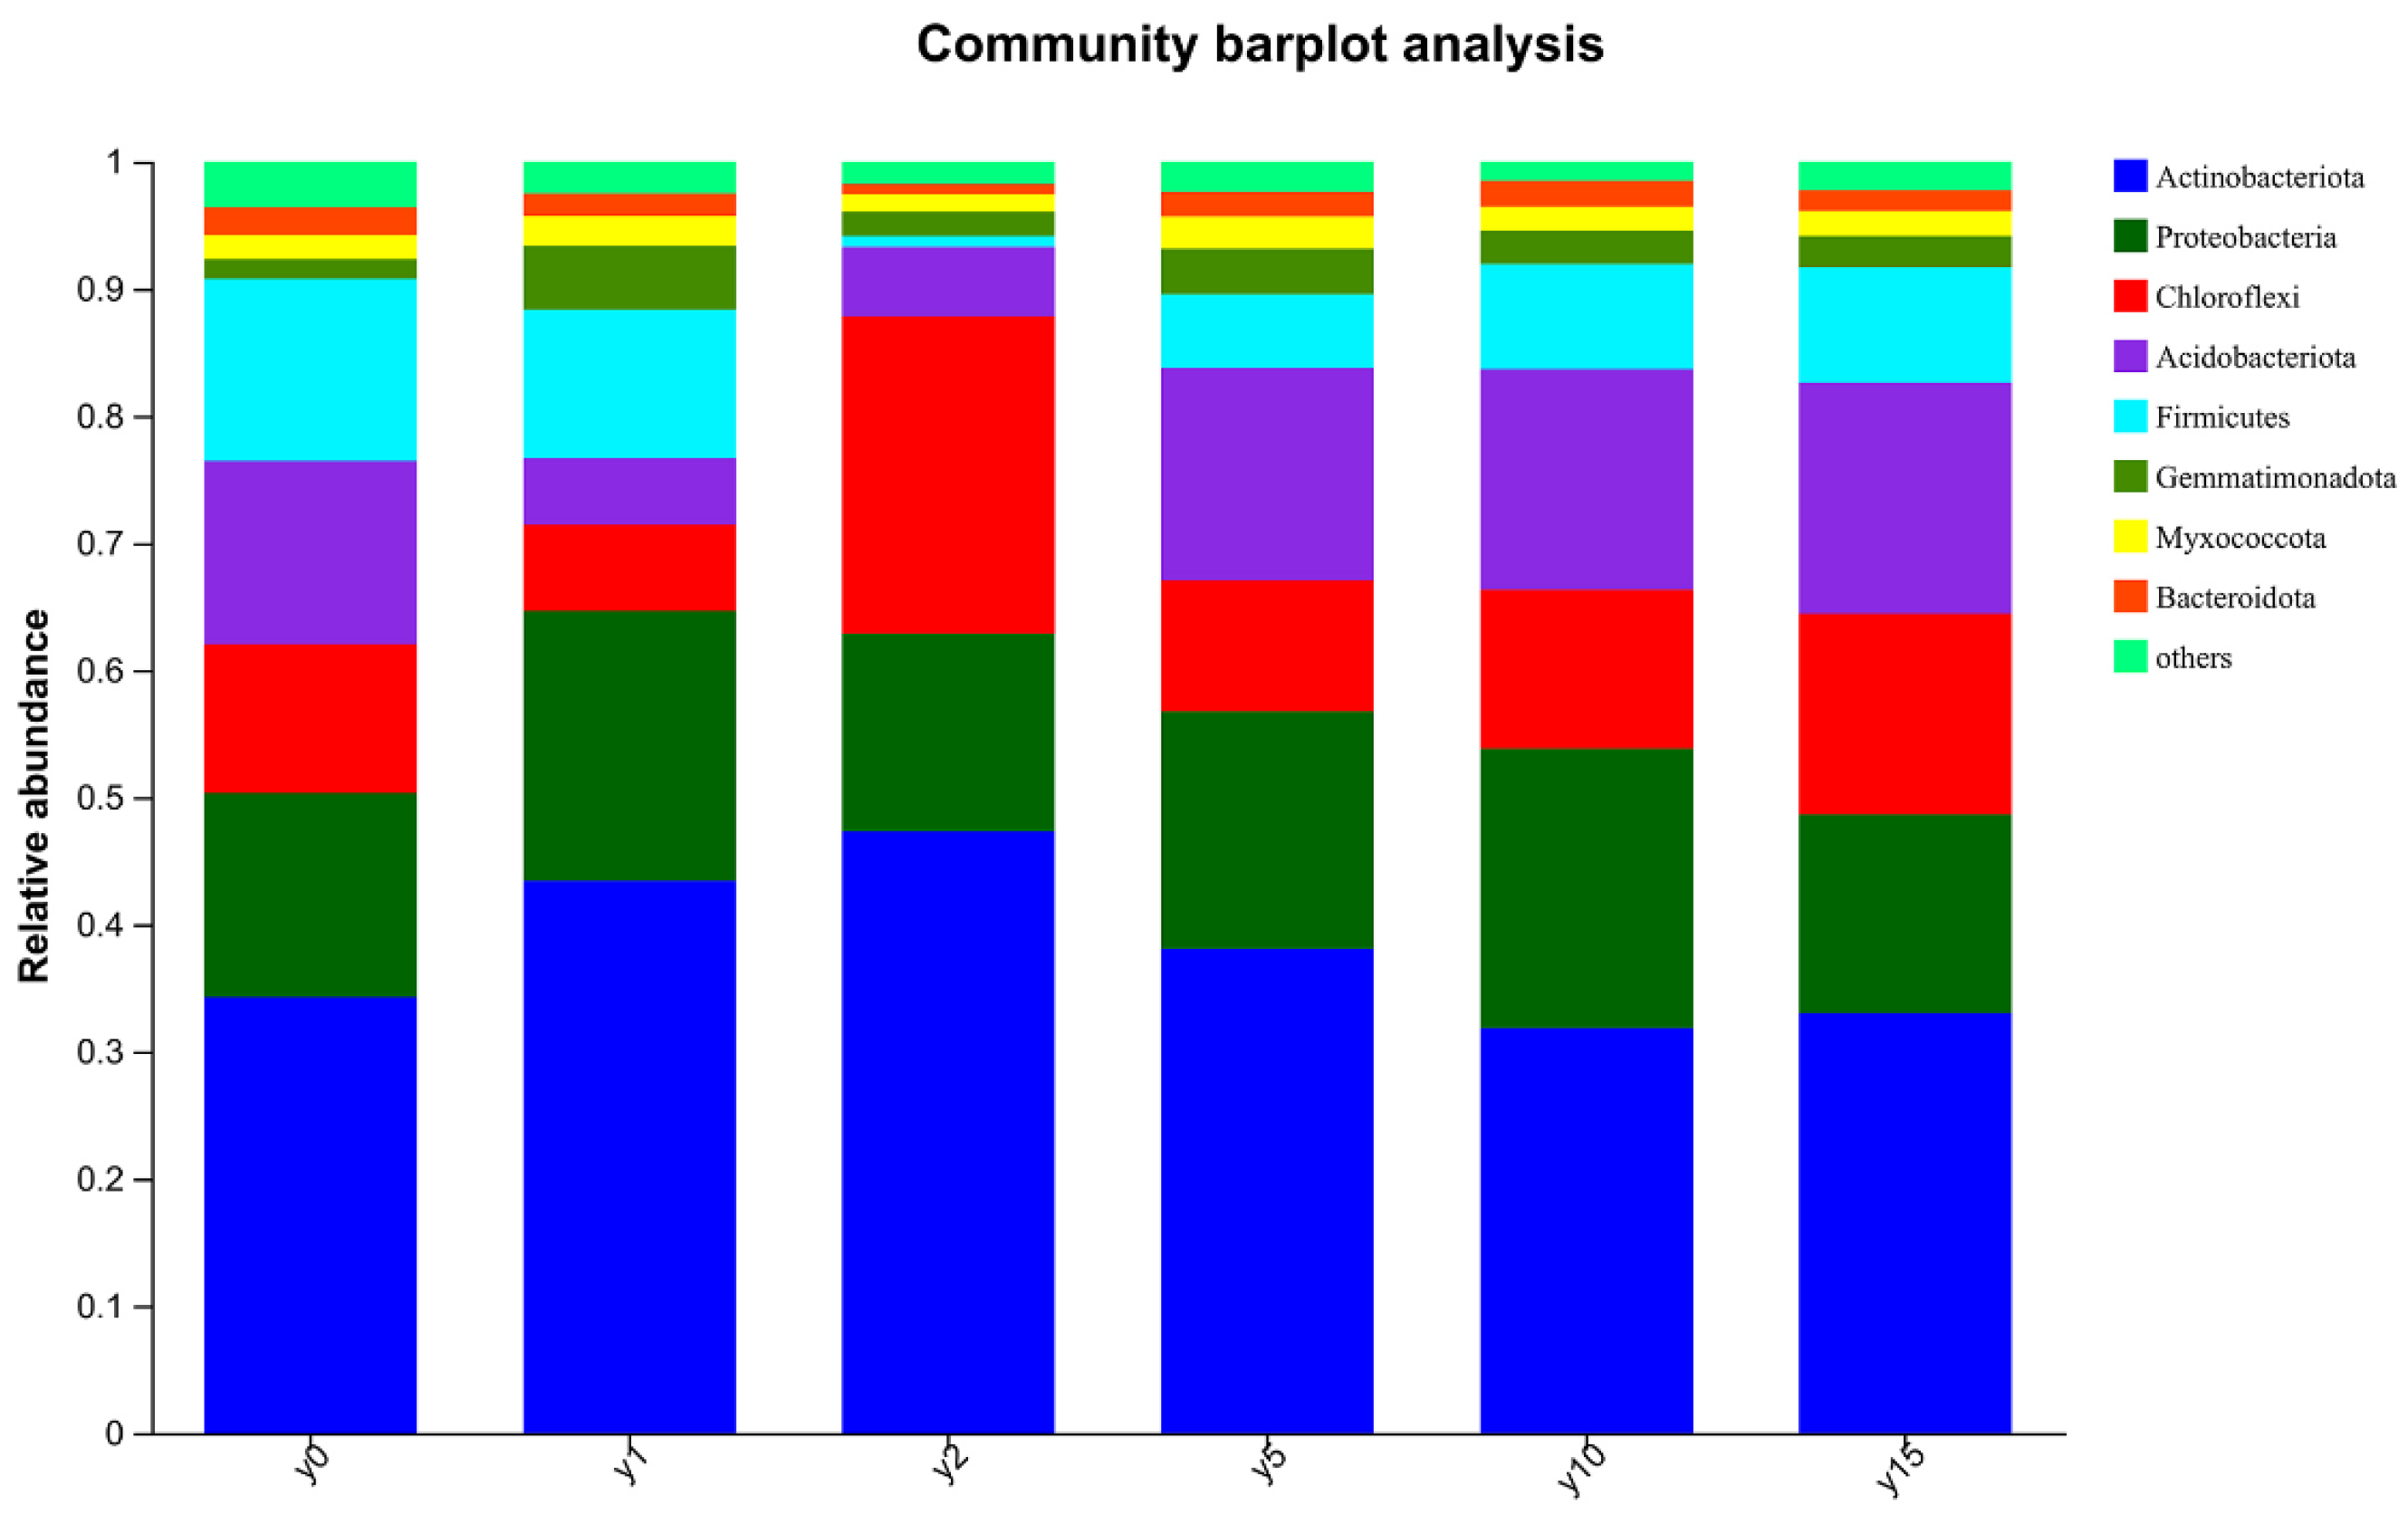
3.1.2. Distribution Characteristics of Soil Microbial Community

The community richness is mainly reflected by the indexes of sobs, chao, and ace, while the community diversity is mainly reflected by the indexes of Shannon and Simpson. Table 2 shows that the soil bacteria exhibited reduced richness and diversity after subsidence when compared to those in the non-subsided soil. Specifically, the bacterial diversity index was the lowest at the time of the 2-year subsidence period, with an ace of 654 and a Shannon of 5.95
The composition of the soil bacteria community is shown in Figure 3. The dominant bacteria in the soil are Actinobacteria, Proteobacteria, Chloroflexi, Acidobacteria, and Firmicutes.

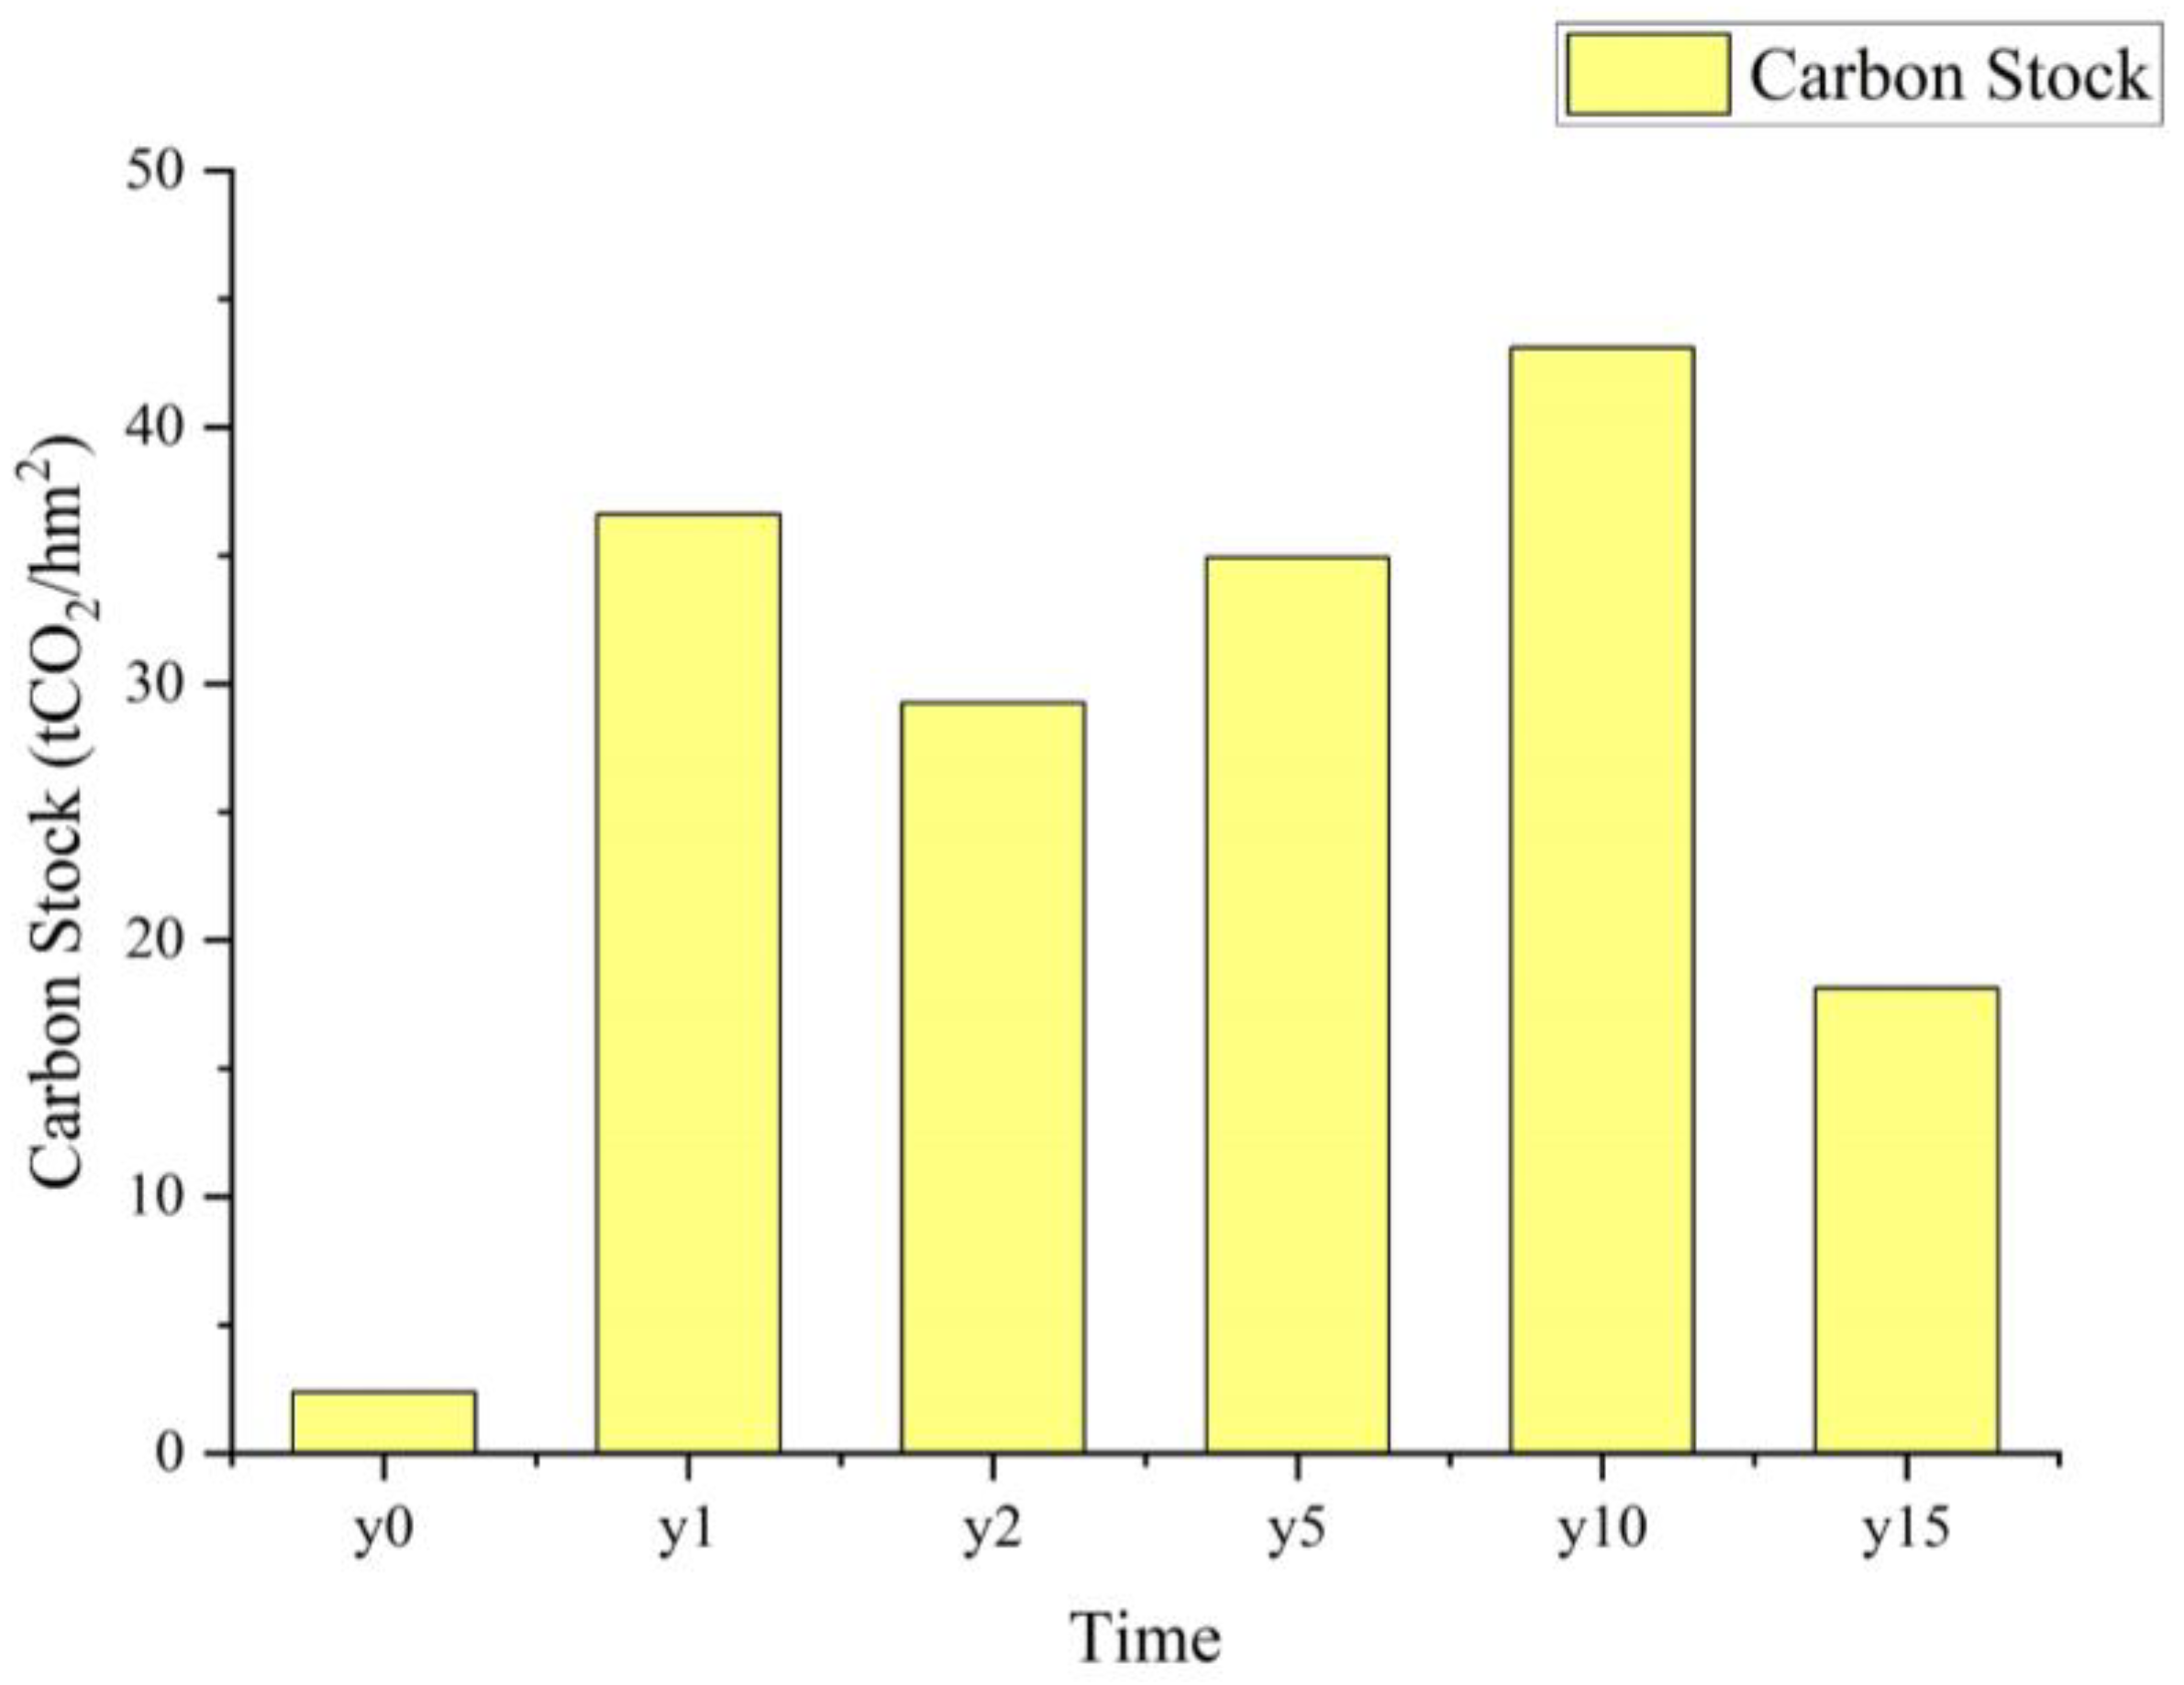
3.2. Distribution Characteristics of CS

Based on the calculation results, it can be inferred that the variation in CS is primarily influenced by the CS of the soil organic matter, which constitutes 99% of the total. Consequently, the trend in CS change parallels that of the soil organic matter (Figure 4). Specifically, in comparison to the non-subsidence soil, there was a noticeable increase in CS in the soil after subsidence. However, with the passage of time in subsidence, the CS showed an initial increase followed by a subsequent decrease. The highest CS was observed at the time of 10-year subsidence, with the stock of 43.10 tCO2/hm2. In accordance with the non-subsidence soil, the modification of the average annual CS was computed, revealing a reduction in the average annual CS as subsidence time increased.

3.3. Distribution Characteristics of the GHG Budget

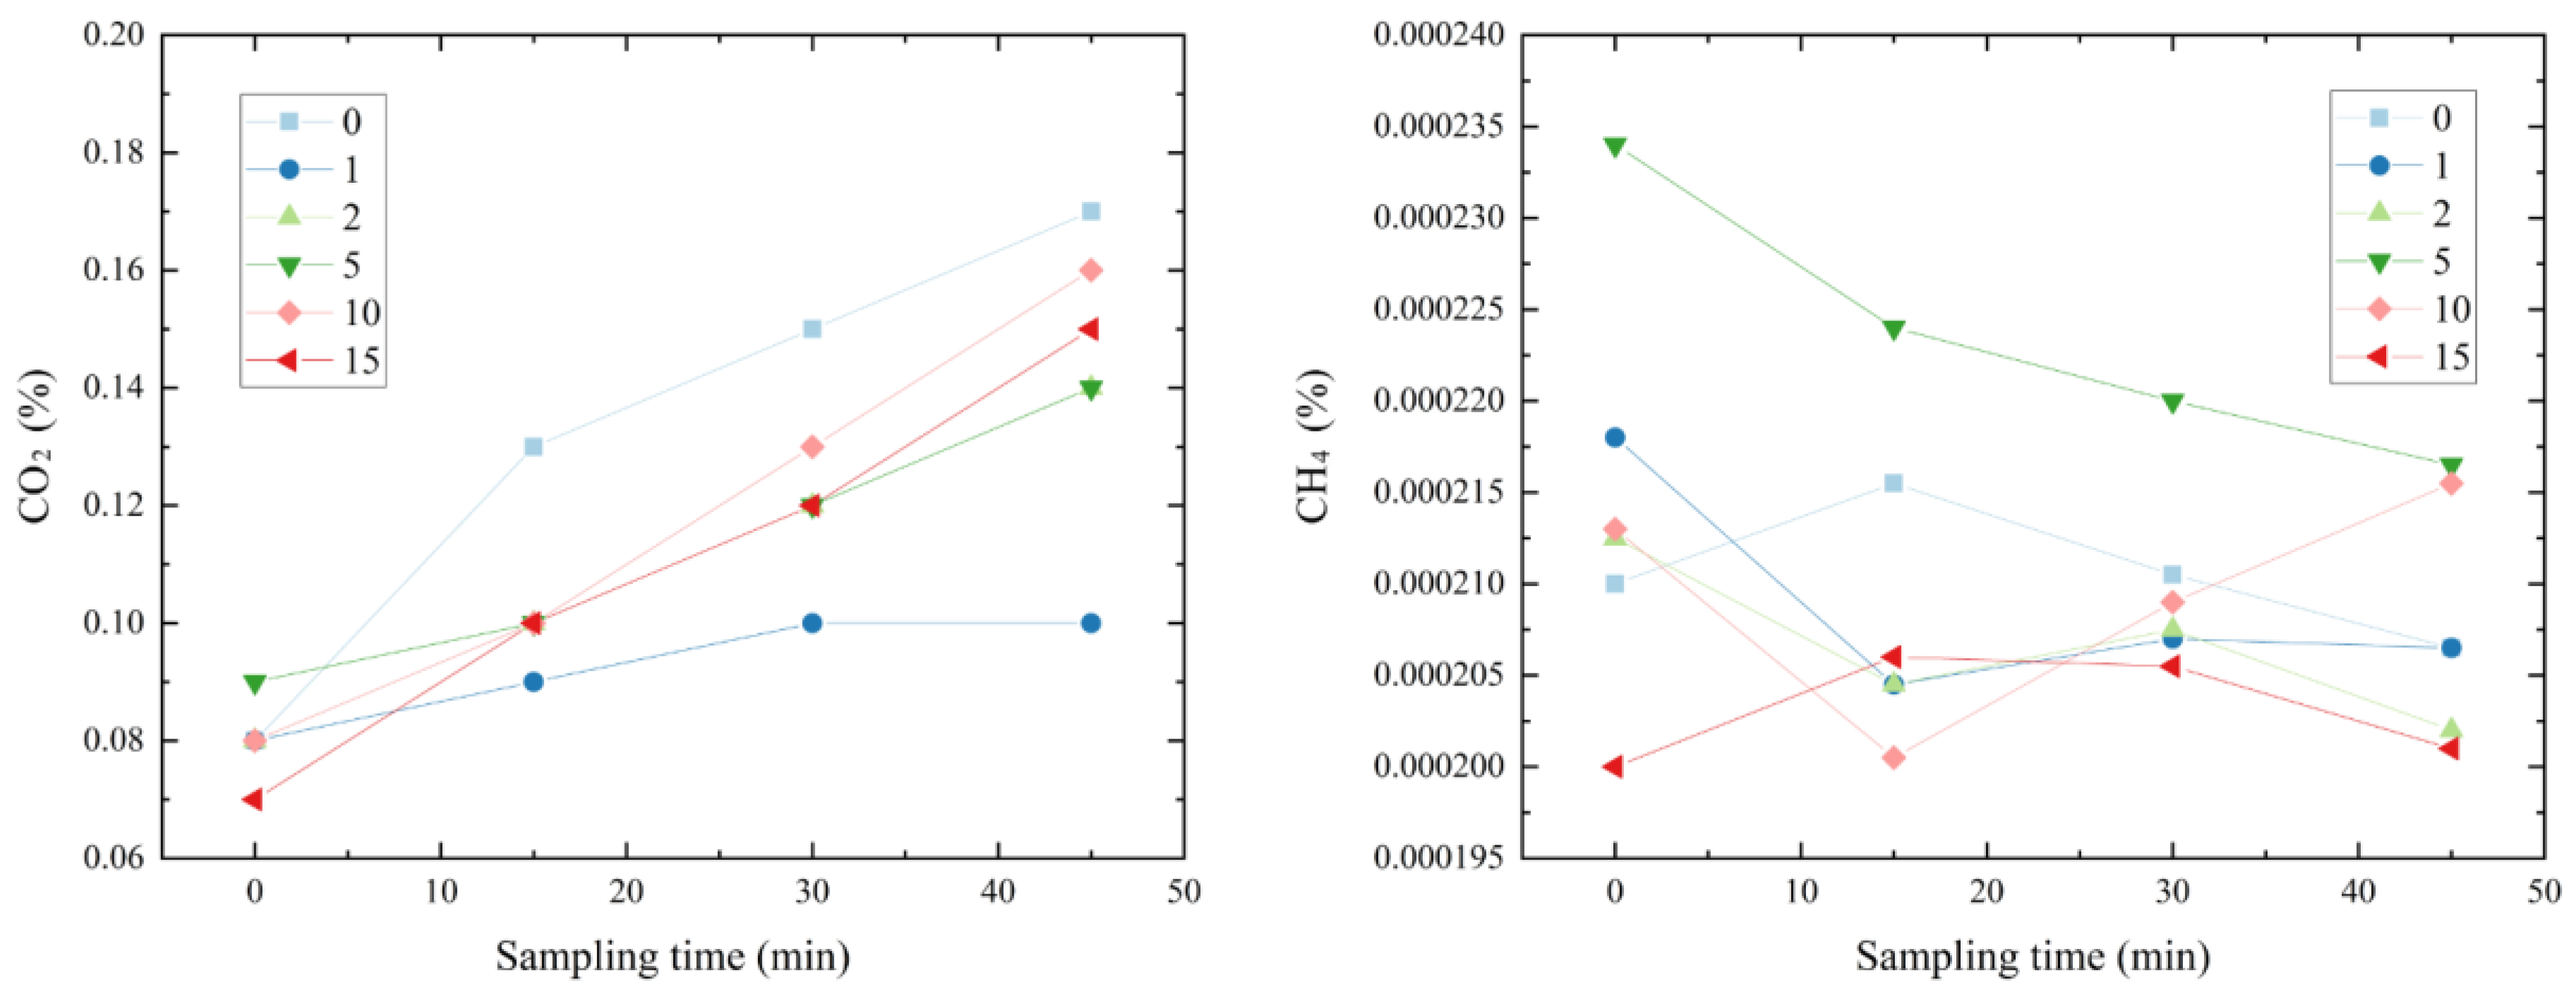
3.3.1. Distribution Characteristics of CO2 and CH4 Concentrations

The average concentration of CO2 and CH4 in the open box and the black box represents the emission of CO2 and CH4. As can be seen from Figure 5, with the increase in gas production time, the emission of CO2 gradually rose, and the non-subsidence soil exhibited the highest and fastest emission rate of CO2. The emissions from five groups ordered from high to low are as follows: non-subsidence > subsidence for 10 years > subsidence for 15 years > subsidence for 5 years/subsidence for 2 years > subsidence for 1 year. The group of 15-year subsidence exhibited the lowest initial CH4 concentration, and the 5-year subsidence group had the highest one. In the first 15 min, the groups of 1-, 2-, 5-, and 10-year subsidence all showed a downward trend, while the non-subsidence group was just the opposite to the subsidence group of 15 years, and there was no obvious trend after that. On the whole, the trend of CH4 concentration in the group without subsidence was the same as that in the group with subsidence for 15 years.

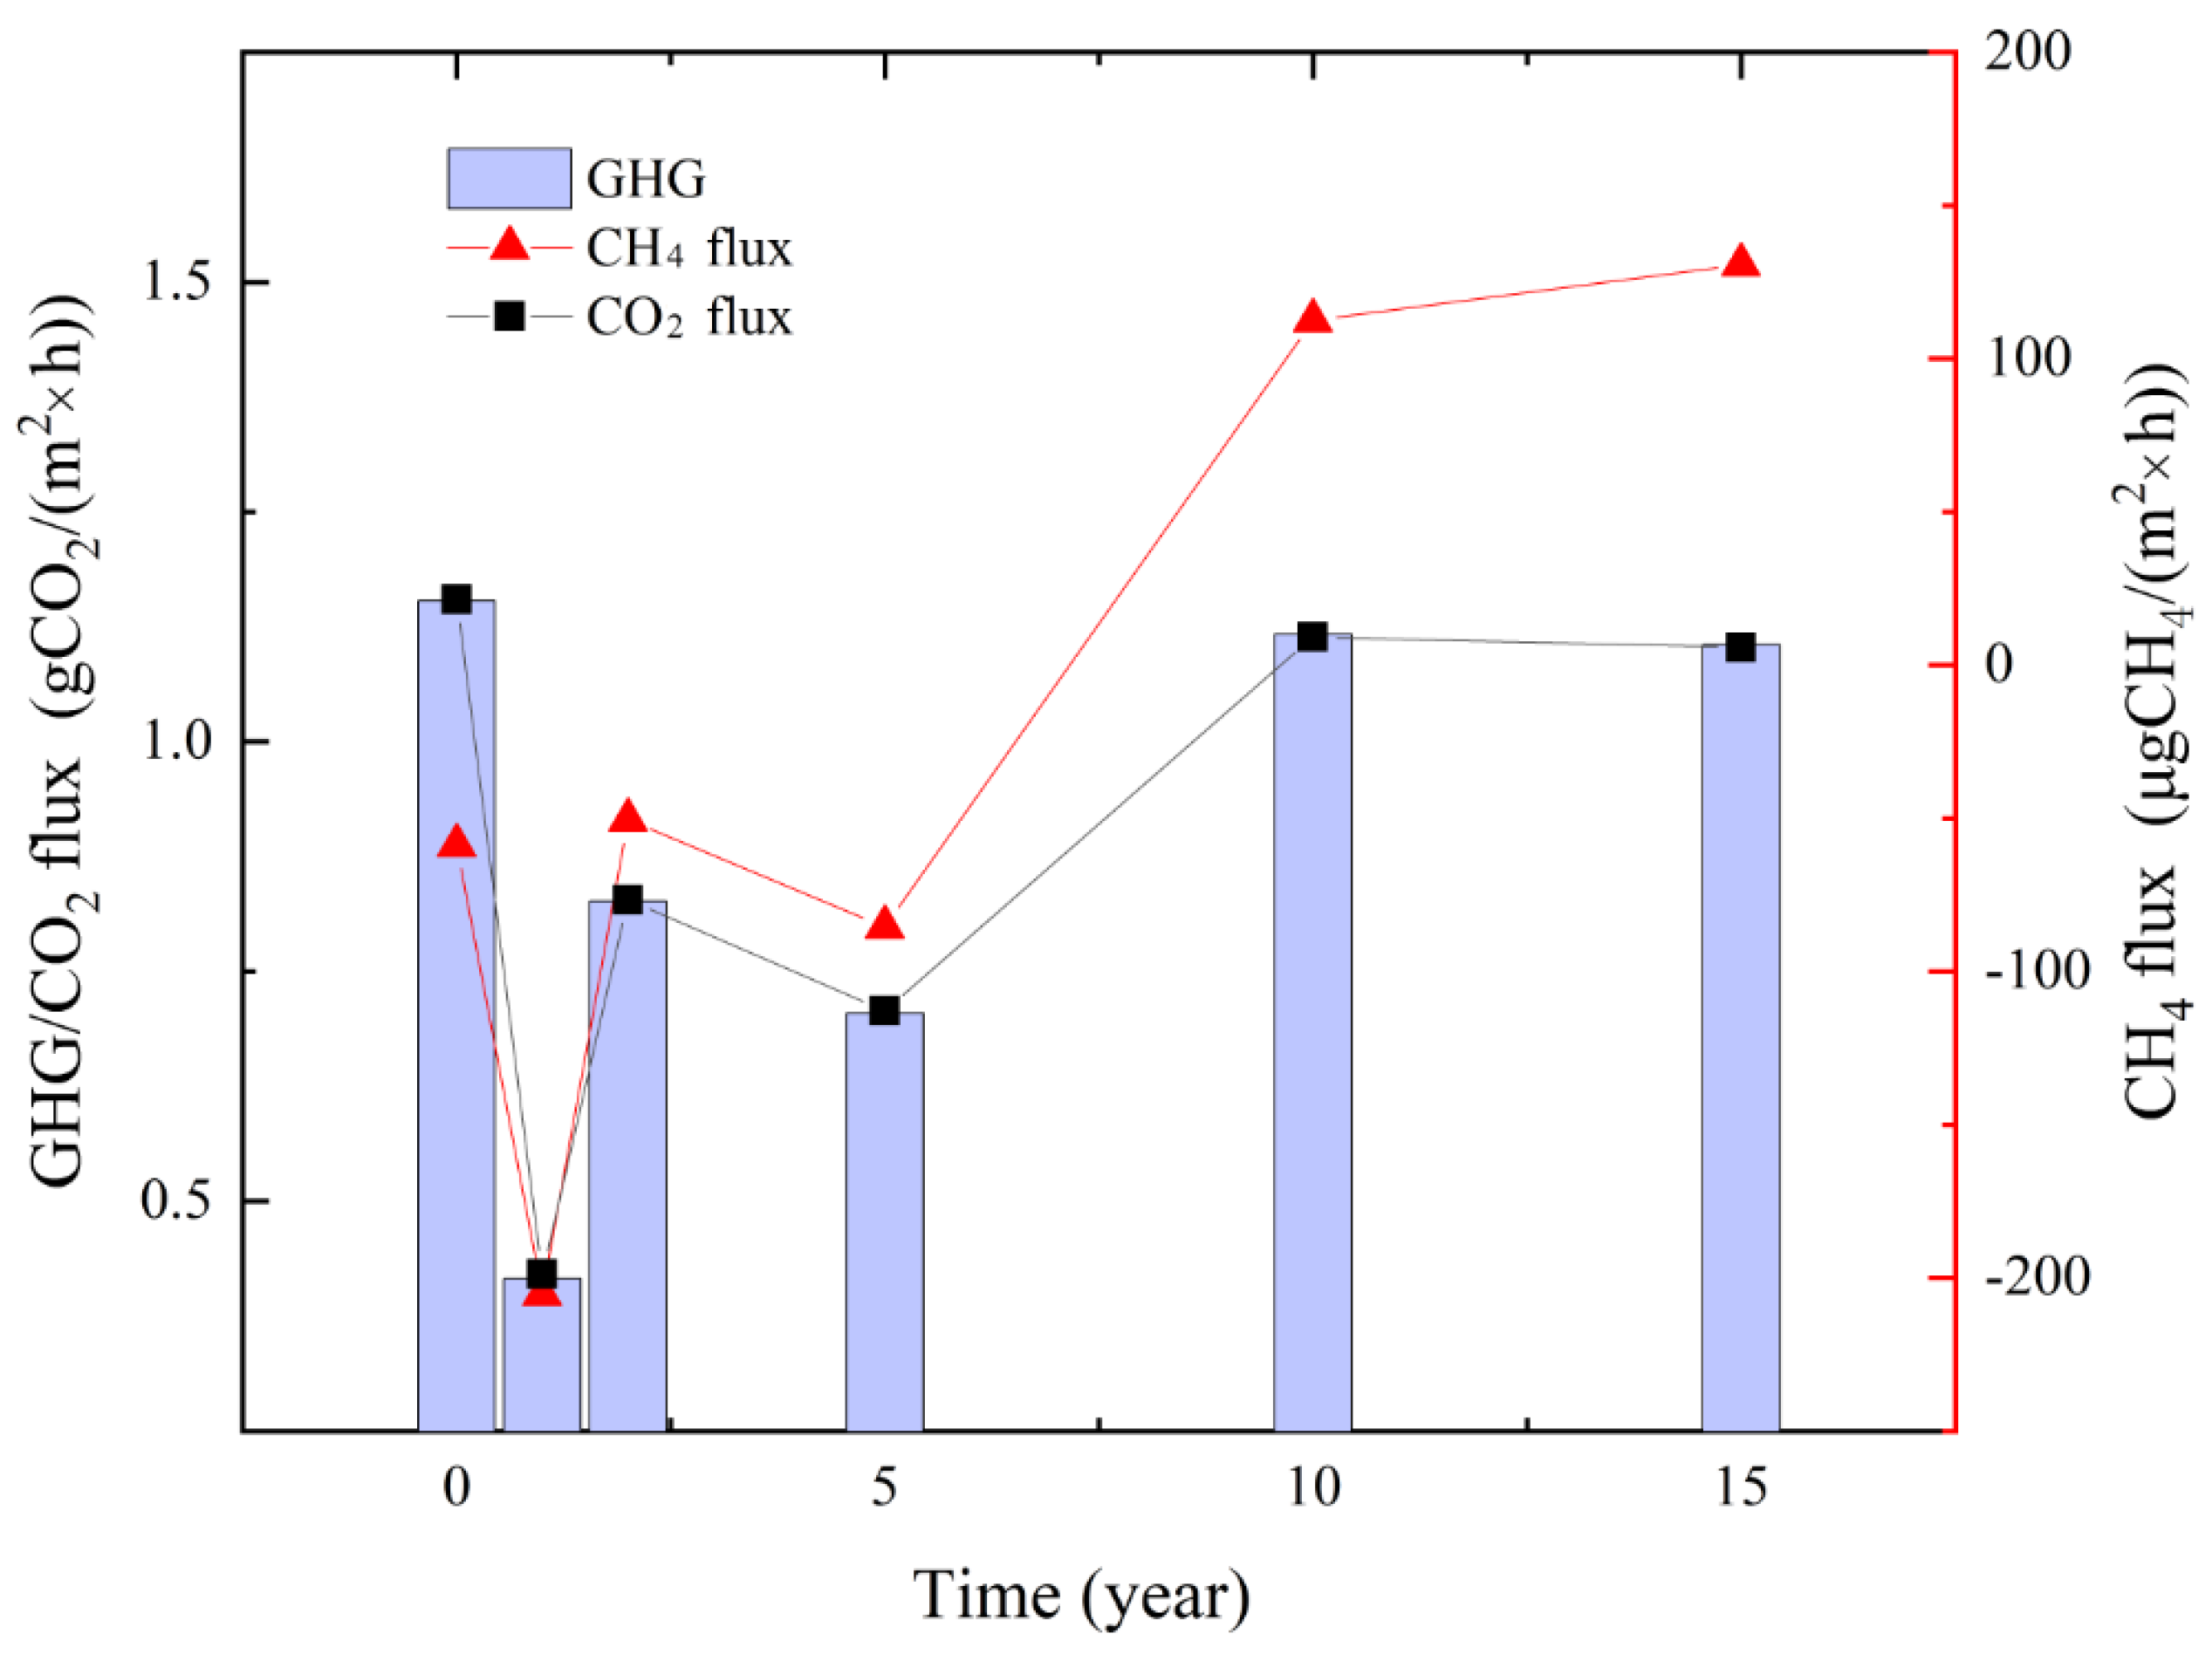
3.3.2. Characteristics of the GHG Budget

The emission of CO2 and CH4 are shown in Figure 6. The emissions of CO2 and CH4 in the unsinkable soil were 1.15 g CO2 × m−2 × h−1 and −58 μg CH4 × m−2 × h−1, respectively. From the numerical analysis, the change trend of the two was basically consistent with the years of subsidence. The flux in 1-year subsidence was lower than that of non-subsidence, then it increased with the years of subsidence, and then it fell back after 5 years of subsidence. After 10 years of subsidence, its CO2 emission was slightly lower than that of non-subsidence soil, and its CH4 flux was higher than that of non-subsidence soil. This indicated that CO2 showed emission and CH4 showed absorption five years before subsidence and then showed emission.
There is a significant correlation between CH4 emission and CO2 emission, with the correlation coefficient r = 0.982. The fitting model is: CH4 = −421.8 + 482.0 × CO2, where CH4: CH4 emission, μg CH4/(m2 × h); CO2: CO2 emission, g CO2/(m2 × h).
The contribution rate of CO2 in the GHG budget was the largest, and the contribution rate of CH4 was neglected, which was roughly 0.12–1.23%. GHG increased at first and then decreased with subsidence.

3.4. Correlation Analysis Results

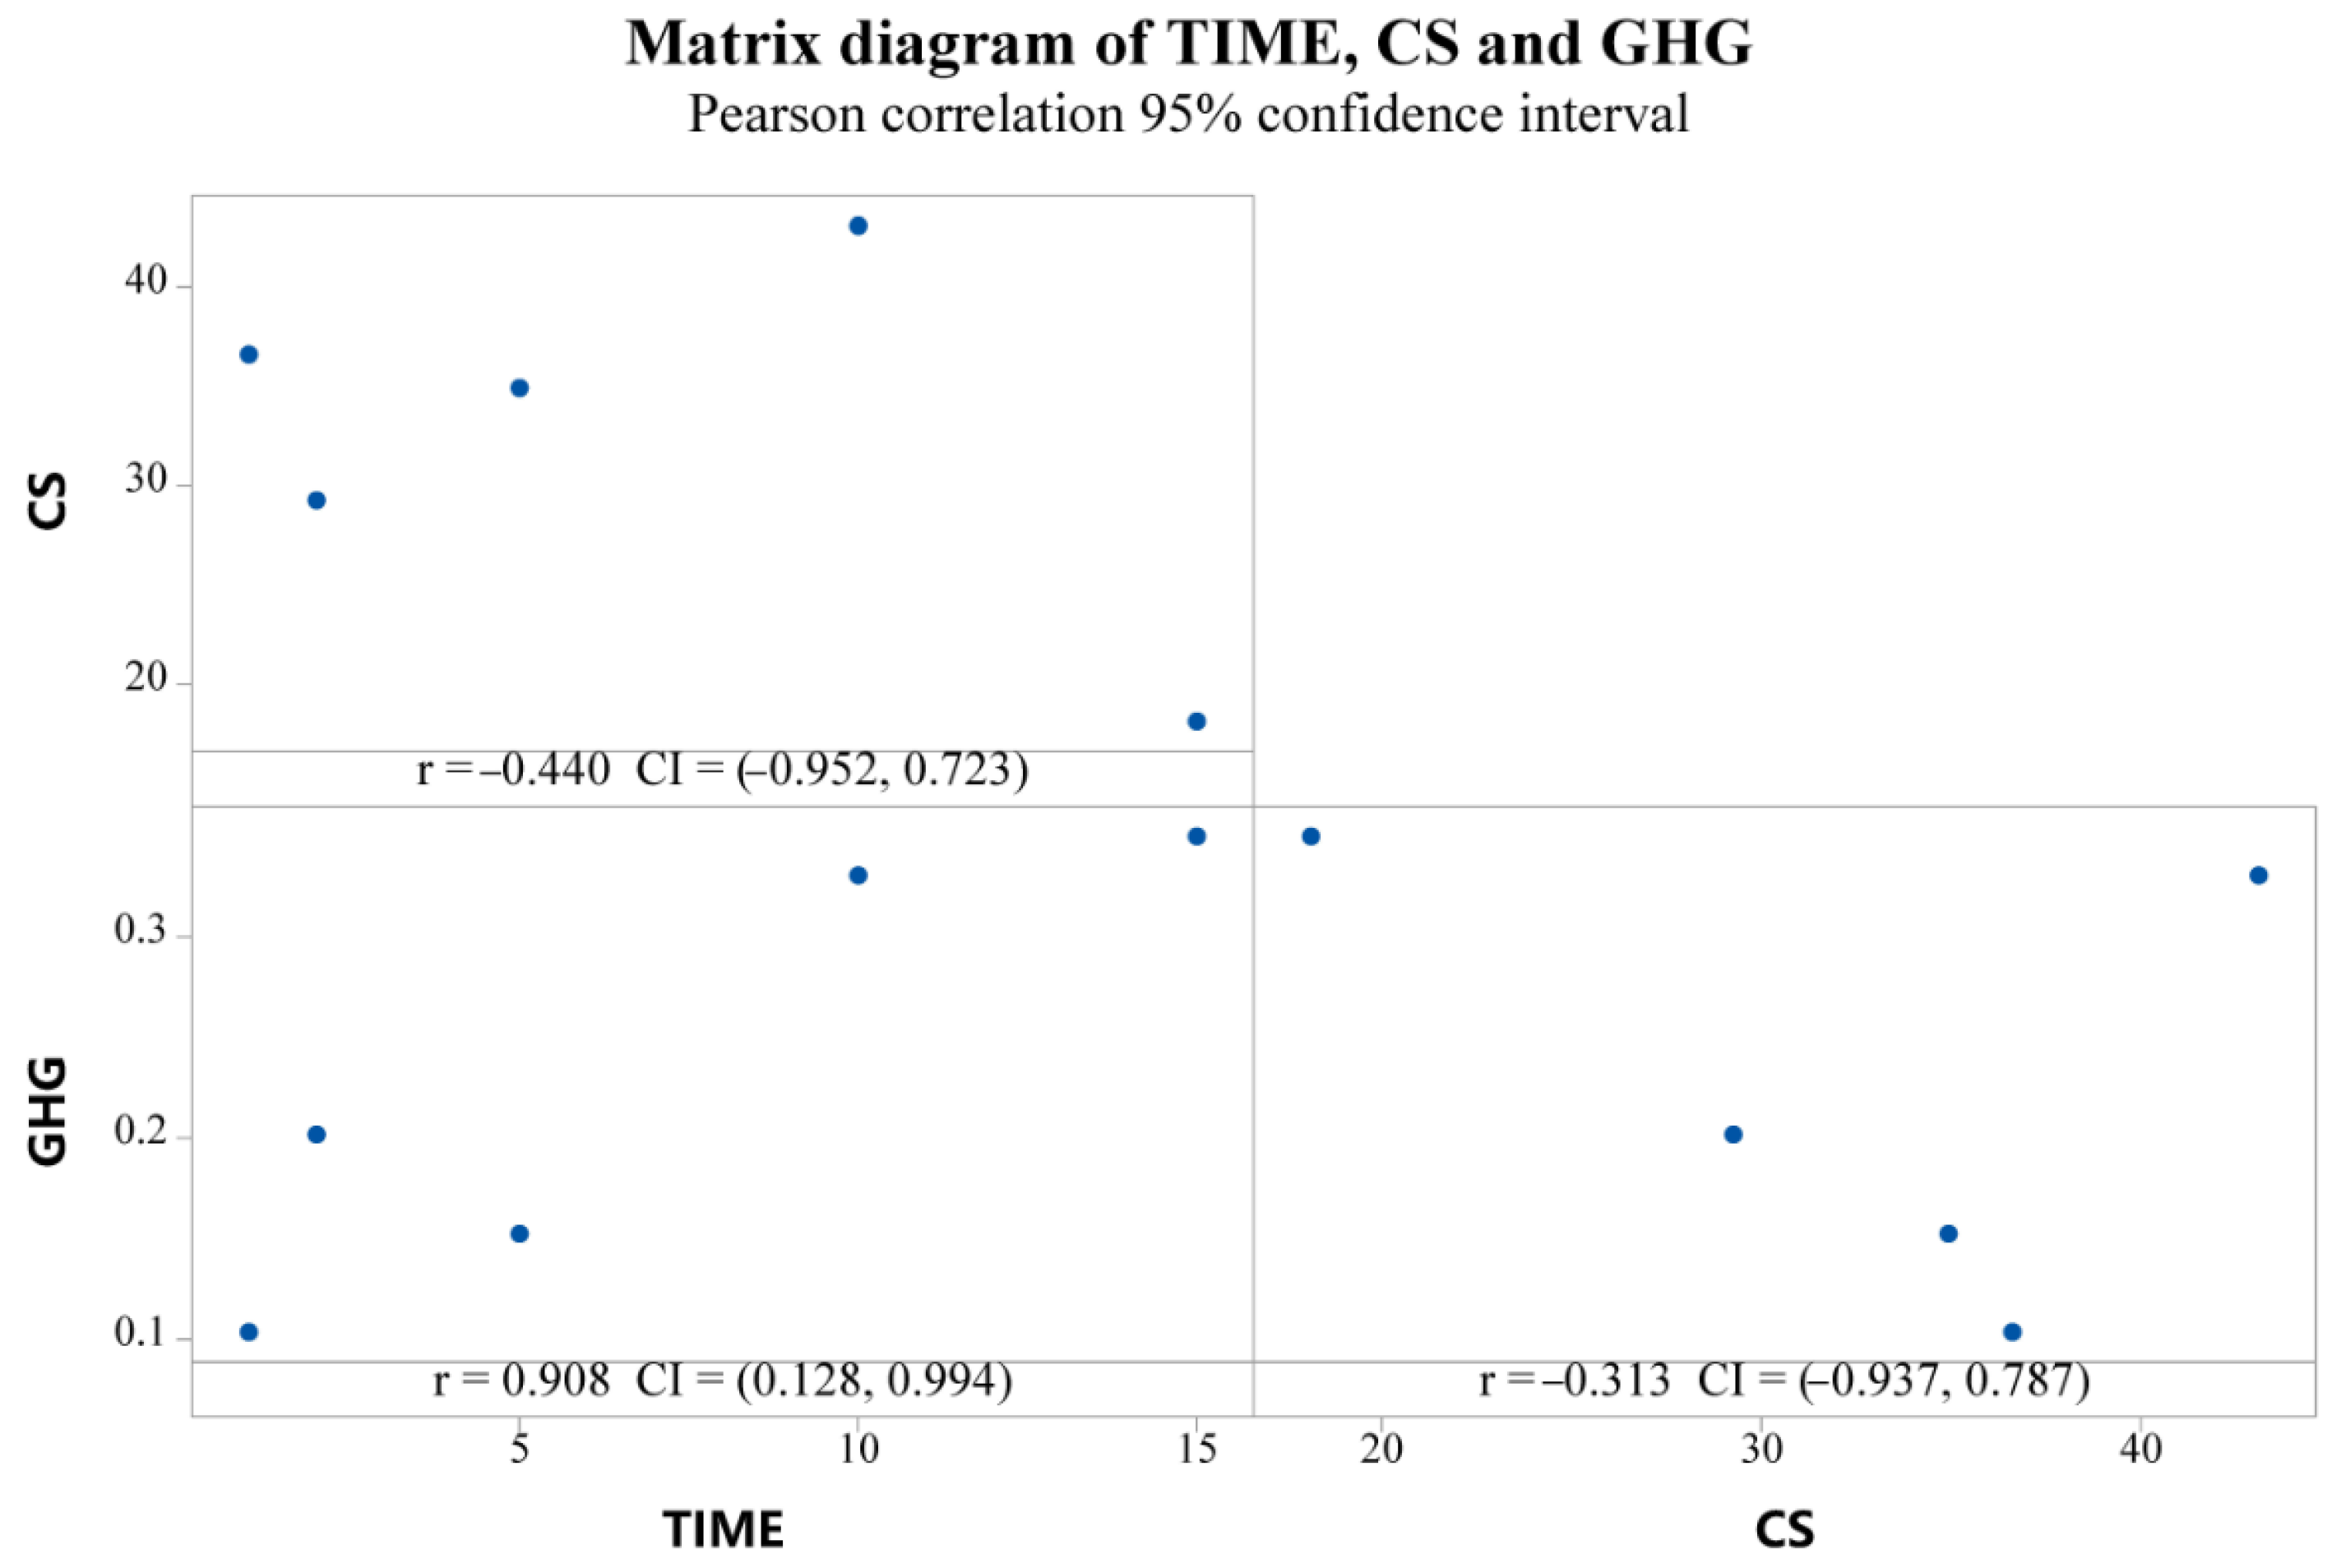
3.4.1. Correlation between CS and the GHG Budget

The unsinkable group was removed and a correlation diagram of time, CS, annual average CS, and the GHG budget was produced. The result is shown in Figure 7. The term of subsidence had a significant positive correlation with GHG and a nonlinear correlation with ACS. There was an abnormal point between CS and the GHG budget, and a significant negative correlation was shown after removing the abnormal point, which can be expressed by the following expression: GHG = 0.5791–0.01268 × CS, r = 0.9874.

3.4.2. Correlation of CS and the GHG Budget with Physical and Chemical Properties of Vegetation and Soil

From Table 3, it can be seen that plant biomass and coverage were significantly correlated with time and the GHG budget; in addition, biomass was also negatively correlated with annual average CS. CS was positively correlated with organic matter and total phosphorus, with correlation coefficients of 0.998 and 0.903.

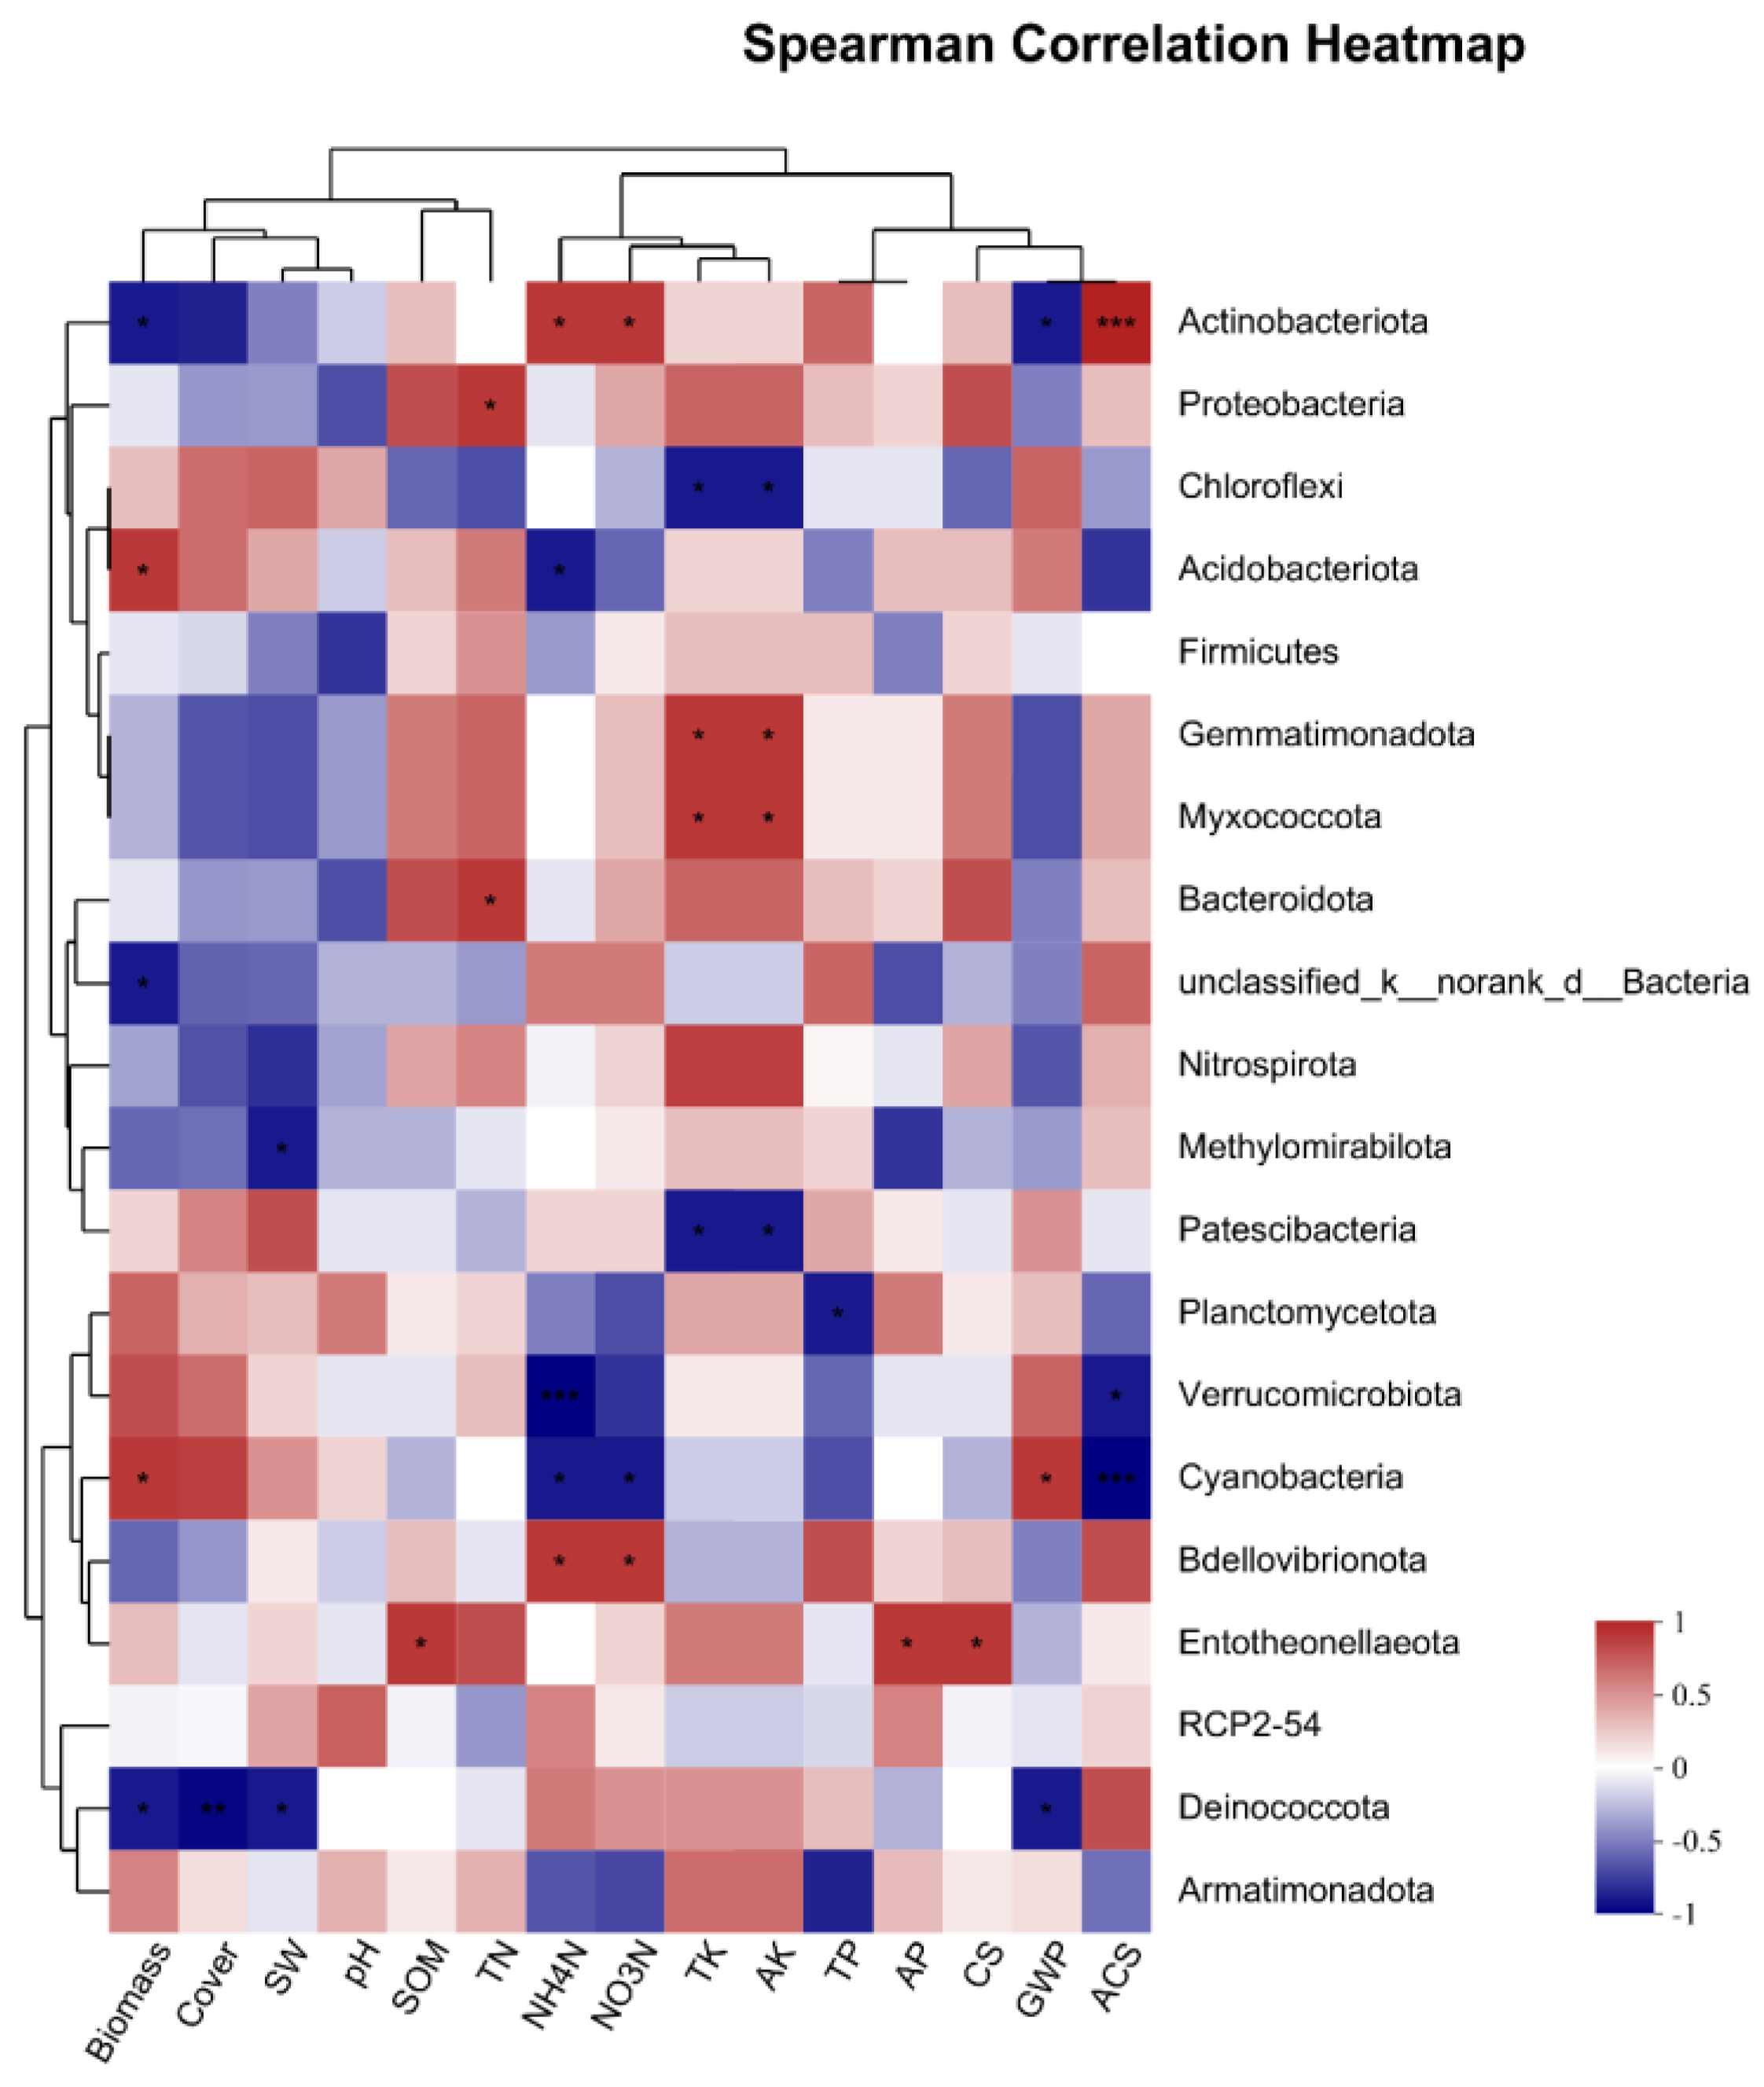
3.4.3. Correlation of CS and the GHG Budget with Soil Microorganisms

As can be seen from Figure 8, CS had a significant positive correlation with the bacteria Entotheonellaeota, and GHG had a significant negative correlation with Ctinobacteriota and Deinococcota and a significant positive correlation with Cyanobacteria. The change in annual CS was positively correlated with Ctinobacteria and negatively correlated with Verrucomicrobiota and Yanobacteria.

4. Discussion

4.1. Relationship between CS and the GHG Budget

As grasslands play a critical role as a carbon sink [30], it is essential to study and understand the mechanisms of carbon storage in these ecosystems. There is a significant negative correlation between CS and GHG in grassland mining areas. This indicates that enhancing CS can lead to the reduction of GHG emissions. Specifically, it was found that for every 1 t of CS increase per year, GHG emissions can be reduced by 0.01 t. Uttaruk, Y [31], by studying the CS and GHG emission reduction of trees, obtained the result that the CS generated in the project year was 69.54 t CO2-e/y, and the GHG emission reduction generated in the project year was 0.307 t CO2-e/y, which is similar to the results in this research. However, some studies [32] have found that the effects of different grassland types on soil GHG flux are also extremely significant. This research aims to give a conversion reference value in order to obtain more accurate measurement results, but whether this reference value has universal significance needs more measured data to compare and verify.

4.2. Influencing Factors of CS

Sequestering soil organic carbon is an effective method for absorbing atmospheric carbon dioxide [33]. Land use and land management factors affected the carbon storage [34,35]. Grassland CS in different subsidence periods was significantly positively correlated with SOM and AP and was significantly positively correlated with the bacteria Entotheonellaeota (Table 3), while the bacteria Entotheonellaeota was also positively correlated with SOM and AP (Figure 8). SOM is the decisive factor of soil bacteria in the process of vegetation restoration [36]. Some studies [37] have further distinguished the correlation between particulate organic carbon and mineral organic carbon in soil and the bacterial community participating in the C cycle and found that the bacterial community structure participating in the C cycle is mainly related to particulate organic carbon but not to mineral organic carbon. Grasslands store a significant amount of soil carbon in mineral-associated organic carbon, which is more persistent but requires higher levels of nitrogen and can become saturated [38]. Studies [39] have shown that the bacterium Entotheonella Aeota participates in the degradation of carbohydrates, the fixation of CO2, the biosynthesis of amino acids, and the transport and mineralization of heavy metals in the C/N cycle. Therefore, SOM and AP may be used as substrates in this process to promote the biological action of Entotheonella Aeota, thus affecting the change in CS. The research findings of phosphorus addition and grassland soil respiration can be used as relevant evidence [40]. According to the calculation, the grassland CS is mainly dominated by organic carbon, accounting for more than 99%. When studying the grassland ecosystem CS in Qinghai Province, Zhang [41] also found that the organic carbon stored in soil is more than 54 times that of vegetation. In addition, Valjavec [42] also obtained the same data to show this feature. In conclusion, the crucial factor for augmenting grassland CS is to enhance the organic carbon pool in the soil, and an adequate amount of AP can facilitate the production of associated microorganisms, thus subsequently promoting the increase in CS. Proper irrigation can also improve the storage of SOM [43]. However, long-term application of phosphate fertilizer will lead to decomposition of organic matter [44]. In addition, soil microbes play an indirect role in carbon cycling by enhancing soil aggregation, which helps to physically protect SOM [45]. Carbon storage in soil is significantly influenced by the dynamics of the microbial community. The contribution of microbes to carbon sequestration is determined by the interactions among the amount of microbial biomass, the structure of the microbial community, and soil properties [45]. Therefore, carbon sequestration is a physiological process in plants and organisms, and the main role of soil is to store carbon.

4.3. Influencing Factors of the GHG Budget

This finding was also reported by Hortnagl et al. (2018) in their investigation of GHG emissions from 14 grassland sites in Central Europe. Although grassland management practices have a significant impact on CH4 emissions, CO2 remains the dominant component [46]. In the case of forests and wetlands, the gap between CH4 and CO2 emissions is smaller [33]. This is mainly due to the lower CO2 flux in these ecosystems, which have higher vegetation and a greater rate of photosynthesis. This study also found that there is a significant correlation between CH4 emission and CO2 emission, and the fitting model is: CH4 = −421.8 + 482.0 × CO2, where CH4: CH4 flux, μg CH4/(m2 × h); CO2: CO2 emission, gCO2/(m2 × h). After conversion, the parameters of the equation are not consistent with those fitted by Hortnagl, L. [46] and others, but its slope (4.4) is between the fitted equations (2.7–11.0). There is also a significant correlation between CH4 and CO2 in the alpine wetland of Qinghai Lake [47], but its slope is negative. This shows that different terrestrial ecosystems have great differences in CH4 and CO2 production, but the same ecosystem, such as grassland, may have consistent laws. Nevertheless, some studies have found that there is no significant relationship between CO2 and CH4 in German grasslands [48]. Therefore, this study supports the view that there is a link between CO2 and CH4 to some extent, but it is not universal. The research scope and the data should be expanded to further verify this hypothesis. If the viewpoint is true, it can save the measurement of CH4 flux when calculating the GHG budget, which is more convenient and faster.
In addition, the GHG budget is directly proportional to the duration of subsidence and is significantly and positively related to the plant biomass and coverage. Because more than 98% of the GHG flux is composed of CO2 flux, with a longer subsidence period, vegetation recovery and plant biomass and coverage affect the CO2 flux by affecting photosynthesis, which consequently affects the GHG budget. Soil functional microbial groups are also key players in driving GHG emissions [49]. Fungi and bacteria govern most of the transformations and long-term storage of organic C in soils [45]. Their activities are instrumental in facilitating the decomposition of organic matter and the formation of stable soil organic carbon. The correlation shows that the GHG budget is negatively correlated with the bacteria Actinobacteriota and Deinococcota, positively correlated with Cyanobacteria, and positively correlated with the fungus Ascomycota. Actinobacteriota is one of its dominant strains, and the dominant bacteria are composed of Proteobacteria, Chloroflexi, Acidobacteria, and Firmicutes. All of them contain carbon-fixing genes [50], which can convert atmospheric CO2 into soil organic carbon. In this study, with a longer subsidence period, the relative abundance of Actinobacteriota decreased continuously (Figure 3), which is consistent with some experimental results in Liu Zhen’s research [50]; that is, the carbon fixation rate of microorganisms is positively correlated with some genera of Actinomycetes and negatively correlated with some genera. Cyanobacterium conducts photosynthesis and is directly related to CO2 emission. The fungus Ascomycota is the largest phylum among fungi, and 50% of it is symbiotic with lichens (algae/Cyanobacteria) [51], so it is usually studied as biological crusts in arid areas. Therefore, it can be inferred that the fungi Ascomycota and Cyanobacterium are symbiotic and jointly affect the GHG budget by influencing CO2 emission.

4.4. Inspiration for Carbon Sequestration in Grassland Mining Area

In order to achieve the goal of peak CO2 emissions, China has released documents related to forest carbon sinks, forestry project carbon sinks, wetland carbon sinks, etc., but the measures for grassland carbon sinks have not been published. It is necessary to understand the current situation of related ecosystems to formulate carbon-sink-related documents, and the most objective data with a high reference value are obtained through field detection. In the context of forest carbon sinks and forestry project carbon sinks, the variation in ecosystem CS is regarded as a carbon sink, which deviates from the international understanding of carbon sinks. While this approach may provide some guidance, it cannot fully replace the international concept. At the same time, the European Union’s current soil carbon detection methods for greenhouse gas inventories are not accurate enough to measure climate benefits [52]. Therefore, under the general trend of the concept of CS in an ecosystem, by studying the relationship between CS and GHG flux in a natural recovery state with different subsidence years, researchers can have a basic understanding and more accurate estimation of grassland areas that need to be restored.
Judging from the significant correlation indicators that affect CS and the GHG budget, CS is mainly related to the soil’s physical and chemical properties, while the GHG budget is mainly related to plant and microbial indicators. Therefore, we can infer that the main function of soil is to store carbon, and the actual carbon fixation is the result of the common physiological process of plants and related microorganisms in soil.
Because grassland CS is positively correlated with SOM and AP (Table 3), grassland CS can be increased by improving grassland soil texture or applying phosphate fertilizer. To some extent, the bacteria Entotheonellaeota can be used as an indicator of microorganism and soil physical and chemical properties to jointly characterize the situation of soil CS. The GHG flux is mainly manifested in the ability to utilize CO2. Therefore, to effectively reduce GHG emissions, the focus should be on increasing plant biomass. Additionally, promoting the activities of carbon-fixing microorganisms, such as cyanobacteria and Ascomycota, can directly reduce GHG emissions. It is also possible to cultivate a mixture of purple flowers and alfalfa in the grassland to achieve better results [53].

5. Conclusions

  • There is a significant negative correlation between grassland CS and the GHG budget in different subsidence periods. The accurate and universal parameters to describe their relationship need more measured data to compare and verify.
  • The CS in grasslands during various subsidence periods exhibits a significant positive correlation with both soil organic matter and available phosphorus, as well as with Entotheonellaeota bacteria. The underlying mechanism may involve organic matter and available phosphorus acting as substrates to facilitate the biological activity of Entotheonellaeota, thereby influencing the CS dynamics. Therefore, soil has the main role of storing carbon.
  • The GHG budget is mainly affected by CO2 emission, which is positively correlated with plant biomass and coverage, negatively correlated with the bacteria Actinobacteriota and Deinococcota, and positively correlated with Cyanobacteria and with the fungus Ascomycota. Acidobacteria has carbon fixation genes. The fungus Ascomycota and Cyanobacteria coexist, and they jointly affect the GHG budget by affecting the CO2 emission. Therefore, sequestration is a physiological process conducted by plants (i.e., grassland) and organisms (including some soil organisms but not all of them).
  • In line with the prevailing notion of the ecosystem CS, understanding the relationship between CS and GHG flux can aid in estimating the extent of grassland restoration required. Enhancing soil texture or applying phosphate fertilizer can boost grassland CS. The bacterium Entotheonellaeota, along with soil physicochemical properties, can serve as an indicator of microorganism activity and soil CS. In addition to increasing plant biomass, the activities of carbon-fixing microorganisms like cyanobacteria and Ascomycota can directly reduce GHG emissions.

Author Contributions

Conceptualization, Z.M.; methodology, Y.T.; software, Y.T.; validation, Y.T. and D.L.; formal analysis, Y.T.; investigation, Y.T., D.L., B.F., L.X., L.Z. and J.Y.; re-sources, Z.M.; data curation, Y.T.; writing—original draft preparation, Y.T.; writing—review and editing, Z.M.; visu-alization, Y.T.; supervision, Z.M.; project administration, Z.M.; funding acquisition, Z.M. All authors have read and agreed to the published version of the manuscript.

Funding

This research was funded by the National Natural Science Foundation of China (grant number 52004274).

Institutional Review Board Statement

Not applicable.

Informed Consent Statement

Not applicable.

Data Availability Statement

Data is contained within the article. The data presented in this study are available in this manuscript.

Acknowledgments

The partial data were analyzed on the online platform of Majorbio Cloud Platform (www.majorbio.com from 1 Match 2023 to 28 Match 2023).

Conflicts of Interest

The authors declare that they have no known competing financial interests or personal relationships that could have appeared to influence the work reported in this paper.

References

  1. Luo, Y.X.; Li, Y.X.; Liu, S.W.; Yu, P.J. Effects of vegetation succession on soil organic carbon fractions and stability in a karst valley area, Southwest China. Environ. Monit. Assess. 2022, 194, 562. [Google Scholar] [CrossRef] [PubMed]
  2. Bai, Y.; Cotrufo, M.F. Grassland soil carbon sequestration: Current understanding, challenges, and solutions. Science 2022, 377, 603–608. [Google Scholar] [CrossRef]
  3. Khan, M.Z.; Chiti, T. Soil carbon stocks and dynamics of different land uses in Italy using the LUCAS soil database. J. Environ. Manag. 2022, 306, 114452. [Google Scholar] [CrossRef] [PubMed]
  4. Schmidt, M.W.I.; Torn, M.S.; Abiven, S.; Dittmar, T.; Guggenberger, G.; Janssens, I.A.; Kleber, M.; Kogel-Knabner, I.; Lehmann, J.; Manning, D.A.C.; et al. Persistence of soil organic matter as an ecosystem property. Nature 2011, 478, 49–56. [Google Scholar] [CrossRef] [PubMed]
  5. Dang, Z.; Guo, N.; Li, S.; Degen, A.A.; Cao, J.; Deng, B.; Wang, A.; Peng, Z.; Ding, L.; Long, R.; et al. Effect of grazing exclusion on emission of greenhouse gases and soil organic carbon turnover in alpine shrub meadow. Sci. Total Environ. 2023, 858, 159758. [Google Scholar] [CrossRef]
  6. Li, S.; Chen, P.; Mei, B.; Yue, H.; Zheng, X.; Ren, G.; Aruhan, S. Annual methane uptake of an artificial grassland under different grazing strategies. Nutr. Cycl. Agroecosyst. 2023, 125, 29–42. [Google Scholar] [CrossRef]
  7. Perez-Quezada, J.F.; Cano, S.; Ibaceta, P.; Aguilera-Riquelme, D.; Salazar, O.; Fuentes, J.P.; Osborne, B. How do land cover changes affect carbon-nitrogen-phosphorus stocks and the greenhouse gas budget of ecosystems in southern Chile? Agric. Ecosyst. Environ. 2022, 340, 108153. [Google Scholar] [CrossRef]
  8. Jin, Y.; Tian, D.; Li, J.; Wu, Q.; Pan, Z.; Han, M.; Wang, Y.; Zhang, J.; Han, G. Water causes divergent responses of specific carbon sink to long-term grazing in a desert grassland. Sci. Total Environ. 2023, 873, 162166. [Google Scholar] [CrossRef]
  9. Chang, J.; Ciais, P.; Gasser, T.; Smith, P.; Herrero, M.; Havlík, P.; Obersteiner, M.; Guenet, B.; Goll, D.S.; Li, W. Climate warming from managed grasslands cancels the cooling effect of carbon sinks in sparsely grazed and natural grasslands. Nat. Commun. 2021, 12, 118. [Google Scholar] [CrossRef]
  10. Rafalska, A.; Walkiewicz, A.; Osborne, B.; Klumpp, K.; Bieganowski, A. Variation in methane uptake by grassland soils in the context of climate change—A review of effects and mechanisms. Sci. Total Environ. 2023, 871, 162127. [Google Scholar] [CrossRef]
  11. Jin, X.; Wu, F.; Wu, Q.; Hedenec, P.; Peng, Y.; Wang, Z.; Yue, K. Effects of drying-rewetting cycles on the fluxes of soil greenhouse gases. Heliyon 2023, 9, e12984. [Google Scholar] [CrossRef] [PubMed]
  12. Zuo, X.; Zhang, J.; Zhou, X.; Zhao, X.; Wang, S.; Lian, J.; Lv, P.; Knops, J. Changes in carbon and nitrogen storage along a restoration gradient in a semiarid sandy grassland. Acta Oecol. Int. J. Ecol. 2015, 69, 1–8. [Google Scholar] [CrossRef]
  13. He, S.; Liang, Z.; Han, R.; Wang, Y.; Liu, G. Soil carbon dynamics during grass restoration on abandoned sloping cropland in the hilly area of the Loess Plateau, China. Catena 2016, 137, 679–685. [Google Scholar] [CrossRef]
  14. Mu, Y.; Liu, Y.; Tian, F.-P.; Chang, X.-F.; Wu, G.-L. Influence of artificial grassland restoration on soil carbon pool in an arid mining land. J. Soil Sci. Plant Nutr. 2016, 16, 890–900. [Google Scholar] [CrossRef]
  15. Shrestha, R.K.; Lal, R.; Penrose, C. Greenhouse Gas Emissions and Global Warming Potential of Reclaimed Forest and Grassland Soils. J. Environ. Qual. 2009, 38, 426–436. [Google Scholar] [CrossRef] [PubMed]
  16. Fox, J.E.; Campbell, J.E.; Acton, P.M. Carbon Sequestration by Reforesting Legacy Grasslands on Coal Mining Sites. Energies 2020, 13, 6340. [Google Scholar] [CrossRef]
  17. Qu, R.; He, L.; He, Z.; Wang, B.; Lyu, P.; Wang, J.; Kang, G.; Bai, W. A Study of Carbon Stock Changes in the Alpine Grassland Ecosystem of Zoige, China, 2000–2020. Land 2022, 11, 1232. [Google Scholar] [CrossRef]
  18. Li, Z.; Tang, Q.; Wang, X.; Chen, B.; Sun, C.; Xin, X. Grassland Carbon Change in Northern China under Historical and Future Land Use and Land Cover Change. Agron. Basel 2023, 13, 2180. [Google Scholar] [CrossRef]
  19. Xu, Z.; Zhao, Z.; Lu, C. The Contribution of Land Use and Land Cover on Carbon Storage in the North Tibet Plateau, China. J. Anim. Plant Sci. 2021, 31, 1598–1609. [Google Scholar] [CrossRef]
  20. Conrad, R. Microbial Ecology of Methanogens and Methanotrophs. Adv. Agron. 2007, 96, 1–63. [Google Scholar]
  21. Li, T.; Zhou, Q.X. The key role of Geobacter in regulating emissions and biogeochemical cycling of soil-derived greenhouse gases. Environ. Pollut. 2020, 266, 115135. [Google Scholar] [CrossRef] [PubMed]
  22. Davidson, E.A.; Savage, K.; Verchot, L.V.; Navarro, R. Minimizing artifacts and biases in chamber-based measurements of soil respiration. Agric. For. Meteorol. 2002, 113, 21–37. [Google Scholar] [CrossRef]
  23. Nelson, D.W.; Sommers, L.E. Total Carbon, Organic Carbon, and Organic Matter. In Methods of Soil Analysis; Wiley: Hoboken, NJ, USA, 1996; pp. 961–1010. [Google Scholar]
  24. Liu, C.S.; Zhao, D.F.; Ma, W.J.; Guo, Y.D.; Wang, A.J.; Wang, Q.L.; Lee, D.J. Denitrifying sulfide removal process on high-salinity wastewaters in the presence of Halomonas sp. Appl. Microbiol. Biotechnol. 2016, 100, 1421–1426. [Google Scholar] [CrossRef] [PubMed]
  25. Chen, S.F.; Zhou, Y.Q.; Chen, Y.R.; Gu, J. fastp: An ultra-fast all-in-one FASTQ preprocessor. Bioinformatics 2018, 34, 884–890. [Google Scholar] [CrossRef] [PubMed]
  26. Magoc, T.; Salzberg, S.L. FLASH: Fast length adjustment of short reads to improve genome assemblies. Bioinformatics 2011, 27, 2957–2963. [Google Scholar] [CrossRef] [PubMed]
  27. Callahan, B.J.; McMurdie, P.J.; Rosen, M.J.; Han, A.W.; Johnson, A.J.A.; Holmes, S.P. DADA2: High-resolution sample inference from Illumina amplicon data. Nat. Methods 2016, 13, 581–583. [Google Scholar] [CrossRef]
  28. Bolyen, E.; Rideout, J.R.; Dillon, M.R.; Bokulich, N.; Abnet, C.C.; Al-Ghalith, G.A.; Alexander, H.; Alm, E.J.; Arumugam, M.; Asnicar, F.; et al. Reproducible, interactive, scalable and extensible microbiome data science using QIIME 2. Nat. Biotechnol. 2019, 37, 852–857. [Google Scholar] [CrossRef]
  29. Schloss, P.D.; Westcott, S.L.; Ryabin, T.; Hall, J.R.; Hartmann, M.; Hollister, E.B.; Lesniewski, R.A.; Oakley, B.B.; Parks, D.H.; Robinson, C.J.; et al. Introducing mothur: Open-Source, Platform-Independent, Community-Supported Software for Describing and Comparing Microbial Communities. Appl. Environ. Microbiol. 2009, 75, 7537–7541. [Google Scholar] [CrossRef]
  30. Norderhaug, A.; Clemmensen, K.E.; Kardol, P.; Thorhallsdottir, A.G.; Aslaksen, I. Carbon sequestration potential and the multiple functions of Nordic grasslands. Clim. Chang. 2023, 176, 55. [Google Scholar] [CrossRef]
  31. Uttaruk, Y.; Laosuwan, T. Development of Prototype Project for Carbon Storage and Greenhouse Gas Emission Reduction from Thailand’s Agricultural Sector. Sains Malays. 2019, 48, 2083–2092. [Google Scholar] [CrossRef]
  32. Shi, H.; Shen, H.; Dong, S.; Xiao, J.; Mu, Z.; Zhang, R.; Hao, X.; Wang, Z.; Zuo, H. Six Years of Grassland Cultivation Promotes CO2, N2O Emissions and CH4 Uptake with Increasing N Deposition on Qinghai-Tibetan Plateau. Sustainability 2022, 14, 11434. [Google Scholar] [CrossRef]
  33. Liao, J.; Yang, X.; Dou, Y.; Wang, B.; Xue, Z.; Sun, H.; Yang, Y.; An, S. Divergent contribution of particulate and mineral-associated organic matter to soil carbon in grassland. J. Environ. Manag. 2023, 344, s118536. [Google Scholar] [CrossRef] [PubMed]
  34. Kumar, S.S.; Mir, S.A.; Wani, O.A.; Babu, S.; Yeasin, M.; Bhat, M.A.; Hussain, N.; Wani, A.I.A.; Kumar, R.; Yadav, D.; et al. Land-use systems regulate carbon geochemistry in the temperate Himalayas, India. J. Environ. Manag. 2022, 320, 115811. [Google Scholar] [CrossRef] [PubMed]
  35. Wani, O.A.; Kumar, S.S.; Hussain, N.; Wani, A.I.A.; Babu, S.; Alam, P.; Rashid, M.; Popescu, S.M.; Mansoor, S. Multi-scale processes influencing global carbon storage and land-carbon-climate nexus: A critical review. Pedosphere 2023, 33, 250–267. [Google Scholar] [CrossRef]
  36. Hu, L.; Li, Q.; Yan, J.H.; Liu, C.; Zhong, J.X. Vegetation restoration facilitates belowground microbial network complexity and recalcitrant soil organic carbon storage in southwest China karst region. Sci. Total Environ. 2022, 820, 153137. [Google Scholar] [CrossRef]
  37. Xue, P.P.; Minasny, B.; McBratney, A.; Pino, V.; Fajardo, M.; Luo, Y. Distribution of soil bacteria involved in C cycling across extensive environmental and pedogenic gradients. Eur. J. Soil Sci. 2023, 74, e13337. [Google Scholar] [CrossRef]
  38. Cotrufo, M.F.; Ranalli, M.G.; Haddix, M.L.; Six, J.; Lugato, E. Soil carbon storage informed by particulate and mineral-associated organic matter. Nat. Geosci. 2019, 12, 989–994. [Google Scholar] [CrossRef]
  39. Zhang, J.; Shi, Q.; Fan, S.; Zhang, Y.; Zhang, M.; Zhang, J. Distinction between Cr and other heavy-metal-resistant bacteria involved in C/N cycling in contaminated soils of copper producing sites. J. Hazard. Mater. 2021, 402, 123454. [Google Scholar] [CrossRef]
  40. Lu, X.Y.; Wen, L.; Sun, H.Y.; Fei, T.; Liu, H.; Ha, S.N.; Tang, S.M.; Wang, L.X. Responses of soil respiration to phosphorus addition in global grasslands: A meta-analysis. J. Clean. Prod. 2022, 349, 131413. [Google Scholar] [CrossRef]
  41. Chenyue, Z.; Xia, Z.; Yuchun, X.; Wenjia, T.; Lei, W. Carbon storage and distribution of grassland ecosystems in Qinghai Province. J. Beijing Norm. Univ. Nat. Sci. 2022, 58, 286–292. [Google Scholar]
  42. Valjavec, M.B.; Carni, A.; Zlindra, D.; Zorn, M.; Marinsek, A. Soil organic carbon stock capacity in karst dolines under different land uses. Catena 2022, 218, 106548. [Google Scholar] [CrossRef]
  43. Di, S.; Zong, M.M.; Li, S.Y.; Li, H.X.; Duan, C.Q.; Peng, C.H.; Zhao, Y.G.; Bai, J.Y.; Lin, C.; Feng, Y.; et al. The effects of the soil environment on soil organic carbon in tea plantations in Xishuangbanna, southwestern China. Agric. Ecosyst. Environ. 2020, 297, 106951. [Google Scholar] [CrossRef]
  44. Li, J.H.; Han, Y.W.; Ye, L.F.; Deng, H.D.; Gao, X.T.; Soromotin, A.; Kuzyakov, Y.; Knops, J.M.H.; Abbott, L.K. Effects of nitrogen and phosphorus fertilization on soil organic matter priming and net carbon balance in alpine meadows. Land Degrad. Dev. 2023, 34, 2681–2692. [Google Scholar] [CrossRef]
  45. Bailey, V.L.; Smith, J.L.; Bolton, H. Fungal-to-bacterial ratios in soils investigated for enhanced C sequestra-tion. Soil Biol. Biochem. 2002, 34, 997–1007. [Google Scholar] [CrossRef]
  46. Hoertnagl, L.; Barthel, M.; Buchmann, N.; Eugster, W.; Butterbach-Bahl, K.; Diaz-Pines, E.; Zeeman, M.; Klumpp, K.; Kiese, R.; Bahn, M.; et al. Greenhouse gas fluxes over managed grasslands in Central Europe. Glob. Chang. Biol. 2018, 24, 1843–1872. [Google Scholar] [CrossRef] [PubMed]
  47. Wu, F.; Cao, S.; Cao, G.; Chen, K.; Peng, C. The Characteristics and Seasonal Variation of Methane Fluxes from an Alpine Wetland in the Qinghai Lake watershed, China. Wetlands 2021, 41, 53. [Google Scholar] [CrossRef]
  48. Martins, C.S.C.; Nazaries, L.; Macdonald, C.A.; Anderson, I.C.; Singh, B.K. Water availability and abundance of microbial groups are key determinants of greenhouse gas fluxes in a dryland forest ecosystem. Soil Biol. Biochem. 2015, 86, 5–16. [Google Scholar] [CrossRef]
  49. Karbin, S.; Guillet, C.; Kammann, C.I.; Niklaus, P.A. Effects of Long-Term CO2 Enrichment on Soil-Atmosphere CH4 Fluxes and the Spatial Micro-Distribution of Methanotrophic Bacteria. PLoS ONE 2015, 10, e0131665. [Google Scholar] [CrossRef]
  50. Liu, Z. Microbial Pathways of Atmospheric Carbon Dioxide Fixation in Soils in the Mu Us Desert. Ph.D. Thesis, Beijing Forestry University, Beijing, China, 2019. [Google Scholar]
  51. Zhang, Q.; Wang, Q.; Ouyang, H.; Lan, S.; Hu, C. Pyrosequencing Reveals Significant Changes in Microbial Communities Along the Ecological Succession of Biological Soil Crusts in the Tengger Desert of China. Pedosphere 2018, 28, 350–362. [Google Scholar] [CrossRef]
  52. Bellassen, V.; Angers, D.; Kowalczewski, T.; Olesen, A. Soil carbon is the blind spot of European national GHG inventories. Nat. Clim. Chang. 2022, 12, 324–331. [Google Scholar] [CrossRef]
  53. Ghani, M.U.; Kamran, M.; Ahmad, I.; Arshad, A.; Zhang, C.; Zhu, W.; Lou, S.; Hou, F. Alfalfa-grass mixtures reduce greenhouse gas emissions and net global warming potential while maintaining yield advantages over monocultures. Sci. Total Environ. 2022, 849, 157765. [Google Scholar] [CrossRef] [PubMed]
Figure 1. Generalized map of the location of the research area. (a) Location of Zhalainuoer Mine (red triangle) on a map of China; (b) Distribution of specific sampling locations in (black triangle) Zhalainuoer Mine.
Atmosphere 15 00025 g001
Figure 2. Schematic diagram of static box.
Atmosphere 15 00025 g002
Figure 3. The composition of the soil bacteria community.
Atmosphere 15 00025 g003
Figure 4. Changes in carbon stock and annual average carbon stock change with subsidence time.
Atmosphere 15 00025 g004
Figure 5. Change in emission concentration of CO2 and CH4 with sampling time.
Atmosphere 15 00025 g005
Figure 6. Changes in CO2 emission, CH4 emission, and GHG with subsidence time.
Atmosphere 15 00025 g006
Figure 7. Correlation among time, CS, ACS, and GHG.
Atmosphere 15 00025 g007
Figure 8. Heatmap of correlation between CS, GHG, ACS, and bacteria. * At the level of 0.05 (double tail), the correlation is significant. ** At the level of 0.01 (double tail), the correlation is significant. *** At the level of 0.001 (double tail), the correlation is significant.
Atmosphere 15 00025 g008
Table 1. Physical and chemical properties of vegetation and soil.
YearPlantSoil
BiomassCoverWaterpHSOMTNNH4NNO3NTKAKTPAP
g%% g/kgg/kgmg/kgmg/kgg/kgmg/kgg/kgmg/kg
021.294012.57.067.520.6059.4283.200.91176.500.137.25
18.201015.25.9236.441.1348.9495.085.65337.401.4446.59
216.394417.97.4731.770.4853.2259.462.61180.080.1451.19
521.284015.97.5134.530.6639.4416.246.84408.790.1054.12
1034.859035.17.1442.111.1432.2217.554.43284.760.1386.40
1531.399016.07.1520.460.5131.568.093.41200.000.1244.34
Cover: vegetation coverage rate; Water: soil water; SOM: soil organic matter; TN: total nitrogen; NH4N: ammonium nitrogen; NO3N: nitrate nitrogen; TK: total potassium; AK: available potassium; TP: total phosphorus; AP: available phosphorus.
Table 2. α diversity of soil microbial community.
SampleAceChaoShannonSimpsonSobs
Bacteriay0146014606.7416730.0023011460
y19339336.2288090.00399933
y26546545.9557780.004601654
y59229226.3001030.003976922
y109329326.3562440.003038932
y15120112016.5751240.0025551201
Table 3. Correlation with vegetation and soil physical and chemical properties.
BiomassCoverWaterpHSOMTNNH4NNO3NTKAKTPAP
Time0.889 *0.909 *0.4240.2740.135−0.047−0.910 **−0.852 *0.147−0.051−0.3790.476
CS−0.095−0.2440.629−0.1380.998 **0.640−0.500−0.2760.7790.6650.3010.903 *
GHG0.925 *0.986 **0.4150.405−0.354−0.203−0.425−0.523−0.539−0.593−0.6460.076
* At the level of 0.05 (double tail), the correlation is significant. ** At the level of 0.01 (double tail), the correlation is significant. CS: Carbon Stock; GHG: Global Warming Potential; Cover: vegetation coverage rate; Water: soil water; SOM: soil organic matter; TN: total nitrogen; NH4N: ammonium nitrogen; NO3N: nitrate nitrogen; TK: total potassium; AK: available potassium; TP: total phosphorus; AP: available phosphorus.
Disclaimer/Publisher’s Note: The statements, opinions and data contained in all publications are solely those of the individual author(s) and contributor(s) and not of MDPI and/or the editor(s). MDPI and/or the editor(s) disclaim responsibility for any injury to people or property resulting from any ideas, methods, instructions or products referred to in the content.

