Article

Air Pollution and Climate Change Risk Perception among Residents in Three Cities of the Mexico Megalopolis

by
Karina Landeros-Mugica
1,
Javier Urbina-Soria
1,
Diana Isabel Angeles-Hernández
1,
Mirella Gutiérrez-Arzaluz
2 and
Violeta Mugica-Álvarez
2,*
1
School of Psychology, National Autonomous University of México, Universidad Ave No 30004, Ciudad Universitaria, Mexico City 04510, Mexico
2
Basic Sciences Department, Metropolitan Autonomous University, San Pablo Ave 420, Col. Nueva el Rosario, Azcapotzalco, Mexico City 02128, Mexico
*
Author to whom correspondence should be addressed.
Atmosphere 2024, 15(1), 42; https://doi.org/10.3390/atmos15010042
Submission received: 1 December 2023 / Revised: 20 December 2023 / Accepted: 25 December 2023 / Published: 29 December 2023
(This article belongs to the Section Air Quality and Human Health)

Abstract

:
Recent reports of the criteria pollutants in the Megalopolis, located in the central part of Mexico, consistently show air quality standard exceedances in most of the cities that make it up, since it is a large concentration where approximately 17% of the national population resides and because it has significant commercial and industrial development. To investigate the similarities and disparities in risk perception concerning air pollution and climate change among residents living in Central Mexico, a cross-sectional survey study was carried out within three metropolitan areas encompassed by the Megalopolis. A total of 1750 questionnaire surveys were conducted across 21 municipalities within the Mexico City Metropolitan Area (MCMA), 16 municipalities within the Toluca Valley Metropolitan Area (TVMA), and 8 municipalities within the Cuernavaca Metropolitan Area. The three metropolitan areas showed significant differences in terms of air quality perception, risk perception, attitudes, and causal attribution perception, but health-related perception did not have significant differences among the areas. The MCMA exhibited higher knowledge about air pollution, although it associated the causes with urban activities such as car usage, while the Toluca and Cuernavaca areas linked this issue to the burning of garbage, coal, wood, and agricultural activities. Although residents expressed concern about air pollution, climate change, and their effects, they do not know how to act to contribute to the solution.

1. Introduction

Currently, air pollution is considered the world’s largest environmental public health issue, accounting for 7 million deaths worldwide and causing a significant reduction in healthy life years; since 2015, the World Health Organization (WHO) has acknowledged that air pollution is a causal factor in premature death or chronic illnesses including ischemic heart disease, stroke, chronic obstructive pulmonary disease, asthma, neurogenerative conditions, and cancer, whereas in the case of children, diseases might include reduced lung growth and function, respiratory infections and aggravated asthma, mainly in low-income and middle-income countries [1]. Climate change, in conjunction with air pollution, presents an additional formidable threat to human health and well-being, while concurrently exerting a substantial economic strain on nations; as these two challenges share common underlying factors, recent research has indicated that policies aimed at mitigating and adapting to greenhouse gases (GHG) can also yield reductions in air pollution; conversely, strategies designed to combat air pollution can lead to co-benefits in addressing climate change, ultimately resulting in significant improvements in public health [2,3].
To ensure the successful design, communication, execution, and evaluation of strategies for reducing air pollution and adapting to and mitigating climate change, it is crucial to understand and comprehend the perceptions, attitudes, beliefs, and feelings, of citizens; this understanding is essential to achieve the desired level of participation and encourage residents to undertake recommended protective actions, thereby reducing health or integrity risks [4,5,6] including perception, depending on the used words [7].
On one hand, various studies demonstrate that risk perception plays a significant role in influencing individual behavioral responses to risk-related issues [8]. Most findings indicate that risk perception is a positive predictor of people’s adaptive behaviors concerning air pollution, such as reducing the use of automobiles and other types of engines, paint, and aerosols [9]. On the other hand, human behavior is influenced by causal attribution; it is considered internal when the individual believes they are the cause and external when they attribute it to other factors or people [10,11]. Finally, people’s perceptions are greatly influenced by circumstances such as age, gender, economic status, place of residence, occupation, information received, and education, as well as economic and political contexts, among other factors; consequently, their willingness to engage in actions related to environmental risks may vary [12]. However, there have been relatively few studies on perception related to air pollution, particularly in low and middle-income countries. Saksena studied the perception of people in urban European cities [13]; Oltra and Sala [14] conducted a study in four Spanish cities; Mor et al. surveyed people in Indian cities and found that sociodemographic factors were associated with an awareness of air pollution, health effects, and people’s attitudes [15]. In Africa, where information about atmospheric pollution is very limited, some air pollution perception studies have been performed in Kenya in a rural area close to a polluting industry [16]; in South Africa, in a mining district [17]; and in a poor neighborhood in Nairobi [18]. The number of investigations is higher regarding perception studies in climate change: several studies have been published in the United States for six Americas categories [19,20,21]; in Latin America, Vignola et al. [22] compared the perception of Costa Rican citizens with American residents.
Over the past 20 years in Mexico, some local studies have been conducted regarding the public perception of air pollution risks [23,24,25] and global change in Mexico by Landeros-Mugica [26] and González-Hernández et al. [27] in Nuevo Leon, Mexico. Mobility, climatic, and environmental events in Mexico City were explored by Urbina-Soria et al. [28] and Bee [29] in Guanajuato, Mexico. Landeros-Mugica et al. [30] related risk perception with exposure and commitment. However, considering that people transit between different cities due to commerce, work, or studies, such as the case of the central Megalopolis, it is important to carry out regional studies about the social perception of residents related to air pollution and climate change, since individual feelings and behaviors could be altered due to the daily or frequent transportation among nearby metropolitan areas.
Under the hypothesis that people’s risk perceptions, causal attributions, beliefs, and attitudes associated with air pollution and climate change vary across different sites and regions, the primary objective of this study was to identify these variations in three metropolitan areas of the Megalopolis: the Mexico City Metropolitan Area, the Toluca Valley Metropolitan Area, and the Cuernavaca Metropolitan Area. This will allow policymakers to establish communication strategies tailored to each area, providing essential information for making informed judgments and adopting appropriate decisions and behaviors related to health, safety, and the environment.

2. Materials and Methods

2.1. Study Zone Description

This is a cross-sectional study performed with a questionnaire survey applied in three metropolitan areas of the central Megalopolis in Mexico from March to May 2022, because this Megalopolis concentrates more than 17% of the population in seven states located in the central part of Mexico; moreover, this is the most important economic zone of the country. The selected metropolitan areas where residents were surveyed are the Mexico City Metropolitan Area (MCMA), the Toluca Valley Metropolitan Area (TVMA), and finally the Cuernavaca Metropolitan Area (CMA) (Figure 1). This selection is related to the Environmental Megalopolis Council (CAMe, its Spanish acronym) which indicated that, in these areas, at least one monitoring station in each site fails to meet both the annual and the 24-h standards for respirable and fine particles (PM10 and PM2.5), and they do not comply with the 1-h and 8-h limits for ozone [31]; additionally, a recent research study reported the PM2.5 mass exchange among these three metropolitan areas, based on meteorological conditions, as part of a comprehensive study of particle characterization [32], showing that the PM2.5 imported mass to CMA and TVMA is greater than the exported masses. The characteristics of these sites are briefly described in the following sections.

2.1.1. Mexico City Metropolitan Area

The MCMA is the largest urban concentration in the country, situated at an average altitude of 2240 masl (meters above sea level), comprising around 22 million people in 2020 and over 5,565,000 vehicles in circulation; it encompasses 16 municipalities of Mexico City, 59 municipalities of Mexico State, and also the Tizayuca municipality of Hidalgo State, and it is surrounded by mountains that hinder air dispersion; in the early 90s, it was classified by the World Health Organization as the city with the worst air quality globally [33,34]. For that reason, numerous studies were performed, and control policies were implemented to limit emissions from both mobile and stationary sources through improvements in control technologies, transitioning to low-sulfur fuels, migration of industries to other states, and the enforcement of regulatory frameworks for these sources. From 1991 to 2012, the annual average levels of air pollutants showed significant reductions at monitoring stations: approximately 80%, 87%, 22%, 28%, 58%, and 96% for carbon monoxide, sulfur dioxide, nitrogen dioxide, ozone, respirable particles, and lead, respectively [34,35]. However, in the last decade, the reductions have been less pronounced, with an additional 10%, 4%, 2%, 2%, and 2%, respectively, with better conditions prevailing for more hours and days; additionally, the air quality standards for carbon monoxide, sulfur dioxide, nitrogen dioxide, and lead associated with particles have not been exceeded in almost two decades, although ozone and fine-particle air quality standards are exceeded 50% and 40% of the days in the year, respectively, which is a big concern for environmental authorities [35].

2.1.2. Toluca Valley Metropolitan Area

The TVMA ranks first in atmospheric pollutant emissions in the country and fourth in Latin America, attributed to high industrial and agricultural activities. The TVMA has a population of 2,202,886 inhabitants and comprises 16 municipalities in the State of Mexico; on average, the altitude is 2260 masl. The NO2 concentration has sporadically exceeded limits, while SO2 and CO have consistently stayed within the norm according to monitoring data; however, high concentrations of fine and respirable particulate matter have been observed since 2002, with approximately a 50% increase from 2000 to 2011, and until 2017, these pollutants remained constant, exceeding air quality standards around 47% of the days, whereas ozone concentrations decreased by approximately 17% between 2000 and 2011 and have remained similar until 2017, with a 12% air quality standard exceedance [36,37].

2.1.3. Cuernavaca Metropolitan Area

The CMA, with around one million inhabitants in eight municipalities, has doubled its population since 1990, along with a fleet of vehicles. The region exhibits a wide variation in altitudes and terrain slopes, with Cuernavaca Municipality having the highest altitude at 1768 m and Xochitepec the lowest at 381 m on average; economic development is tied to urban planning, services, transportation, and tourism. It also hosts an industrial zone with 230 hectares and over 150 companies. Due to the inconsistent performance of the monitoring network over the years, there are no validated historical air quality records due to insufficient, temporal, and statistically limited monitoring data, and it is difficult to know the trends of pollutant concentrations, although the intermittent campaigns since 1996 indicate standards compliance with sulfur dioxide, nitrogen dioxide, and carbon monoxide standards; on the contrary, suspended particulate matter and ozone often exceed air quality norms [38,39].

2.2. Sample and Respondent Characteristics

In order to gauge public opinion on air pollution and climate change, 1750 surveys were conducted across three metropolitan areas. Data were collected through electronic devices during door-to-door visits, with the intention of garnering participation from a diverse range of individuals across genders, age groups, and urban and peri-urban areas.
To gather data for this study, a non-probability quota sampling technique was utilized. Specifically, geographic areas known as AGEBS located within a 3 km radius of air quality monitoring stations were chosen, with two areas selected randomly. Participants were then selected to meet specific quotas in terms of gender (50% male and 50% female) and age (20% each group). Sample sizes for each metropolitan area were determined based on the proportion of residents, with a confidence interval of 95% and a 5% margin of error. In this study, only 21 municipalities were included within the MCMA, specifically those with air quality monitoring. The number of survey participants in each municipality ranged from 30 to 35 residents, except for Ecatepec, with three monitoring stations where 90 residents were surveyed, and Coyocan, Cuajimalpa, Iztapalapa, Nezahualcoyotl, and Tlalnepantla with two nearby stations where 60 people were surveyed. In the TVMA, 30 surveys were administered in each municipality, except Toluca, the largest one, where there are four monitoring stations; there, 20 people were surveyed within 4 km of each station. Finally, at CMA, the survey number in each municipality was between 30 and 40 except for Cuernavaca, which is the most populated municipality with 2 monitoring stations; 70 people were surveyed there. Table 1 displays the sample characteristics in the responses of the last section of the questionnaire.

2.3. Questionnaire

A qualitative approach was employed through the content analysis of programs, public policies, and prior research, as well as semi-structured interviews with experts from both academia and local and national environmental agencies specializing in air pollution and climate change, aimed to uncover the history, current status, and contextualization of air quality and climate change in the three metropolitan areas. By analyzing public programs and policies, we gained insight into the current measures being taken by the government and institutions to address air quality, as well as the state of air quality in different areas. Previous research helped us identify psychosocial variables that are relevant to studying air quality, such as risk perception, attributed causality, and perceived vulnerability. We also gathered information on the sources of contaminants and their health effects, as well as the populations most at risk. The initial questionnaire was developed based on findings from the qualitative phase, which was piloted in four municipalities. This pilot study tested the wording and relevance of the items, the functionality of response options; adjustments and modifications were made based on the data collected.
The same survey with 85 questions was used for the three metropolitan areas. The four-point Likert scale questions were used because respondents have different abilities to discriminate among various categories, and the use of face-to-face interviews poses challenges in incorporating a larger number of response categories; however, as these kind of questions could limit the capacity to capture different and complex details of risk perceptions, multiple-choice and ranking questions were also included in order to enrich the research by providing a more comprehensive and contextualized understanding [40].
For the questionnaire validation, a principal component analysis with Varimax rotation was employed to identify underlying components that enabled the evaluation of constructs based on the grouping of items in one or more dimensions for the Likert scales. The Cronbach alpha test was used to evaluate internal consistency, and an acceptable range between 0.65 and 0.9 was considered; the Cronbach alpha was calculated for each dimension and the full scale. (See Table 2, Table 3, Table 4, Table 5 and Table 6).
The final questionnaire, constructed and validated, consisted of six sections:
Section 1. Introduction, filter questions, and participation consent.
Section 2. Air quality perception.
Section 3. Risk perception. Levels, frequency, beliefs, attitudes.
Section 4. Causal attribution perception. Responsible causes.
Section 5. Air quality and health. Consequences, symptoms, diseases, relationships.
Section 6. Sociodemographic data. Sex, age, education, socioeconomic level.
The three first questions of the survey in Section 1 were aimed at learning if respondents were adults, lived in that house, and if they agreed to participate after receiving the introductory information.

2.4. Air Quality Perception

The four multiple-choice questions included in Section 2, related to air quality perception, are organized in Table 2.

2.5. Air Quality Risk Perception, Beliefs, and Attitudes

This section comprises a total of thirteen multiple-choice questions that aim to evaluate risk perception (risk, frequency, and exposure) and beliefs surrounding the ease and necessity of taking care of air quality. Additionally, seven questions explore the various environmental phenomena that can impact air pollution, including temperature, wind speed, rain, drought, volcanic ashes, deforestation, and climate change (See Table 3).
Participants were surveyed using a 4-point Likert scale to assess their attitudes towards air pollution. The survey included 10 statements related to perceived knowledge and awareness of air quality (cognitive), concerns about air pollution and climate change (affective), and preparedness and feasibility of protective measures to address these environmental issues (behavioral).

2.6. Air Pollution Causal Attributions

Two scales were developed to assess causal attributions of air pollution. First, a 22-item, 4-point Likert scale was presented to residents to understand their perceptions of responsibility for pollution sources. The items are presented in Table 5.
Then, five items were evaluated with the same four-point response scale to identify participants’ perceptions of the responsibility of different characteristics. The items can be seen in Table 6.

2.7. Perceived Air Pollution Consequences and Health Relationships

This section contains two scales that aim to assess participants’ perceptions of the health and environmental consequences of poor air quality (seven items) and identify the individuals who are most likely to be affected (five items). See Table 7 and Table 8.
Participants were asked (yes or no questions) to report whether they had been diagnosed with diseases associated with exposure to air pollution (heart failure, heart attack, thrombosis, obstructive pulmonary disease, cerebral hemorrhage, pulmonary emphysema, chronic bronchitis, or allergic rhinitis) or whether they had presented associated symptoms during the last month (allergy, poor performance, headache, sore throat, stress, eye irritation—conjunctivitis—, shortness of breath, unusual fatigue, flu, chest tightness or pain, palpitations, cough, dryness, or skin irritation). Then, they were asked to identify the months in which they experienced more respiratory illness.
In the end, socioeconomic data were collected: sex, age, educational level, main transportation mode (car, public transportation, or bicycle), and socioeconomic level (calculated from six multiple-choice questions).

2.8. Statistical Analysis

Resident responses were analyzed using Statistical Package for Social Sciences (SPSS) version 28. Proportions (%) were used to report variables for air quality, risk perception, causal attributions, consequences, and health in descriptive statistics summaries. The Kruskal–Wallis with Bonferroni post hoc test was used to assess differences in perception across the three metropolitan areas. For the ranking question, chi squared was used. The significance level was set at 0.05 with the corresponding 95% confidence intervals. The report presents the significant differences among groups, as indicated by the H of KW and p values.

3. Results

3.1. Air Quality Perception

This section describes the perception of the air quality that residents breathe in their living areas, exploring how these perceptions vary across cities and have changed over time (Figure 2). The analysis revealed significant distinctions across all surveyed aspects, with the MCMA registering the poorest air quality.
Approximately half of the respondents from MCMA expressed the belief that the air they breathe is either bad or very bad. In contrast, around 60% of participants from TVMA and CMA characterized their air quality as regular. Significant differences were found between the three areas (H (2) = 101.50, p = 0.000). When comparing perceptions with other cities, nearly half of MCMA residents perceive their air as more polluted than elsewhere. Conversely, over half of those from TVMA and CMA believe their air is less polluted. Significant differences were found between MCMA and the other two areas (H (2) = 433.36, p = 0.000).
Participants from all three areas agree that the air was less polluted a decade ago. However, distinctions arise, notably with 32% of MCMA participants expressing that the air was either equally or more polluted a decade ago (H (2) = 24.053, p = 0.000). The air quality ten years ago was perceived as less polluted in TVMA than in MCMA (post hoc p = 0.000). Anticipating the future, more than 80% of respondents from all areas foresee increased pollution in the next decade. The analysis showed significant differences between two areas: in MCMA, 14% believe it will remain equally polluted or become less polluted, a perspective shared by only 7% in TVMA (H (2) = 11.225, p = 0.004; post-hoc p = 0.002).

3.2. Air Quality Risk Perception

To comprehensively analyze risk perception among residents in the three areas, different variables were taken into consideration. The examined variables for assessing risk perception encompassed the perceived level of risk, the perceived frequency, and the most commonly identified time of year for heightened pollution. The study also explored beliefs regarding the necessity, usefulness, and ease of caring for air quality. Furthermore, attitudes toward air pollution and climate change were assessed across three components: cognitive (perceived knowledge and awareness), affective (concern), and behavioral (preparation and the feasibility of protection).
At the outset, participants were queried about the frequency, perceived risk level, and timing of air pollution peaks. Noteworthy variations were identified based on the metropolitan area of residence. In the MCMA, participants perceived air pollution as a highly risky and frequent occurrence. In the TVMA, air pollution was viewed as somewhat risky and somewhat frequent, while in the CMA, 30% perceived it as not very risky, with only 15% considering it very risky or as something occurring infrequently. Significant differences between the three areas were found (H (2) = 111.162, p = 0.000). As can be seen in Figure 3a, across all areas, there was a higher perception of frequency compared to the level of perceived risk; consequently, a moderate correlation was found between frequency and risk perception (spearman r = 0.427, p = 0.00).
The frequency perception aligns with how inhabitants perceive the months with more significant pollution levels. Figure 3b illustrates that pollution levels are perceived to be higher in December in all three areas; however, specific increases vary by city and likely correlate with geographical and climatic characteristics. In the MCMA, residents identified a period of air pollution increase starting in November, peaking in December, and subsiding in January and February. Another increase is noted from March to May before a subsequent decline; interestingly, an increase is also perceived in September. In the TVMA, a similar surge is observed in November and December, with a secondary peak in March; from May to October, a reduced perception of pollution is noted. Lastly, in the CMA, individuals perceive the highest pollution levels from March to May, with the other months indicating low pollution perception, except for a slight increase in December.
Figure 4 reveals distinctive patterns in beliefs, showing significant differences among the three areas regarding the usefulness (H (2) = 6.028, p = 0.048) and ease of caring for air quality (x2 = 6.859, p = 0.032). Respondents generally agreed that this is very necessary, with more than 70% response.
In the people’s beliefs regarding the interrelation of various environmental phenomena, the three study areas converge in their viewpoints. Three-quarters of the participants assert that climate change and volcanic ash wield significant influence over air quality. Approximately 60% believe that deforestation and rainfall play a role, and half of the respondents contend that droughts are closely linked. Conversely, extreme temperatures and winds, regardless of their strength, are perceived by 20% of the sample as having minimal or no impact. Significant disparities were identified in the perception of the impact of winds on air quality (H (2) = 10.475, p = 0.005). In the MCMA, a higher percentage of individuals (50%) believed that winds have a significant influence, compared to the CMA, where only 40% shared this view (post hoc p = 0.006). Similarly, there were notable differences in the perception of deforestation’s impact (H (2) = 7.185, p = 0.028). Approximately 83% of respondents from TVMA asserted that deforestation has a substantial influence, while this percentage slightly decreased to 75% in the MCMA (post hoc p = 0.022). A detailed breakdown of responses for the entire sample can be found in Figure 5.
To assess attitudes towards air pollution and climate change, a series of questions were employed to explore cognitive and perceived knowledge-based factors linked to both phenomena, as well as affective components related to concern when they occur. Additionally, the study looked at behavioral aspects, including individual sense of preparedness and the potential for protective measures.
Figure 6 displays findings on the public perceived knowledge and awareness of air quality. The results indicate that awareness of air quality varies between 51% and 55% among respondents in the three areas. However, just over 50% feel that they have little to no knowledge about addressing climate change. Notably, there are significant differences between the areas in terms of identifying zones with good or bad air quality (H (2) = 14.534, p = 0.001). Specifically, 60% of respondents in Cuernavaca mostly identify areas with good or bad air quality, while only 40% in Mexico City share the same perception (post hoc p = 0.001). Furthermore, significant differences are found in terms of knowing what to do (H (2) = 7.587, p = 0.023). Half of the MCMA inhabitants express having a lot or some perceived knowledge about addressing poor air quality, while only around 40% in Toluca feel the same (post hoc = 0.031).
The emotional dimension of attitudes toward air pollution and climate change is reflected in the concerns expressed by participants, as depicted in Figure 7, variations between the areas were evident in the level of concern for air pollution (H (2) = 19.629, p = 0.000) and climate change (H (2) = 30.385, p = 0.000). Significantly, responses from MCMA participants differed from those in the metropolitan areas of Toluca and Cuernavaca, demonstrating greater levels of concern for both air pollution (post hoc p = 0.006) and climate change (post hoc p = 0.002), respectively.
The final aspect concerns behavior, specifically the ability to safeguard oneself and prepare for both poor air quality and climate change (Figure 8). Just over 60% of respondents across the three areas feel inadequately prepared to confront poor air quality, with half of them not perceiving the possibility of self-protection. Regarding climate change, significant differences emerged in perception of preparedness (H (2) = 8.362, p = 0.015) and the ability to protect oneself from it (H (2) = 9.185, p = 0.010). Residents of Mexico City feel more prepared than those from Toluca to face climate change (p = 0.013) and more able to safeguard themselves from this phenomenon than their counterpart from Cuernavaca (p = 0.032). A moderate correlation was found between the cognitive and behavioral components (Spearman r = 0.550, p = 0.00) These results suggest that those who perceive they have knowledge and awareness feel more prepared and able to protect themselves.

3.3. Causal Attribution Perception

Causal attribution plays a crucial role in the examination of environmental risks. In classifying sources emitting atmospheric pollutants, we have identified four categories: mobile, area, stationary, and natural. Table 9 outlines the percentages of responses regarding the degree of air pollution attributed to different sources, including various vehicle types, activities and services, industrial activities, and natural events. Table 9 also shows the perception differences among the three metropolitan areas under analysis, emphasizing variations based on the type of emission source.
In terms of mobile sources, there is a notable tendency to attribute higher pollution levels to service vehicles rather than private individuals. Across all three zones, trailers and cargo trucks emerge as the most significant contributors, accounting for more than 60% of responses categorized as “A lot”. Additionally, there is a consensus that foreign buses also play a substantial role in air pollution. However, significant differences exist among the three cities. For instance, 60% of MCMA residents perceive public transport as a major contributor to air pollution, while 56% of TVMA residents share this view. In contrast, only 47% of CMA residents hold a similar opinion. Regarding delivery and service trucks, more than half of Mexico City participants believe that they cause a significant amount of pollution, whereas 42% of those in the Toluca Valley and 37% in Cuernavaca believe they contribute to pollution to some extent.
Significant differences in perceptions emerge across the three regions when considering private vehicles. Over 50% of respondents in the MCMA area believe that cars significantly contribute to pollution, whereas 42% of respondents in the TVMA and 40% in the CMA consider cars to be somewhat polluting. Furthermore, there are distinctions in the perceived impact of motorcycles and taxis/Uber/Didi, with the metropolitan area of Mexico City having the highest percentage of respondents who believe that these vehicles pollute somewhat or a lot. In the TVMA and the CMA, between 30% and 40% of respondents believe that these vehicles contribute somewhat or little to pollution.
Table 9 also illustrates significant differences in response percentages regarding causal attributions to area sources. Particularly noteworthy are the significant discrepancies in perceived pollution levels from businesses in the services sector. Approximately 58% of individuals in MCMA perceive them as somewhat or highly polluting, whereas 52% of those in CMA consider them to be minimally or not polluting. Regarding construction, differences were observed between Mexico City and Cuernavaca, with 15% of individuals in the former perceiving them as not polluting at all, while only 10% of those in the latter held the same view.
Perceptions of pollution vary among the three metropolitan areas, particularly concerning mechanical, carpentry, tinsmithing, and printing workshops. In the MCMA, 64% of individuals find them somewhat or very polluting, while in TVMA, 57% share a similar opinion, and in Cuernavaca, 54% express this view. The perceived level of pollution from gas stations also varies significantly, with a similar response tendency. Concerning charcoal- or wood-fired restaurants, MCMA believes that they are somewhat or very polluting (70%), in contrast to CMA, where only 59% hold the same perception. Finally, regarding hotels and spas, evident differences exist between the three areas, CMA attributing greater pollution (43%), while Toluca and Mexico City have lower attributions (31% and 32%, respectively), indicating little or no pollution.
Several activities are commonly identified as area sources of pollution, including garbage dumps, planting, and harvesting. However, it is crucial to note that these activities differ significantly regarding their perceived impact on air quality. Garbage dumps, planting, and harvesting are generally considered highly polluting in all three zones, with a majority of respondents in TVMA selecting “a lot” as their response. CMA and MCMA exhibit similar trends, although to a lesser extent. In the case of planting and harvesting in the metropolitan area of Cuernavaca, 33% of participants consider this activity to be somewhat or very polluting. On the other hand, only 20% of participants in the Mexico City metropolitan area believe that this activity contributes to the pollution of the area.
The results concerning stationary sources of air pollution revealed significant differences, with the MCMA having a lower percentage perceiving it as a major cause. In the CMA, a third of the inhabitants believe that mines cause a lot of pollution, contrasting with the MCMA, where almost 70% think it is not a significant cause of pollution in the area. Regarding cement plants, Cuernavaca shows a higher attribution of contamination causality (35% responding “A lot”, followed by the Toluca (29%) and, finally, Mexico City (19%)). Prominent differences among the three areas are also observed regarding the perceived pollution level from factories and brickyards. It is believed that brick factories heavily or somewhat pollute the air in TVMA (60%) and Cuernavaca (50%), while 50% of the MCMA perceives them as little or non-polluting. Factories were perceived as an important source of pollution in TVMA (67%) and CMA (53%), but not as much in the MCMA, where only 40% hold the same view.
In addition to pollutants originating from human activities, natural phenomena can be sources of atmospheric pollutants. In MCMA, half of the participants believe that forest fires, blowing dust, and erosion have little or no impact on pollution levels, but in CMA and TVMA, forest fires are considered highly polluting (around 70%). Blowing dust and erosion are associated with the highest contamination levels in Toluca (approximately 70%), followed by the Cuernavaca area (65%).
The perception of causal attribution is closely linked to those deemed responsible for causing air pollution. As depicted in Figure 9, individuals in the three areas feel less accountable and tend to attribute more responsibility to their neighbors, fellow residents of their municipality, and, to some extent, people living in the city and metropolitan area. Data reveal significant differences at the personal level (H (2) = 9.562, p = 0.008) of responsibility perceived by people from MCMA compared to those from Toluca or Cuernavaca. Those in MCMA tend to attribute more responsibility to their neighbors (H (2) = 19.636, p = 0.000) and fellow residents of their municipality (H (2) = 16.925, p = 0.000) than individuals in the other two areas. While MCMA and TVMA assign similar percentages of responsibility to the inhabitants of their city (H (2) = 40.497, p = 0.000) and the metropolitan area (H (2) = 37.781, p = 0.000), the percentage is lower in the CMA.
In addition to the previously mentioned sources, it is crucial to consider daily activities that significantly influence air quality (Figure 10). When respondents were questioned about the top three behaviors contributing to pollution, substantial variations emerged regarding their ranking preferences in the three metropolitan areas. Significant differences were observed in the behaviors they ranked in first (x2 = 77.040, p = 0.000), second (x2 = 38.341, p = 0.000), and third place (x2 = 42.576, p = 0.000). The most frequently mentioned behavior in the first position is burning garbage or engaging in bonfires, particularly noted in Cuernavaca and Toluca. The second most commonly cited activity involves using firewood, charcoal, or fireplaces for heating homes, with a lower proportion in the MCMA. Concerning environmental impact, those in the TVMA identify fireworks as highly pollutant. However, car usage has a more significant contribution to pollution in the MCMA.

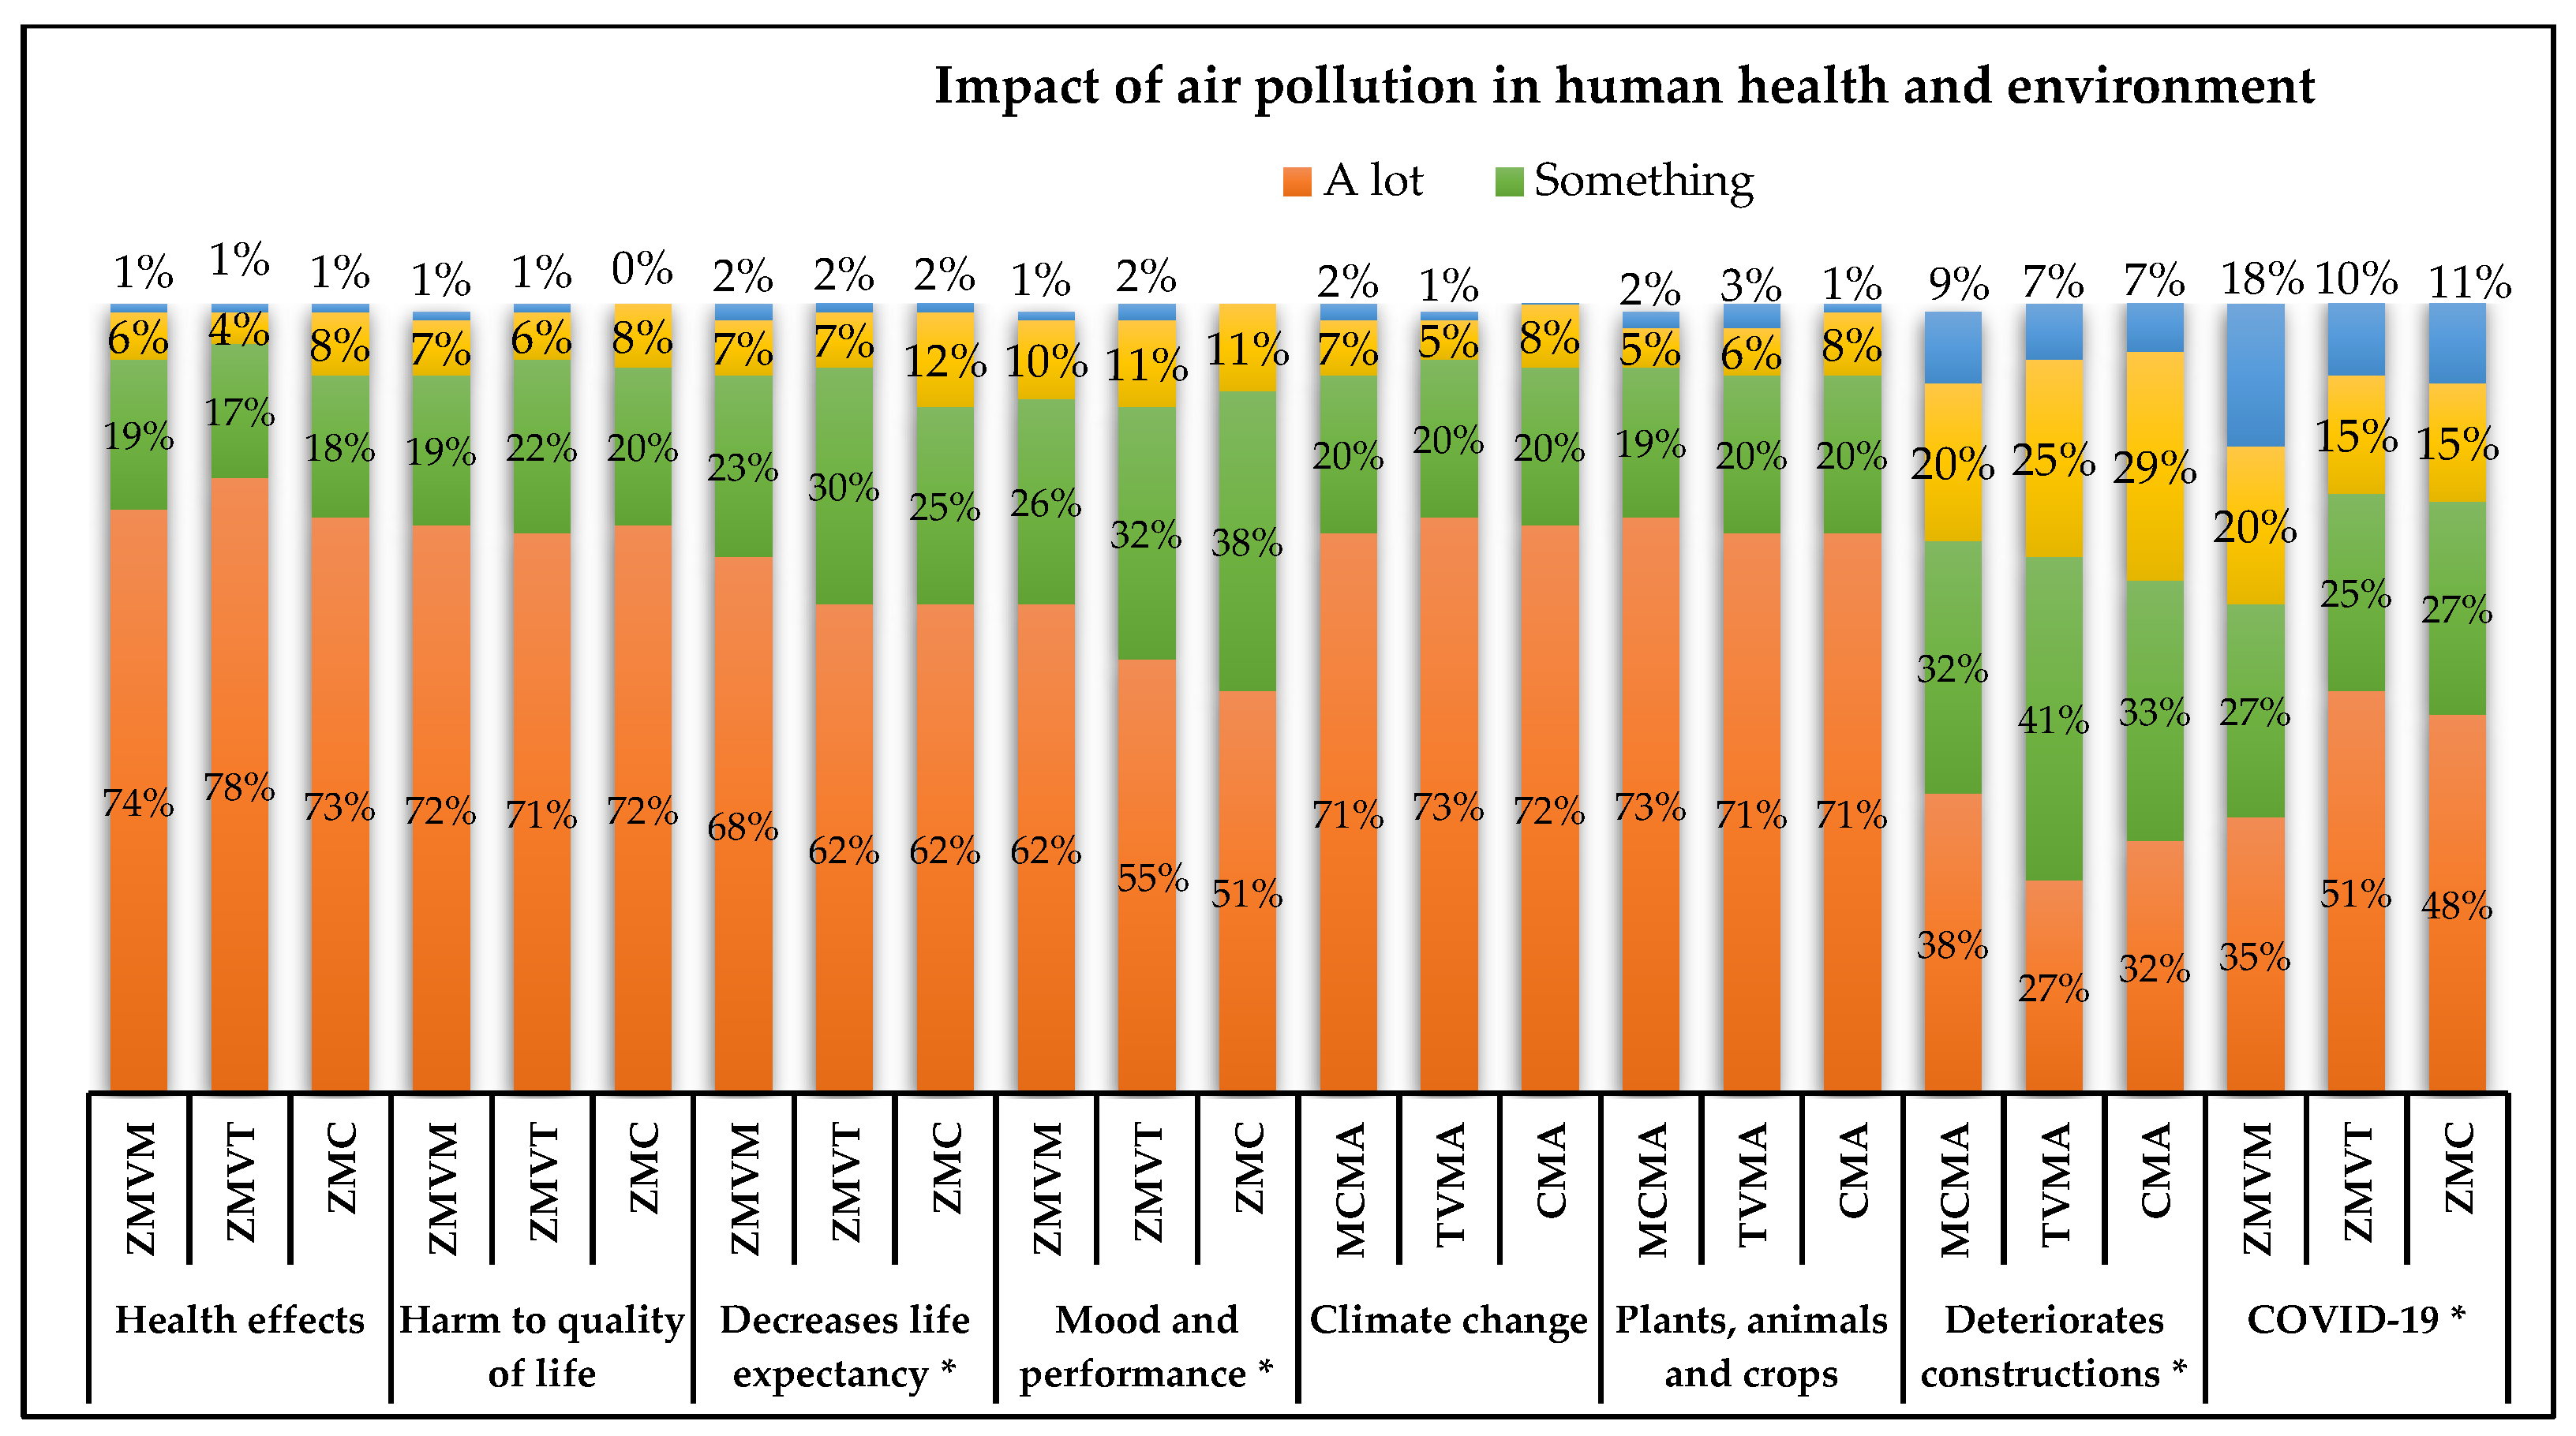
3.4. Air Quality Consequences and Health

Figure 11 shows the survey results, focusing on the percentage of responses regarding the consequences of air pollution. A predominant agreement emerges among most respondents, indicating that air pollution significantly affects health and quality of life negatively. Further analysis reveals noteworthy differences between the three study areas; particularly, a high percentage of individuals from the MCMA (68% and 62%) believed that poor air quality can substantially reduce life expectancy (H (2) = 6.892, p = 0.032) and negatively affect attitude and performance (H (2) = 10.866, p = 0.004), respectively. It is noteworthy that participants were also asked about any potential connection to COVID, revealing significant variations between the metropolitan areas of TVMA (50%) and CMA (48%) versus the MCMA (35%).
According to the survey, a vast majority of respondents believe that air pollution significantly affects climate change, as well as the well-being of plants, animals, and crops. This perspective resonated with approximately 70% of the population in each surveyed group. Interestingly, the impact of air pollution on buildings yielded different results. Specifically, 70% of those in Mexico City indicate that pollution damages buildings, whereas this proportion dropped to 60% in the other two groups, and this observed difference proved to be statistically significant, (H (2) = 8.604, p = 0.014).
To identify which demographic is perceived as the most vulnerable to the effects of air quality, respondents were asked about the extent to which different groups of people suffer from the consequences of air pollution. Figure 12 provides a detailed breakdown of the percentages obtained from residents of the three metropolitan areas. The findings reveal a pattern where individuals perceive themselves and their neighbors as less vulnerable, while people residing in the city, municipality, or the metropolitan area have a greater probability of suffering damage.
When examining perceptions based on the area of residence, significant disparities emerge regarding the extent to which individuals and their neighbors are affected by pollution (H (2) = 35.219, p = 0.000; x2 = 16.610, p = 0.000). Intriguingly, the data suggest that residents of the MCMA exhibit a slightly higher perception of vulnerability compared to those in the other two cities. Furthermore, individuals in the TVMA and CMA perceive that the consequences of pollution are equally experienced by themselves, their families, and their neighbors, while those in the MCMA express a higher likelihood of the consequences affecting the entire population (H (2) = 35.048, p = 0.000). All three groups believe that residents of the city and metropolitan area will be the most impacted. Statistical differences also indicate that the CMA has a lower perceived likelihood of being affected compared to the other two (H (2) = 11.348, p = 0.003; H (2) = 10.670, p = 0.000).
The results of this research show the importance of carrying out this type of study in all metropolitan areas of the Megalopolis and in other regions of the country. It is interesting to note that in the megacity of the MCMA, people are more aware about air pollution and its risks because at least once a year the environmental authorities decree an environmental contingency situation where mobility is restricted and health damage is reported in all media; this population is aware and mainly perceive the pollution produced by mobile sources, but almost not by the industries, since a large part of them emigrated to other places due to strong regulations. It is presumed that this type of perception is similar to the other two large metropolitan areas in Mexico: Guadalajara and Monterrey, as well as big cities in the world. On the other hand, in the TVMA, although the concentrations are higher, people perceive less risk from air pollution and attribute it to industry, since they have a large industrial corridor visible to the entire population; so, the perception observed in this city could be similar to that experienced by medium-sized cities in the Megalopolis such as Hidalgo and Querétaro that have large industrial corridors, or in cities with important industrial zones. Finally, in the case of Cuernavaca, which is a small city with only a few years of air pollution monitoring, the perception of risk is lower, and air pollution is more related to natural sources and much less to vehicles and industries, since it has agricultural areas and many areas not yet built, which can happen in the smaller cities of this and other countries.
Since most people perceive a close relationship between air quality and health, the aim was to identify diagnosed diseases and experienced symptoms in the month prior to the survey. Allergic rhinitis and chronic bronchitis are notably reported more frequently than other diseases, particularly in the MCMA. As for symptoms, flu, stress, chest pain, and headaches are the most commonly reported, with some variations. The MCMA participants consistently report higher percentages of some symptoms, while participants from the CMA show lower percentages in some instances (See Figure 13).
There is a discernible correlation between the months in which respiratory diseases, primarily attributed to air pollution, require the most medical attention. Data from all three areas indicate that November, December, and January are the peak months for these types of illnesses. Additionally, Cuernavaca experiences a slight increase in cases during March and April, aligning with increased reports of poor air quality during those months. Table 10 summarizes all the Kruskal–Wallis results presented previously.

4. Discussion

The findings of this study emphasize significant differences in the perception of air quality, its causes, and consequences among residents in the three metropolitan areas, as anticipated at the onset of this research. However, in several cases, despite the differences between the three metropolitan areas, there were slight variations and even coincidences. Recognizing that individuals’ perceptions on the topics explored in this study are shaped by context, personal experiences, and received information, the findings suggest that the observed differences are attributable to those factors, such as distinctive geographical features, diverse socioeconomic conditions, and distinct policies and programs that have been implemented in each region.
In MCMA, over 50% of respondents believe that the air quality is poor or very poor, with the majority considering their city the most polluted. This perception is likely influenced by a history of experiencing poor air quality since the 1980s. Additionally, residents have had access to real-time information through local environmental authorities’ websites for over two decades, fostering a heightened awareness of the issue. Notably, despite monitoring data demonstrating a significant reduction in pollution levels during the three last decades, this improvement is not distinctly perceived by the residents. In contrast, in other metropolitan areas characterized by rural and peri-urban zones, the perception of pollution is influenced by factors such as burning, agricultural activities, forest fires, bonfires, and garbage dumps, rather than urban sources like cars or services.
In the CMA, where the industrial zone is relatively small, the monitoring network relies on occasional campaigns, leading to limited awareness among residents. Nearly 80% believe their city is less polluted, aligning with the measurements indicating regular or good air quality. The TVMA, known as the most polluted area in the country, has had an information system on air quality for two decades. Surprisingly, only 30% of respondents perceive the air quality as poor, with over half believing their residential area is less polluted than others, despite evidence to the contrary, showing that there is a low level of air quality information and that the communication strategy should be changed. However, residents accurately perceive an increase in pollution over the last decade, expressing confidence (99%) that it will improve in the next 10 years; this is possibly due to information about expanded air monitoring coverage performed the last three years, even though the pollutant concentration has not decreased
An interesting aspect is that, in the MCMA, a majority no longer perceives pollution from stationary sources, possibly because the information they receive does not emphasize these sources. This stands in contrast to other areas where residents remain cognizant of the risks posed by industrial activities. This contrasts with the other two areas, which was expected in TVMA because it has several industrial zones but not in CMA, where the industrial zone is small, although residents are aware of that risk. The literature mentions that the notion of pollution is flexible and depends on history and context [41]; it is constantly redefined and reinvented, and environmental scenarios and aspects can give rise to new meanings and uses, behaviors, which is also reported by Oltra and Salas, indicating that the subjective assessment of local air differs significantly between populations in cities with strong differences [14]. Environmental aspects or signals serve as references for participants to analyze their risk perception. People, in general, believe they can identify air quality with their senses, leading to biases when assessing risk. Another aspect is that cities that are not as large and are surrounded by natural areas give the false idea of being cleaner environments, as is evident in the Cuernavaca and Toluca perception.
The perception of air pollution risk is parallel, to some extent, with residents perceptions of air quality. Those residing in the MCMA are the most cognizant, followed by the Toluca Valley Metropolitan Area and the Cuernavaca Metropolitan Area. Across all three regions, the perception of pollution risk and frequency surpasses the recognition of poor air quality, with awareness ranging from 60% to 80% among residents. This contrasts with the findings of Oltra and Sala, who reported generally low levels of perceived severity. In the metropolitan areas of Mexico City and Toluca, the fall and winter months pose higher risks due to elevated altitude and increased pollution frequency, especially during these colder months, linked to lower temperatures that complicate and exacerbate respiratory diseases [14]. Conversely, for the CMA, warmer months are considered double the pollution compared to winter due to the warm climate and ongoing sugarcane harvest and burning.
The observed spike in risk occurs around March, corresponding to the ozone season with clear skies, making it challenging to associate it with specific environmental factors. Specific activities, such as sugarcane harvesting and tourism, not only impact air quality but also influence people’s perceptions of it. While differences in pollution perception, risk, and frequency exist among the three zones, over 70% of residents across all areas clearly recognize the importance of caring for air quality. This indicates that they are sensitive residents who, with adequate information and education, could actively participate in reducing pollution-causing activities. However, the strategy for each location must be tailored, considering the varying causal attributions. Another signal that people need information is that 50–55% pay attention to air pollution and can identify areas with higher or lower contamination, yet over 50% find it challenging to do so.
Regarding the cognitive component of both air pollution and climate change, only 50% of MCMA participants know what to do when air quality is poor, showing higher awareness than the other areas where knowledge decreases to 40%. Concerning climate change, less than 45% of participants know what to do. Another finding reinforcing the need for effective communication about air pollution and climate change is that emotional concern ranges from 56 to 72% of participants, with the highest percentages in the less-informed areas (67–72%), while concern in the MCMA decreases to 56–58%. Consistent with other studies, over 60% of respondents do not feel adequately prepared to face or know what to do to protect themselves from air pollution or climate change, especially in the CMA and the TVMA. Rectifying misperceptions is thus essential to improving residents’ views and attitudes [42].
Queries about personal actions contributing to air pollution are crucial for generating positive and sustainable responses. Recognizing the most important sources, MCMA residents acknowledge that car use is the leading cause of climate change and air pollution, while TVMA and CMA recognize waste burning, use of firewood, coal, and fire in general as highly polluting. However, more than 50% do not consider themselves or their families responsible, attributing responsibility to neighbors or inhabitants of the municipality, city, or metropolitan area. Consequently, they do not feel part of the problem and do not contribute to avoiding these actions. In this regard, Leiserowitz et al. [43] showed that minimizing the “self” for others is a complex phenomenon. There is a need for people to adopt these strategies through education and communication to achieve multiple targets [44]. Messages should be clear, awareness-raising, and not fear-inducing but encouraging, emphasizing that we are part of the solution.
Finally, regarding the negative impacts of air pollution on human health perception, there are no differences between the three areas. Between 62 and 74% are aware that pollution damages health, quality of life, and reduces life expectancy, in contrast to Benney et al. [45] who reported that most of Utah’s residents are unaware of the short- and long-term health risks associated with air pollution. These are important findings since Orru et al. [46] suggested that air pollution and health risk perception play crucial roles in understanding and predicting health symptoms. Care must be taken while informing people about health effects to avoid inducing additional consequences such as stress-induced physiological responses and health symptoms. Policymakers should translate the population perceptions and the drivers of such perceptions into positive actions for the management of air pollution and climate change [47].

5. Conclusions

This is the first perception study conducted in the Megalopolis considering three zones of its metropolitan areas, which has shown that resident perceptions related to air pollution and climate change are influenced by the local context.
Regarding air quality, individuals in the MCMA demonstrate heightened sensitivity compared to those in Toluca and Cuernavaca. Participants display a comprehensive understanding of the issue, acknowledging that air pollution has worsened and is likely to continue, despite official reports indicating a decrease in pollution over the past two decades. This apparent contradiction is attributed to stringent environmental regulations and contingency measures.
Notably, distinctions emerge between the MCMA and the metropolitan areas of Toluca and Cuernavaca. The latter areas exhibit a greater risk and frequency of environmental concerns, accompanied by a higher level of awareness, concern, and a capacity for protection. Specifically, Mexico City faces a prevalence of mobile and area sources; Toluca, as an industrial zone, has more fixed sources; and Cuernavaca relies on natural sources due to agricultural activity. These variations align with the primary causes of environmental issues in each area, such as car usage in Mexico City, burning of garbage in Cuernavaca, and industries and the use of fireworks in Toluca.
A consistent finding is that individuals generally feel less accountable and personally exposed compared to others in their community, city, or metropolitan area. They tend to attribute greater responsibility to others and believe that others will bear the consequences. Moreover, people not only possess knowledge about the risks of poor air quality but also understand its potential impacts on health and quality of life. This awareness is particularly evident in the metropolitan area of Mexico City, where participants report a high frequency of respiratory diagnoses, likely attributed to increased exposure associated with urban living.
Studies related to the psychosocial dimensions of air quality and climate change should enable the population to identify health risks, address them, and sensitize them to getting involved in the challenges of improving air quality and addressing climate change. Moreover, it encourages the development and success of behavioral changes to achieve a more sustainable development model that will undoubtedly benefit all residents. Additionally, with the results obtained, policymakers can tailor specific measures or strategies for communities or areas with different issues.
Finally, regarding the limitations of this research, the use of non-probabilistic sampling and multiple-choice questions precludes the use of parametric statistics. Nonetheless, given the absence of prior perception studies conducted in the Megalopolis, it was deemed important to conduct a detailed exploration of resident perceptions. Selecting a sample near monitoring stations may limit the generalizability of data to the broader population, but this decision was made to enable future correlation analysis with pollution levels at these stations. Furthermore, while recognizing the need to include other variables for a more comprehensive understanding of the psychosocial dimensions of air pollution and climate change, the purpose of this document is to analyze valid and reliable scales to assess air pollution in three key areas of the megalopolis. Further analysis with additional variables will be conducted as part of a Megalopolis project.

Author Contributions

Conceptualization, K.L.-M., J.U.-S. and V.M.-Á.; formal analysis, K.L.-M. and D.I.A.-H.; funding acquisition, V.M.-Á.; investigation, K.L.-M., M.G.-A. and V.M.-Á.; methodology, K.L.-M., J.U.-S. and D.I.A.-H.; Project administration, V.M.-Á.; writing—original draft, K.L.-M.; writing—review and editing, V.M.-Á. All authors have read and agreed to the published version of the manuscript.

Funding

This research was supported by the 316642-PRONACES-CONAHCyT project related to Air Pollution and Climate Change in the Megalopolis.

Institutional Review Board Statement

Institutional Review Board Statement: The ethical approval of this study is waived since the experimental actions are not performed with humans or animals. The study was conducted in accordance with the “Code of Ethics of the National Autonomous University of Mexico” and with “The security and coordination regulations regarding health research at UNAM” (available in https://depi.psicologia.unam.mx/investigaci%C3%B3n/comit%C3%A9s-de-%C3%A9tica/c-investigaci%C3%B3n).

Informed Consent Statement

All subjects gave their informed consent for inclusion before they participated, as well as the way the data will be used and that anonymity is assured. The personal data are not included in any part of the manuscript and there are no risks about their knowledge for the public.

Data Availability Statement

The data presented in this study are available on request from the corresponding author. The data are not publicly available due to other collaborators not having published some parts of the database.

Conflicts of Interest

The authors declare no conflicts of interest. The funders had no role in the design of the study; in the collection, analyses, or interpretation of data; in the writing of the manuscript; or in the decision to publish the results.

References

  1. WHO Global Air Quality Guidelines. Particulate Matter (PM2.5 and PM10), Ozone, Nitrogen Dioxide, Sulfur Dioxide and Carbon Monoxide. Geneva: World Health Organization. 2021. Available online: https://www.who.int/publications/i/item/9789240034228 (accessed on 22 July 2023).
  2. Zhang, Y.; Smith, S.J.; Bowden, J.H.; Adelman, Z.; West, J.J. Co-benefits of global, domestic, and sectoral greenhouse gas mitigation for US air quality and human health in 2050. Environ. Res. Lett. 2017, 2, 114033. [Google Scholar] [CrossRef] [PubMed]
  3. Xie, Y.; Dai, H.; Xu, X.; Fujimori, S.; Hasegawa, T.; Yi, K.; Masui, T.; Kurata, G. Co-benefits of climate mitigation on air quality and human health in Asian countries. Environ. Int. 2018, 119, 309–318. [Google Scholar] [CrossRef] [PubMed]
  4. Pidgeon, N. Risk assessment, risk values and the social science programme: Why we do need risk perception research. Reliab. Eng. Syst. Safe 1998, 59, 5–15. [Google Scholar] [CrossRef]
  5. Urbina, J. La percepción social del cambio climático en el ámbito urbano. In The Social Perception of Climate Change. Studies and Guidelines for Environmental Education in Mexico; Ortiz, B.Y., Velasco, C., Eds.; Universidad Iberoamericana de Puebla: Puebla, México, 2012. [Google Scholar]
  6. Gustafson, A.; Pace, A.; Singh, S.; Goldberg, M.H. What do people say is the most important reason to protect nature? An analysis of pro-environmental motives across 11 countries. J. Environ. Psychol. 2022, 80, 101762. [Google Scholar] [CrossRef]
  7. Commerçon, F.A.; Goldberg, M.H.; Lacroix, K.; Carman, J.P.; Rosenthal, S.A.; Leiserowitz, A. Evaluating the terms Americans use to refer to “carbon emissions”. Environ. Commun. 2023, 17, 87–100. [Google Scholar] [CrossRef]
  8. Lindell Michael, K.; Perry Ronald, W. The protective action decision model: Theoretical modifications and additional evidence. Risk Anal. 2012, 32, 616–632. [Google Scholar] [CrossRef] [PubMed]
  9. Cheng, P.; Wei, J.; Ge, Y. Who should be blamed? The attribution of responsibility for a city smog event in China. Nat. Hazards 2017, 85, 669–689. [Google Scholar] [CrossRef]
  10. Weiner, B. Attribution, emotion, and action. In Handbook of Motivation and Cognition: Foundations of Social Behavior; Sorrentino, R.M., Higgins, E.T., Eds.; Guilford Press: New York, NY, USA, 1986; pp. 281–312. [Google Scholar]
  11. Tan, H.; Xu, J. Differentiated effects of risk perception and causal attribution on public behavioral responses to air pollution: A segmentation analysis. J. Environ. Psychol. 2019, 65, 101335. [Google Scholar] [CrossRef]
  12. Klöckner, C.A. A comprehensive model of the psychology of environmental behaviour—A meta-analysis. Glob. Environ. Chang. 2013, 23, 1028–1038. [Google Scholar] [CrossRef]
  13. Saksena, S. Public perceptions of urban air pollution risks. Risk Hazards Crisis Public Policy 2011, 2, 1–19. [Google Scholar] [CrossRef]
  14. Oltra, C.; Sala, R. Perception of risk from air pollution and reported behaviors: A cross-sectional survey study in four cities. J. Risk Res. 2018, 21, 869–884. [Google Scholar] [CrossRef]
  15. Mor, S.; Parihar, P.; Ravindra, K. Community perception about air pollution, willingness to pay and awareness about health risks in Chandigarh, India. Environ. Chall. 2022, 9, 100656. [Google Scholar] [CrossRef]
  16. Omanga, E.; Ulmer, L.; Berhane, Z.; Gatari, M. Industrial air pollution in rural Kenya: Community awareness, risk perception and associations between risk variables. BMC Public Health 2014, 14, 377. [Google Scholar] [CrossRef] [PubMed]
  17. Wright, C.Y.; Matooane, M.; Oosthuizen, M.A.; Phala, N. Risk perceptions of dust and its impacts among communities living in a mining area of the Witwatersrand, South Africa. Clean. Air J. 2014, 24, 22–27. [Google Scholar] [CrossRef]
  18. Ngo, N.S.; Kokoyo, S.; Klopp, J. Why participation matters for air quality studies: Risk perceptions, understandings of air pollution and mobilization in a poor neighborhood in Nairobi, Kenya. Public Health 2017, 142, 177–185. [Google Scholar] [CrossRef] [PubMed]
  19. Chryst, B.; Marlon, J.; Van Der Linden, S.; Leiserowitz, A.; Maibach, E.; Roser-Renouf, C. Global warming’s “six Americas short survey”: Audience segmentation of climate change views using a four question instrument. Environ. Commun. 2018, 12, 1109–1122. [Google Scholar] [CrossRef]
  20. Goldberg, M.H.; Gustafson, A.; van der Linden, S. Leveraging social science to generate lasting engagement with climate change solutions. One Earth 2020, 3, 314–324. [Google Scholar] [CrossRef]
  21. Goldberg, M.H.; Gustafson, A.; van der Linden, S.; Rosenthal, S.A.; Leiserowitz, A. Communicating the scientific consensus on climate change: Diverse audiences and effects over time. Environ. Behav. 2022, 54, 1133–1165. [Google Scholar] [CrossRef]
  22. Vignola, R.; Klinsky, S.; Tam, J.; McDaniels, T. Public perception, knowledge and policy support for mitigation and adaption to climate change in Costa Rica: Comparisons with North American and European studies. Mitig. Adapt. Strateg. Glob. Chang. 2013, 18, 303–323. [Google Scholar] [CrossRef]
  23. Catalán, V.M.; Rojas, R.M.; Pérez, N.J. La percepción que tiene la población adulta del Distrito Federal sobre la contaminación del aire. Estudio descriptivo. Rev. Del Inst. Nac. de Enfermedades Respir. 2001, 14, 220–223. [Google Scholar]
  24. Landeros Mugica, K. Dimensiones Psicosociales de la Contaminación del Aire de la Zona Metropolitana de la Ciudad de México. Ph.D. Thesis, Facultad de Psicología, UNAM, Ciudad de México, Mexico, 2013. [Google Scholar]
  25. Reyes, B. La Percepción de la Contaminación del Aire en la Ciudad de México. Bachelor’s Thesis, Universidad Nacional Autónoma de México, Ciudad de México, Mexico, 2000. [Google Scholar]
  26. Landeros Mugica, K. Actitudes Ante las Causas y Consecuencias del Cambio Ambiental Global, Según las Diferencias Individuales. Bachelor’s Thesis, Universidad Nacional Autónoma de México, Ciudad de México, Mexico, 2007. [Google Scholar]
  27. González-Hernández, D.L.; Meijles, E.W.; Vanclay, F. Factors that Influence Climate Change Mitigation and Adaptation Action: A Household Study in the Nuevo Leon Region, Mexico. Climate 2019, 7, 74. [Google Scholar] [CrossRef]
  28. Urbina-Soria, J.; Flores-Cano, O.; Mugica-Alvarez, V. Factors determining the mobility behavior of the inhabitants of Mexico City and its relationship with air pollution. In Proceedings of the 104th AWMA Annual Conference & Exhibition, Orlando, FL, USA, 19–24 June 2011. [Google Scholar]
  29. Bee, B. Power, perception, and adaptation: Exploring gender and social–environmental risk perception in Northern Guanajuato, Mexico. Geoforum 2016, 69, 71–80. [Google Scholar] [CrossRef]
  30. Landeros-Mugica, K.; Urbina-Soria, J.; Alcántara-Ayala, I. The good, the bad and the ugly: On the interactions among experience, exposure and commitment with reference to landslide risk perception in México. Nat. Hazards 2016, 80, 1515–1537. [Google Scholar] [CrossRef]
  31. CAMe. (Environmental Megalopolis Comission). Programa Federal Para Mejorar la Calidad del Aire en la Megalópolis, 2017–2030. (Federal Program to Improve Air Quality in the Megalopolis 2017–2030). 2018. México. p. 332. Available online: https://www.gob.mx/semarnat/articulos/proaire-2017–2030-armonizacion-y-mejora-de-politicas-publicas-ambientales-de-la-megalopolis-160604?idiom=es (accessed on 23 October 2023).
  32. Hernández-Moreno, A.; Trujillo-Páez, F.I.; Mugica-Álvarez, V. Quantification of primary PM2. 5 Mass Exchange in three Mexican Megalopolis Metropolitan Areas. Urban Clim. 2023, 51, 101608. [Google Scholar] [CrossRef]
  33. Mugica-Álvarez, V.; Figueroa-Lara, J.J.; Hernández-Moreno, A. Evaluación del Proaire 2002–2010 (Proaire 2002–2010 Assessment). Universidad Autónoma Metropolitana. p. 357. 2011. Available online: https://www.gob.mx/cms/uploads/attachment/file/311624/EyS_ProAire_ZMVM_2002-2010.pdf (accessed on 9 November 2023).
  34. SEDEMA. 2012. Secretaría del Medio Ambiente del Distrito Federal. Informe de la Calidad del Aire 2010 (Federal District. Air Quality Report 2010). 2012. México. Available online: https://biblioteca.semarnat.gob.mx/janium/Documentos/Ciga/Libros2011/CD001519.pdf (accessed on 28 September 2023).
  35. PROAIRE ZMVM 2021–2030. Programa de Gestión para Mejorar la Calidad del Aire de la Zona Metropolitana del Valle de México (ProAire ZMVM 2021–2030). (Management Program to Improve the Air Quality in the Mexico Valley Metropolitan Zone). SEDEMA, SMAGEM, SEMARNATH y SEMARNAT. Ciudad de México. 2021. Available online: https://dsiappsdev.semarnat.gob.mx/datos/portal/proaire/34_ProAire%20Estado%20de%20M%C3%A9xico.pdf (accessed on 30 October 2023).
  36. SMAGEM, Secretaria del Medio Ambiente del Gobierno del Estado de México. Programa para Mejorar la Calidad del Aire del Valle de Toluca 2012–2017. (Program for the Improvement of the Air Quality in the Toluca Valley Metropolitan Area). 2017. p. 220. Toluca, México. Available online: https://proaire.edomex.gob.mx/toluca_2012_2017 (accessed on 10 October 2023).
  37. SMAGEM, Secretaria del Medio Ambiente del Gobierno del Estado de México. Programa Para Mejorar la Calidad del Aire del Estado de México 2018–2030. (Program for the Improvement of the Air Quality in the Mexico State). 2018. p. 423. Toluca, México. Available online: https://proaire.edomex.gob.mx/sites/proaire.edomex.gob.mx/files/files/mis%20pdf/ProAire%202018-2030.pdf (accessed on 4 November 2023).
  38. SEDESU Programa Para el Mejoramiento de la Calidad del Aire de la Zona Metropolitana de Cuernavaca 2009–2012. Program for the Improvement of Air Quality in the Cuernavaca Metropolitan Area 2009–2012). 2013. p. 147. Morelos, México. Available online: https://dsiappsdev.semarnat.gob.mx/datos/portal/proaire/4_ProAire%20ZMC%202009-2012.pdf (accessed on 5 November 2023).
  39. CAME 2019. (Environmental Megalopolis Comission). Programa Para Mejorar la Calidad del Aire en Morelos 2017–2027. Morelos México. 2019. p. 265. Available online: https://sustentable.morelos.gob.mx/ca/proaire (accessed on 3 November 2023).
  40. Asún, R.A.; Rdz-Navarro, K.; Alvarado, J.M. Developing multidimensional Likert scales using item factor analysis: The case of four-point items. Sociol. Methods Res. 2016, 45, 109–133. [Google Scholar] [CrossRef]
  41. Soto-Coloballes, N. The development of air pollution in Mexico City. SAGE Open 2020, 10, 2158244020931072. [Google Scholar] [CrossRef]
  42. Levine, D.; Strube, M. Environmental attitudes, knowledge, intentions and behaviours among college students. SocioPsychology 2012, 152, 308–326. [Google Scholar]
  43. Leiserowitz, A.; Maibach, E.; Rosenthal, S.; Kotcher, J.; Carman, J.; Neyens, L.; Myers, T.; Goldberg, M.; Campbell, E.; Lacroix, K.; et al. Climate Change in the American Mind; Yale Program on Climate Change Communication; April Yale University and George Mason University: New Haven, CT, USA, 2022. [Google Scholar]
  44. Maione, M.; Mocca, E.; Eisfeld, K.; Kazepov, Y.; Fuzzi, S. Public perception of air pollution sources across Europe. Ambio 2021, 50, 1150–1158. [Google Scholar] [CrossRef]
  45. Benney, T.M.; Cantwell, D.; Singer, P.; Derhak, L.; Bey, S.; Saifee, Z. Understanding perceptions of health risk and behavioral responses to air pollution in the state of utah (USA). Atmosphere 2021, 12, 1373. [Google Scholar] [CrossRef]
  46. Orru, K.; Nordin, S.; Harzia, H.; Orru, H. The role of perceived air pollution and health risk perception in health symptoms and disease: A population-based study combined with modelled levels of PM 10. Int. Arch. Occup. Environ. Health 2018, 91, 581–589. [Google Scholar] [CrossRef]
  47. Onyeneke, R.U.; Amadi, M.U.; Njoku, C.L.; Osuji, E.E. Climate change perception and uptake of climate-smart agriculture in rice production in Ebonyi State, Nigeria. Atmosphere 2021, 12, 1503. [Google Scholar] [CrossRef]
Figure 1. The Megalopolis and the three studied metropolitan areas.
Atmosphere 15 00042 g001
Figure 2. (a) Comparison of air quality perception among the three metropolitan areas. (b) Air quality perception of each metropolitan area in comparison with other cities. (c) Perception of the current air quality in the three metropolitan areas compared to that of ten years ago. (d) Perception of air quality in ten years (* p ≤ 0.05).
Atmosphere 15 00042 g002
Figure 3. (a) Perception of risk and frequency in the three metropolitan areas. (b) Perception of the most air-polluted months in the three metropolitan areas (* p ≤ 0.05).
Atmosphere 15 00042 g003
Figure 4. Perception of the need (a), usefulness (b), and difficulty in taking care of air pollution (c) (* p ≤ 0.05).
Atmosphere 15 00042 g004
Figure 5. People’s beliefs related to the influence of environmental phenomena on air quality (* p ≤ 0.05).
Atmosphere 15 00042 g005
Figure 6. Attitudes towards climate change and air quality. Cognitive component (* p ≤ 0.05).
Atmosphere 15 00042 g006
Figure 7. Attitudes towards climate change and air quality. Affective component (* p ≤ 0.05).
Atmosphere 15 00042 g007
Figure 8. Attitudes towards climate change and air quality. Behavioral component (* p ≤ 0.05).
Atmosphere 15 00042 g008
Figure 9. Personal attribution. Contribution of different characters to air pollution in MCMA (a), in TVMA (b) and in CMA (c).
Atmosphere 15 00042 g009
Figure 10. Contribution of personal actions to air pollution.
Atmosphere 15 00042 g010
Figure 11. Different consequences due to air pollution on human health and environment (* p ≤ 0.05).
Atmosphere 15 00042 g011
Figure 12. Impacts of air pollution on people. MCMA (a); TVMA (b); and CMA (c).
Atmosphere 15 00042 g012
Figure 13. Health consequences: diseases (a); symptoms (b); and presence of respiratory illnesses (c) associated with exposure to air pollution.
Atmosphere 15 00042 g013
Table 1. Sociodemographic characteristics.
TotalMCMATVMACMA
Municipalities4521168
Respondents1750900530320
Personal data
Men875450265160
Women875450265160
18–25 years old34517510664
26–35 years old34517410764
36–45 years old33617210064
46–55 years old376204111106
56–70 years old348646167
Highest education level
Elementary school176368852
Middle school or technical career50525116193
High school58232715699
Bachelor’s degree37720410766
Graduate studies60321810
Highest socioeconomic level3432009053
Middle-high socioeconomic level3662208957
Middle socioeconomic level35317810768
Middle-low socioeconomic level29613210559
Low socioeconomic level2131006845
Lowest socioeconomic level189707138
Uses car frequently443235100108
Uses public transport frequently1124595336193
Uses bicycle frequently183709419
Table 2. Air quality perception.
Dependent VariableQuestionResponse Categories
Air quality perception of the city/townThe air quality you breathe in the metropolitan area is:Five answers from
very bad to very good
When compared to other cities in the country, the air in the metropolitan area is:Three answers from much less polluted to more polluted
When comparing the current situation to 10 years ago, the air in the metropolitan area was:
If we continue the same path, in 10 years, the air in the metropolitan area will be:
Table 3. Risk perception, frequency, and beliefs.
Dependent VariableQuestionResponse Categories
Level of risk perceptionThinking about the entire
metropolitan area, air pollution is:
Four answers from
Not at all risky to very risky
Frequency of risk perceptionThinking about the entire
metropolitan area, air pollution is:
Not at all frequent to very frequent
Exposure to air pollutionIn which month is there the greatest air pollution?Multiple-choice answer with the 12 months of the year
BeliefsTaking care of air quality is:Four answers from
Unnecessary to very necessary
Taking care of air quality is:Four answers from
Unhelpful to very helpful
Taking care of air quality is:Four answers from
Very difficult to very easy
How much does it influence air quality?
List of 7 environmental phenomena
Four answers from
None to A lot
Table 4. Dimensions and reliability of attitudes toward air quality.
Factorial Analysis% Variance ExplainedAlpha
Behavioral factor
How much…
can you protect yourself from climate change?0.80021.706%0.739
can you protect yourself from air pollution?0.754
are you prepared to deal with climate change?0.644
are you prepared to deal with air pollution?0.572
Cognitive factor 21.208%0.663
How much do you…
have an awareness of air quality?0.701
identify areas with better and worse air quality?0.668
know what to do to face climate change?0.635
know what to you if air quality is bad?0.634
Affective factor 14.973%0.627
How much…
are you concerned about air quality?0.845
are you concerned about climate change?0.838
Total 57.888%0.772
Table 5. Dimensions and reliability of causal attribution to different sources.
Factorial Analysis% Variance ExplainedAlpha
Causal attribution to stationary sources
How much do the following industrial activities pollute the air?
Cement plant0.85514.503%0.889
Brickyard0.837
Mine0.815
Factory0.741
Causal attribution to area sources
How much do the following activities and services pollute the air?
Construction0.67713.291%0.768
Businesses0.651
Hotels and resorts0.649
Mechanical, carpentry, tinsmithing, and printing workshops0.636
Charcoal- or wood-fired restaurants0.540
Gas stations0.537
Agricultural sowing and harvest0.498
Dumpsters0.383
Causal attribution to natural sources
How much do the following natural events pollute the air?
Blowing dust0.81010.354%0.813
Erosion0.802
Forest fires0.691
Causal attribution to mobile sources (public services)
How much do the following vehicles pollute the air?
Trailers and trucks0.77210.184%0.722
Buses from other cities0.714
Public transport0.606
Delivery and service trucks (e.g., gas, garbage)0.561
Causal attribution to mobile sources (individual services)
How much do the following vehicles pollute the air?
Taxi, Uber, Didi0.7419.604%0.647
Private cars and trucks0.728
Motorcycles0.678
Total 57.937%0.870
Table 6. Dimensions and reliability of causal attribution to people.
Factorial Analysis% Variance ExplainedAlpha
How much do the following people pollute the air?
Causal attribution to people (in general)
Inhabitants of Mexico City0.91842.813%0.817
Inhabitants of the Mexico City metropolitan area0.910
Inhabitants of their municipality or city0.606
Causal attribution to people (in particular)
You and your family0.87735.628%0.679
Neighbors in your neighborhood0.813
Total 78.441%0.780
Table 7. Dimensions and reliability of perceived air pollution consequences.
Factorial Analysis% Variance ExplainedAlpha
Consequences on health and environment
How much does air pollution…?
Harm the quality of life0.76445.420%0.783
Have effects on health0.725
Decrease life expectancy0.702
Damage plants, animals, and crops0.687
Affect mood and performance0.684
Contribute to climate change0.627
Deteriorate the constructions0.494
Table 8. Dimensions and reliability of perceived air pollution consequences on people.
Factorial Analysis% Variance ExplainedAlpha
Consequences of air pollution on people
How much do the following people suffer the consequences of air pollution?
Neighbors in your neighborhood0.87366.791%0.875
Inhabitants of their municipality or city0.863
You and your family0.832
Inhabitants of Mexico City0.772
Inhabitants of the Mexico City metropolitan area0.738
Table 9. Perception differences of the causal attribution to air pollution sources.
MCMATVMACMAH (2)p
Mobile sources: Private vehicles
Cars and VansNothing0.6%0.4%1.3%73.940.000
Little14.7%20.0%29.1%
Something31.2%44.3%39.1%
Much53.6%35.3%30.6%
MotorcyclesNothing2.4%4.5%5.3%63.580.000
Little27.6%39.4%38.8%
Something34.4%37.4%35.9%
Much35.6%18.7%20.0%
Taxis, UberNothing2.9%4.0%7.5%43.020.000
Little27.0%31.5%32.8%
Something32.3%42.3%40.0%
Much37.8%22.3%19.7%
Mobile sources: Service vehicles
Foreign BusesNothing12.6%4.9%6.3%2.140.343
Little23.0%21.7%23.1%
Something20.3%33.0%33.1%
Much44.1%40.4%37.5%
Delivery and service trucksNothing1.7%0.9%1.3%36.020.000
Little16.7%18.9%26.6%
Something29.3%42.1%37.5%
Much52.3%38.1%34.7%
Trailers and cargo trucksNothing4.1%3.4%8.8%2.480.290
Little13.3%13.2%12.8%
Something17.3%18.9%16.6%
Much65.2%64.5%61.9%
Public transportationNothing1.9%2.6%3.8%32.220.000
Little12.1%11.3%15.3%
Something19.8%29.6%33.4%
Much66.2%56.4%47.5%
Area sources: Services
ConstructionNothing15.3%13.4%10.3%6.5390.038
Little32.1%39.8%35.6%
Something31.0%32.1%34.4%
Much21.6%14.7%19.7%
BusinessesNothing8.9%8.3%12.2%9.2820.010
Little32.8%40.4%39.7%
Something41.2%36.2%32.5%
Much17.1%15.1%15.6%
Gas stationsNothing6.4%5.5%10.9%7.7720.021
Little22.9%23.2%23.8%
Something35.6%31.9%34.1%
Much35.1%39.4%31.3%
Hotels and resortsNothing35.9%34.7%24.4%25.3380.000
Little33.0%35.1%33.1%
Something20.7%22.8%23.4%
Much10.4%7.4%19.1%
Charcoal- or wood-fired restaurantsNothing10.4%8.7%12.2%8.1930.017
Little21.7%24.5%28.4%
Something33.9%35.5%32.5%
Much34.0%31.3%26.9%
Mechanical, carpentry, tinsmithing, and printing workshopsNothing7.1%7.0%12.2%14.6650.001
Little29.2%35.5%33.1%
Something37.8%38.3%35.3%
Much25.9%19.2%19.4%
Agricultural sowing and harvestNothing56.9%35.8%30.3%75.7210.000
Little22.1%36.6%35.9%
Something13.0%18.3%21.6%
Much8.0%9.2%12.2%
DumpstersNothing13.2%5.1%7.2%58.5330.000
Little14.4%7.7%9.4%
Something16.8%13.2%16.9%
Much55.6%74.0%66.6%
Stationary sources:
Cement plantsNothing54.7%23.0%22.8%157.9620.000
Little13.8%18.3%14.7%
Something12.3%29.6%27.2%
Much19.2%29.1%35.3%
FactoriesNothing36.2%11.5%23.1%127.3610.000
Little10.8%8.9%12.2%
Something13.1%12.1%11.3%
Much39.9%67.5%53.4%
BrickyardsNothing56.3%20.9%27.2%167.6270.000
Little13.7%21.1%21.6%
Something12.3%24.9%25.0%
Much17.7%33.0%26.3%
MinesNothing67.9%30.4%31.9%232.5530.000
Little9.7%16.0%13.4%
Something8.9%22.6%16.9%
Much13.6%30.9%37.8%
Natural sources
ErosionNothing26.0%11.5%9.7%90.0780.000
Little25.8%19.1%24.4%
Something23.7%27.9%28.1%
Much24.6%41.5%37.8%
Forest firesNothing31.7%7.0%5.3%254.3760.000
Little18.1%8.9%10.9%
Something14.4%15.5%13.1%
Much35.8%68.7%70.6%
Blowing dustNothing24.3%8.3%10.3%51.9790.000
Little24.9%20.9%25.9%
Something22.4%35.7%30.3%
Much28.3%35.1%33.4%
Table 10. Kruskal–Wallis report by dimension and by item.
Attitudes About Air Quality
CityC1C2C3C4
Cognitive factorZMVM876.57836.51866.48906.13
ZMVT862.05896.82859.86838.28
ZMC894.78949.84926.77851.02
H-statistic0.93514.534 **4.5017.587 *
A1A2
Affective factorZMVM830.61821.05
ZMVT925.48942.87
ZMC918.98917.06
H-statistic19.629 ***30.385 ***
B1B2B3B4
Behavioral factorZMVM861.85855.81857.40841.78
ZMVT870.32866.94882.45908.90
ZMC922.46945.04914.90915.03
H-statistic3.8548.362 *3.5719.185 *
Causal Attribution to Air Pollution
M1M2M3M4M5M6M7
Causal attribution to mobile sourcesZMVM883.74863.33926.86937.64946.35965.10964.15
ZMVT882.15900.75852.99833.07820.59811.71780.06
ZMC841.31867.91768.34771.01767.20729.14784.24
H-statistic2.4782.13932.222 ***36.021 ***43.016 ***73.943 ***63.576 *
AS1AS2AS3AS4AS5AS6AS7
Causal attribution to area sourcesZMVM888.47907.39850.46916.66896.64877.12782.51
ZMVT832.39854.46843.97845.02880.86909.39948.65
ZMC910.44820.64998.16810.22807.18814.821015.88
H-statistic6.539 *9.282 *25.338 ***14.665 ***8.193 *0.021 *58.533 ***
N1N2N3
Causal attribution to natural sourcesZMVM795.42768.40703.42
ZMVT978.17999.091051.97
ZMC930.68972.011067.19
H-statistic51.979 ***90.078 ***254.374 ***
S1S2S3S4
Causal attribution to stationary sourcesZMVM735.17732.80709.78763.22
ZMVT1009.871055.771044.521049.12
ZMC1047.63978.261061.65903.75
H-statistic157.962 ***167.727 ***232.553 ***127.361 ***
P1P2P3P4P5
Causal attribution to peopleZMVM903.90903.83917.98904.11921.53
ZMVT914.76912.53848.43865.34844.07
ZMC730.61734.49800.87811.86798.09
H-statistic40.497 ***37.781 ***16.925 ***9.562 **19.636 ***
Perceived Air Pollution Consequences and Health
HE1HE2HE3HE4HE5HE6HE7
Consequences on health and environmentZMVM876.97862.68901.25887.29908.67868.83908.22
ZMVT873.60907.70852.21863.13849.34890.10838.79
ZMC874.50858.23841.66862.84825.54870.07844.29
H-statistic0.0265.4416.892 *1.63810.866 **1.0308.604 *
P1P2P3P4P5
Consequences of air pollution on peopleZMVM918.81939.56940.50890.27892.34
ZMVT843.93814.14815.81894.38889.24
ZMC805.99796.96791.56802.70805.39
H-statistic16.610 ***35.048 ***35.219 ***11.348 **10.670 **
Significance level: * −0.05, ** −0.01, *** −0.001.
Disclaimer/Publisher’s Note: The statements, opinions and data contained in all publications are solely those of the individual author(s) and contributor(s) and not of MDPI and/or the editor(s). MDPI and/or the editor(s) disclaim responsibility for any injury to people or property resulting from any ideas, methods, instructions or products referred to in the content.

