Article

Particle Number Size Distribution in Three Different Microenvironments of London

1
Global Centre for Clean Air Research (GCARE), School of Sustainability, Civil and Environmental Engineering, Faculty of Engineering and Physical Sciences, University of Surrey, Guildford GU2 7XH, UK
2
Institute for Sustainability, University of Surrey, Guildford GU2 7XH, UK
3
Escuela Nacional de Estudios Superiores–Mérida, Universidad Nacional Autónoma de Mexico, Mérida 97357, Yucatán, Mexico
4
Department of Materials Science and Engineering, Imperial College London, London SW7 2AZ, UK
5
Department of Earth Science and Engineering, Imperial College London, London SW7 2AZ, UK
6
National Heart & Lung Institute, Imperial College London, London SW3 6LY, UK
*
Author to whom correspondence should be addressed.
Atmosphere 2024, 15(1), 45; https://doi.org/10.3390/atmos15010045
Submission received: 16 November 2023 / Revised: 18 December 2023 / Accepted: 21 December 2023 / Published: 29 December 2023
(This article belongs to the Section Air Quality and Human Health)

Abstract

:
We estimated the particle number distributions (PNDs), particle number concentrations (PNCs), physicochemical characteristics, meteorological effects, and respiratory deposition doses (RDD) in the human respiratory tract for three different particle modes: nucleation (N6–30), accumulation (N30–300), and coarse (N300–10,000) modes. This study was conducted in three different microenvironments (MEs) in London (indoor, IN; traffic intersection, TI; park, PK) measuring particles in the range of 6 nm–10,000 nm using an electrical low-pressure impactor (ELPI+). Mean PNCs were 1.68 ± 1.03 × 10⁴ #cm−3, 7.00 ± 18.96 × 10⁴ #cm−3, and 0.76 ± 0.95 × 10⁴ #cm−3 at IN, TI, and PK, respectively. The PNDs were high for nucleation-mode particles at the TI site, especially during peak traffic hours. Wind speeds ranging from 0 to 6 ms−1 exhibit higher PNCs for nucleation- and accumulation-mode particles at TI and PK sites. Physicochemical characterisation shows trace metals, including Fe, O, and inorganic elements, that were embedded in a matrix of organic material in some samples. Alveolar RDD was higher for the nucleation and accumulation modes than the coarse-mode particles. The chemical signatures from the physicochemical characterisation indicate the varied sources at different MEs. These findings enhance our understanding of the different particle profiles at each ME and should help devise ways of reducing personal exposure at each ME.

Graphical Abstract

1. Introduction

Urban air quality has been made worse by the densely packed high-rise concrete structures which limit air exchanges, and the street canyons with high-rise buildings, increasing traffic, and various other anthropogenic activities [1]. While the major cities focus on controlling the exposure and health risk of regulated air pollutants of both gaseous pollutants [2] (such as nitrogen oxides NOx, sulphur dioxide; SOx, polycyclic aromatic hydrocarbons; PAHs) and particle pollutants (particulate matter with aerodynamic diameter ≤10 μm; PM10 and ≤2.5 μm PM2.5 [3,4]), the unregulated pollutants called ultrafine particles (UFPs) have complex effects on health [1,5,6]. UFPs are particles with an aerodynamic diameter of less than 100 nm while contributing very little to the total particle mass in the ambient atmosphere and are present in very high numbers [6]. UFPs are emitted from a variety of exhaust emissions, largely from vehicle exhaust in urban areas [7], and non-exhaust emissions, such as tyre and brake wear, re-suspension, cigarette smoking, cooking, and secondary formation [8], and are preferentially measured as particle number concentrations (PNCs) due to their negligible contribution to total particle mass [9]. Despite their negligible contribution to the particle mass, the toxicity of UFPs and their complex chemical composition may be greater than particles such as PM10 or PM2.5 [10,11]. The smaller size of UFPs enables them to acquire a higher rate of deposition into the deeper region of the lungs [12,13] and to possess the ability to cross the air–liquid interface into the systemic circulation by which they can reach distal organs [14,15]. Epidemiological studies have reported associations between respiratory mortality and other health effects with exposure to UFPs [16].
In general, people in urban areas spend their time in different types of microenvironments (MEs) that have different levels and compositions of pollutants [16]. UFP concentrations vary significantly between different MEs [17]. The concentration variations at the different MEs are attributed to the emission sources, type of activity, and the time spent in each ME. Information obtained from different MEs would help to improve the estimation of human exposure assessment [18]. Table 1 summarises the previous studies that have investigated the PNCs in different types of MEs, such as major traffic intersections (TI) or traffic areas, indoor environments (IN), and urban background environments such as parks (PK) along with the particle number distributions at different MEs.
TIs with traffic signals are known to exhibit higher peaks of PNCs frequently compared to the roadside sites, and these locations are termed pollution hotspots in any urban setup [29]. TIs in cities were found to possess ~17 times higher concentrations of PNCs [30] compared to the average roadside concentrations in cities [1]. A strong understanding of the factors influencing the TI becoming a pollution hotspot is required to reduce the exposure to vehicle-emitted PNCs of UFPs, especially the diesel-driven engines that are the principal source of ambient UFP emissions [31], which increase PNCs across a range of particle numbers [1,6].
Improved indoor air quality is essential since people spend most of their time indoors [32,33]. The sources of emissions in indoor ME vary according to the type of environment (residential and non-residential) [16]. Numerous studies have shown that the printers in offices and homes are potential sources of IN UFPs [31,34,35,36]. The authors in [35] reported a maximum concentration of 2.17 × 10⁵ #cm−3 particles from printer emissions in an IN environment. In addition, indoor air quality (IAQ) depends on the pollutant’s penetration from outdoor sources, ventilation, air exchange rates, and various other activities [37].
An environment without major influence from any traffic emissions and local sources is considered to represent the characteristics of an urban background site, and associated with relatively clean environmental conditions [38]. In [39], the urban background site in a city centre was reported to have higher PNCs compared to regional background sites, showing the influence of traffic emissions. There are numerous studies assessing the particle number distributions (PNDs) and PNCs from TIs [27,40], residential areas [19], IN [36], urban backgrounds [41], and urban areas [6]. However, little is known about the chemical composition, morphology of these UFPs at different particle sizes and comparison of PNDs and PNCs from varied MEs for different particle modes such as N6–30nm (nucleation mode; representing particles between 6 nm and 30 nm); N30–300nm (accumulation mode; representing particles in the range of 30 nm–300 nm); N300nm–10,000nm (coarse mode; representing particles in the size range between 300 nm and 10,000 nm) in a single study.
The overall aim of this work was to develop a comprehensive continuous monitoring campaign to collect the PNDs and PNCs of particles ranging from 6 nm to 10,000 nm at three different MEs namely IN, TI, and PK using a 14-stage electrical low-pressure impactor (ELPI+) in the same region, namely in southwest London. Furthermore, a chemical characterisation of particles collected at various stages using SEM-EDX was undertaken to estimate the chemical composition, morphology, and structure of the particles. The field campaign was performed in three different MEs to reflect people’s movement through different MEs in urban areas on a daily basis, exposing them to different levels of pollution. The estimation of human exposure to the chemical compounds, respiratory deposition, and the levels of pollutants in these different MEs will aid in exposure mitigation and formulating recommendations to improve and protect the health of the public. The specific objectives are: (i) to categorise the total particles collected as N6–30nm, N30–300nm, and N300nm–10,000nm, and estimate the distributions and concentrations during peak hours and normal hours in three different urban MEs for different particle modes; (ii) to compare the chemical signatures at each ME to study the sources dominating the UFPs emissions; (iii) to study the influence of meteorological factors on the concentration and dispersion of UFPs; (iv) to assess the exposure of particles in the three different modes N6–30nm, N30–300nm, and N300nm–10,000nm, and provide a prediction of the rate of their deposition in three different regions of human respiratory tract.

2. Materials and Methods

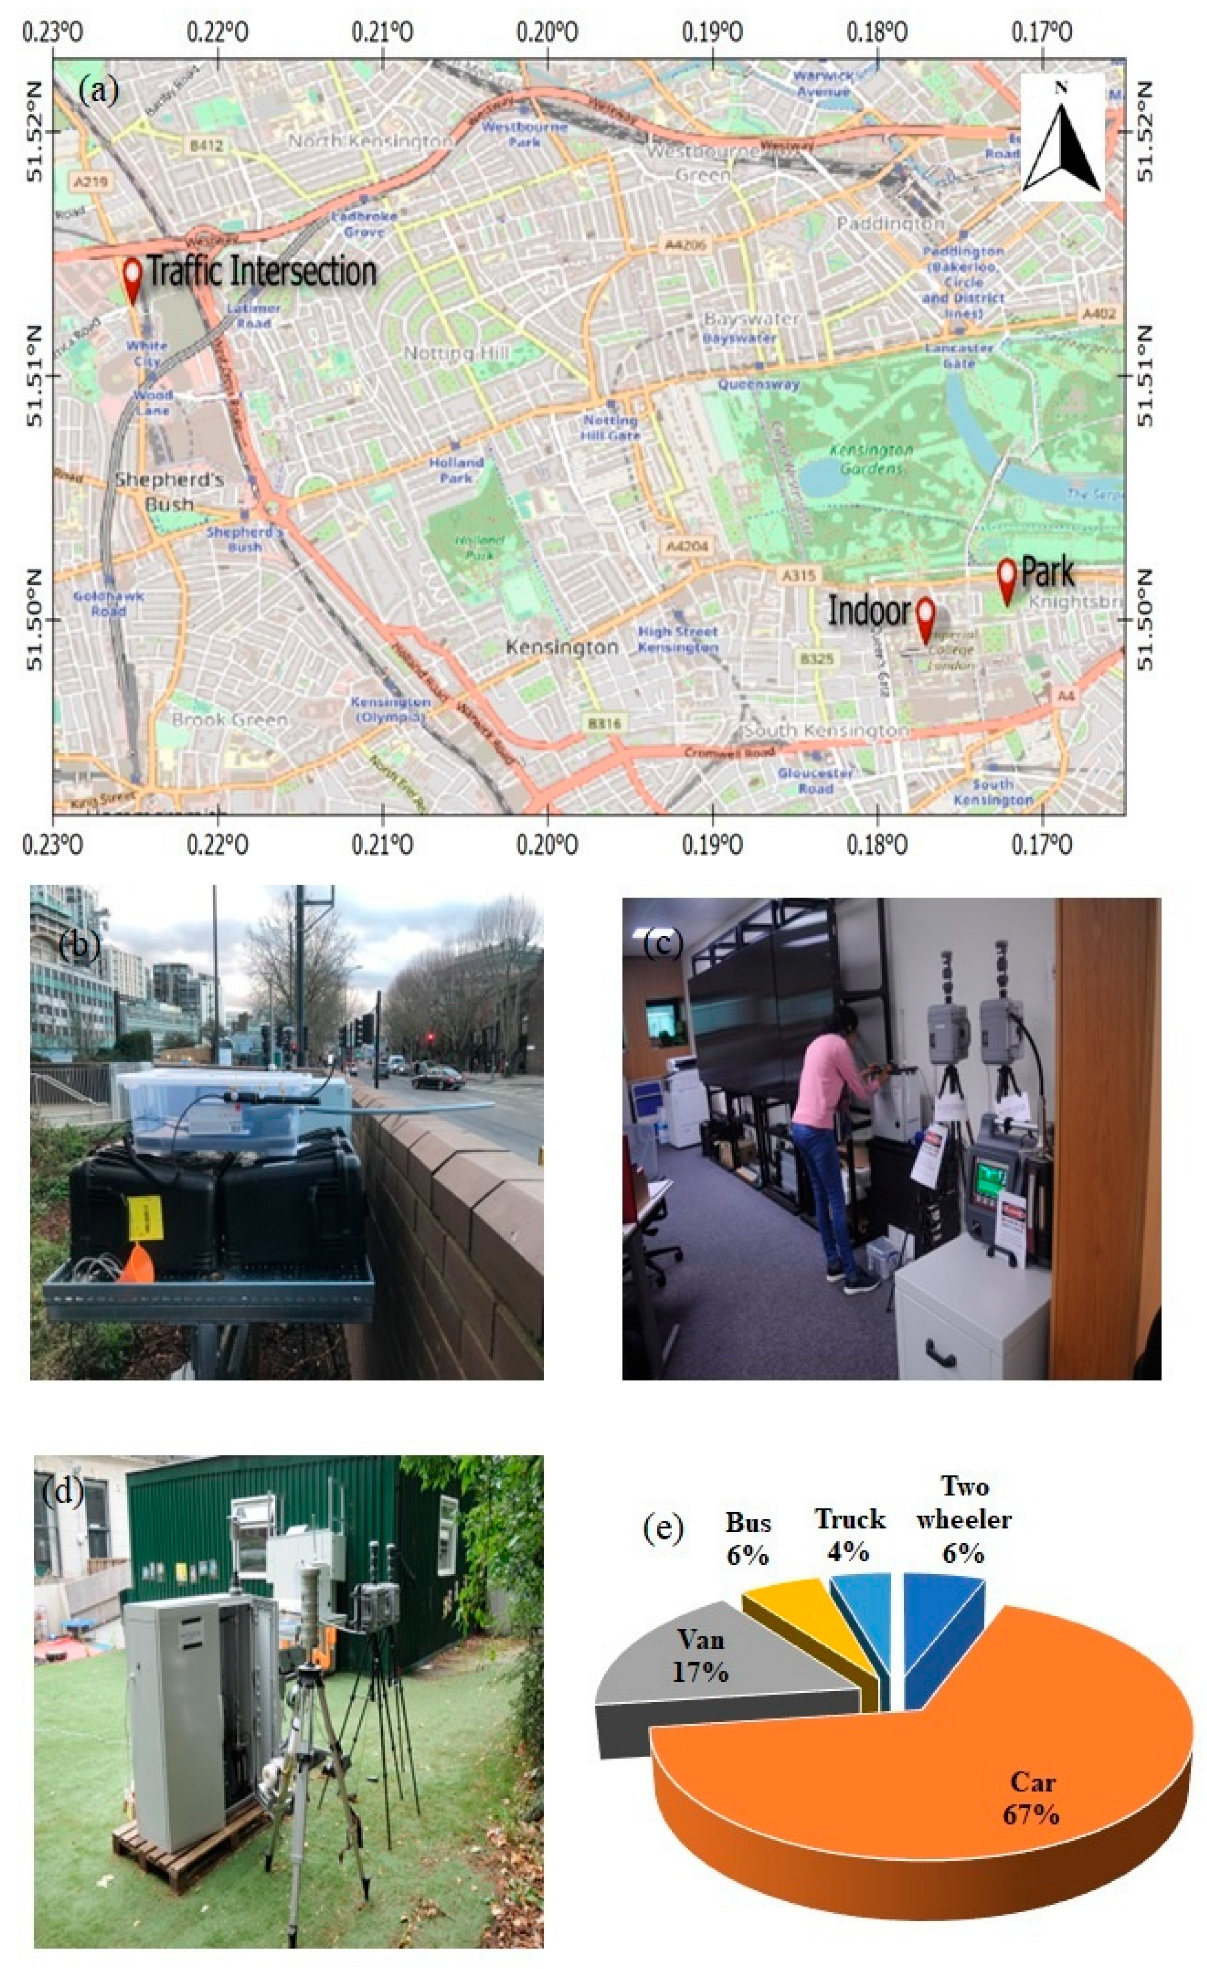
2.1. Site Description

The field campaign was carried out from January to March 2020 (prior to the COVID-19 lockdown period), to monitor the size-resolved PNCs in the 6 nm–10,000 nm range in southwest London. The period from early January to mid-March (winter season) was selected due to poorer air quality both outdoors and indoors at this time of year. Colder and drier outdoor air traps more pollution, in addition to the increased use of heating and transport which increases fuel usage and associated emissions during winter months. Similarly, building occupancy rises, ventilation reduces due to closed windows and doors, and raised humidity levels result in poor indoor air quality during the winter months.
The measurements were carried out in three different MEs (Figure 1) continuously at different time-periods, as shown in Table 2.
The IN site was inside the Data Science Institute (DSI), Imperial College London, South Kensington campus (Figure 1d), where 20–25 people spent 6–8 h in this mechanically ventilated office space, located at ~100 m from Prince Consort Road to the north and ~200 m from Exhibition Road to the east. The sampling was carried out continuously during routine office activities.
The measurements for the TI site (Figure 1b) were carried out near the Invention Rooms building located in White City, London. The sampling was carried out alongside the Invention Room building premises, near the roadside. The TI site has one major arterial road (A 219 from both sides), one sub-arterial road (South Africa Road), and a side road from a construction site intersecting at the traffic signal adjacent to the sampling site. This area in Zone 2 of London has heavy traffic flow, with the highest proportion of vehicles being passenger cars, followed by large goods vehicles (LGVs), especially between 11.00 and 16:00 h. However, the percentage of LGVs was significantly lower at weekends, as these are now working or business days. The frequency of buses is higher during morning (07:00–10:00 h) and evening (16:00–19:00 h) peak hours (but not as high as passenger cars) than during non-peak hours. The TI site has four 2-lane roads intersecting with each other. The site is surrounded by trees and small hedges on the kerbside of Wood Lane Road at ~40 m west of the sampling site, and around 56 m from the southwestern side of the sampling site on the kerbside of South Africa Road.
The measurements for the PK site (Figure 1e), representing an urban background site, were carried out in Princes Gardens (also called the Secret Gardens) in Knightsbridge, London. The site is around 300 metres away from the arterial road A315 and sub-arterial roads Exhibition Road and Prince Consort Road connecting to the A315. The site is surrounded by tall residential and academic buildings averaging from 15–20 m. In addition, trees and other types of vegetation provide the characteristics of an urban background site, referred to here as a park site or PK.

2.2. Instrumentation

PNCs were measured and collected using an ELPI+ (Dekati Ltd. Tykkitie 1, FI-36240 Kangasala, Finland). The ELPI+ classifies particles according to their aerodynamic diameter (Dp) and collects real-time particle size measurements in the 6 nm–10 μm range. This particle size distribution is established based on the size fractions of the impactor stages. The particles enter the ELPI+ through a dry vacuum pump, which operates at a flow rate of 10 LPM and is electrically charged by a corona charger. They are classified inertially in a low-pressure cascade impactor with 14 electrically insulated collection plates, which detect and record the current produced by the particles on a multichannel electrometer connected to each impactor stage before they are finally deposited on a filter.
A particle’s aerodynamic behaviour determines which stage of the ELPI+ it is deposited/recorded in. The low-pressure impactor classifies the particles according to their inertial flow, by which particles are deposited on the collection plates when the airflow becomes insufficient to maintain suspension. The radius of the air streams decreases for each impactor stage and causes certain error probabilities such as particle loss due to diffusion and bounce-off effects. Errors due to particle loss were calculated using the current signals which are proportional to the PNCs and particle size. The PNCs in each channel are calculated using kernel functions to account for the charging efficiency dependence on the diameter, and for the collection efficiencies of the different impaction stages.

2.3. Data Collection

All the data were sampled at a sampling frequency of 60 s. Sampling was carried out on consecutive days at the IN and PK sites; however, the measurements at the TI site were discontinued for a total of three days due to seasonal storms: Ciara (9 February 2020) and Dennis (15–16 February 2020). The instruments were stopped twice a week, for one hour, to extract the data from the instrument’s memory, to avoid data loss.
Meteorological data (wind speed, wind direction, temperature, and relative humidity) were obtained from London Heathrow Airport (www.wunderground.com (accessed on 26 November 2020)), ~15 km west of the measurement sites. The traffic counts were performed manually using five different vehicle categories: two-wheelers, cars, vans, buses, and trucks.

2.4. Scanning Transmission Electron Microscopy with Energy Dispersive X-ray Spectroscopy (STEM-EDX) Analysis

To collect PM for the STEM-EDXS analysis filters from two size fractions (0.016 μm, 0.38 μm) collected by ELPI+ were pulse-sonicated in methanol to produce a methanol-PM suspension. This suspension was then partially evaporated and deposited on holey carbon TEM grids. Imaging and elemental mapping by STEM-EDXS were carried out on a JEOL 2100F (JEOL Ltd., Akishima, Tokyo, Japan) at 200 kV in STEM mode using a high-angle annular (HAADF) dark field detector—the HAADF detector is highly sensitive to local variations in the atomic number within the sample, a key feature underlying the present selective imaging approach. EDX spectra were collected using an INCA/Aztec EDS 80 mm X-Max detector system (Oxford Instruments plc, Tubney Woods, Abingdon, Oxon OX13 5QX, UK), and the AzTec software (AzTech Inc., Irvine, CA, USA) was used for analysis.

2.5. Data Analyses

The obtained raw data from the ELPI+ were in the .dat file, which included the data for PNCs, particle mass concentrations, volume distributions, area distributions, and the raw current distributions. Data analysis was carried out using the macro-enabled Excel data sheet provided by DEKATITM (Tykkitie 1 FI-36240 Kangasala, Finland) which constitutes the correction algorithm to correct the diffusion losses during measurements and eliminate any possible errors during calculation. The size fractions were then categorised as N6–30 (nucleation mode—representing particles between 6 nm and 30 nm); N30–300 (accumulation mode—representing particles in the range of 30 nm–300 nm); N300–10,000 (coarse mode—representing particles in the size range between 300 nm and 10,000 nm). The PNC analysis and the PNDs during the peak hours and diurnal analysis of all the sites were carried out using Microsoft Excel. Polar plots and advanced analysis were carried out using R statistical software (v4.0.3) [42] and the Openair package [43].

2.6. Estimation of Respiratory Deposition Doses (RDDs)

The exposure to PNCs at all three sites was calculated in terms of the RDD rate (i.e., number of particles deposited in lungs per unit time, #min−1) and was calculated for the different modes of particles during rest and exercise. RDD rates are a product of deposition fraction, PNCs, tidal volume, and breathing frequency [40,44,45]. DF values (fraction of particles deposited) for different size ranges were extracted from the average data of males and females for total and regional deposition for light exercise predicted from the ICRP deposition model [46] for different regions of the human respiratory tract (HRT); extrathoracic region (ET), tracheobronchial region (TB), and alveolar region (AL):
R D D   o f   P N C s S i z e d e p e n d e n t   D F = V T × f × i = 1 i = 14     P N C i × D F ( i )
where PNCi and DFi are the number concentration and deposited fraction of particles in each size range, i, respectively. Subsequently, these doses have been summed according to the nucleation (N6–300), accumulation (N30–300), and coarse (N300–10,000) modes. Tidal volume and breathing rate are dependent on age, gender, and level of activity. We used a typical adult breathing rate of 18 ± 2.5 breaths min−1 and a tidal volume of 0.78 ± 0.14 L for a resting adult as well as a breathing rate of 25 ± 3.8 breaths min−1 and a tidal volume of 1.71 ± 0.46 L for an exercising adult [47].

3. Results

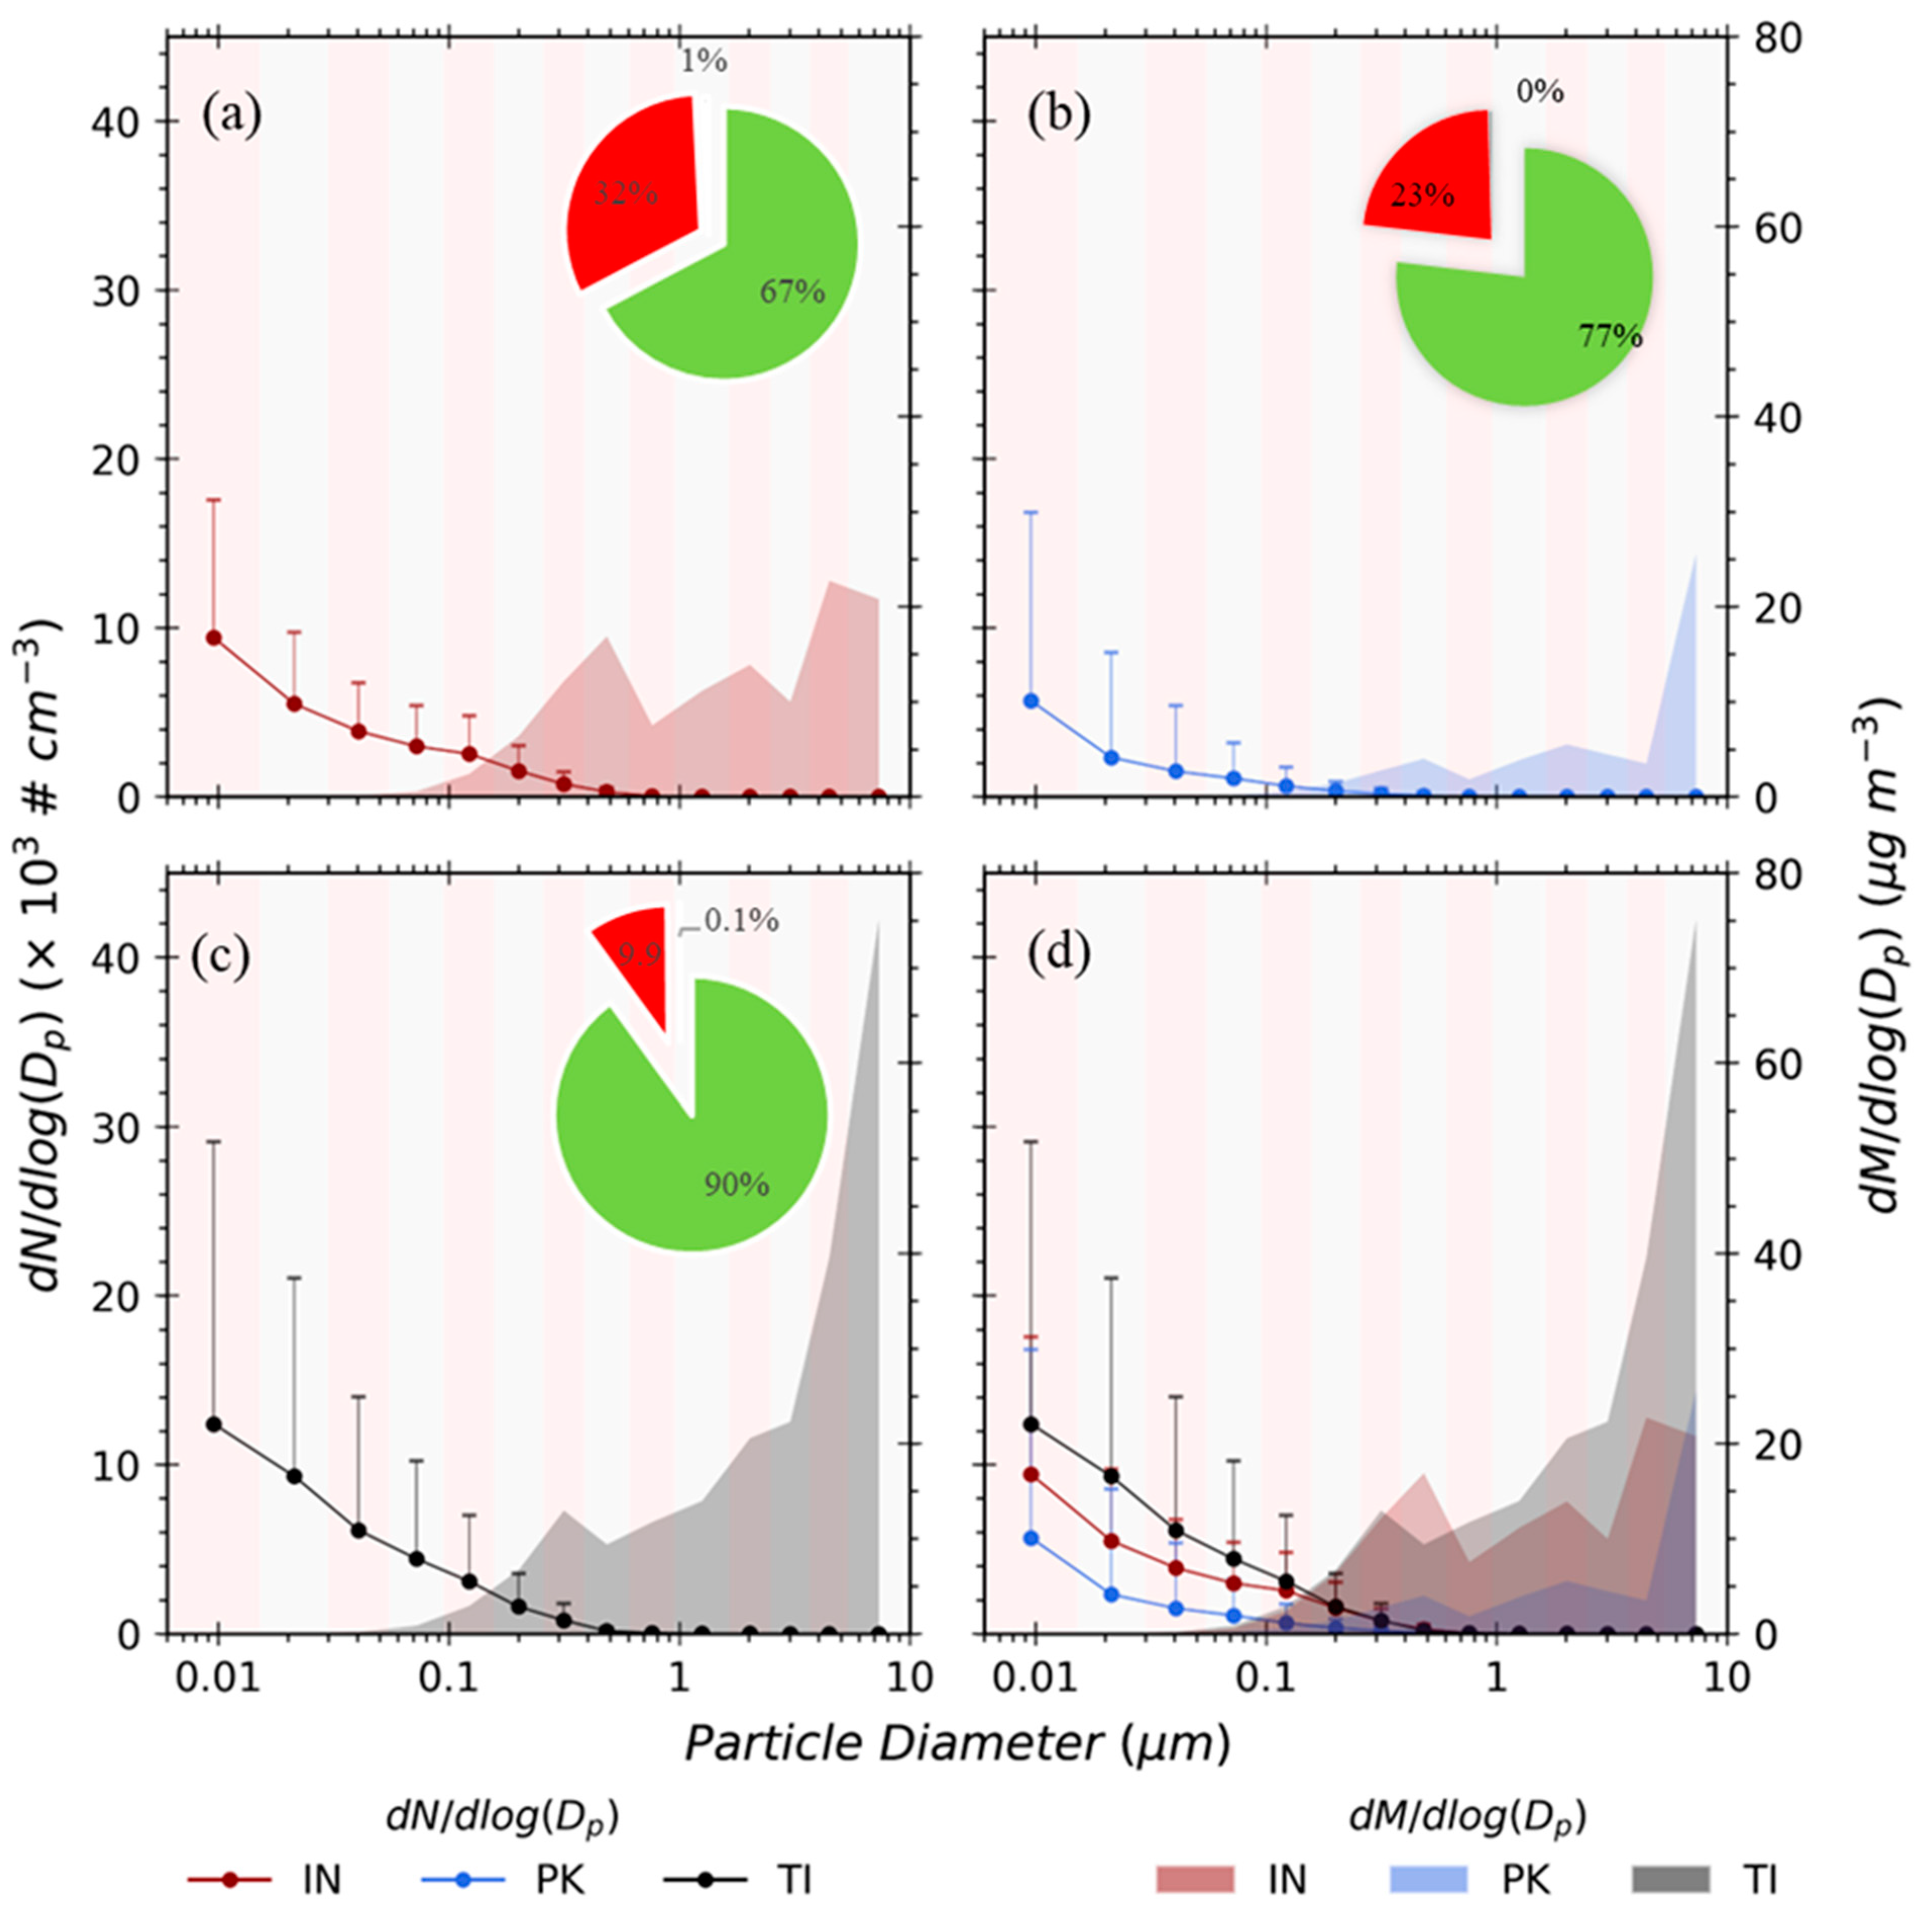
3.1. PNDs in Different Microenvironments

The mean PNDs (Figure 2), show a higher number distribution at ~10 nm at all three sites. The TI site was found to possess a higher distribution of ~1.5 times and ~2.7 times for nucleation mode, and ~1.4 and ~4.3 times for accumulation modes at the IN and PK sites. The distribution of the coarse-mode particles in the IN site was ~0.7 and ~2.8 times higher than at the TI and PK sites. The peak obtained at ~10 nm (Figure 2a) at the IN showing the higher contribution of nucleation mode could be attributed to the laser printer emissions and/or other activities such as toaster usage and coffee brewing [32,35]. The shape of the average PND curves was found to gradually decrease as the particle diameter increased, and a similar pattern of reduction is seen in all three sites (Figure 2a–c). Similarly, the higher distribution reported in the TI site at ~10 nm (Figure 2c); shows the influence of traffic emissions, since similar peak patterns were observed and reported previously, where the nucleation mode peaked at ~7–21 nm [7] and ~5–10 nm [48]. Nucleation-mode particles result from hot exhaust gases, which tend to condense as they cool down, thereby increasing the particles in the nucleation range [49]. Accumulation-mode particles are likely to result from vehicle exhaust emissions, which have particles in the range of 30–500 nm and consist of solid carbonaceous material [50]. The higher distribution peak at the ~10 nm urban background site (PK site) also shows the influence of traffic emissions (Figure 2b), like the other two sites. Similar patterns have been observed by [51] at ~20 nm and [38] at ~17 nm for an urban background site located close to busy traffic areas. This type of high distribution indicates the contribution of freshly emitted traffic exhaust and more aged traffic [39] as the PK site is located close to the busy arterial roads of the city. The combustion-related activities were found to contribute higher distributions at all three sites, with traffic and its related emissions for the TI and PK sites, whereas the photocopying activity and laser printer emissions were in the IN site.

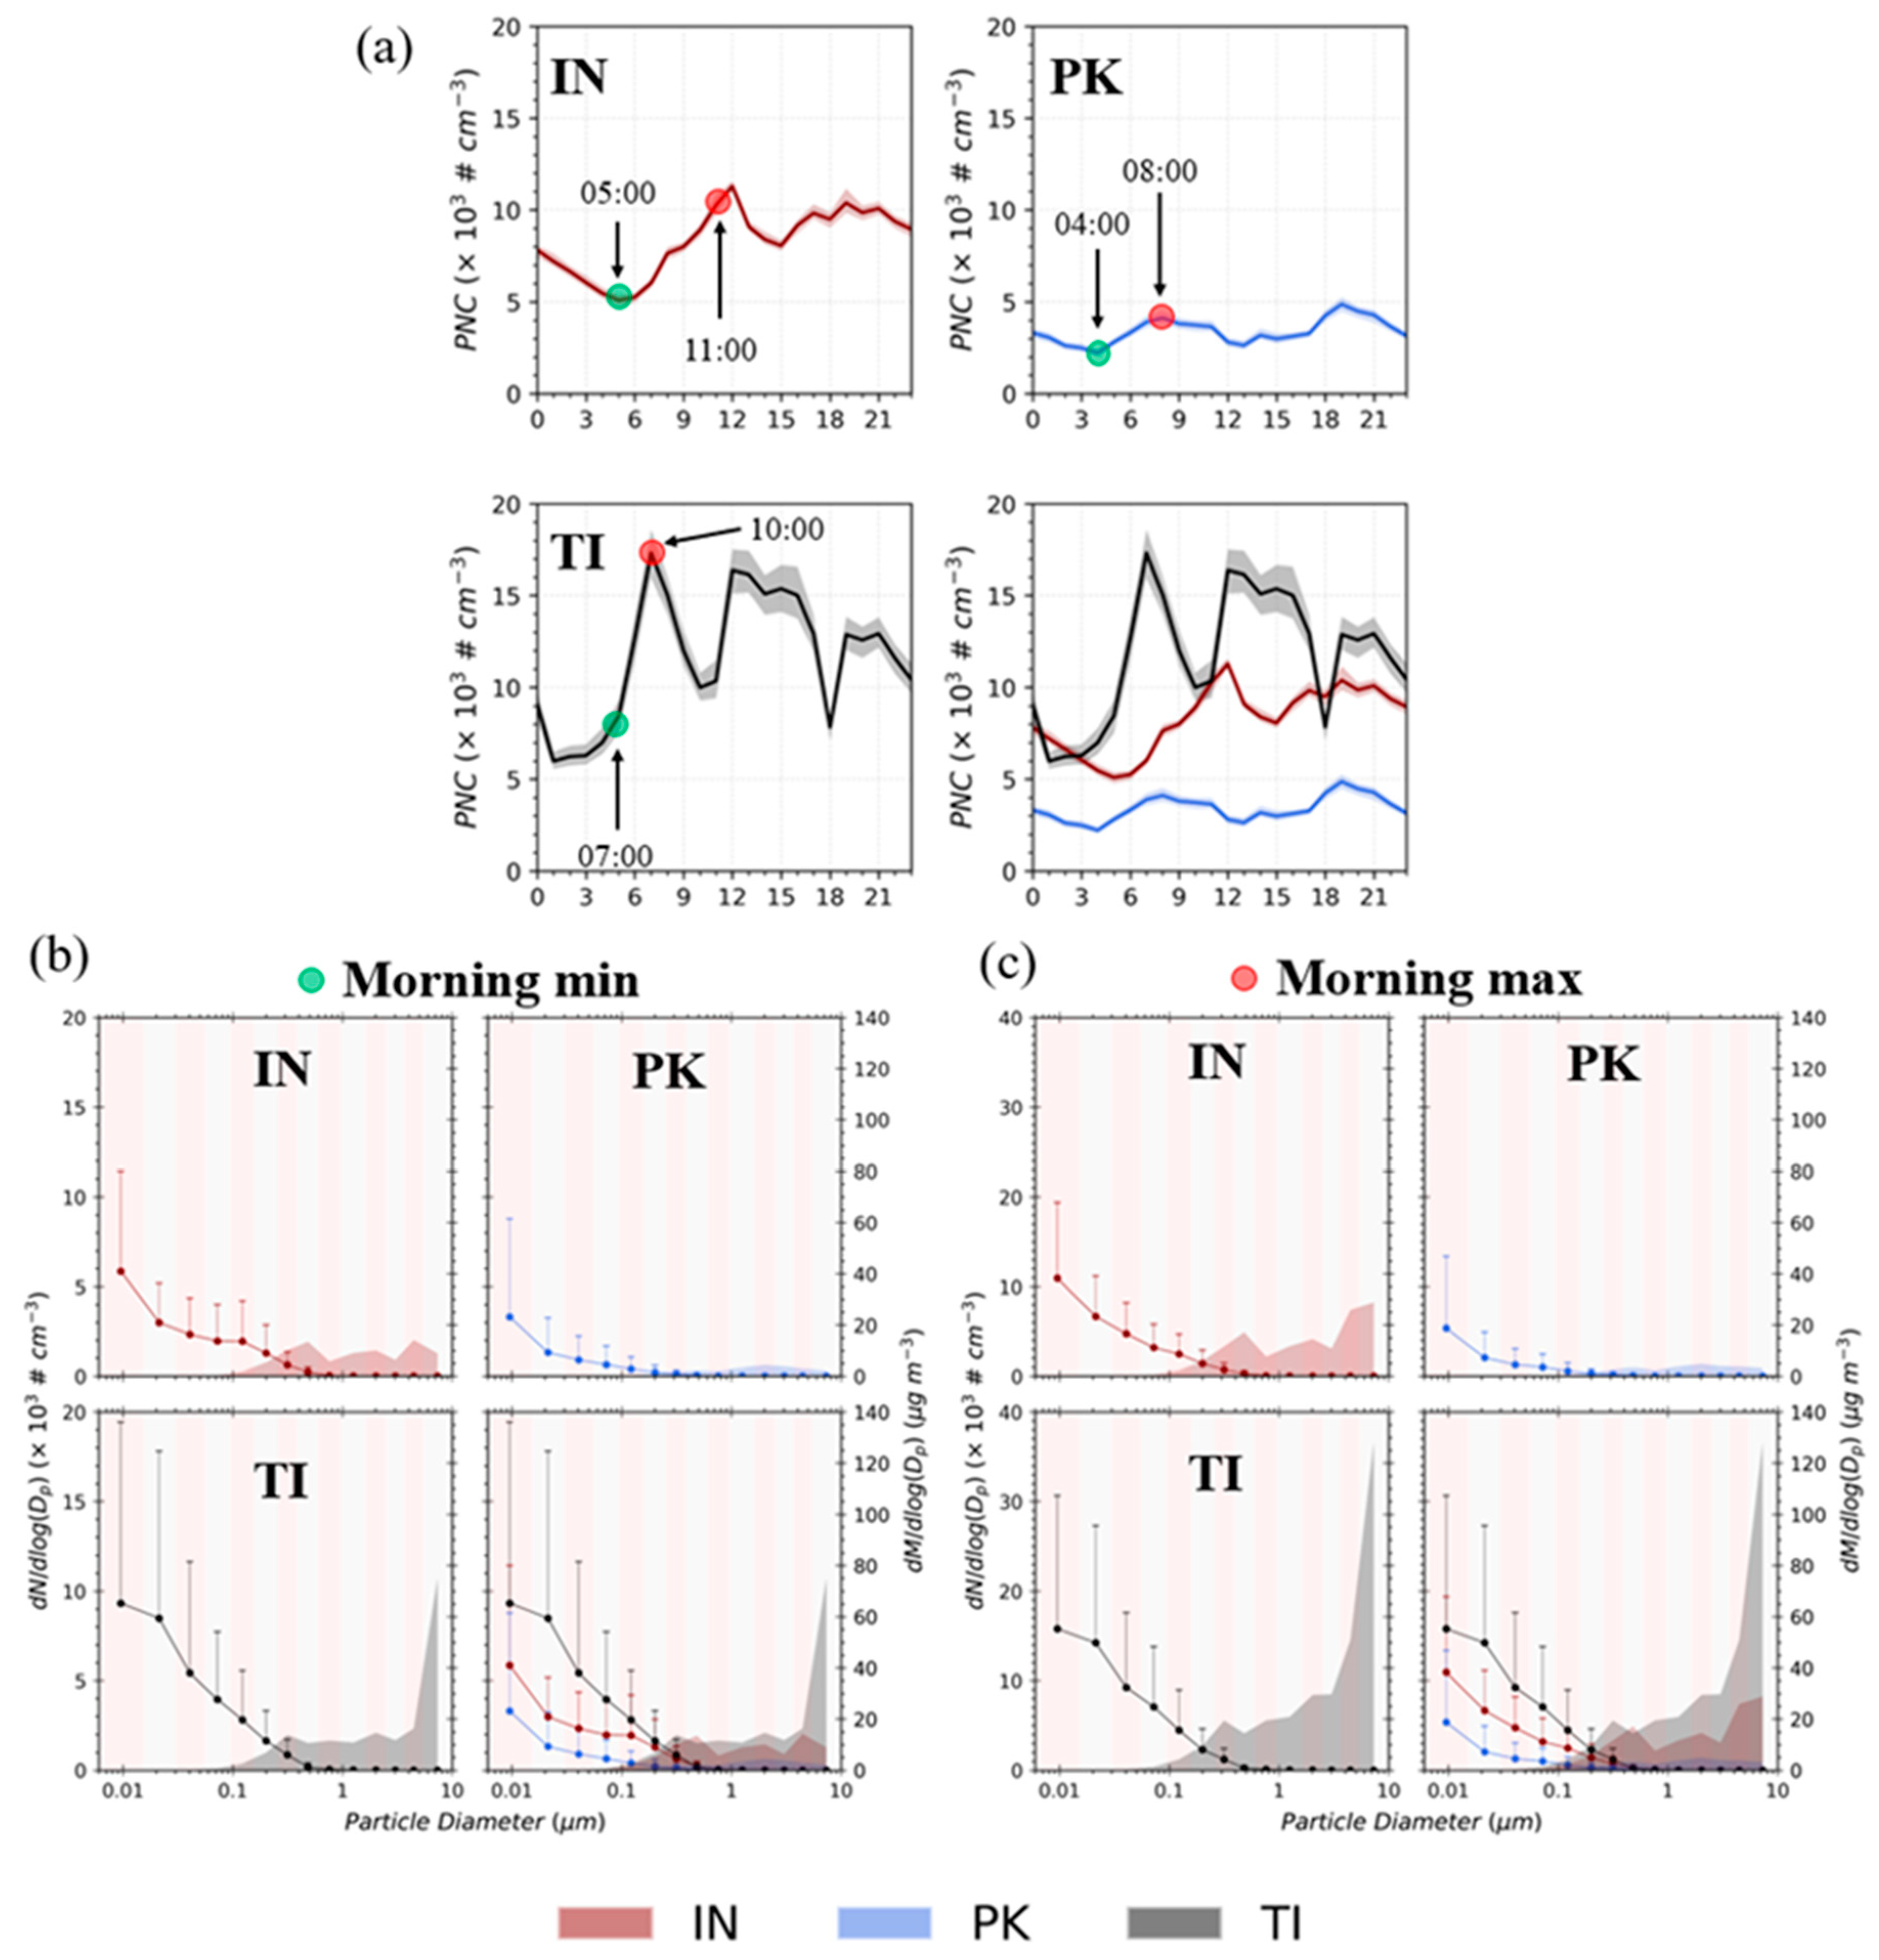
3.2. PNDs during Morning Peak Hours

The morning peak hours were between 7.00 a.m. and 10.00 a.m., which is the morning ‘rush hour’ in London. Figure 3a shows diurnal PNCs at all three sites, with coloured spots showing the maximum and minimum concentrations recorded at each site. Figure 3b,c shows the minimum and maximum PNDs at all three sampling sites. Among these, the morning peak for the IN site shows a bimodal distribution, with peaks at ~10 nm and a clear peak at ~100 nm, which indicates that the particles found in the nucleation and accumulation modes are probably obtained from toner-based printing equipment, such as laser printers and copiers and related activities in the IN environment. These activities in the IN site would have contributed to the higher number of concentrations in this particle size range since these printing processes release gaseous pollutants and elevated levels of airborne PM and engineered nanomaterials [34,35]. The PNDs at PK during the peak hours (Figure 3b,c) remain similar to the average number distribution discussed in Section 3.1. The unimodal distribution with a peak at ~10 nm at the PK site indicates the maximum contribution in nucleation mode from the residential apartments and long-range transported aerosols [52]. The morning peak hours PNDs at TI show a bimodal distribution with two peaks at ~10 nm and ~20 nm that are attributed to the nucleation mode, formed due to the condensation of volatile and gas particles [53]. Similar bimodal distributions in the 10–35 nm range have been reported in similar environments [54]. The supersaturated vapours from vehicular combustion were stagnant due to the low temperature and high humidity during these hours of the day with high traffic volumes. The accumulation mode also possesses a significant number concentration and particle distribution which demonstrates the particle formation from the nucleation mode to accumulation mode. The particles in the nucleation mode append to the particles that contribute to the accumulation mode from the vehicular emissions, showing the maximum number distribution of the particles in these modes.

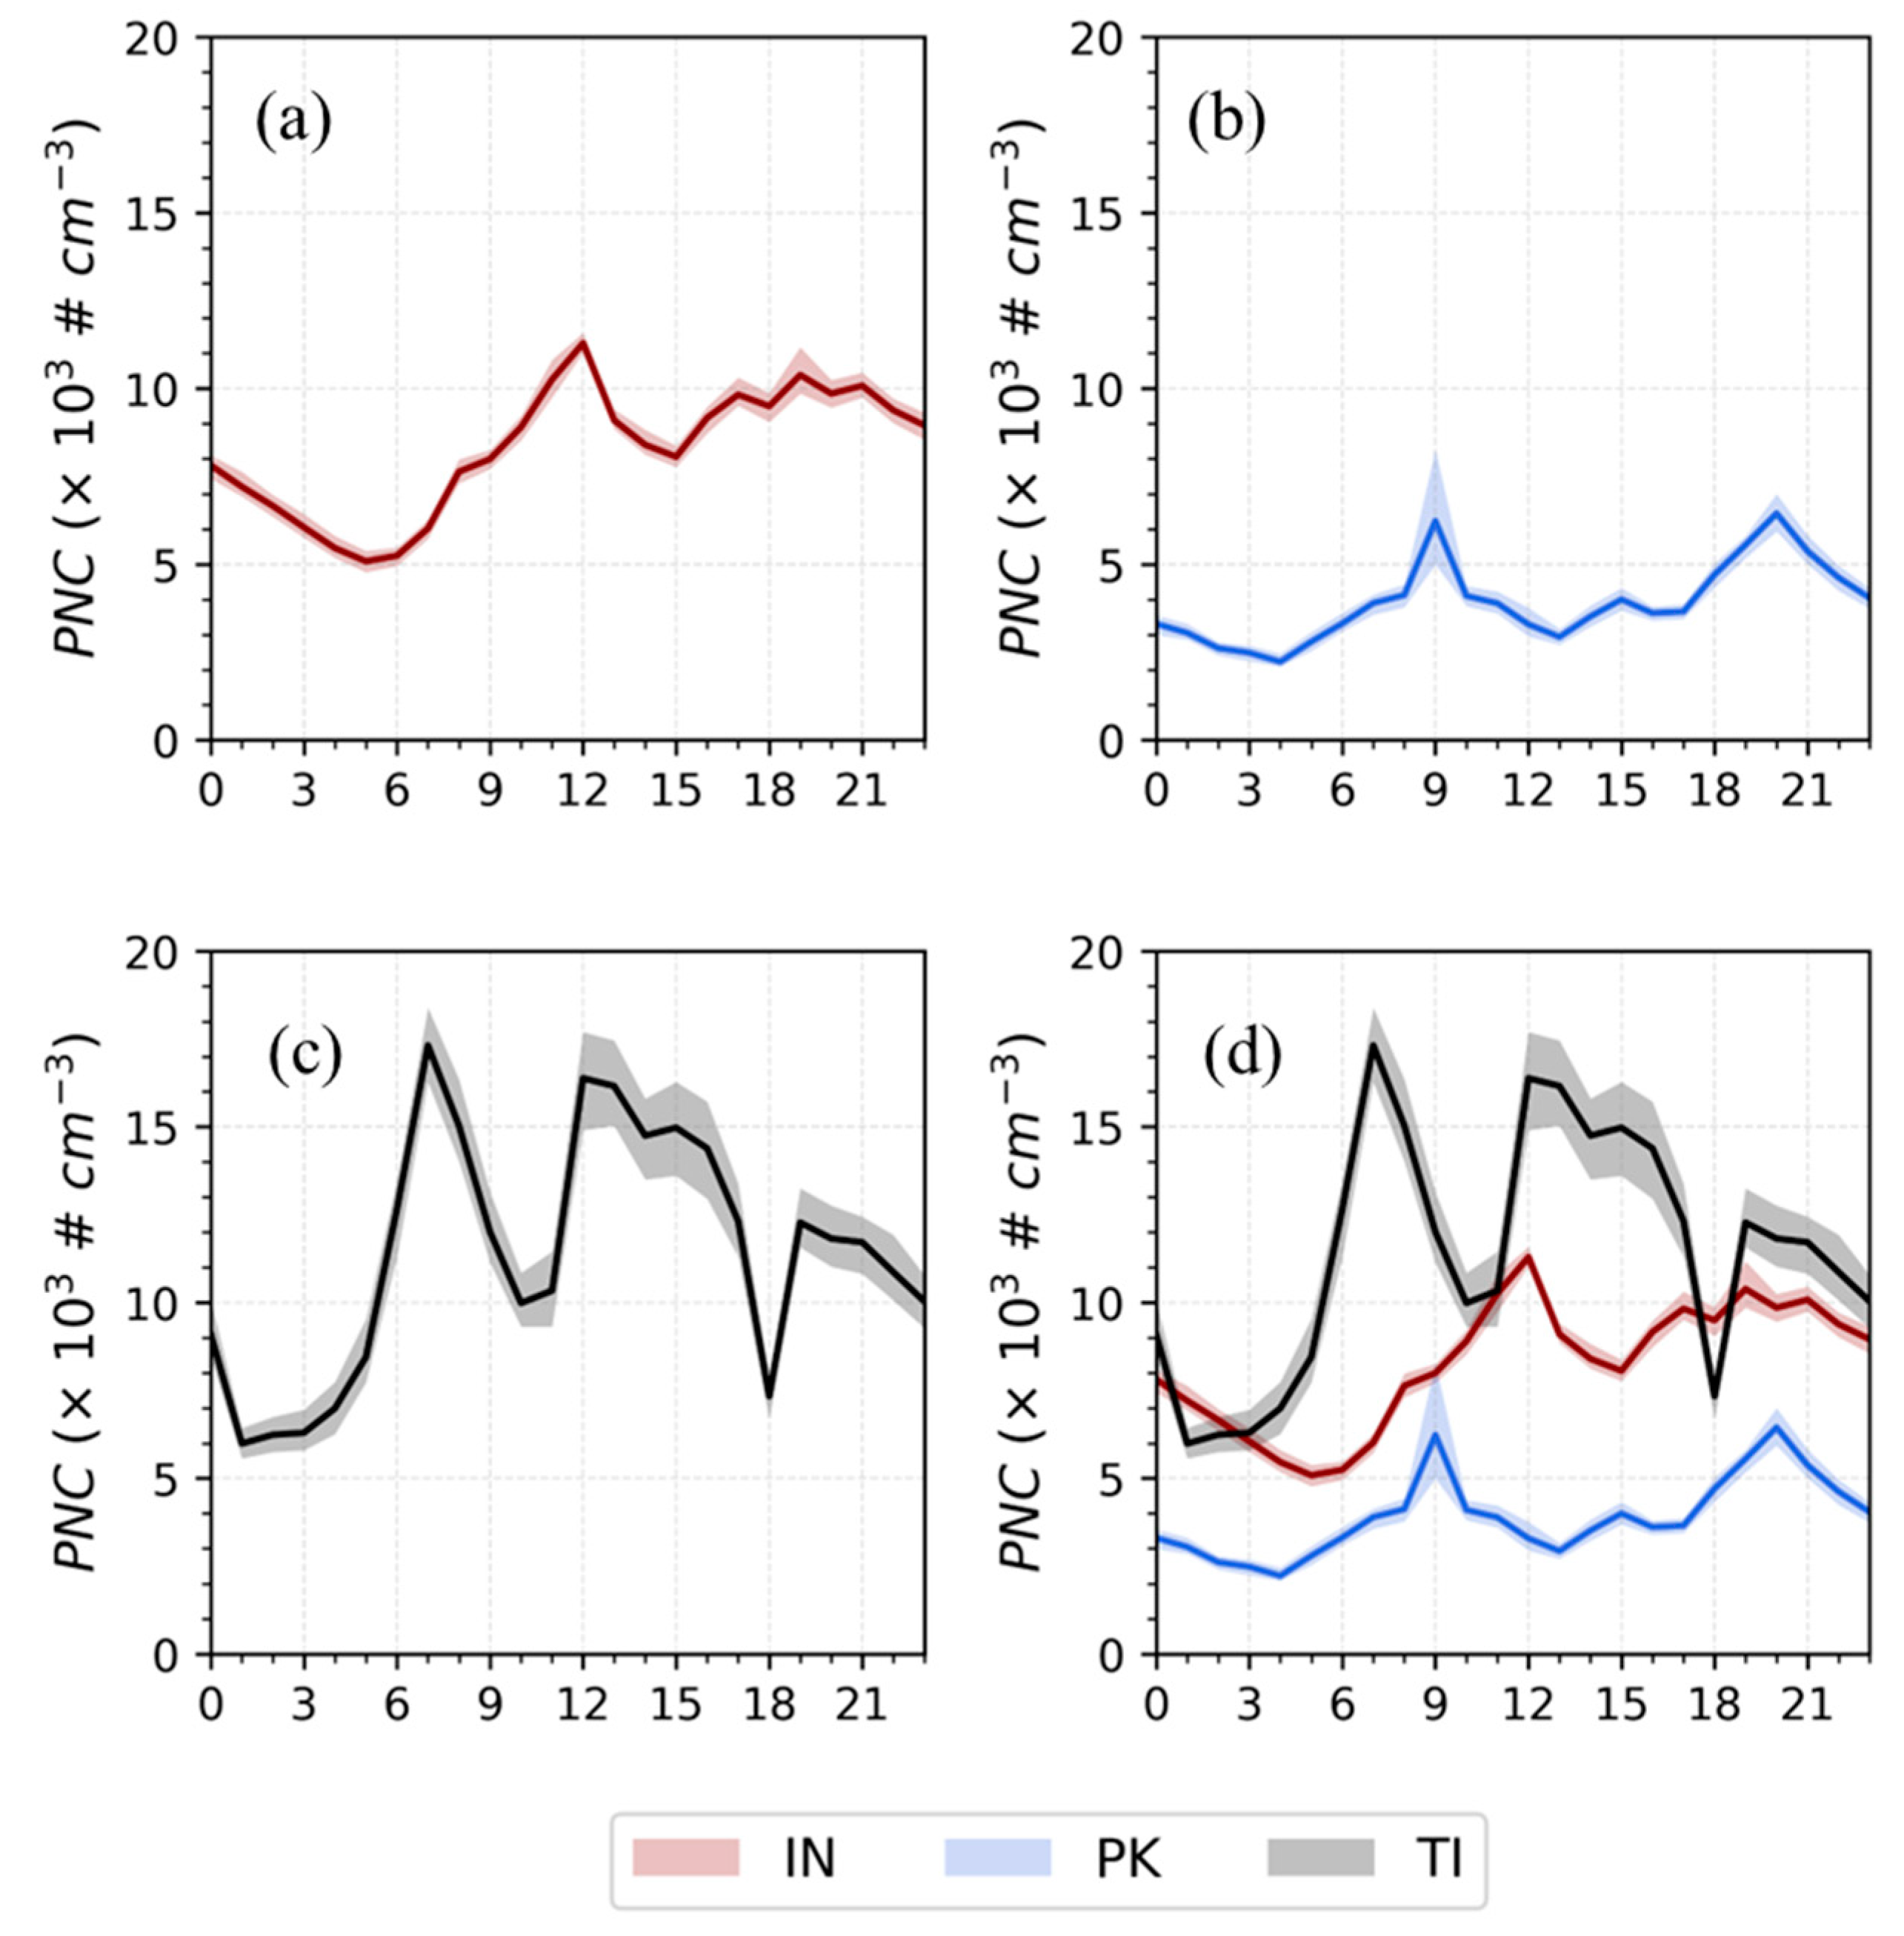
3.3. PNCs in Different Microenvironments

Table 3 shows the average PNCs for different particle sizes at all sites for the entire sampling duration. The mean PNCs at the IN, TI, and PK sites were 1.68 ± 1.03 × 10⁴ #cm−3, 7.00 ± 18.96 × 10⁴ #cm−3, and 0.76 ± 0.95 × 10⁴ #cm−3, respectively (i.e., 4.2 and 9.2 times higher than IN and PK compared with TI). (Figure 4). The average PNCs in nucleation mode for the TI site (3.1 ± 9.5 ×10⁴ #cm−3) were over 5.5 times and 10.7 times higher than IN (0.56 ± 0.39 × 10⁴ #cm−3) and PK (0.29 ± 0.37 × 10⁴ #cm−3) sites, respectively.
Similar trends were measured in accumulation mode, where the PNCs at the TI site (3.4 ± 2.5 × 10³ #cm−3) were over 1.3 and 4 times higher than IN (2.7 ± 1.8 × 10³ #cm−3) and PK (0.8 ± 1.1 × 10³ #cm−3), respectively. However, the coarse-mode particles were higher for IN, recorded at an average concentration of 63 ± 55 #cm−3, which is ~1.4 and ~2.7 times higher than the average PNCs of coarse-mode particles for TI (45 ± 30 #cm−3) and PK (17 ± 32 #cm−3) sites. The slight increase in coarse-mode particle concentration at the IN site is likely to have been caused by the resuspension of settled dust [55], dust particles from the carpet flooring, cleaning activities such as vacuum cleaning [56], and maximum occupancy [57] at the IN site. In [58], the resuspension of particles from carpet flooring was found to be significantly higher than the vinyl tile flooring for larger particles (1.0–10 µm). Particle resuspension would have resulted from human activities [59], which is evident from the higher concentrations of coarse-mode PNCs recorded during working hours (Figure 3a).
The increase in PNCs was significant in nucleation mode for TI compared with IN and PK. This rise in concentrations in nucleation mode would have contributed to the traffic exhaust emissions since the particles in these size modes are emitted directly from the tailpipe of vehicles as supersaturated vapours [42]. The role of nucleation-mode particles is distinct, and these particles later undergo a new particle formation (NPF) process, which grows to contribute to the accumulation mode at TI [60]. However, ~70% of the total PNCs at IN were in nucleation mode. The contributions could have been emissions from copiers and printers [32,61].
In the PK site, around 77% of the total PNCs were in nucleation mode. PNCs at this site indicate that PK has well-mixed sources of emissions from traffic and more aged traffic, and cooking emissions from nearby residential apartments may have contributed to particles in nucleation mode [39].

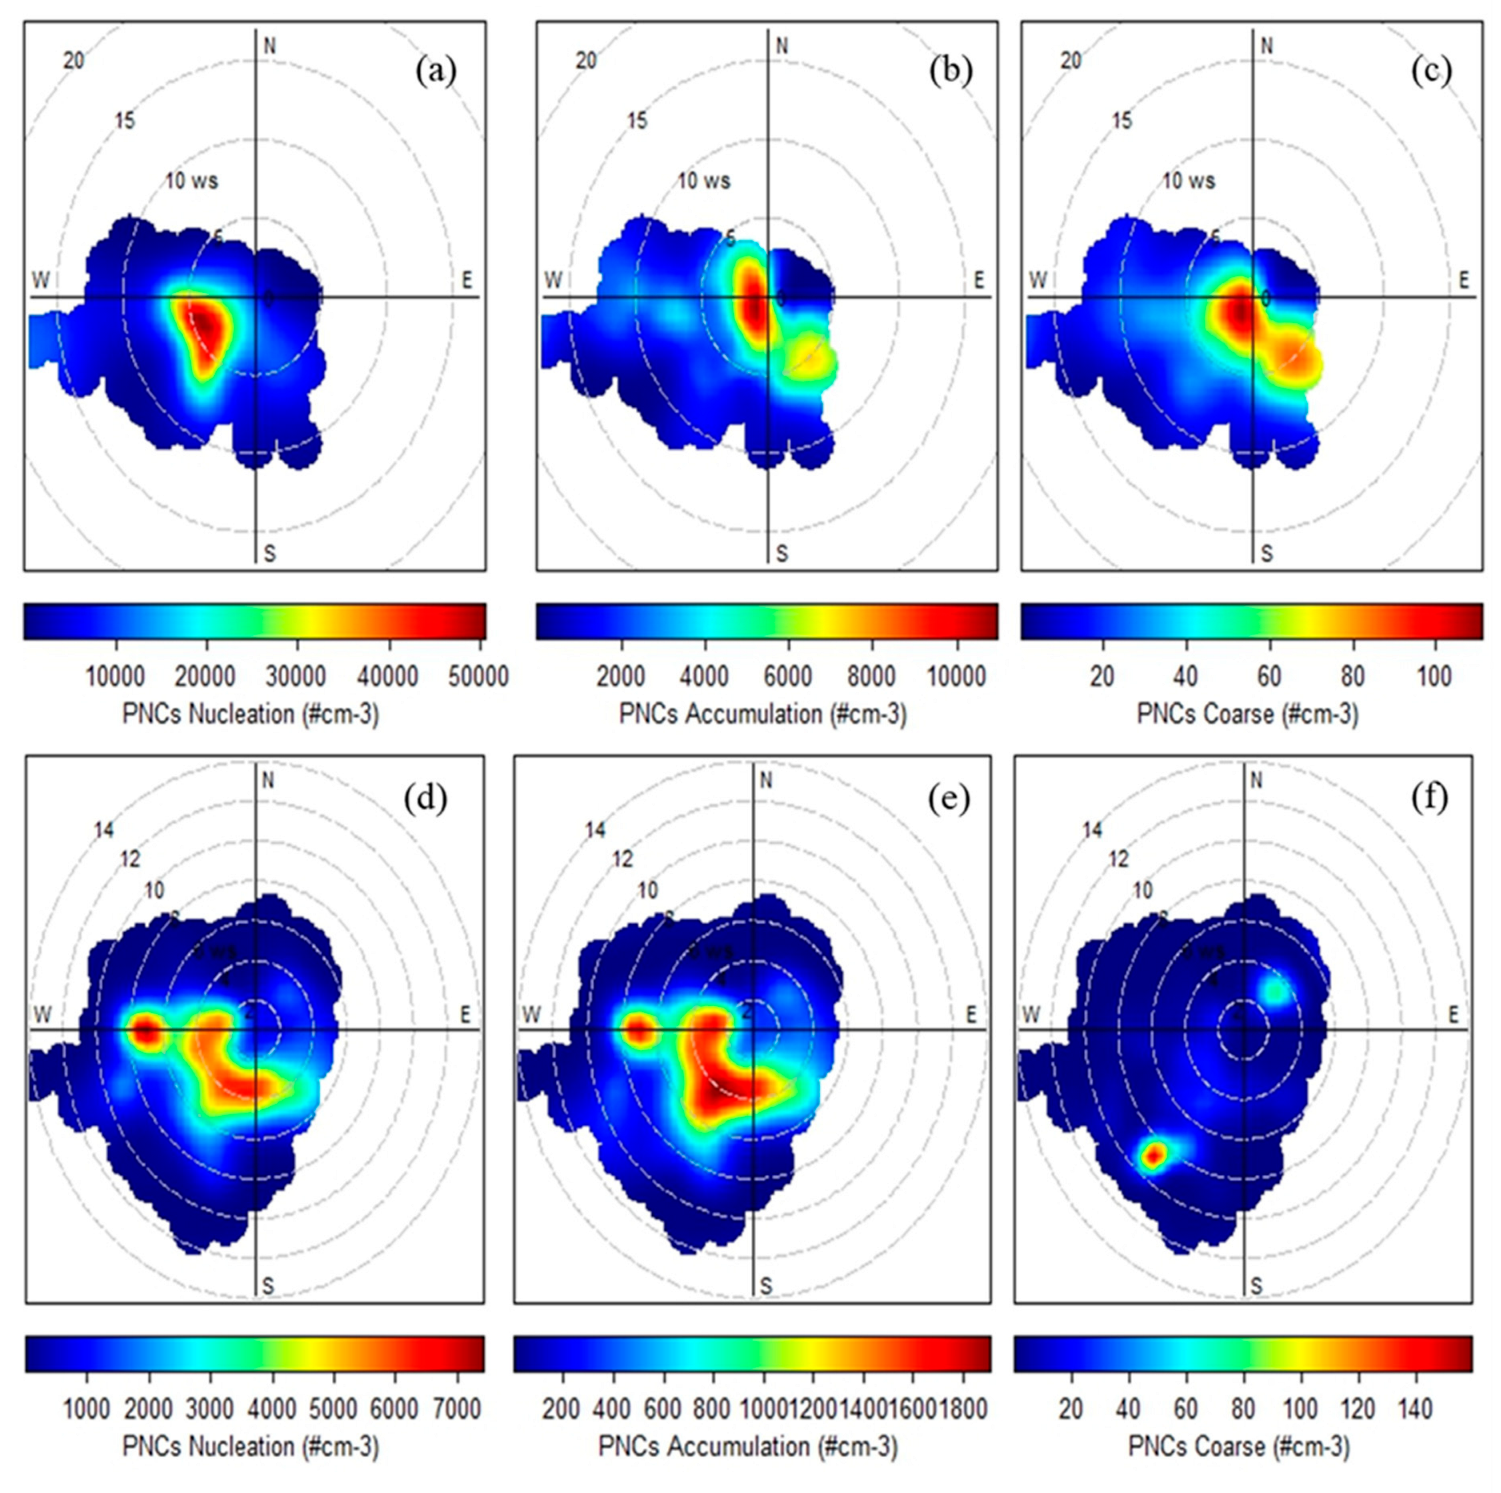
3.4. Effect of Meteorology on PNCs

Figure 5 shows the influence of wind speed on the PNCs at TI and PK using meteorology data obtained from London Heathrow Airport. The meteorological and PNC values are taken at 30 min intervals. The PNCs were higher in the TI site compared to the PK site in all three particle modes (Figure 4a–c). The sampling site comprises three major roads, with South Africa Road in the west–southwest (WSW), and Wood Lane in the south–southwest (SSW) direction at ~40 m, ~60 m, and ~50 m, respectively. The predominant wind directions for both TI and PK sites are the west and southwest directions with wind speeds ranging from 0–14 ms−1. The prominent wind speeds at both sites are 6–8 ms−1 followed by 4–6 ms−1, 8–10 ms−1, 2–4 ms−1, and 10–12 ms−1. The wind speeds > 10 ms−1 were found to be coming from the western direction at the TI site. The nucleation-mode particles depicted higher concentrations at the wind speeds of 4–6 ms−1, which is ~13 times higher than the lower concentrations exhibited in the wind speed range of 10–12 ms−1. The contribution to the nucleation-mode particles would have been from the west and southwest directions, from the vehicular emissions of South Africa Road in the west–southwest and wood lane road in the south–southwest. The average temperature during the field measurements at the TI site was around 7 °C–8 °C, which would have caused a temperature inversion, causing the particles to stagnate, leading to a higher concentration of PNCs at these wind speeds. There is a dilution of particles in nucleation mode at higher wind speeds, which supports the atmospheric dispersion theory, where downwind concentrations are found to be inversely related to wind speeds [62]. The higher the wind speed, the lower the concentration in all particle modes. The accumulation-mode particles showed higher concentrations in lesser wind speeds. For instance, the PNCs were higher for the wind speed of 0–2 ms−1, which further decreases as the wind speed increases, showing a ~3 times difference in PNCs from the lowest PNCs recorded for the wind range of 10–12 ms−1.
PK has a major, busy, road (A315) ~150 metres to the north, and Exhibition Road (with less traffic than A315) ~160 m to the west. The PNCs of the nucleation-mode particles were higher at wind speeds ranging from 2 to 4 ms−1 and decreased by up to ~12.6 times when the wind speed increased to 10–12 ms−1 [63]. The accumulation-mode PNCs were higher at the wind speed of 2–4 ms−1 and were found to decrease as the wind speed increased up to 10–12 ms−1 due to the influence of the downwind direction on the concentrations that agree with the dispersion theory. The PNCs for both the nucleation and accumulation modes were higher from the west at wind speeds ranging from 2 to 4 ms−1, showing the influence of traffic volume or the spatial distribution of local particulate sources around the sampling site impact PNCs [64] at the PK site. Therefore, the wind speeds ranging from 0 to 6 ms−1 were found to cause a higher concentration of particles in nucleation and accumulation mode. As the wind speed increases, the perpendicular winds > 6 ms−1 from the southwestern direction transport the particles away from the sampling point thereby decreasing the concentrations.

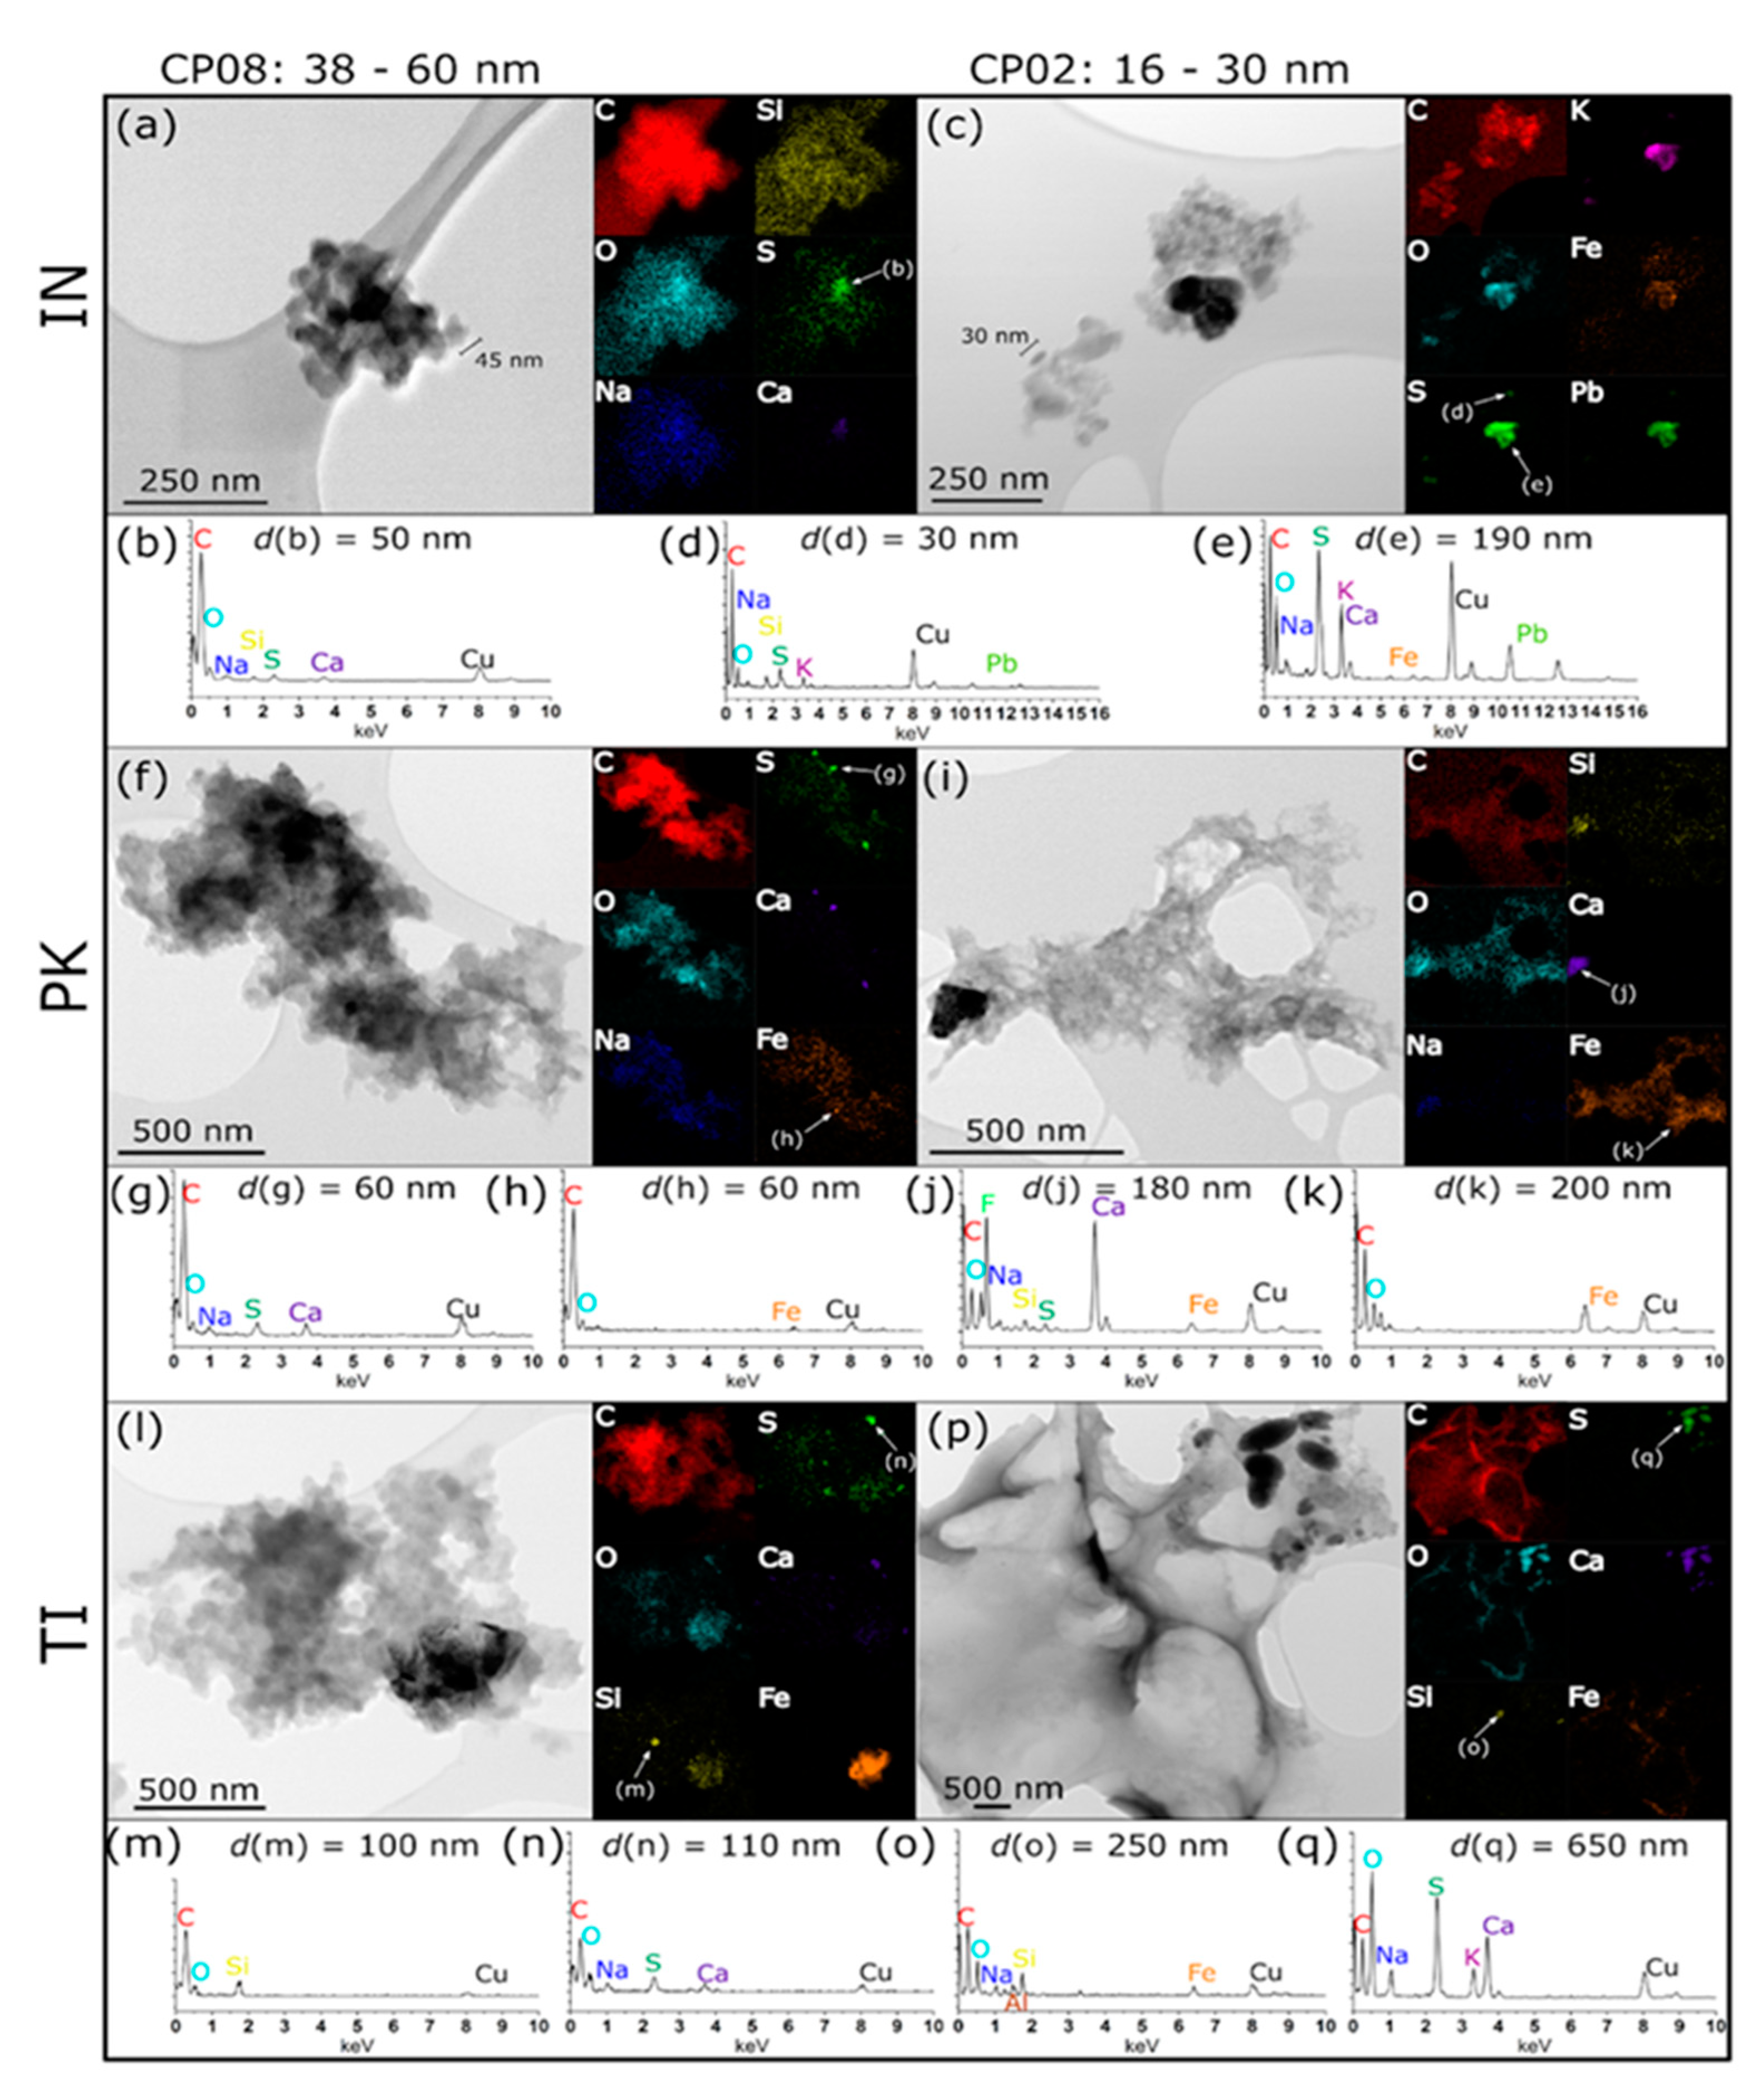
3.5. Characterisation of PM from Different Environments

We performed qualitative STEM-EDX to visualise and characterise the structure and composition of representative particles from different size-fractionated filters. For all three environments, the STEM revealed that UFPs (≤100 nm diameter) showed varied compositions within complex clusters, with diameters ranging from micrometres down to sub-micrometres (Figure 6c,i,l). The nanoparticles and micrometre-sized clusters had irregular and non-spherical morphologies. Interestingly, in all environments, the EDX mapping revealed that some of the nanoparticles contained Fe- and O-rich particles as well as other organic and inorganic elements (C, Cl, O, S, Na, K, Si, and Ca) within the clusters. In the IN environment, EDX maps (Figure 6c) and a point spectrum (Figure 6e) showed that they were made up of ultrafine 80 nm diameter particles, composed of iron, sulphur, potassium, oxygen, and lead embedded in a matrix of carbon (Figure 6). Other work has indicated that these metal/metal oxide particles are incorporated into toners in printers, which supports them as the likely source (discussed in Section 3.2) [34]. However, Pb was also found in the indoor site which is unlikely to be sourced from printers and suggests atmospheric ingress from outdoor sources; for example, current or historic traffic emissions from which Pb is likely to persist in the environment [65,66]. At the PK site, a particle composed of Ca, Fe, and O was embedded in a larger matrix of carbon, oxygen, and iron (Figure 6i–k). Similarly, at the TI site, particles composed of Fe and O-rich particles were embedded in a matrix of carbon (Figure 6i,o). The presence of transition metals at the PK and TI indicates that these PMs are generated by abrasion and resuspension at the roadside as well as crustal and gasoline (diesel) emissions and support roadside resuspension and dust particles as a potential source (discussed in Section 3.2).

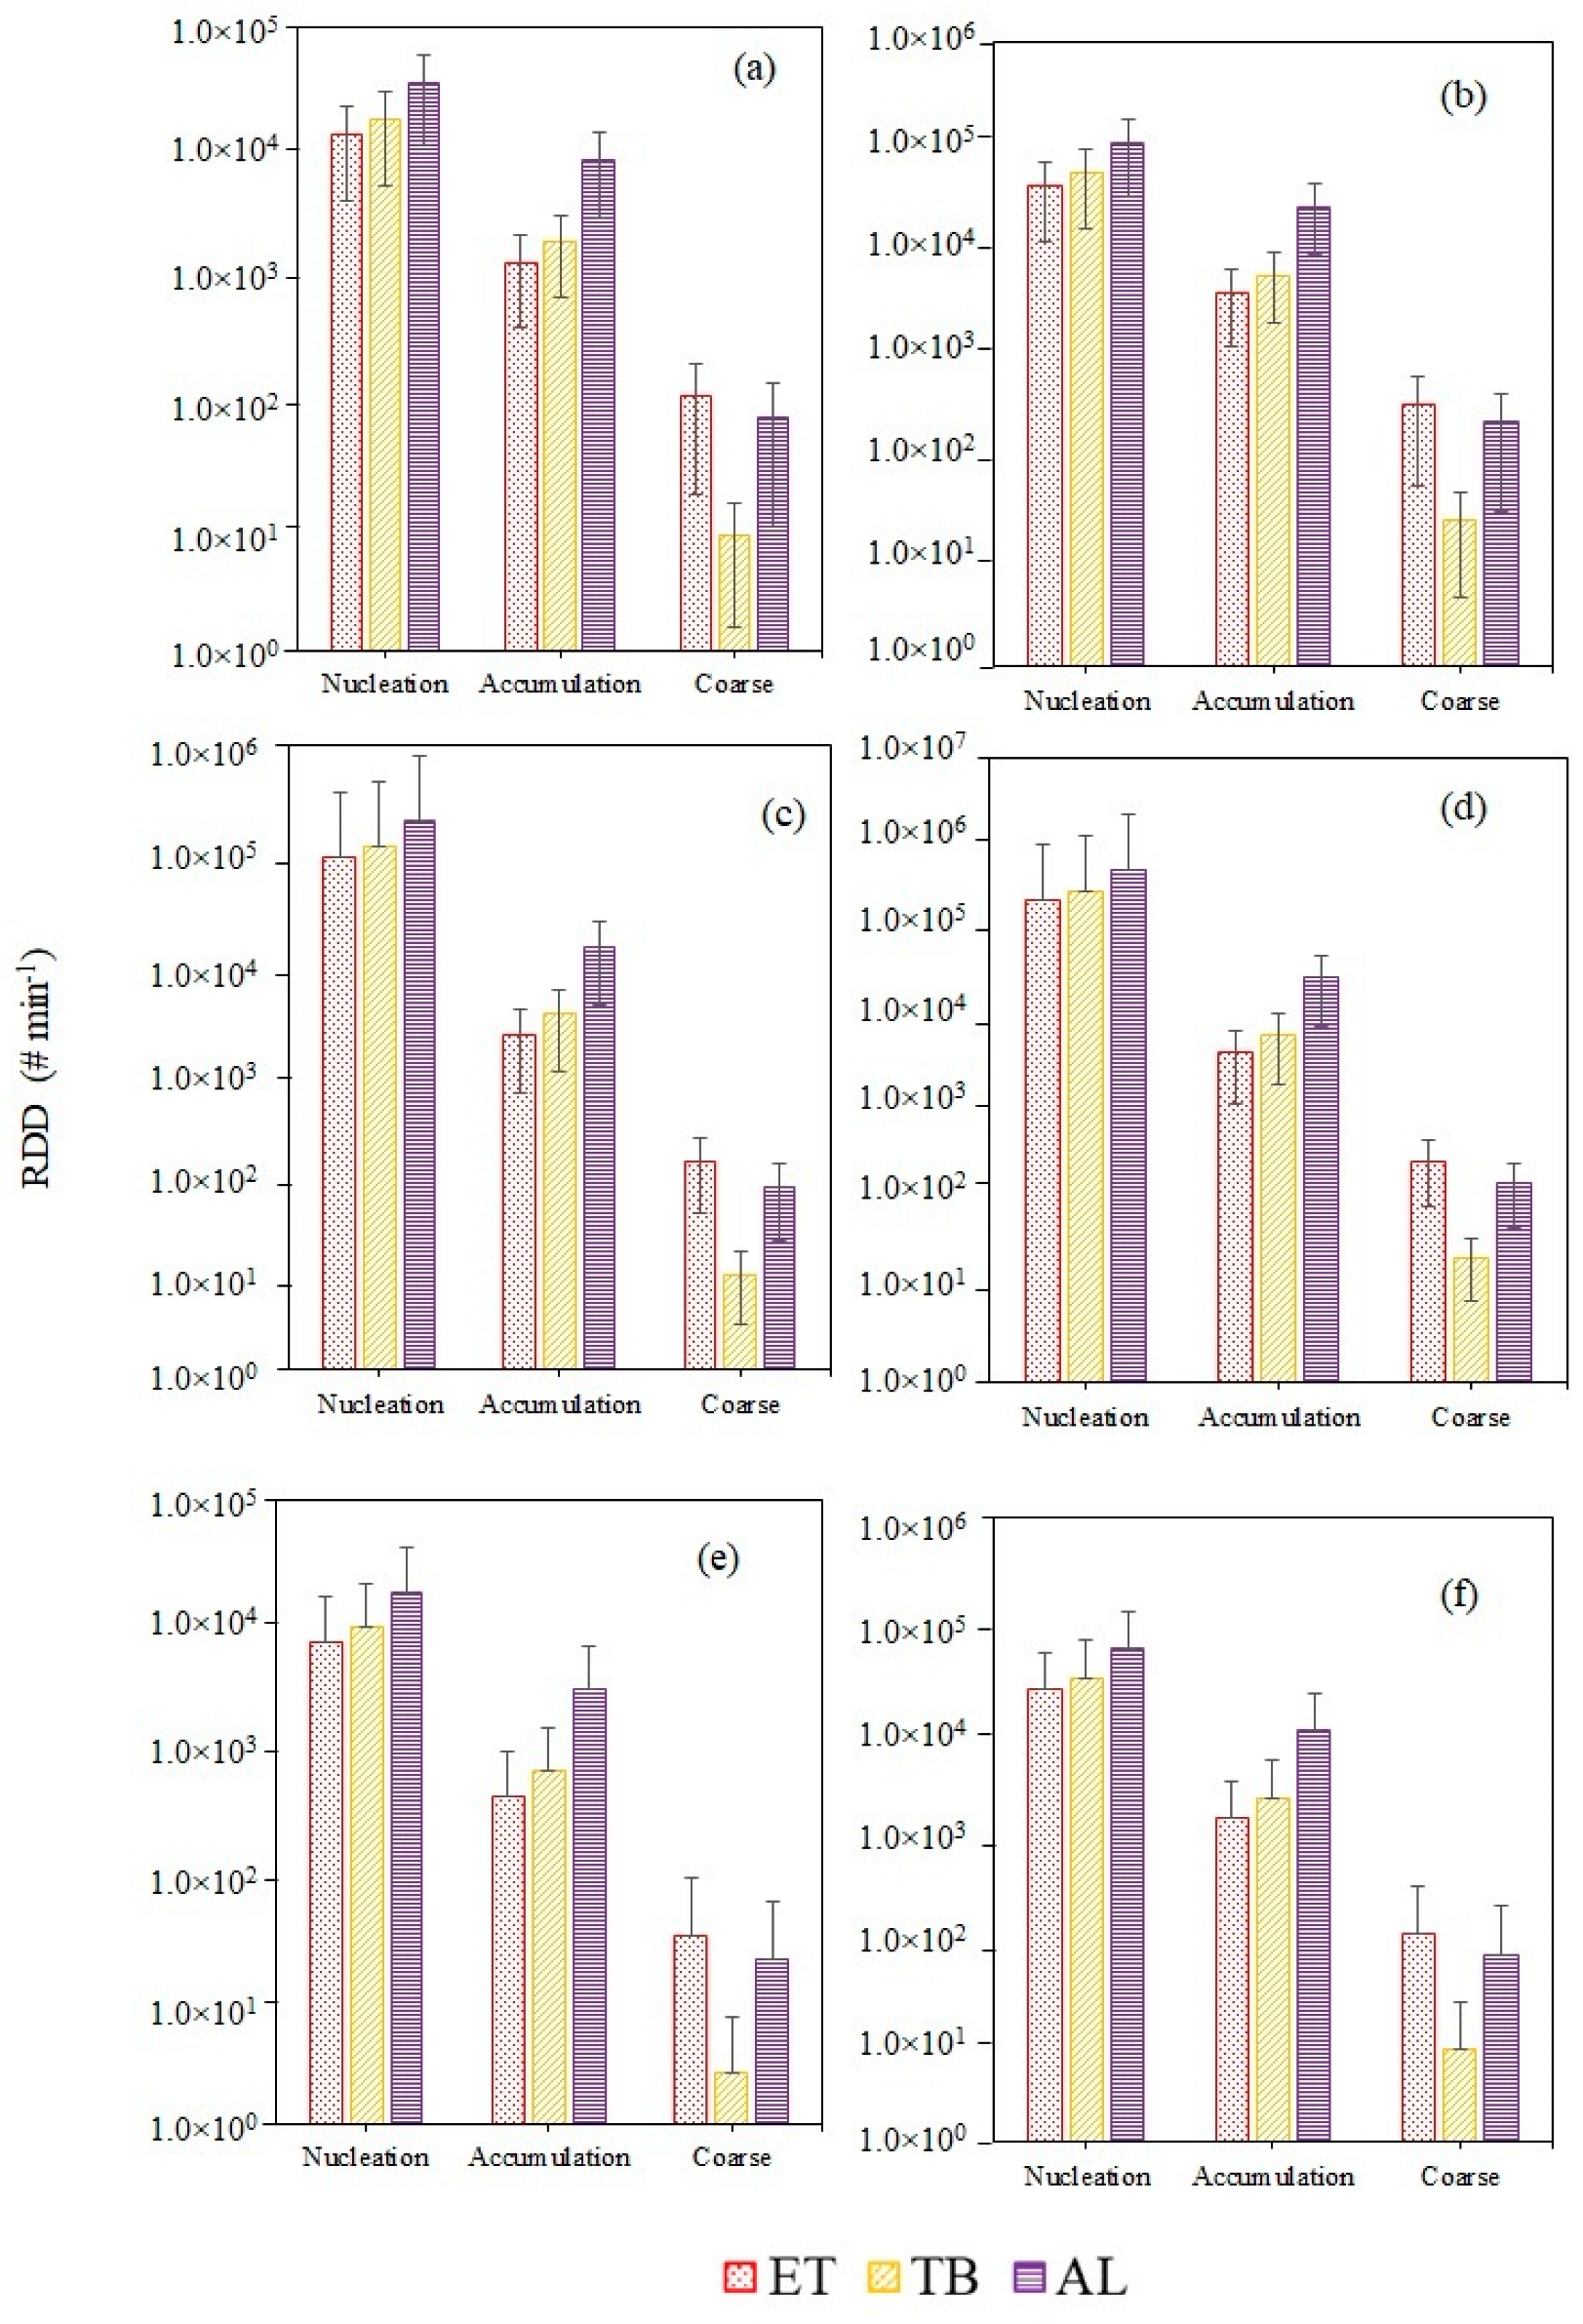
3.6. Respiratory Deposition Doses

The RDD rates for all three different MEs were calculated for all three different particle modes (nucleation, accumulation, and coarse) using the breathing frequency and tidal volume of the two different activities such as rest (e.g., sitting) and exercise (cycling, walking, or jogging). As might be expected from their higher tidal volumes, the male RDD was ~12% higher than females across all size fractions. The RDD of males is presented in Figure 7, and the results of female RDD are presented in Table S2/Figure S2. The RDD at the TI site was higher than that of IN and PK sites in all particle modes except for the coarse mode, where the RDD of coarse-mode particles in the IN site (rest condition) were ~1.1, 1.0, and 1.3 times higher than the TI site (~3.4, 3.3, and 3.6 times higher than PK site) at the ET, TB, and AL regions, respectively. This might be due to the resuspension of particles from the carpet flooring at the IN site. Additionally, the coarse-mode PNCs at the IN site were ~1.4 times and ~3.7 times higher than the TI site and PK site. This shows that the RDD is a function of PNCs in each mode [12], and the higher PNCs in the coarse mode of the IN site resulted in a higher deposition compared to the other MEs. A similar trend was observed in coarse mode for the exercise conditions at all three MEs. Nucleation-mode particles dominated the RDD deposition followed by accumulation and coarse mode in all three MEs. The maximum deposition of the nucleation mode was at the TI site (during exercise) (3.01 ± 9.64 × 10⁸ #min−1), where 50% was deposited in the AL region, followed by 28% and 22% deposition in the TB and ET regions, respectively.
The PNCs at the TI site was mainly contributed by the high-traffic volume and different types of vehicles. This is evidenced by the prevalence of solid-core particles in the 10–15 nm range present (in nucleation mode), indicating that they are exhaust emissions [67] and the undiluted exhaust emissions that emit gaseous components at high temperatures and condense to the particle phase (due to the rise in the gas saturation ratio), dominating particles present in nucleation mode [7]. The deposition was higher in the AL region (deepest part of HRT), indicating that the particles with lower diameters will deposit in the deeper part of the lungs [12,68]. Coarse-mode particle deposition (3.87 ± 3.23 × 10⁵ #min−1) was higher in the ET region at the IN site. The ET region serves as an entrance and first line of defence to the HRT [69], and the particles deposited generally do not travel into the deeper region of the lungs and are quickly removed through coughing, ciliary activity, and other mechanisms [70]. Similarly, nucleation- (0.38 ± 1.22 × 10⁹ #min−1) and accumulation- (9.29 ± 6.69 × 10⁶ #min−1) mode particle deposition in the TB region was higher than in the ET region but lower than in the AL region. However, the RDD of the coarse-mode (2.9 ± 1.96 × 10⁴ #min−1) particles were lower in the TB region compared to the ET and AL regions. The TB region acting as conducting airways [71] has an increase in deposition with a decrease in the particle size, showing reduced deposition in coarse mode [69].
Accumulation-mode particle deposition at the IN and TI sites showed slight differences in the deposition doses at all HRT regions (~1.4 times higher in the TI site), rather than the PK and TI sites, where the RDD of PK was ~4 times lower than the TI site. This indicates that the source of accumulation-mode particles in both IN and TI sites are slightly different. In [72], a slight difference in the accumulation-mode particle distributions was found between indoor and outdoor sites. The RDD at all three MEs for all three modes and three regions of the HRT shows that the particle size plays a major role in determining the deposition and clearance of the fraction of inhaled particles from various regions of the HRT. The observations made from the RDD estimation show that the exposure of particles and their deposition rate depends on the type of activity, and type of sources of pollutants, for instance, a carpet floor in an indoor environment can cause a rise in particle concentration, thereby increasing the exposure. Hence, the magnitude of exposure depends on the type and characteristics of any microenvironment, and proper consideration needs to be taken when undertaking any type of physical activity by looking at the potential exposure to particle deposition. Nevertheless, such RDD calculations have their limitations. An in vitro and in vivo study can provide a more accurate analysis of respiratory deposition by experimentally assessing and comparing the lung deposition rate with these empirical results, to estimate the difference in the accuracy of the deposition.

4. Conclusions

We assessed the number and size distributions of particles and their physico-chemical characteristics in three different MEs, and found that the average PNDs for the whole duration and peak hours showed a unimodal distribution with peaks at ~10 nm for all three different MEs. The magnitude of the peaks for the TI site at 10 nm was ~1.3 and ~2.2 times higher than at the IN and PK sites. High traffic volume and fresh exhaust emissions caused the rise in the magnitude of the peak at ~10 nm at the TI site compared with other MEs. Similarly, the PNCs from all three sites followed the trend: TI > IN > PK, and the nucleation-mode particles were found to be higher at all MEs, followed by the accumulation mode, and a negligible contribution from coarse0mode particles. TI site possessed higher PNCs compared to IN and PK due to the domination of traffic sources in the nucleation and accumulation modes, except for the coarse-mode particles in the IN site which were ~1.4 and ~2.7 times higher than at the TI and PK site, showing the influence of people’s movement and the hoovering activity which would have caused a rise in particle resuspension and an increase in the PNCs of the coarse mode. Furthermore, the meteorological effects such as wind speed ranging from 0–2 ms−1 to >12 ms−1 and the wind direction prominent to the west and southwest direction at both the TI and PK sites exhibit higher concentrations at lower wind speeds and the concentrations were found to decrease as the wind speed increases. The elemental maps of the UFPs supported the attribution of these different sources, for instance, the IN site, which showed iron, sulphur, potassium, and oxygen embedded in a matrix of carbon; and contributed from toners in printers. RDDs were found to be higher at the TI site, and they exhibited the same pattern as the PNCs, since RDD is a function of PNCs, and we can see that higher PNCs cause greater deposition. There was less deposition at sites such as PK, which is an urban background site with comparatively less impact from traffic and other related sources.
The PNDs help in understanding the distribution of particle sizes at different MEs, and identifying the potential contributions from various sources. Future research work on the combined measurements of NOx and SOx along with PNDs and PNCs on a continuous measurement basis for longer periods and observe seasonal variation trends can build further understanding of the behaviour of particles with respect to the wind directions and traffic volume. The RDD of PNCs can be used to study the relationship between the particle diameter and deposition in the different regions of the lungs, and the influence of the deposition of UFPs in the deeper region of lungs. The parameters estimated in this study will facilitate the formulation of proper guidelines for the protection of public health by reducing personal exposure and designing activities to be performed in specific areas; for instance, recommendations can be made to avoid any intense activity in the traffic intersections, and instead conducting activities in an urban background area such as the park site in this study.

Supplementary Materials

The following supporting information can be downloaded at: https://www.mdpi.com/article/10.3390/atmos15010045/s1, Figure S1: Windrose plots were obtained from the London Heathrow airport meteorological station; Figure S2: Estimated average RDD of PM particles (females) for all the sampling sites: (a) indoor (rest); (b) indoor (exercise); (c) traffic (rest); (d) traffic (exercise); (e) park (rest); and (f) park (exercise) for resting and exercise activities for all the three regions of lung morphology; Figure S3: The individual particle mode contribution of respiratory deposition doses for resting and exercise activities; Figure S4: Heat map representation of particle number distribution (#cm−3) in different microenvironments (a) indoor, (b) park, (c) traffic intersection. X-axis shows time in hours and Y-Axis the particle diameter, and shaded colours represent dN/dlog(Dp). Table S1: Aerodynamic diameter intervals in each impactor stage and their respective geometric mean aerodynamic diameters; Table S2: Mean RDD at all three sites for the extra thoracic region (ET), tracheobronchial region (TB), and alveolar region (AL), for both rest and exercise activity for females; Table S3: The mean RDD at all three sites for the extra thoracic region (ET), tracheobronchial region (TB), and alveolar region (AL), for both rest and exercise activity for females; Table S4: Hourly meteorological data obtained from London Heathrow Airport.

Author Contributions

G.K.: Conceptualisation, Data collection, Methodology, Formal Analysis, Visualisation, Writing—Original Draft, Writing—Review and Editing; P.K.: Conceptualisation, Funding Acquisition, Methodology, Formal Analysis, Project Administration, Resources, Supervision, Visualisation, Writing—Original Draft, Writing—Review and Editing; M.T.: Data collection, Investigation, Writing—Original Draft, Writing—Review and Editing; J.C.Z.-R.: Data Curation, Formal Analysis, Writing—Review and Editing; A.E.P.: Investigation, Writing—Original Draft, Writing—Review and Editing; G.Y.: Sample Investigation, Writing—Original Draft, Writing—Review and Editing; M.A.S.: Sample Investigation, Writing—Original Draft, Writing—Review and Editing H.A.-W.: Writing—Review and Editing; C.C.P.: Writing—Review and Editing; I.M.A.: Writing—Review and Editing; S.M.: Writing—Review and Editing; C.D.: Writing—Review and Editing; F.F.: Writing—Review and Editing; R.A.: Writing—Review and Editing; K.F.C.: Writing—Review and Editing. All authors have read and agreed to the published version of the manuscript.

Funding

This work has been supported by the EPSRC-funded project, Health Assessment across Biological Length Scales for Personal Pollution Exposure, and its Mitigation (INHALE; Grant No. EP/T003189/1).

Institutional Review Board Statement

Not applicable.

Informed Consent Statement

Not applicable.

Data Availability Statement

The data presented in this study are available in the article and supplementary materials.

Acknowledgments

The authors thank the INHALE project team from Imperial College London and the University of Edinburgh for valuable discussions, Claire Dilliway for helping with the access from the Data Science Institute, Imperial College, The Invention rooms, Imperial College, and Prince gardens to carry out fieldwork, for storage, personal access, and facilitation. The authors also thank the GCARE team members (Arvind Tiwari, Hama Sarkawt, KV Abhijith, and Mamata Tomson) for their help during the instrument installation and management, and, Michal Klosowski, César Quilodrán, and Marta from Imperial College London for their assisting with field measurements.

Conflicts of Interest

The authors declare no conflicts of interest.

References

  1. Kumar, P.; Morawska, L.; Birmili, W.; Paasonen, P.; Hu, M.; Kulmala, M.; Harrison, R.M.; Norford, L.; Britter, R. Ultra fine particles in cities. Environ. Int. 2014, 66, 1–10. [Google Scholar] [CrossRef] [PubMed]
  2. Li, L.; Hu, J.; Li, J.; Gong, K.; Wang, X.; Ying, Q.; Qin, M.; Liao, H.; Guo, S.; Hu, M.; et al. Modelling air quality during the EXPLORE-YRD campaign—Part II. Regional source apportionment of ozone and PM2.5. Atmos. Environ. 2021, 247, 118063. [Google Scholar] [CrossRef]
  3. Liu, C.; Hu, H.; Zhou, S.; Chen, X.; Hu, Y.; Hu, J. Change of composition, source contribution, and oxidative effects of environmental PM2.5 in the respiratory tract. Environ. Sci. Technol. 2023, 57, 11605–11611. [Google Scholar] [CrossRef] [PubMed]
  4. Liu, C.; Wang, H.; Guo, H. Redistribution of PM2.5 -associated nitrate and ammonium during outdoor-to-indoor transport. Indoor Air 2019, 29, 460–468. [Google Scholar] [CrossRef] [PubMed]
  5. Tiwari, A.; Kumar, P. Quantification of green infrastructure effects on airborne nanoparticles dispersion at an urban scale. Sci. Total Environ. 2022, 838, 155778. [Google Scholar] [CrossRef] [PubMed]
  6. Harrison, R.M.; Beddows, D.C.S.; Alam, M.S.; Singh, A.; Brean, J.; Xu, R.; Kotthaus, S.; Grimmond, S. Interpretation of particle number size distributions measured across an urban area during the FASTER campaign. Atmos. Chem. Phys. 2019, 19, 39–55. [Google Scholar] [CrossRef]
  7. Rivas, I.; Beddows, D.C.S.; Amato, F.; Green, D.C.; Järvi, L.; Hueglin, C.; Reche, C.; Timonen, H.; Fuller, G.W.; Niemi, J.V.; et al. Source apportionment of particle number size distribution in urban background and traffic stations in four European cities. Environ. Int. 2020, 135, 105345. [Google Scholar] [CrossRef]
  8. Kumar, P.; Pirijola, L.; Ketzel, M.; Harrison, R.M. Nanoparticle emissions from 11 non-vehicle exhaust sources—A review. Atmos. Environ. 2013, 67, 252–277. [Google Scholar] [CrossRef]
  9. Kumar, P.; Robins, A.; Vardoulakis, S.; Britter, R. A review of the characteristics of nanoparticles in the urban atmosphere and the prospects for developing regulatory controls. Atmos. Environ. 2010, 44, 5035–5052. [Google Scholar] [CrossRef]
  10. Han, D.; Chen, R.; Kan, H.; Xu, Y. The Bio-distribution, Clearance Pathways, and Toxicity Mechanisms of Ambient Ultrafine Particles. Eco-Environ. Health 2023, 2, 95–106. [Google Scholar] [CrossRef]
  11. Moreno-Ríos, L.A.; Tejeda-Benítez, L.P.; Bustillo-Lecompte, F.C. Sources, characteristics, toxicity, and control of ultrafine particles: An overview. Geosci. Front. 2022, 13, 101147. [Google Scholar] [CrossRef]
  12. Kumar, P.; Zavala-Reyes, J.C.; Kalaiarasan, G.; Abubakar-Waziri, H.; Young, G.; Mudway, I.; Dilliway, C.; Lakhdar, R.; Mumby, S.; Kłosowski, M.M.; et al. Characteristics of fine and ultrafine aerosols in the London underground. Sci. Total Environ. 2023, 858, 159315. [Google Scholar] [CrossRef] [PubMed]
  13. Schiavo, B.; Morton-Bermea, O.; Meza-Figueroa, D.; Acosta-Elías, M.; González-Grijalva, B.; Armienta-Hernández, M.A.; Inguaggiato, C.; Valera-Fernández, D. Characterization and Polydispersity of Volcanic Ash Nanoparticles in Synthetic Lung Fluid. Toxics 2023, 11, 624. [Google Scholar] [CrossRef]
  14. Newby, D.E.; Mannucci, P.M.; Tell, G.S.; Baccarelli, A.A.; Brook, R.D.; Donaldson, K.; Forastiere, F.; Franchini, M.; Franco, O.H.; Graham, I.; et al. Expert position paper on air pollution and cardiovascular disease. Eur. Heart J. 2015, 36, 83–93. [Google Scholar] [CrossRef] [PubMed]
  15. Schwarz, M.; Schneider, A.; Cyrys, J.; Bastian, S.; Breitner, S.; Peters, A. Impact of ultrafine particles and total particle number concentration on five cause-specific hospital admission endpoints in three German cities. Environ. Int. 2023, 178, 108032. [Google Scholar] [CrossRef] [PubMed]
  16. Tomson, M.; Kumar, P.; Kalaiarasan, G.; Zavala-Reyes, J.C.; Chiapasco, M.; Sephton, M.A.; Young, G.; Porter, E.A. Pollutant concentrations and exposure variability in four urban microenvironments of London. Atmos. Environ. 2023, 298, 119624. [Google Scholar] [CrossRef]
  17. Diapouli, E.; Chaloulakou, A.; Spyrellis, N. Levels of ultrafine particles in different microenvironments—Implications to children exposure. Sci. Total Environ. 2007, 388, 128–136. [Google Scholar] [CrossRef]
  18. de Kluizenaar, Y.; Kuijpers, E.; Eekhout, I.; Voogt, M.; Vermeulen, R.C.H.; Hoek, G.; Sterkenburg, R.P.; Pierik, F.H.; Duyzer, J.H.; Meijer, E.W.; et al. Personal exposure to UFP in different micro-environments and time of day. Build. Environ. 2017, 122, 237–246. [Google Scholar] [CrossRef]
  19. Harni, S.D.; Saarikoski, S.; Kuula, J.; Helin, A.; Aurela, M.; Niemi, J.V.; Kousa, A.; Rönkkö, T.; Timonen, H. Effects of emission sources on the particle number size distribution of ambient air in the residential area. Atmos. Environ. 2023, 293, 119419. [Google Scholar] [CrossRef]
  20. Patel, S.; Sankhyan, S.; Boedicker, E.K.; DeCarlo, P.F.; Farmer, D.K.; Goldstein, A.H.; Katz, E.F.; Nazaroff, W.W.; Tian, Y.; Vanhanen, J.; et al. Indoor Particulate Matter during HOMEChem: Concentrations, Size Distributions, and Exposures. Environ. Sci. Technol. 2020, 54, 7107–7116. [Google Scholar] [CrossRef]
  21. Abhijith, V.K.; Kumar, P. Field investigations for evaluating green infrastructure effects on air quality in open-road conditions. Atmos. Environ. 2019, 201, 132–147. [Google Scholar] [CrossRef]
  22. Kero, I.; Naess, K.M.; Tranell, G. Particle size distributions of particulate emissions from the ferroalloy industry evaluated by electrical low pressure impactor (ELPI). J. Occup. Environ. Hyg. 2015, 12, 37–44. [Google Scholar] [CrossRef] [PubMed]
  23. Al-Dabbous, A.N.; Kumar, P. Number and Size Distribution of Airborne Nanoparticles during Summertime in Kuwait: First Observations from the Middle East. Environ. Sci. Technol. 2014, 48, 13634–13643. [Google Scholar] [CrossRef] [PubMed]
  24. Ragettli, M.S.; Corradi, E.; Braun-Fahrländer, C.; Schindler, C.; de Nazelle, A.; Jerrett, M.; Ducret-Stich, E.R.; Künzli, N.; Phuleria, H.C. Commuter exposure to ultrafine particles in different urban locations, transportation modes and routes. Atmos. Environ. 2013, 77, 376–384. [Google Scholar] [CrossRef]
  25. Betha, R.; Selvam, V.; Blake, D.R.; Balasubramanian, R. Emission characteristics of ultrafine particles and volatile organic compounds in a commercial printing center. J. Air Waste Manag. Assoc. 2011, 11, 1093–1101. [Google Scholar] [CrossRef]
  26. Cattaneo, A.; Garramone, G.; Taronna, M.; Peruzzo, C.; Cavallo, M.D. Personal exposure to airborne ultrafine particles in the urban area of Milan. J. Phys. Conf. Ser. 2009, 151, 012039. [Google Scholar] [CrossRef]
  27. Kumar, P.; Fennell, P.; Britter, R. Measurements of particles in the 5–1000 nm range close to road level in an urban street canyon. Sci. Total Environ. 2008, 390, 437–447. [Google Scholar] [CrossRef]
  28. Agus, E.L.; Young, D.T.; Lingard, J.J.N.; Smalley, R.J.; Tate, J.E.; Goodman, P.S.; Tomlin, A.S. Factors influencing particle number concentrations, size distributions and modal parameters at a roof-level and roadside site in Leicester, UK. Sci. Total Environ. 2007, 386, 65–82. [Google Scholar] [CrossRef]
  29. Goel, A.; Kumar, P. A review of fundamental drivers governing the emissions, dispersion, and exposure to vehicle-emitted nanoparticles at signalised traffic intersections. Atmos. Environ. 2014, 97, 316–331. [Google Scholar] [CrossRef]
  30. Tsang, H.; Kwok, R.; Miguel, A.H. Pedestrian Exposure to Ultrafine Particles in Hong Kong Under Heavy Traffic Conditions. Aerosol Air Qual. Res. 2008, 8, 19–27. [Google Scholar] [CrossRef]
  31. Argyropoulos, G.; Samara, C.; Voutsa, D.; Kouras, A.; Manoli, E.; Voliotis, A.; Tsakis, A.; Chasapidis, L.; Konstandopoulos, A.; Eleftheriadis, K. Concentration levels and source apportionment of ultrafine particles in road microenvironments. Atmos. Environ. 2016, 129, 68–78. [Google Scholar] [CrossRef]
  32. Koivisto, A.J.; Hussein, T.; Niemelä, R.; Tuomi, T.; Hämeri, K. Impact of particle emissions of new laser printers on modeled office room. Atmos. Environ. 2010, 44, 2140–2146. [Google Scholar] [CrossRef]
  33. Shrestha, P.M.; Humphrey, J.L.; Carlton, E.J.; Adgate, J.L.; Barton, K.E.; Root, E.D.; Miller, L.S. Impact of Outdoor Air Pollution on Indoor Air Quality in Low-Income Homes during Wildfire Seasons. Int. J. Environ. Res. Public Health 2019, 16, 3535. [Google Scholar] [CrossRef] [PubMed]
  34. Setyawati, M.I.; Singh, D.; Krishnan, S.P.R.; Huang, H.; Wang, M.; Shenglan, J.; Bernice Huan Rong, G.; Chin Guan, H.; Ridhwan, Y.; Mustafa, H.K.; et al. Occupational Inhalation Exposures to Nanoparticles at Six Singapore Printing Centers. Environ. Sci. Technol. 2020, 54, 2389–2400. [Google Scholar] [CrossRef] [PubMed]
  35. Martin, J.; Demokritou, P.; Woskie, S.; Bello, D. Indoor Air Quality in Photocopy Centers, Nanoparticle Exposures at Photocopy Workstations, and the Need for Exposure Controls. Ann. Work. Expo. Health 2017, 61, 110–122. [Google Scholar] [PubMed]
  36. Morawska, L.; He, C.; Johnson, G.; Jayaratne, R.; Salthammer, T.; Wang, H.; Uhde, E.; Bostrom, T.; Modini, R.; Ayoko, G.; et al. An Investigation into the Characteristics and Formation Mechanisms of Particles Originating from the Operation of Laser Printers. Environ. Sci. Technol. 2009, 43, 1015–1022. [Google Scholar] [CrossRef] [PubMed]
  37. Kumar, P.; Hama, S.; Alaa Abbass, R.; Nogueira, T.; Brand, V.S.; Wu, H.W.; Abulude, F.O.; Adelodun, A.A.; Anand, P.; Fatima Andrade, M.; et al. In-kitchen aerosol exposure in twelve cities across the globe. Environ. Int. 2022, 162, 107155. [Google Scholar] [CrossRef]
  38. Brines, M.; Dall’Osto, M.; Beddows, D.C.S.; Harrison, R.M.; Gómez-Moreno, F.; Núñez, L.; Artíñano, B.; Costabile, F.; Gobbi, G.P.; Salimi, F.; et al. Traffic and nucleation events as main sources of ultrafine particles in high-insolation developed world cities. Atmos. Chem. Phys. 2015, 15, 5929–5945. [Google Scholar] [CrossRef]
  39. Vratolis, S.; Fini, M.I.; Bezantakos, S.; Stavroulas, I.; Kalivitis, N.; Kostenidou, E.; Louvaris, E.; Siakavaras, D.; Biskos, G.; Mihalopoulos, N.; et al. Particle number size distribution statistics at City-Centre Urban Background, urban background, and remote stations in Greece during summer. Atmos. Environ. 2019, 213, 711–726. [Google Scholar] [CrossRef]
  40. Goel, A.; Kumar, P. Vertical and horizontal variability in airborne nanoparticles and their exposure around signalised traffic intersections. Environ. Pollut. 2016, 214, 54–69. [Google Scholar] [CrossRef]
  41. Asmi, A.; Wiedensohler, A.; Laj, P.; Fjaeraa, A.M.; Sellegri, K.; Birmili, W.; Weingartner, E.; Baltensperger, U.; Zdimal, V.; Zikova, N.; et al. Number size distributions and seasonality of submicron particles in Europe 2008–2009. Atmos. Chem. Phys. 2011, 11, 5505–5538. [Google Scholar] [CrossRef]
  42. R Core Team. R: A Language and Environment for Statistical Computing. Available from R Foundation for Statistical Computing, Vienna, Austria. 2020. Available online: https://www.R-project.org/ (accessed on 26 November 2020).
  43. Carslaw, D.C.; Ropkins, K. Openair—An R package for air quality data analysis. Environ. Model. Softw. 2012, 27, 52–61. [Google Scholar] [CrossRef]
  44. Voliotis, A.; Karali, I.; Kouras, A.; Samara, C. Fine and ultrafine particle doses in the respiratory tract from digital printing operations. Environ. Sci. Pollut. Res. 2017, 24, 3027–3037. [Google Scholar] [CrossRef] [PubMed]
  45. Joodatnia, P.; Kumar, P.; Robins, A. The behaviour of traffic produced nanoparticles in a car cabin and resulting exposure rates. Atmos. Environ. 2013, 65, 40–51. [Google Scholar] [CrossRef]
  46. Hinds, W.C. Aerosol Technology: Properties, Behaviour and Measurement of Airborne Particles; John Wiley & Sons: Chichester, UK, 1999. [Google Scholar]
  47. Chalupa, D.C.; Morrow, P.E.; Oberdörster, G.; Utell, M.J.; Frampton, M.W. Ultrafine particle deposition in subjects with asthma. Environ. Health Perspect. 2004, 112, 879–882. [Google Scholar] [CrossRef] [PubMed]
  48. Goel, A.; Kumar, P. Characterisation of nanoparticle emissions and exposure at traffic intersections through fast-response mobile and sequential measurements. Atmos. Environ. 2015, 107, 374–390. [Google Scholar] [CrossRef]
  49. Morawska, L.; Ristovski, Z.; Jayaratne, E.R.; Keogh, D.U.; Ling, X. Ambient nano, and ultrafine particles from motor vehicle emissions: Characteristics, ambient processing, and implications on human exposure. Atmos. Environ. 2008, 42, 8113–8138. [Google Scholar] [CrossRef]
  50. Vu, T.V.; Delgado-Saborit, J.M.; Harrison, R.M. Review: Particle number size distributions from seven major sources and implications for source apportionment studies. Atmos. Environ. 2015, 122, 114–132. [Google Scholar] [CrossRef]
  51. Chatain, M.; Alvarez, R.; Ustache, A.; Rivière, E.; Favez, O.; Pallares, C. Simultaneous Roadside and Urban Background Measurements of Submicron Aerosol Number Concentration and Size Distribution (in the Range 20–800 nm), along with Chemical Composition in Strasbourg, France. Atmosphere 2021, 12, 71. [Google Scholar] [CrossRef]
  52. Kuuluvainen, H.; Rönkkö, T.; Järvinen, A.; Saari, S.; Karjalainen, P.; Lähde, T.; Pirjola, L.; Niemi, J.V.; Hillamo, R.; Keskinen, J. Lung deposited surface area size distributions of particulate matter in different urban areas. Atmos. Environ. 2016, 136, 105–113. [Google Scholar] [CrossRef]
  53. Kumar, P.; Goel, A. Concentration dynamics of coarse and fine particulate matter at and around signalised traffic intersections. Environ. Sci. Process. Impacts 2016, 18, 1220. [Google Scholar] [CrossRef] [PubMed]
  54. Holmes, N.S.; Morawska, L.; Mengersen, K.; Jayaratne, E.R. Spatial distribution of sub micrometre particles and CO in an urban microscale environment. Atmos. Environ. 2005, 39, 3977–3988. [Google Scholar] [CrossRef]
  55. Isaxon, C.; Gudmundsson, A.; Nordin, E.Z.; Lönnblad, L.; Dahl, A.; Wieslander, G.; Bohgard, M.; Wierzbicka, A. Contribution of indoor-generated particles to residential exposure. Atmos. Environ. 2015, 106, 458–466. [Google Scholar] [CrossRef]
  56. Abt, E.; Suh, H.H.; Allen, G.; Koutrakis, P. Characterization of Indoor Particle Sources: A Study Conducted in the Metropolitan Boston Area. Environ. Health Perspect. 2000, 108, 35–44. [Google Scholar] [CrossRef] [PubMed]
  57. di Bucchianico, A.M.; Cusano, M.; Gaddi, R.; Gaeta, A.; Leone, G.; Boccuni, F.; Ferrante, R.; Pelliccioni, A.; Cattani, G. Indoor and Outdoor Particle Number Concentration in the Sapienza University Campus of Rome. Sustainability 2021, 13, 9126. [Google Scholar] [CrossRef]
  58. Qian, J.; Ferro, A.R. Resuspension of dust particles in a chamber and associated environmental factors. Aerosol Sci. Technol. 2008, 42, 566–578. [Google Scholar] [CrossRef]
  59. Quang, T.N.; He, C.; Morawska, L.; Knibbs, L.D. Influence of ventilation and filtration on indoor particle concentrations in urban office buildings. Atmos. Environ. 2013, 79, 41–52. [Google Scholar] [CrossRef]
  60. Guo, S.; Hu, M.; Peng, J.; Wu, Z.; Zamora, M.L.; Shang, D.; Du, Z.; Zheng, J.; Fang, X.; Tang, R.; et al. Remarkable nucleation and growth of ultrafine particles from vehicular exhaust. Proc. Natl. Acad. Sci. USA 2020, 117, 3427–3432. [Google Scholar] [CrossRef]
  61. Mc Garry, P.; Morawska, L.; He, C.; Jayaratne, R.; Falk, M.; Tran, Q.; Wang, H. Exposure to particles from laser printers operating within office workplaces. Environ. Sci. Technol. 2011, 45, 6444–6452. [Google Scholar] [CrossRef]
  62. Schneider, I.L.; Teixeira, E.C.; Silva, L.F.O.; Wiegand, F. Atmospheric particle number concentration and size distribution in a traffic–impacted area. Atmos Pollut. Res. 2015, 6, 877–885. [Google Scholar] [CrossRef]
  63. Santos-Juusela, V.D.; Petäjä, T.; Kousa, A.; Hämeri, K. Spatial-temporal variations of particle number concentrations between a busy street and the urban background. Atmos. Environ. 2013, 79, 324–333. [Google Scholar] [CrossRef]
  64. Price, H.D.; Arthur, R.; BéruBé, K.A.; Jones, T.P. Linking particle number concentration (PNC), meteorology and traffic variables in a UK street canyon. Atmos. Res. 2014, 147–148, 133–144. [Google Scholar] [CrossRef]
  65. Resongles, E.; Dietze, V.; Green, D.C.; Harrison, R.M.; Ochoa-Gonzalez, R.; Tremper, A.H.; Weiss, D.J. Strong evidence for the continued contribution of lead deposited during the 20th century to the atmospheric environment in London of today. Proc. Natl. Acad. Sci. USA 2021, 118, e2102791118. [Google Scholar] [CrossRef] [PubMed]
  66. Widory, D.; Roy, S.; Le Moullec, Y.; Goupil, G.; Cocherie, A.; Guerrot, C. The origin of atmospheric particles in Paris: A view through carbon and lead isotopes. Atmos. Environ. 2003, 38, 953–961. [Google Scholar] [CrossRef]
  67. Rönkkö, T.; Kuuluvainen, H.; Karjalainen, P.; Keskinen, J.; Hillamo, R.; Niemi, J.V.; Pirjola, L.; Timonen, H.J.; Saarikoski, S.; Saukko, E.; et al. Traffic is a major source of atmospheric nanocluster aerosol. Proc. Natl. Acad. Sci. USA 2017, 114, 7549–7554. [Google Scholar] [CrossRef] [PubMed]
  68. Sturm, R. Local lung deposition of ultrafine particles in healthy adults: Experimental results and theoretical predictions. Ann. Transl Med. 2016, 4, 420. [Google Scholar] [CrossRef] [PubMed]
  69. Brown, J.S. Deposition of Particles. In Comparative Biology of the Normal Lung, 2nd ed.; Elsevier Inc.: Amsterdam, The Netherlands, 2015; pp. 513–536. [Google Scholar]
  70. Löndahl, J.; Möller, W.; Pagels, J.H.; Kreyling, W.G.; Swietlicki, E.; Schmid, O. Measurement techniques for respiratory tract deposition of airborne nanoparticles: A critical review. J. Aerosol Med. Pulm. Drug Deliv. 2014, 27, 229–254. [Google Scholar] [CrossRef]
  71. Darquenne, C. Deposition Mechanisms. J. Aerosol Med. Pulm. Drug Deliv. 2020, 33, 181–185. [Google Scholar] [CrossRef]
  72. Wallace, L. Indoor sources of ultrafine and accumulation mode particles: Size distributions, size-resolved concentrations, and source strengths. Aerosol Sci. Technol. 2006, 40, 348–360. [Google Scholar] [CrossRef]
Figure 1. (a) Map showing the location of all the measurement sites (red points) with pictures showing the sampling sites of the (b) traffic intersection, (c) indoor, (d) park, (e) vehicular fleet data of the traffic intersection sites during the daytime throughout the sampling duration.
Atmosphere 15 00045 g001
Figure 2. Average particle number size distributions (lines) and particle mass distributions (shaded regions) in different MEs: (a) IN, (b) PK, (c) TI, and (d) all three MEs. The pie chart shows the percentage contribution of particles in each mode in different MEs: the green-coloured part is N6–30; the red-coloured part is N30–300; and the maroon-coloured part is N300–10000—which is negligible for the coarse particles.
Atmosphere 15 00045 g002
Figure 3. Average number and mass distributions at morning peaks: (a) diurnal variation of PNC showing the selected hours for minimum (green dot) and maximum (red dot) peaks in each microenvironment; (b,c) particle number size distributions (lines) and particle mass distributions (shaded regions) for minimum and maximum peaks, respectively.
Atmosphere 15 00045 g003
Figure 4. Average diurnal profiles of PNCs were continuously measured in (a) IN, (b) PK, (c) TI, and (d) all three microenvironments.
Atmosphere 15 00045 g004
Figure 5. Polar plot for the three different particle modes: (a) nucleation mode, (b) accumulation mode, and (c) coarse mode of TI site. Similarly, (d) nucleation mode, (e) accumulation mode, and (f) coarse mode of PK site. The centre of each plot represents a wind speed of zero, which increases radially outward. The colour scale indicates the concentrations.
Atmosphere 15 00045 g005
Figure 6. STEM-EDX maps showing representative ultrafine particles from each site collected on two filter size fractions, CP08 (38–60 nm) and CP02 (16–30 nm), for the IN (a,c), PK (f,i), and TI (l,p) and the corresponding point EDX spectrum shown for particles in the IN (b,d,e), PK (f,i), and TI (mo,q).
Atmosphere 15 00045 g006
Figure 7. Estimated average RDD of PM particles for all the sampling sites: (a) indoor (rest); (b) indoor (exercise); (c) traffic (rest); (d) traffic (exercise); (e) park (rest); and (f) park (exercise) for resting and exercise activities for all the three regions of lung morphology.
Atmosphere 15 00045 g007
Table 1. Summary of relevant research studies on particle number distributions and concentrations in traffic on roadsides, indoors, and in rural background MEs.
EnvironmentInstrument
(Size Range)
DescriptionReference
Residential areaScanning mobility particle sizer (SMPS)
(16–698 nm)
Long-range transport (LRT) events possess the highest particle size, followed by secondary biogenic (BIO), wood-burning (WB), and traffic (TRA) events with geometric mean diameters of 72, 62, 57, and 41 nm, respectively.
The contribution of WB was found to be dominant followed by TRA, BIO, or LRT aerosols.
[19]
IndoorScanning mobility particle sizers (SMPS)
(4–532 nm)
PM size distributions were measured for particles in the size range of 0.001–20 μm.
PNCs were higher during propane-fuelled cooking exhibiting particles in the sub 10 nm diameter.
[20]
Roadside with green infrastructures (GIs)P-Trak 8525
(20–1000 nm)
The PNCs were reduced by up to 30% within the mixed configuration of trees and hedges. [21]
Transport, indoor and outdoorDiSCmini
(10–300 nm)
The mean PNCs were highest in environments with motorised transport followed by indoor environments and walking outdoors.
The peak contribution occurred 88% indoors (mainly at home) and 12% outdoors.
[18]
Indoor (metallurgical production site vicinity)ELPI+
(0.007–10 μm)
Most of the particles are smaller than 1c and approximately 5 wt% are so-called ultrafine aerosols.
The average aerodynamic diameters for the FeS and the SiMn fume particles were 0.17 and 0.10 μm, respectively.
[22]
Roadside with GIsDMS50
(5–2500 nm)
The PNDs displayed dominant peaks at 5.6 and 10 nm and a varying peak in the 55–75 nm range.
The PNCs were reduced by about 37% in the presence of GIs.
[23]
Different transport modes DiSCmini
(10–300 nm)
Average trip UFP concentrations were higher in cars (31,784 particles cm−3) and on bicycles (22,660 particles cm−3) compared to walking (19,481 particles cm−3) and public transportation (14,055–18,818 particles cm−3).[24]
IndoorFMPS
(5.6–560 nm)
The characteristics of UFPs emitted from printers depend on indoor ventilation conditions.
The number of concentrations of UFPs was increased due to reduced ventilation rates of indoor air.
[25]
Different transport modes
(bus, car, and walking)
Condensation particle counters (CPCs)
(10–1000 nm)
The highest measured mean concentrations were during walking and moving in motorised vehicles (bus and car).
The lowest exposures were in green areas and office microenvironments.
[26]
RoadsideDMS 500
(5–1000 nm)
The PNCs were measured on roadsides at three different heights (i.e., 0.20 m, 1.0 m, and 2.60 m).
The real-time particle number distributions (PNDs) in the 5–1000 nm range were found to be similar at each sampling height, showing a consistent and discernible decrease with the sampling height.
[27]
RoadsideDMS500
(5–1000 nm)
Aitken-mode particle concentrations decayed exponentially with increasing wind speed at roadside locations.
The nucleation-mode particle concentrations at roadsides show a decaying relationship due to the dispersive effects of wind speed and distance from the local emission source.
[28]
Indoor Condensation particle counters (CPCs)
(10–1000 nm)
The highest mean indoor concentrations were in a small carpet-covered library and a teachers’ office in the school.
Children attending primary school in the Athens area are exposed to significant levels of UFPs.
[17]
Table 2. Details of the field campaign in different microenvironments for PM concentrations using ELPI+.
Environment (Code)Sampling Site (Lat, log)Campaign Duration
Indoor (IN)DSI, William Penney Laboratory, Imperial College, South Kensington (51.498928, −0.177117).14 January 2020–31 January 2020
Traffic intersections (TI)The Invention Rooms, Imperial College, White City (51.512833, −0.225196).03 February 2020–21 February 2020
Park/urban background (PK)Princes Gardens, Imperial College, Knightsbridge (51.500512, −0.172176).24 February 2020–19 March 2020
Table 3. Statistical summary of PNCs in different microenvironments.
Particle Size RangeIN (#cm−3)TI (#cm−3)PK (#cm−3)
Mean ± SDMedianMaxMinMean ± SDMedianMaxMinMean ± SDMedianMaxMin
N6–30 nm5682 ± 3902445116,325164431,521 ± 95,275207338,841925052933 ± 370525712,3255
N30–300 nm2694 ± 18061887743810433468 ± 2490283298571246867 ± 109217338282
N(300–10,000 nm)63 ± 5549203345 ± 30351201717 ± 3221220.1
Disclaimer/Publisher’s Note: The statements, opinions and data contained in all publications are solely those of the individual author(s) and contributor(s) and not of MDPI and/or the editor(s). MDPI and/or the editor(s) disclaim responsibility for any injury to people or property resulting from any ideas, methods, instructions or products referred to in the content.

