Article

Comparative Analysis of Airborne Bacterial and Fungal Communities in South-Eastern Italy and in Albania Using the Compositional Analysis of 16S and ITS rRNA Gene Sequencing Datasets

1
CEDAD-Centre of Applied Physics, Dating and Diagnostics, Department of Mathematics and Physics “Ennio de Giorgi”, University of Salento, Via per Arnesano, 73100 Lecce, Italy
2
National Institute of Nuclear Physics (INFN), Section of Lecce, Via Monteroni, 73100 Lecce, Italy
3
Department of Computer Science, Faculty of Computer Science and IT, Metropolitan Tirana University, Rruga Sotir Kolea, 1001 Tirana, Albania
4
Department of Geography, Faculty of History and Philology, University of Tirana, Rruga e Elbasanit, 1001 Tirana, Albania
5
Department of Biological and Environmental Sciences and Technologies, University of Salento, Via Monteroni, 73100 Lecce, Italy
*
Author to whom correspondence should be addressed.
Atmosphere 2024, 15(10), 1155; https://doi.org/10.3390/atmos15101155
Submission received: 5 August 2024 / Revised: 13 September 2024 / Accepted: 25 September 2024 / Published: 26 September 2024
(This article belongs to the Section Biosphere/Hydrosphere/Land–Atmosphere Interactions)

Abstract

:
This study investigates airborne bacterial and fungal communities in south-eastern Italy and Albania using advanced DNA-based techniques and compositional data analysis (CoDa). We assess the significance of airborne microbial communities, detailing our methodologies for site selection, sample collection, DNA extraction, and data analysis. Our results reveal distinct differences in microbial composition between the two regions, driven by local environmental factors. Specifically, Albanian samples showed higher abundances of bacterial species such as Rubellimicrobium roseum and Sphingomonas cynarae, while Italian samples were characterized by a prevalence of Truepera radiovictrix and Rubrobacter radiotolerans. In terms of fungi, Albanian sites exhibited greater abundance of Mycosphaerella tassiana, Aureobasidium pullulans, and Ascochyta herbicola. Aitchison distance-based dendrograms and principal component analysis (PCA) biplots, utilizing singular value decomposition, clearly delineated a geographical separation of microbial communities, underscoring the impact of regional atmospheric conditions on microbial composition. In the discussion, we interpret these findings in the context of regional environmental factors, highlighting their implications for understanding regional differences in airborne microbial communities. The conclusion emphasizes the effectiveness of advanced DNA techniques and CoDa in environmental microbiology, offering insights into how local environmental conditions shape microbial communities and suggesting directions for future research and public health considerations.

Graphical Abstract

1. Introduction

Airborne particles of biological origin, commonly referred to as bioaerosols, constitute a diverse array of living and deceased microorganisms, comprising bacteria, fungi, viruses, spores, microbial fragments, and pollen [1,2,3]. This ubiquitous component of the atmosphere plays a fundamental role in global transport and dispersion processes across the planet [4,5]. Especially, bacteria and fungi, with their small size range (generally 1–5 μm), exhibit a prolonged atmospheric residence time, capable of traversing extensive distances, sometimes spanning thousands of kilometers [6,7]. Several existing studies underscore the dominance of bacteria and fungi among airborne microorganisms detected in particulate matter samples, whether suspended individually or adhering to other particles such as soil, often forming aggregates [8,9,10,11,12]. This prevalence and speciation of airborne bacteria and fungi carry substantial significance, extending beyond their ecological roles to potential impacts on human health, agricultural practices, ecosystem well-being, biogeochemical cycles, and broader atmospheric processes [3,13,14,15,16,17]. The composition of airborne microbial communities is closely linked to various environmental factors, such as temperature, humidity, land use, and levels of air pollution, all of which influence the abundance and diversity of these microorganisms. For instance, high pollution levels, particularly in urban areas, have been shown to increase the concentration of particulate matter (PM), which can act as carriers for microorganisms, facilitating their dispersal over long distances. Similarly, environmental conditions such as humidity and temperature can either promote microbial growth or suppress it, thus altering community composition. Bioaerosols’ composition is also influenced by seasonal variations, land cover (e.g., urban, agricultural, forested areas), and anthropogenic activities such as industrial emissions, which introduce distinct microbial populations into the atmosphere.
In recent studies, advanced DNA-based techniques have significantly enhanced the accuracy of analyzing the structure of particulate matter (PM)-associated airborne microbial communities at various taxonomic levels [2,18,19,20,21]. Note that different sizes of PM can affect the transportation and deposition of microorganisms in the atmosphere. Particulate matter is typically classified into different size fractions, such as PM10, PM2.5, PM1, and ultrafine particles. Studies suggest that smaller PM fractions, particularly those in the range of PM2.5, are more effective in transporting bacteria and fungi over long distances, primarily because smaller particles can remain airborne for longer periods and travel further before settling out of the atmosphere [22,23]. Despite their importance, these DNA-based methods pose challenges, especially when dealing with large microbiome datasets from high-throughput sequencing (HTS) experiments. The selection of appropriate numerical tools to summarize and explore HTS data is a key concern within the scientific community (e.g., [24]). This is attributed to the compositional nature of such datasets, leading to issues with standard techniques in analyzing them (e.g., [25]). By addressing this, the innovative compositional data analysis (CoDa) approach developed by Gloor et al. [26] proves valuable. The approach involves a centered log-ratio (CLR) transformation, the Aitchison distance for clustering and ordination, and a compositional principal component analysis (PCA) biplot via singular value decomposition (SVD). Therefore, by applying these techniques, this study employs the CoDa approach to investigate both 16S and ITS rRNA gene sequencing outputs at the species level, taking advantage of its benefits demonstrated in the analysis of HTS data. Note that the same methodology has been recently used to investigate the 16S rRNA gene sequencing outputs from 18 aerosol samples collected at the Mathematics and Physics Department of the University of Salento in Lecce, Italy, in different indoor and outdoor environments [27].
The current study represents the first attempt to compare the main characteristics of airborne microbiome in south-eastern Italy and in Albania using the results from the metagenomics analyses. In particular, the study area of south-eastern Italy was widely investigated during the last years in relation to both its aerosol (e.g., [28,29,30]) and bioaerosol characteristics (e.g., [27,31,32,33]). On the contrary, a limited number of studies were conducted in Albania about aerosol measurements and properties (e.g., [34,35,36,37,38]). In more detail, Mico et al. [34], Liti et al. [35], and Hysenaj and Duraj [36] examined the time evolution of particulate matter mass concentration in the Albanian cities of Vlora, Durres, and Tirana, respectively. Additionally, the work by Hajderi and Bozo [37] deals with environmental pollution in urban intersections, focusing on vehicle emissions in Tirana. The authors analyzed the health impacts of key pollutants like PM10 and PM2.5 concentration using different indicators, revealing alarming premature deaths in Albania in 2020 and providing some strategies for reducing air pollution. Finally, Kaçorri et al. [38] investigated residents’ perceptions of air pollution in Tirana, using survey data and statistical methods. They identified significant factors influencing the health effects of air pollution in different areas of the city. Regarding the biogenic components of atmospheric aerosol in Albania, a limited number of studies have been published, to the best of our knowledge. Troja et al. [39] described an experimental study based on several years of airborne microorganism monitoring in both outdoor and indoor environments in Tirana to create a microbiological air pollution database and identify specific microbial pollutants. This study was also able to reveal a significant reduction in outdoor microbial loads, with fluctuations observed indoors, and to identify prominent environmental fungi and bacterial pollutants, showcasing the dynamic changes in microbial concentrations over time. Additionally, Qarri et al. [40] and Lazo et al. [41] used moss as a biomonitor for metal deposition in Albania, revealing anthropogenic influences on toxic metals and providing insights into pollutant origins in Albania. Considering the current evaluation of air quality in Albania, our study provides valuable insights into the comparison of two distinct monitoring areas in the Mediterranean region, each influenced by different sources of air pollution. Specifically, our work demonstrates the applicability of compositional data analysis (CoDa) methods for comparing bioaerosols, while also using advanced DNA-based techniques to reveal significant differences in airborne bacterial and fungal communities between south-eastern Italy and Albania. This highlights how local environmental and atmospheric factors influence the abundance and diversity of airborne microorganisms in these regions. Understanding these relationships is crucial for developing strategies to manage air quality and mitigate potential health risks associated with bioaerosols.

2. Materials and Methods

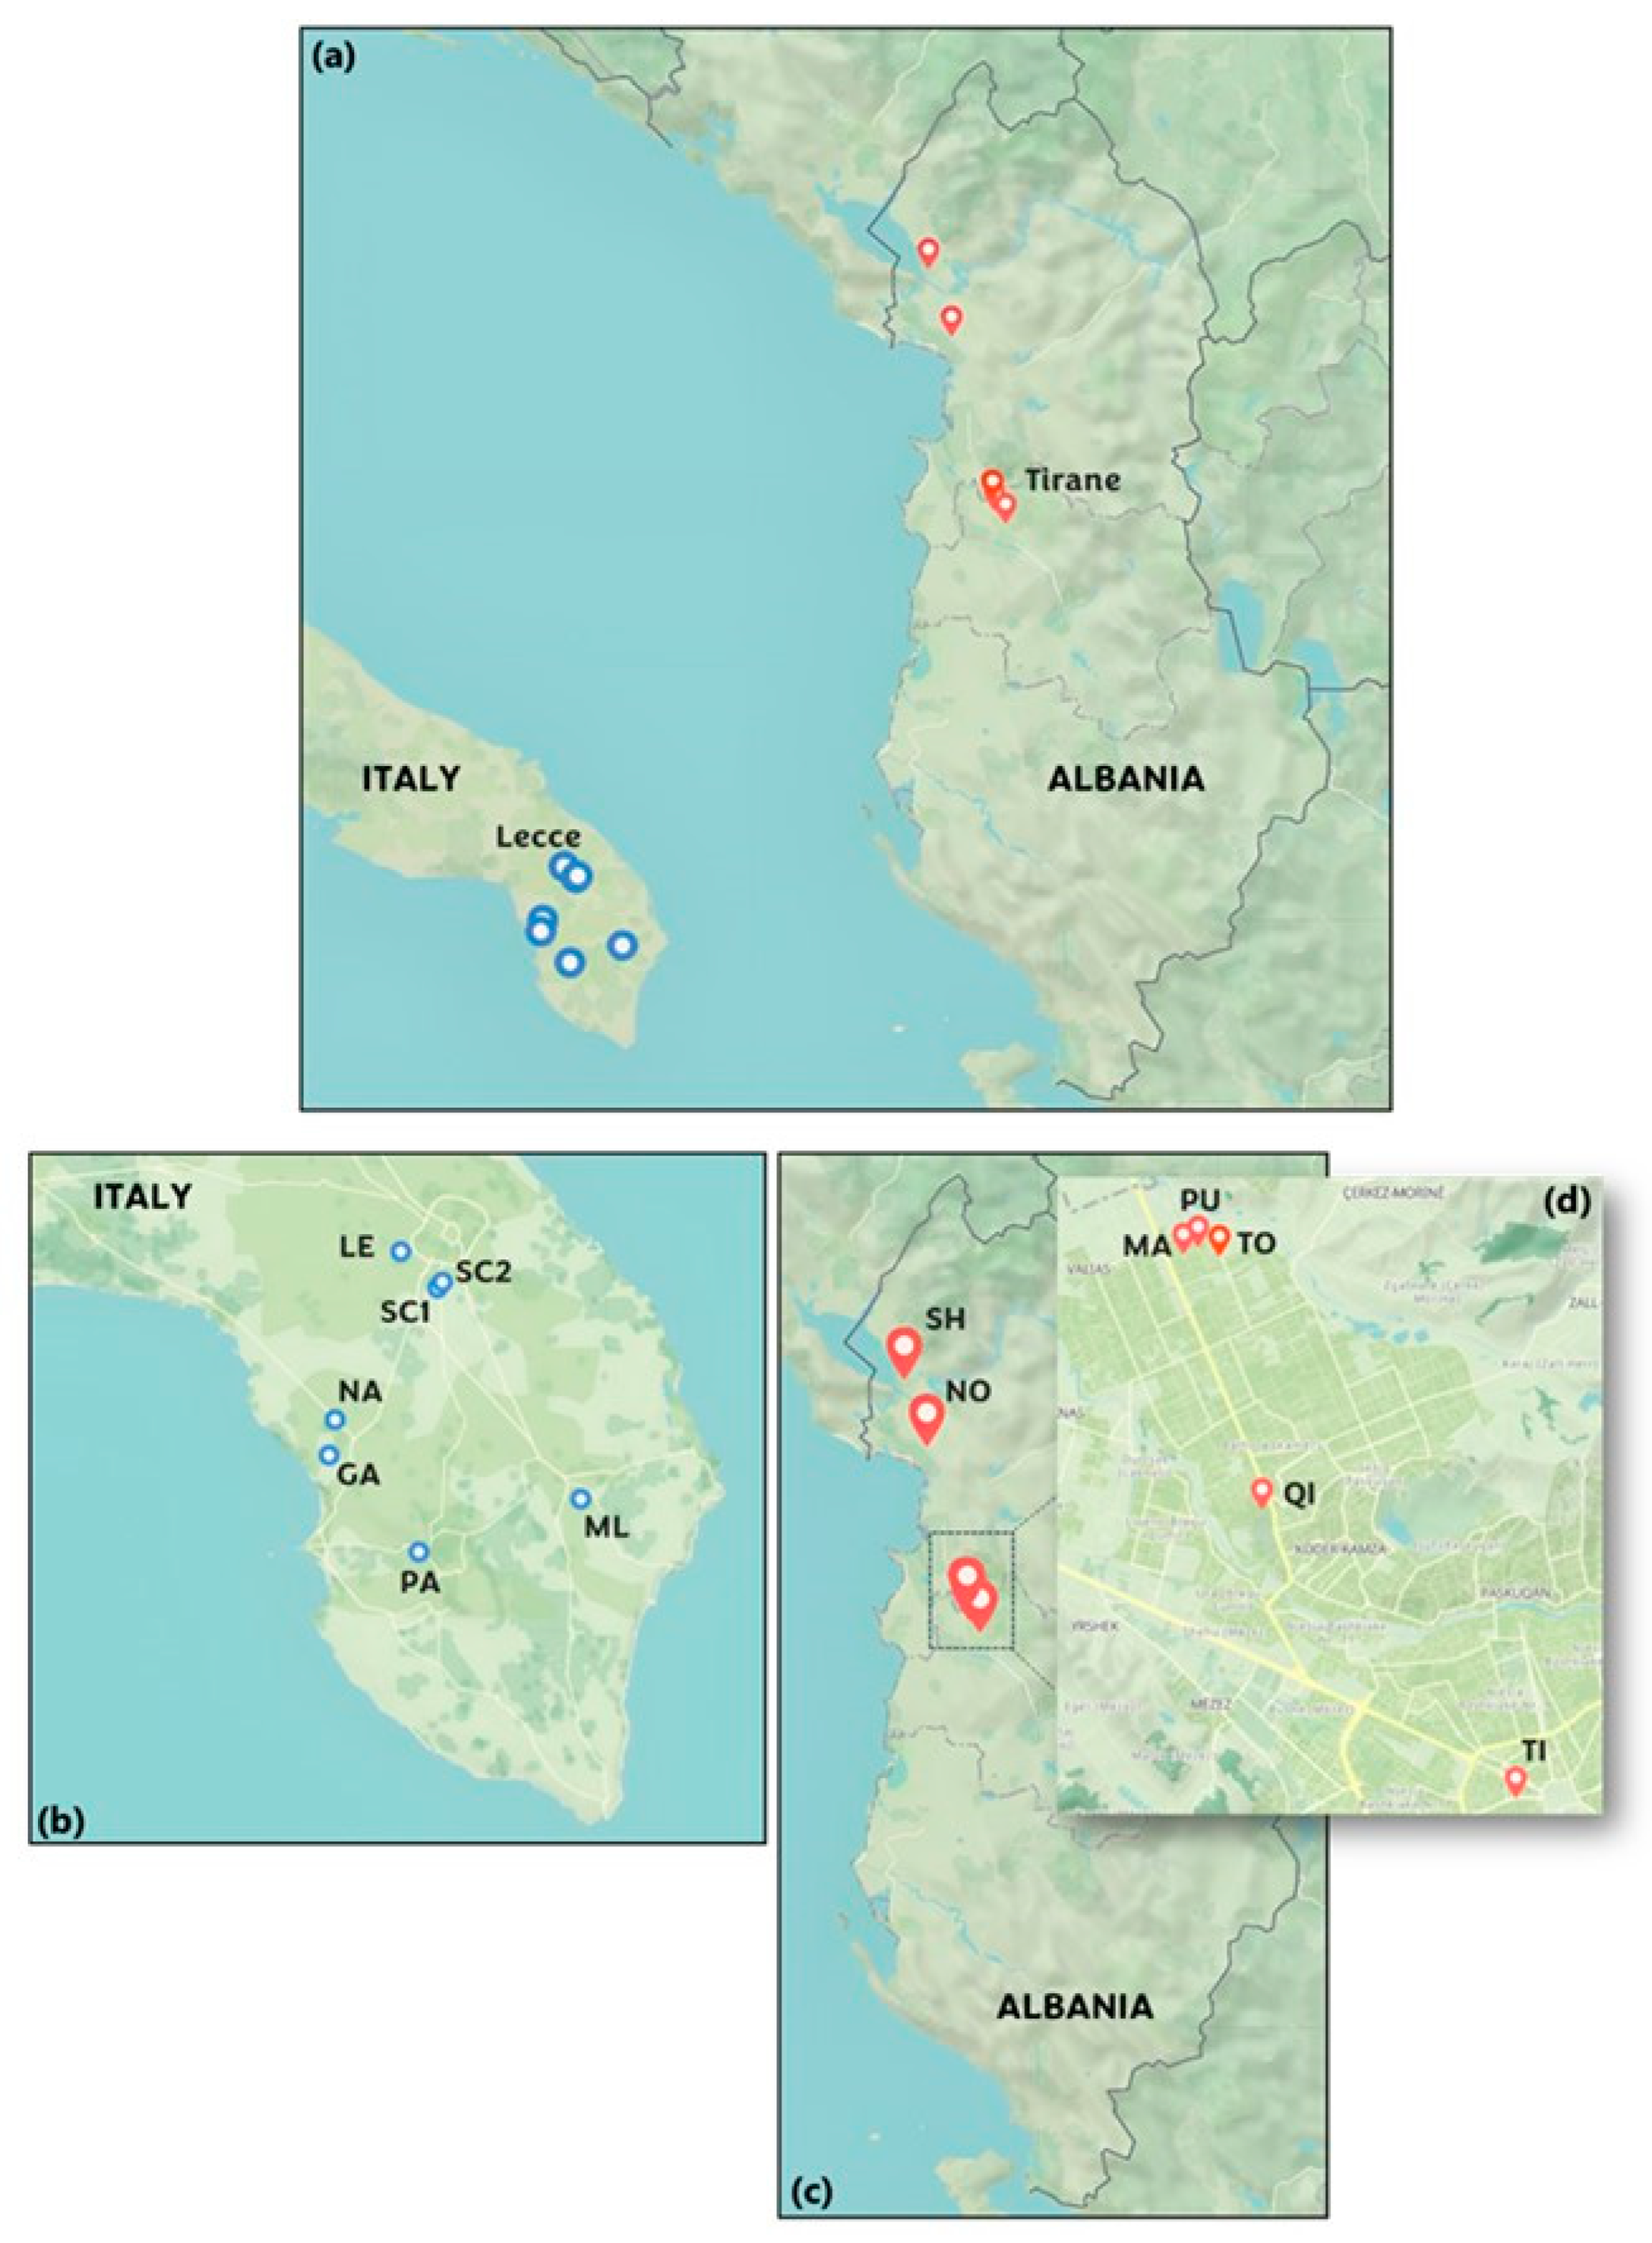
2.1. Description of the Sites Selected for the Monitoring Campaign

This investigation includes a monitoring campaign conducted at seven distinct sites in the Salento Peninsula, Italy, and seven sites in Albania, as shown in Figure 1. The selection of these sites was based on their diverse geographical and environmental characteristics, providing a broad representation of atmospheric conditions in the study areas.
The selected monitoring area in Salento, a slender and flat peninsula in southeastern Italy, is situated approximately 40 and 70 km away from major industrial zones of the Apulia region at Brindisi and Taranto, respectively. Moreover, it is within 100 km of the Balkan and Greek coasts and approximately 700 km from the North African coast (Figure 1). This location’s central position in the Mediterranean basin makes it ideal for studying aerosol properties due to the mix of pollutants from various sources, including urban and industrial zones in Northern and Eastern Europe, sea salt from the Mediterranean and Atlantic Ocean, Sahara Desert dust, and biomass burning from forest fires. Local sources like vehicular traffic and domestic heating also contribute to the aerosol composition (e.g., [42]). Comprehensive insights into the mean aerosol optical and physical properties, as well as meteorological conditions in the study area, are available in previous works (e.g., [43,44]). To achieve a comprehensive understanding, seven monitoring sites were chosen in Salento based on their distinct characteristics:
-
Two urban sites: one at the Department of Mathematics and Physics of the University of Salento in Lecce (~95,000 inhabitants, denoted as LE) and another in the city center of Nardò (~31,500 inhabitants, denoted as NA). Both are significantly influenced by vehicular traffic.
-
Three small-town sites: in the Lecce province, these included Parabita (~9000 inhabitants, PA), San Cesario di Lecce (~8000 inhabitants, SC1), and Muro Leccese (~5000 inhabitants, ML). These sites were selected for their varied, yet relatively lower, levels of pollution.
-
Two rural sites: in the Lecce province, located in San Cesario di Lecce (~8000 inhabitants, SC2) and Galatone (~15,500 inhabitants, GA). These sites were chosen to explore the biogenic component of atmospheric aerosols, given their minimal vehicular traffic and limited sources of pollution.
In addition, observe that these last five sites, characterized by minimal vehicular traffic and limited potential sources of particulate pollution, were selected due to their potential relevance in investigating the biogenic component of atmospheric aerosols, particularly bacterial and fungal communities.
In Albania, the monitoring sites were mostly located in the capital city, Tirana (~925,000 inhabitants), which covers about 31 km2 and is situated approximately 25 km from the Adriatic Sea. To the east are the foothills of Dajti Mountain (height ~1612 m), and to the west, the city is surrounded by modest hills (heights ~400 m). The northern area allows maritime air to reach the city, particularly in sea breeze conditions. The climatic regime prevailing in the area is Mediterranean, with typical dry and warm summers. More detailed information can be found in Banja et al. [45] and Kopali et al. [46]. In selecting the Albanian sites, we aimed to capture a broad spectrum of urban, suburban, and rural atmospheric conditions:
-
Two urban sites: located in the city center of Tirana, the first one in the Rruga Myslym Shyri Tiranë area (denoted as TI), and the second one in the area of the University College Qiriazi (denoted as QI).
-
Three suburban sites: located in the suburban area of Tirana, in the zone of Kamëz, and identified as MA (Marashi), PU (Pusi), and TO (Tokat).
-
Two rural sites: in northern Albania, at Shkodër (~135,000 inhabitants, denoted as SH), located between Lake Shkodër and the Albanian Alps, and in the Lezhë Municipality (~65,000 inhabitants, denoted as NO), spanning from the Plain of Zadrima to the Adriatic Sea. Shkodër and Lezhë represent rural conditions with minimal anthropogenic impact. More information on the climate characteristics of Northern Albania can be found in Dervishi et al. [47].
These sites were specifically chosen to represent the diverse atmospheric conditions across Albania, including urban pollution sources, suburban influences, and rural environments with minimal anthropogenic impact. Finally, it is worth observing that air quality in Albania varies greatly depending on location: in rural and mountainous areas, the air is generally clean, while in cities, air quality is far poorer. The main sources of air pollution are oil extraction, mobile sources, domestic heating, as well as the production of cement, while the main source of urban air pollution is transport (e.g., [40,48]).

2.2. Description of the Monitoring Campaign and the Methodology Used for Aerosol Detection

All the airborne aerosol samples analyzed in this study were collected by gravimetric deposition, and each of them was used for a sampling interval of 14 days (from 29 October to 12 November 2022, simultaneously, at all selected monitoring sites). The two weeks of sampling were characterized by weather conditions on average for the period considered, as reported in Table S1. Observe that the meteorological parameters measured at the selected monitoring areas showed a similar trend during the studied period. More specifically, the air temperature and atmospheric pressure did not show any significant differences among the selected areas, while the wind speed measured at the Salento Peninsula presented several values significantly higher than those reported for the two investigated Albanian areas. Finally, note also that the precipitation levels at the study areas were quite similar, considering that we reported only one day in this 14-day period with a large amount of rain (5 November 2022). Regarding the monitoring activities during the sampling interval of 14 days, we used sterile 52 mm diameter dry electret filters manufactured by InnovaPrep LLC (Drexel, MO, USA) as the collection medium [49]. We selected this type of filter because it exhibits high collection efficiency for bioaerosol particles such as viruses, pollen, bacteria, mold, and fungal spores (e.g., [50]). The electret filters were positioned approximately 50 cm above the ground, following the suggestions of King et al. [51]. This placement minimizes potential contamination effects from the ground. After the sampling period, the filter-holder system is removed and attached to a sample cup with an elution adapter. To extract the particles, a Wet Foam Elution™ canister releases foam through the filter, efficiently extracting captured particles. This process takes about 5 s and produces 6 to 7 mL of liquid sample, which then collapses back into a liquid phase for analysis [52,53]. Some of the authors of this paper successfully utilized the electret filters for bioaerosol collection, reporting significant results in certain hospital departments [52,53] and university locations [27]. Additional results from bioaerosol samplings based on electret filters were reported in Jaing et al. [54] and in Ginn et al. [55,56]. More details on the electret filters’ characteristics and the methodology used to extract the captured airborne particles into a liquid sample for subsequent analyses can be found in Perrone et al. [52,53].

2.3. Methodology for DNA Extraction and 16S/ITS rRNA Gene Metabarcoding

Liquid samples collected from electret filters were stored at −30 °C and processed for DNA extraction using the DNeasy PowerWater kit (Qiagen, Hamburg, Germany), following the manufacturer’s instructions. Extracted DNA was stored at −30 °C until further analysis. High-throughput sequencing and initial bioinformatics analyses were conducted by Genomix4life S.R.L. (Baronissi, Salerno, Italy). DNA quality and quantity were assessed with a NanoDropOne spectrophotometer (Thermo Scientific, Waltham MA, USA) and Qubit Fluorometer 4.0 (Invitrogen, Carlsbad CA, USA). PCR amplification targeted the V3–V4 regions of the 16S rRNA gene using primers 50-CCTACGGGNGGCWGCAG-30 (forward) and 50-GACTACHVGGGTATCTAATCC-30 (reverse) [57], and the ITS1-5.8S-ITS2 region of the fungal rRNA gene using primers ITS1 5′-TCCGTAGGTGAACCTGCGG-3′ (forward) and ITS4 5′-TCCTCCGCTTATTGATATGC-3′ (reverse) [58]. Dual-indexed libraries were prepared using Nextera XT (Illumina, San Diego CA, USA) and sequenced on an Illumina MiSeq platform (2 × 300 bp). Bioinformatic processing began with quality filtering of raw reads, removing adapters and low-quality sequences, and trimming to a minimum of 50 bp using Trimmomatic v0.36 [59]. Reads were analyzed with GAIA 2.0 (Sequentia Biotech, Barcelona, Spain), aligned to custom databases from the NCBI nr nucleotide database, and classified into taxonomic levels using the Lowest Common Ancestor algorithm [60]. Operational taxonomic units (OTUs) were defined at various taxonomic ranks based on minimum identity thresholds, as outlined in Paytuví et al. [60] and Pollegioni et al. [61]. In more detail, with respect to 16S-rRNA-gene high-throughput sequencing, a total amount of 1,413,552 reads (11,351–176,742 per sample) was assigned to 3040 bacterial species OTUs at the threshold of 97% sequence similarity. In the case of ITS gene sequencing, 1,553,938 reads (14,763–202,464 per sample) were overall retrieved and assigned to 2135 fungal species OTUs at the same threshold of sequence similarity.

2.4. Description of the Methodology for Compositional Data Analysis

Data analysis in this study adhered to the compositional data (CoDa) workflow outlined by Gloor et al. [26]. Bacterial and fungal species selection, based on read abundance, followed criteria used in prior research on airborne microbiomes in hospital [52] and university environments [27]. The CoDa approach began with a centered log-ratio (CLR) transformation [62], which was preceded by a zero-count replacement using the method described by Martín-Fernandez et al. [63]. Heatmaps of the CLR-transformed data, post zero-count replacement, were generated using the R package heatmap function. Subsequently, the Aitchison distance matrix—computed as Euclidean distance post-CLR transformation—was used to construct unweighted pair-group average dendrograms. Finally, principal component analysis (PCA) was performed on the CLR-transformed dataset through singular value decomposition (SVD), utilizing the prcomp function in R for exploratory analysis. This PCA allowed for the investigation of relationships between bacterial/fungal species and samples. For additional details on these statistical procedures and their application, refer to Bian et al. [64], Perrone et al. [52], and Fragola et al. [27].

3. Results

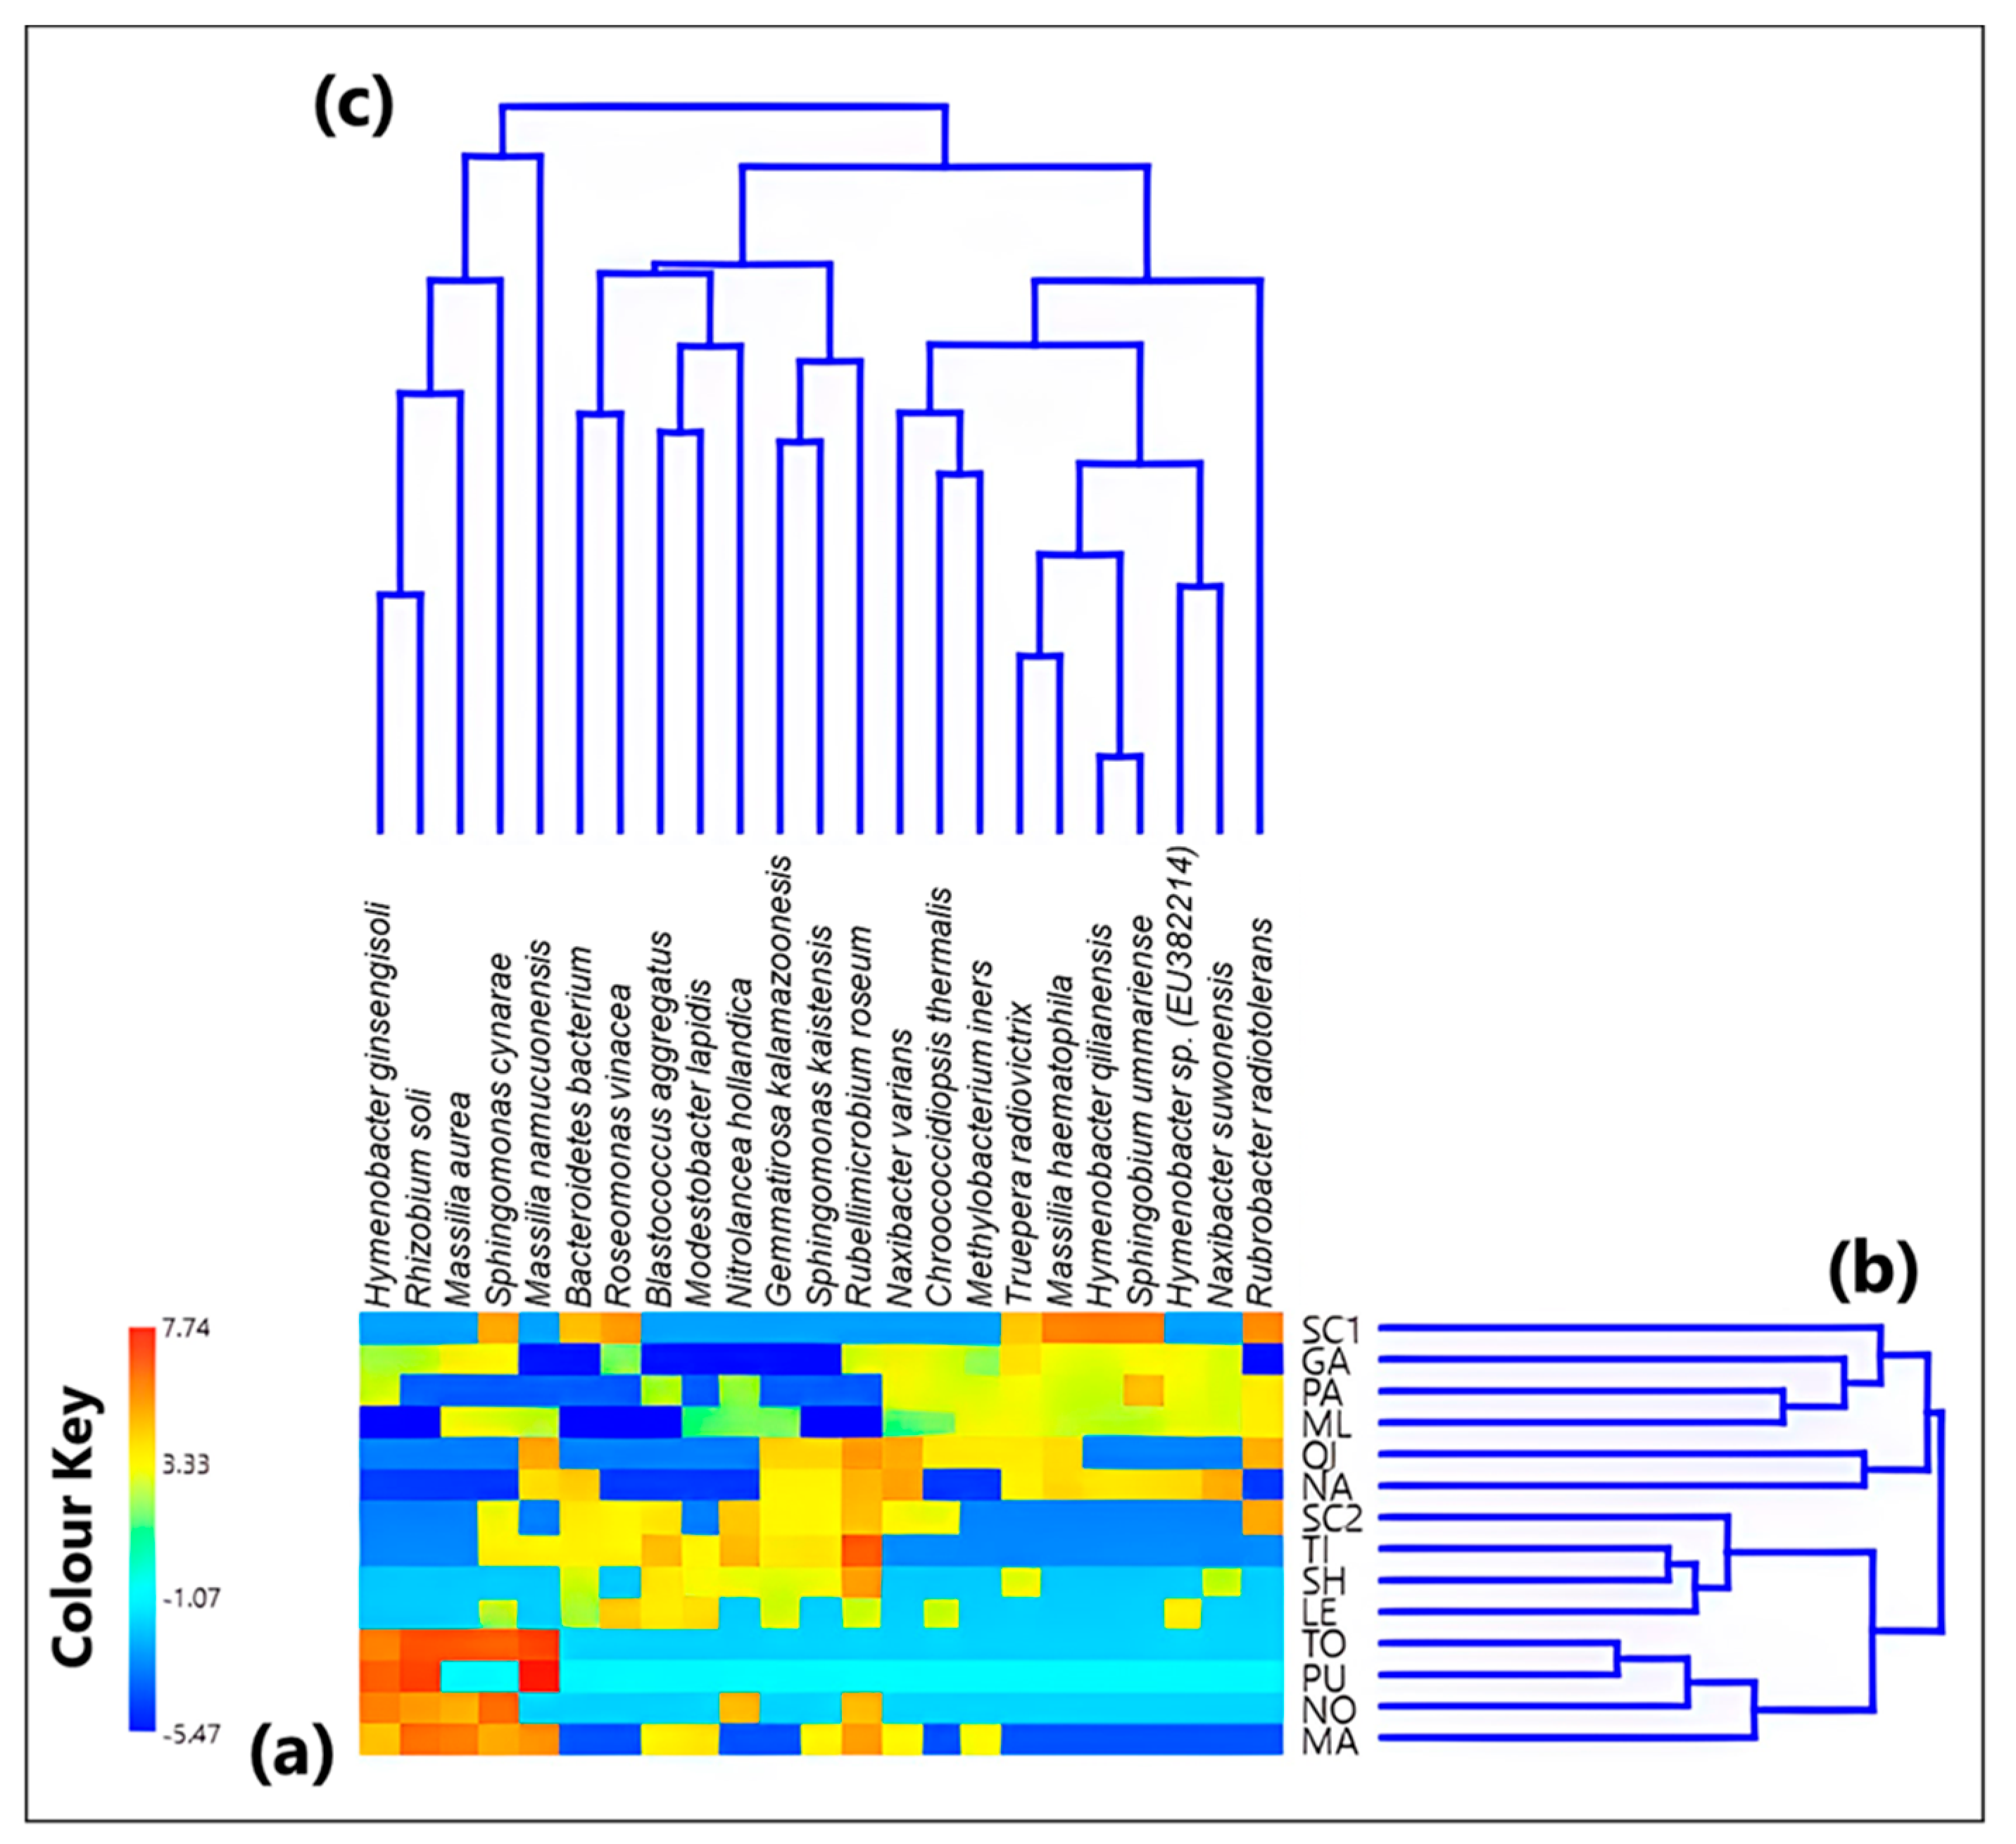
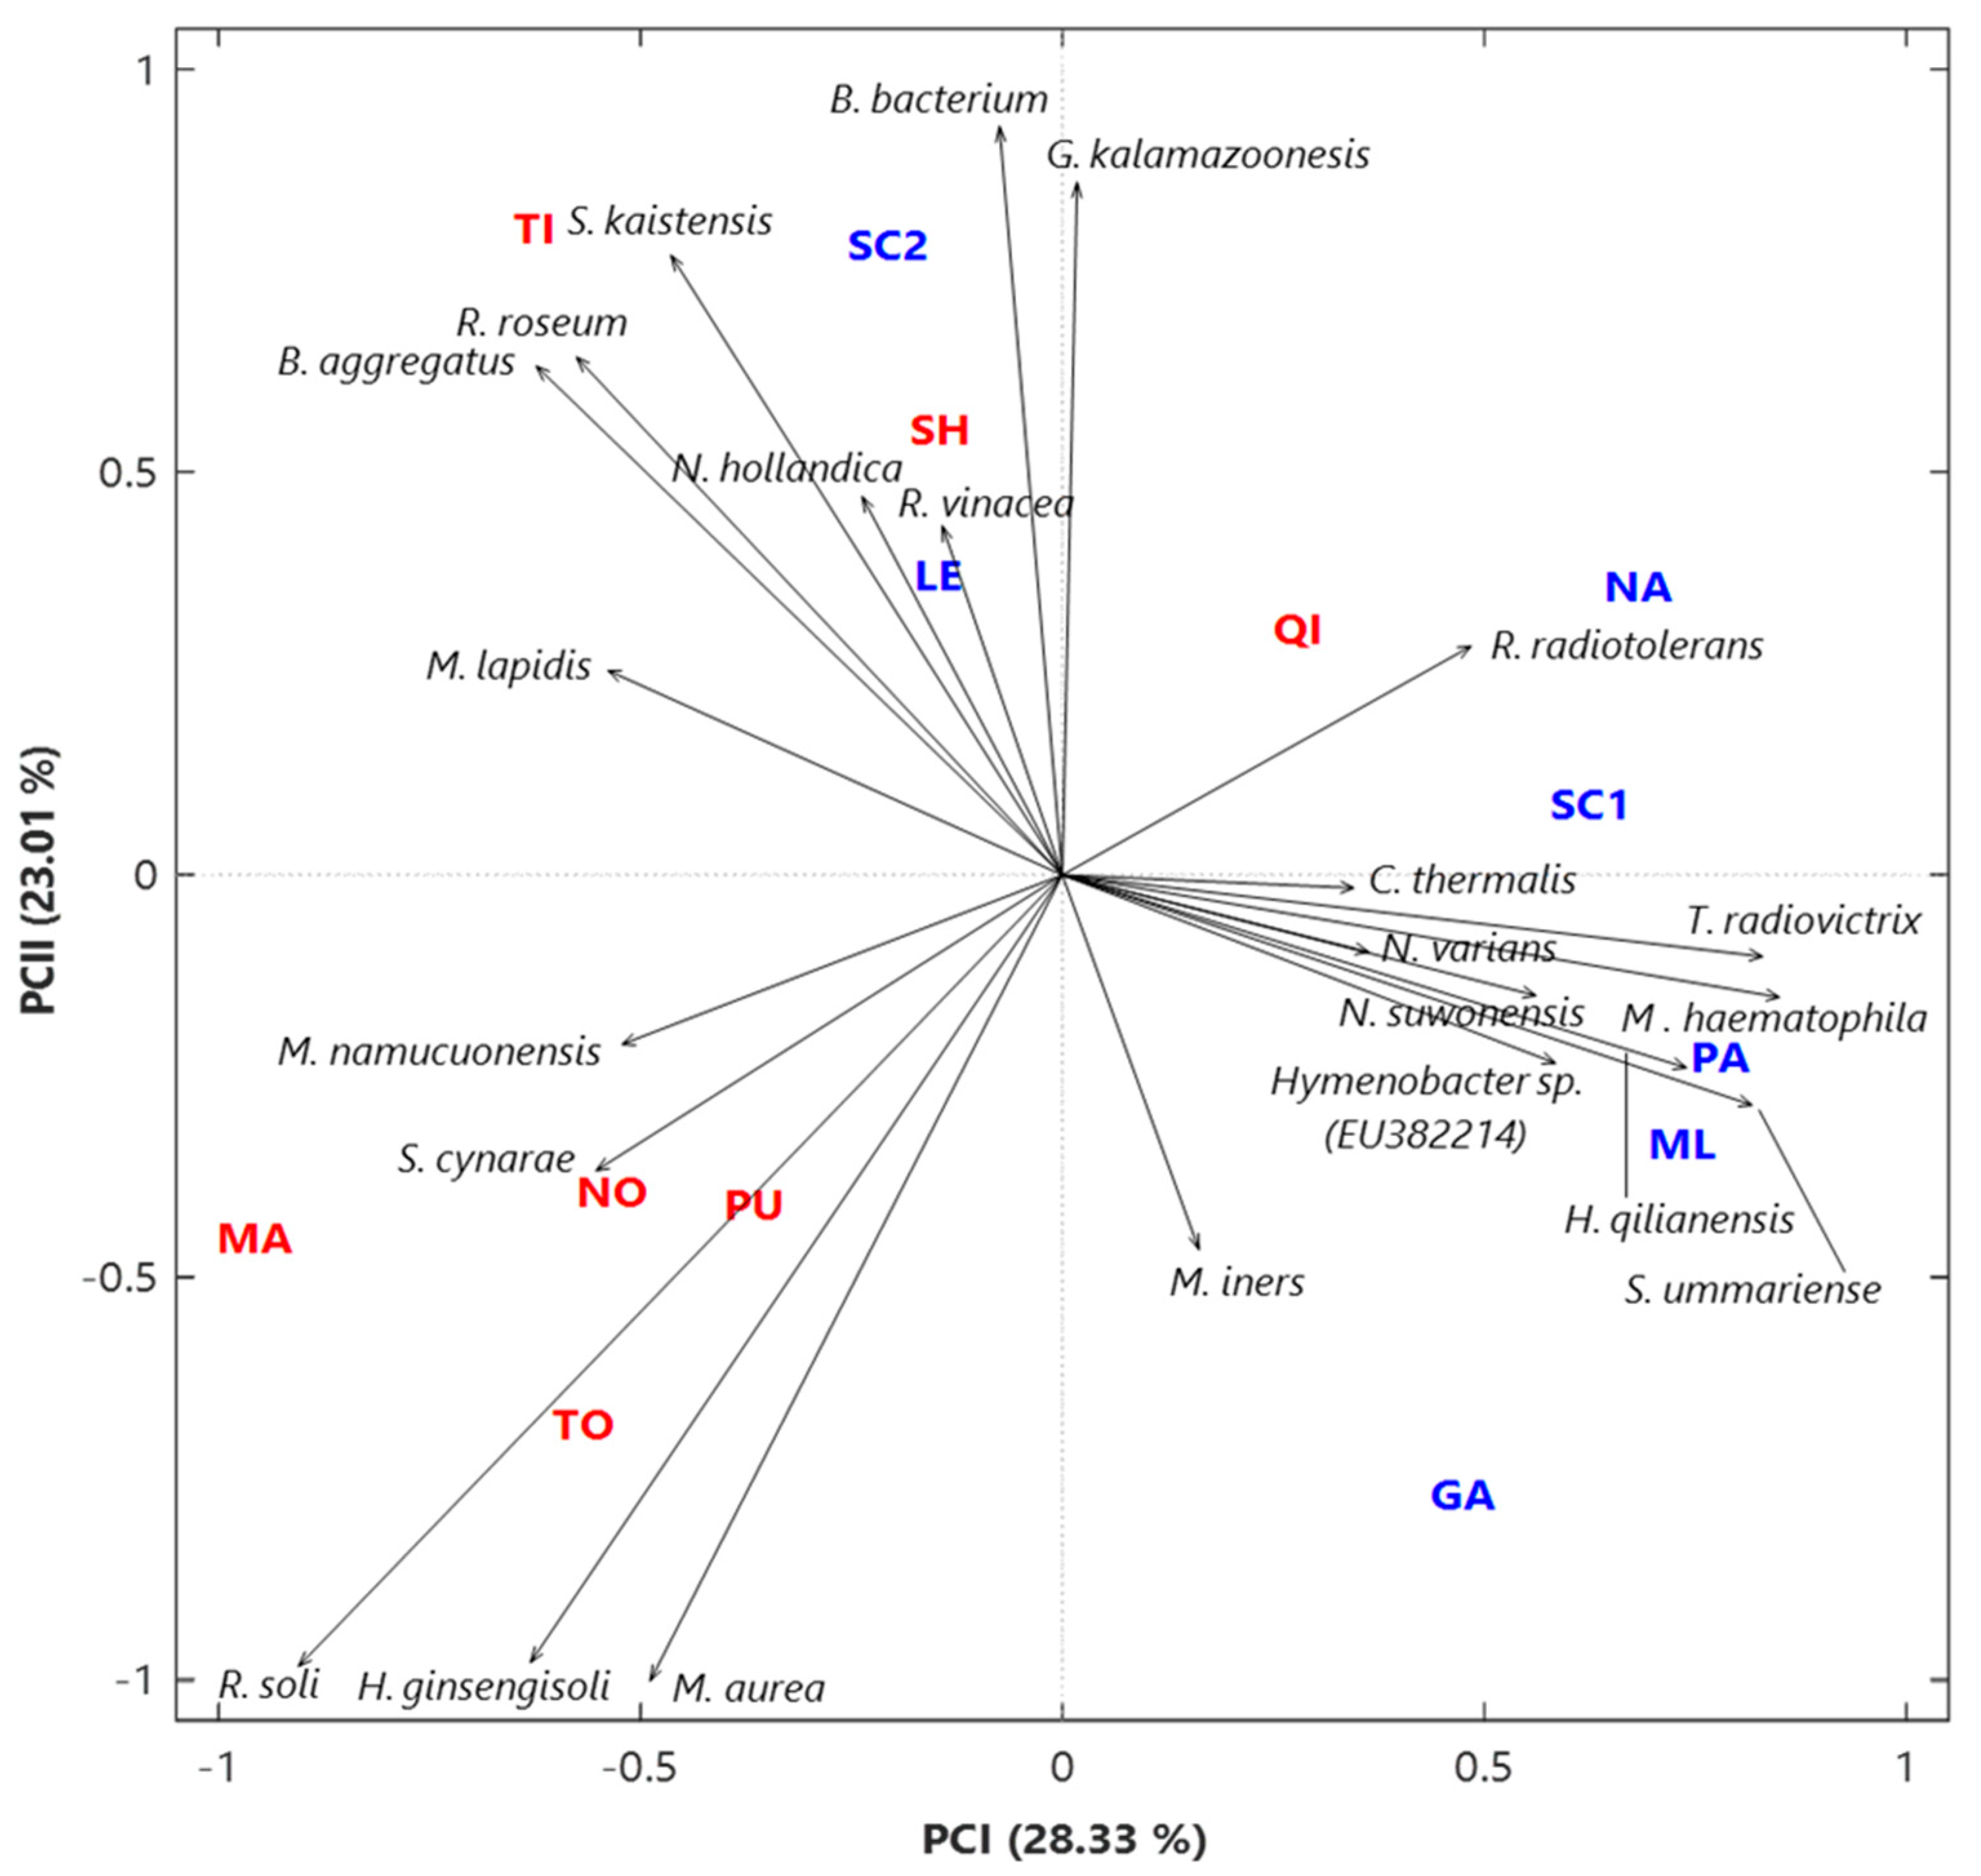
3.1. Analysis of the Bacterial Communities at the Species Level

The analyses presented in this section are based on a heatmap (Figure 2a) constructed from centered log-ratio (CLR) values derived from the initial read dataset (Table S2), focusing on the 23 bacterial species with the highest abundances. The Aitchison distances (Table S3) were employed to generate two dendrograms (Figure 2b,c), which elucidate the relationships both among samples and among bacterial species. Figure 2a includes a color plot that depicts the variability in CLR values for each species across different samples, highlighting the impact of sampling location on the taxonomic composition. Notably, Rubellimicrobium roseum and Sphingomonas cynarae achieved the highest CLR values, particularly prominent in Albanian sites, with elevated abundances observed exclusively in Nardò (NA) and San Cesario (SC2) among the Italian monitoring sites (Table S2). Furthermore, Figure 2b identifies two primary sample clusters, predominantly representing the Albanian and Italian clusters, respectively. Exceptions, such as the Albanian urban site QI resembling the Italian cluster and the two Italian LE and SC2 sites exhibiting features analogous to the Albanian cluster, highlight the differentiation facilitated by the dendrogram based on bacterial species abundances. This analysis effectively delineates the distinct characteristics of Italian and Albanian bacterial species communities based on geographical locations.
In Figure 3, we present a detailed two-dimensional principal component analysis (PCA) biplot generated through the application of singular value decomposition (SVD) to the centered log-ratio (CLR) values extracted from the initial dataset, specifically focusing on the 23 bacterial species with the highest abundances. This biplot serves as a comprehensive illustration, visually mapping the complex relationships between individual samples (score plot) and the selected bacterial species (loading plot). The score plot distinguishes samples based on their geographical origin, with distinct colors representing different sampling locations—red for Albania and blue for Italy. Furthermore, the loading plot, featuring black arrows, reveals the magnitude and direction of each species’ contribution to the overall variance, as described in Bian et al. [64] and in Fragola et al. [27]. The percentages of total variance explained by the first two principal components are 28.33% and 23.01%, respectively, reflecting the effectiveness of the applied procedure. Our exploratory analysis utilizes CLR-based bacterial species data through singular value decomposition followed by principal component analysis (SVD-PCA). This approach facilitates the identification of relationships among samples and bacterial species. The SVD-PCA results, depicted in Figure 3, are closely related to the bacterial species demonstrating the highest variation within the dataset. The loading plot illustrates the standard deviation of CLR values for each species and highlights compositional associations. This method is particularly useful when the number of species exceeds the number of samples, as in our dataset comprising 23 species and 14 samples.
Examining the score plot in Figure 3 reveals intriguing spatial relationships among samples. Most Italian samples, alongside the QI Albanian site, align on the right side of the first PCA axis. In contrast, the remaining Albanian samples predominantly occupy the left side of the axis, associating solely with LE and SC2 Italian samples. In addition, it is worth observing that the Italian samples GA and SC2 collected in two different rural sites are positioned in a separate area of the SVD-PCA plot with respect to the other Italian samples collected in urban/suburban zones. Regarding the Albanian samples, we can observe a different location of the monitoring sites, with a differentiation of the urban sites TI and QI with respect to the remaining suburban/rural sites. An exception is observed in the rural site SH, which exhibits characteristics similar to those of the urban sites. The loading plot, annotated with arrows, delineates the principal features of the bacterial species distribution across the different sample groups. Notably, species with the highest abundances, such as Rubellimicrobium roseum and Sphingomonas cynarae, are predominantly associated with samples from Albania. Detailed analysis, as shown in Figure 2c, indicates a strong intra-cluster correlation among these species. Additionally, the radiation-resistant species Truepera radiovictrix and Rubrobacter radiotolerans show a significant association with the Italian sample cluster, as highlighted in Figure 3.

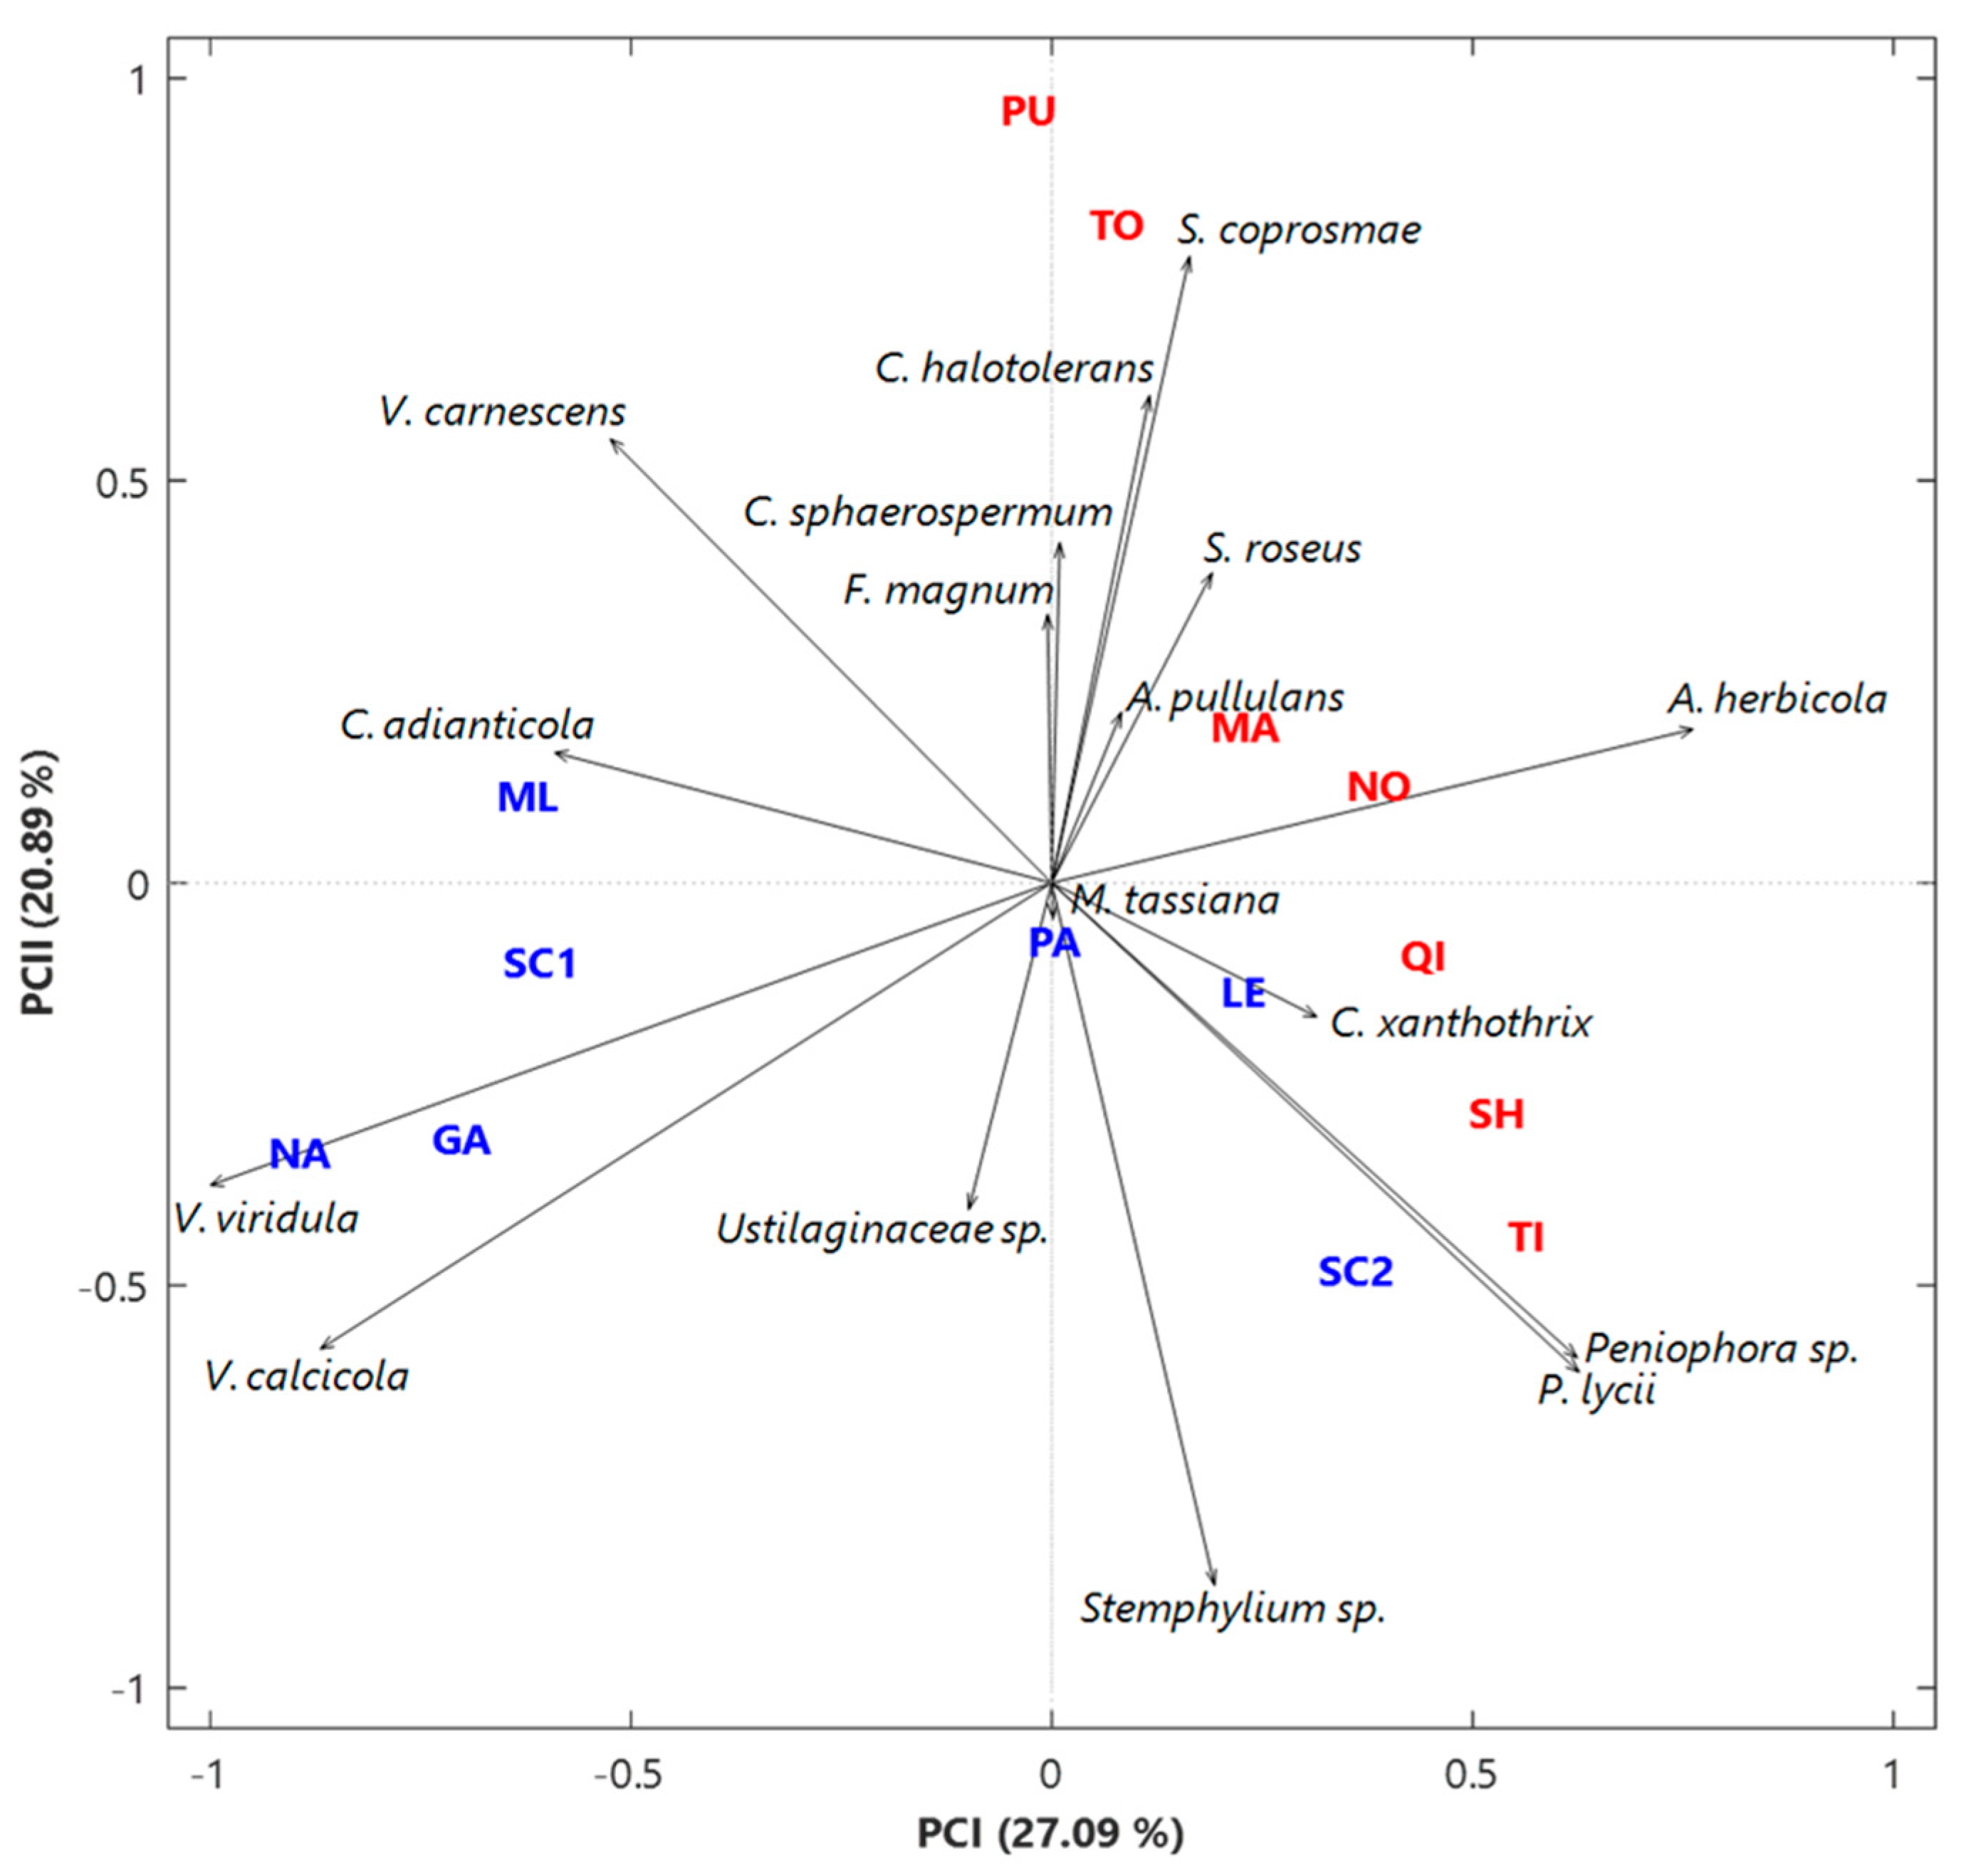
3.2. Analysis of the Fungal Communities at the Species Level

This section presents an analysis of a heatmap (Figure 4a) constructed from centered log-ratio (CLR) values derived from the initial read dataset (Table S4). The focus is specifically on the 17 fungal species with the highest abundances. To further explore the data, Aitchison distance dendrograms (Figure 4b,c) are used to elucidate relationships among samples and among fungal species, respectively. The Aitchison distance values are detailed in Table S5. The color plot in Figure 4a illustrates the variability in CLR values for each fungal species across samples, emphasizing the influence of sampling location on the taxonomic composition, similarly to the color plot shown in Figure 2a (Section 3.1). Among the 17 fungal species with the largest abundances, Mycosphaerella tassiana, Aureobasidium pullulans, and Ascochyta herbicola on average exhibit the highest CLR values, notably prevalent in Albanian sites (Table S4). Among the seven selected Italian sites, Mycosphaerella tassiana presented high CLR values in all the monitored locations, while Aureobasidium pullulans and Ascochyta herbicola were observed with elevated abundances exclusively in Parabita (PA) and in San Cesario (SC1 and SC2). Note that A. herbicola was identified as a potential human pathogen in previous studies (e.g., [65]). Furthermore, Figure 4b identifies two principal sample clusters, predominantly representing the Albanian and Italian clusters, respectively. In detail, we found only one single anomaly in the Italian SC2 site that exhibited features analogous to the Albanian cluster. Therefore, this last result underscores the differentiation facilitated by the dendrogram based on the fungal species abundances. In addition, this analysis effectively delineates the distinct characteristics of Italian and Albanian fungal species communities based on geographical locations, as also observed for the bacterial communities in Section 3.1.
Figure 5 shows a two-dimensional PCA biplot generated through SVD analysis applied to CLR values extracted from the initial dataset of the 17 fungal species with the highest abundances. The score plot separates the investigated samples based on their geographical origin, with distinct colors representing different sampling locations (red for Albania and blue for Italy). The first two principal components account for 27.09% and 20.89% of the total variance, respectively, indicating effective performance of the adopted procedure. This exploratory analysis utilizes singular value decomposition followed by principal component analysis (SVD-PCA) to examine the CLR-based fungal species dataset, facilitating the identification of relationships among samples and fungal species. The results are consistent with the fungal species demonstrating the highest variability within the dataset. The score plot in Figure 5 illustrates spatial relationships among samples, with most Italian samples positioned on the left side of the first PCA axis and Albanian samples predominantly on the right. The loading plot delineates key features of the fungal species distribution across these sample groups, highlighting the association of species with the highest abundances, such as Aureobasidium pullulans and Ascochyta herbicola, with samples from Albania. This association is further detailed in Figure 4c, which shows their strong intra-cluster correlation. Additionally, it can be observed in Figure 5 that the suburban samples PU and TO collected in Tirana are in a separate area of the PCA plot with respect to all the other samples proving their different characteristics in relation to the identified airborne fungal communities. In more detail, this last result could be due to the high association of PU and TO samples with two fungal species that were recognized as potentially human pathogenic, Cladosporium halotolerans (e.g., [66]) and C. sphaerospermum (e.g., [67]), as can be observed in Figure 5.

4. Discussion

This comparative study provides significant insights into the abundance and diversity of airborne bacterial and fungal communities across distinct geographical regions of Italy and Albania. The application of advanced DNA-based methodologies, particularly the compositional data analysis (CoDa) approach, enabled a comprehensive investigation of microbial communities at the species level. The choice of CoDa is justified by its capacity to appropriately manage compositional data, where the relative abundances of species are critical for accurate interpretation. This approach is substantiated by Aitchison [68], who demonstrated its utility in addressing the constrained nature of compositional datasets, with further validation provided by recent studies [26,69], confirming its relevance in microbial community analyses.
The comparison of bacterial and fungal compositions between the two regions reveals notable distinctions, emphasizing the influence of local environmental factors on airborne microbial dynamics. While meteorological parameters, such as temperature, precipitation, and wind patterns, are known to influence microbial dispersion [70], our findings suggest that these factors did not play a major role in the observed differences. Instead, in our study variations in microbial compositions were more closely aligned with specific geographical and environmental characteristics.
The identified bacterial species with higher abundances, such as Rubellimicrobium roseum and Sphingomonas cynarae, exhibited higher prevalence in Albanian sites, while radiation-resistant species, Truepera radiovictrix and Rubrobacter radiotolerans, were more associated with Italian samples. These findings are consistent with previous studies that have identified environmental factors such as soil type, vegetation, and anthropogenic activities as significant determinants of microbial community structure [71,72].
Similarly, the fungal communities characterized by higher abundances, like Mycosphaerella tassiana, Aureobasidium pullulans, and Ascochyta herbicola, demonstrated geographic specificity, particularly in Albanian sites. These results align with studies by Fröhlich-Nowoisky et al. [73] and Sousa et al. [74], which highlight the importance of local environmental conditions in shaping fungal diversity and abundance.
The two-dimensional principal component analysis (PCA) biplots provided a clear visualization of the separation of samples based on their geographical origin, reinforcing the significance of regional environmental factors in shaping airborne microbial compositions. This methodological choice is supported by Jolliffe and Cadima [75], who emphasize the utility of PCA in identifying patterns and differences in complex datasets.
We recognize that microbial compositional variations are evident not only between the two monitoring regions but also within each country. These variations emphasize the necessity for site-specific atmospheric studies, as indicated by previous research [76,77]. While meteorological parameters may influence microbial dynamics, our findings suggest that the primary determinants of microbial community composition in this study are more likely to be localized environmental factors rather than overarching meteorological conditions.
Our in-depth analysis of the factors contributing to these variations highlights the influence of local environmental conditions on microbial communities, even at sites in close geographical proximity. These results advance our understanding of microbial ecology and underscore the importance of further research into the complex interactions between environmental factors and microbial populations. Such insights are essential for addressing the potential implications of airborne microorganisms on human health, agriculture, and ecosystem stability [78,79].
Therefore, this study can establish a foundation for future research endeavors aimed at unraveling the complexities of atmospheric microbiomes in diverse geographic settings. Our findings emphasize the significance of atmospheric processes and regional environmental conditions in determining the composition of airborne microbial communities. By bridging microbiology and atmospheric science, our study underscores the importance of integrating microbial analysis with atmospheric research to better understand the dynamics of airborne microorganisms. In addition, further research could benefit from exploring additional environmental variables or conducting new studies to fully understand the interplay between meteorological conditions and microbial communities.

5. Conclusions

In this work, we have reported and discussed the main results based on the analysis of airborne bacterial and fungal communities at the species level identified in different monitoring sites in south-eastern Italy and in Albania by using the compositional analysis of 16S and ITS rRNA gene sequencing datasets. In more detail, this study has provided some insightful revelations about the taxonomic structures influenced by the different selected monitoring locations. In fact, in the airborne bacterial community analysis, a heatmap constructed on CLR values, along with Aitchison distance dendrograms, revealed distinct clusters corresponding to the Albanian and Italian sampling sites. Rubellimicrobium roseum and Sphingomonas cynarae presented the highest CLR values, notably in all the Albanian sites and in the Italian sites of Nardò (NA) and San Cesario (SC2). The two-dimensional principal component analysis (PCA) biplot confirmed the differentiation, with Italian and Albanian samples distinctly clustered based on their geographical origin. Noteworthy was the association of radiation-resistant species, Truepera radiovictrix and Rubrobacter radiotolerans, with the Italian sample cluster. In the analysis of fungal communities, a similar approach was applied, revealing Mycosphaerella tassiana, Aureobasidium pullulans, and Ascochyta herbicola as the fungal species with the highest CLR values, predominantly in Albanian sites. The dendrogram identified two principal sample clusters aligning with geographical origins, reinforcing the observed differentiation in bacterial communities. The two-dimensional PCA biplot corroborated these findings, with Italian and Albanian samples separated based on their geographic origin. The loading plot emphasized the contribution of specific fungal species, notably Aureobasidium pullulans and Ascochyta herbicola, to the observed patterns.
In conclusion, this study had two primary objectives: to demonstrate the applicability of compositional data analysis (CoDa) methods for comparing bioaerosols and to compare the airborne bacterial and fungal communities between Albania and southeastern Italy. The integrated analysis of bacterial and fungal communities provided a comprehensive understanding of airborne microbial dynamics in two distinct areas of the Mediterranean region. The differences observed between these geographical locations highlight the influence of local environmental factors on microbial compositions. The association of certain species with specific regions, along with their interactions within clusters, suggests potential ecological adaptations and relationships. This study not only establishes a foundation for further investigations into the factors shaping airborne microbial communities but also contributes valuable insights into microbial ecology, with implications for environmental and human health. Additionally, it represents one of the first significant efforts to characterize the main airborne bacterial and fungal communities in Albania, a region where limited research has been conducted on this subject.

Supplementary Materials

The following supporting information can be downloaded at: https://www.mdpi.com/article/10.3390/atmos15101155/s1, Table S1: Daily values of meteorological parameters measured at the study areas during the selected sampling period; Table S2: Heatmap of the 23 selected bacterial species as a function of the analyzed samples; Table S3: Aitchison distance matrix for the 23 selected bacterial species; Table S4: Heatmap of the 17 selected fungal species as a function of the analyzed samples; Table S5: Aitchison distance matrix for the 17 selected fungal species.

Author Contributions

Conceptualization, S.R., G.Q. and L.C.; methodology, S.R., L.P., M.F., J.D., A.B., A.T. and P.A.; software, S.R. and M.F.; formal analysis, S.R., L.P., M.F., D.P. and A.T.; investigation, S.R., L.P., M.F., D.P., J.D., A.B. and L.C.; resources, S.R., L.P. and J.D.; data curation, S.R., L.P., M.F., D.P. and A.B.; writing—original draft preparation, S.R.; writing—review and editing, S.R., M.F., A.T. and P.A.; supervision, S.R., P.A., G.Q. and L.C.; project administration, S.R., G.Q. and L.C.; funding acquisition, S.R., G.Q. and L.C. All authors have read and agreed to the published version of the manuscript.

Funding

M.F. carried out this work with the support of a research fellowship financed by the Project PON PER-ACTRIS-IT CIR01_00015—CUP F88I20000190001. D.P. carried out this work with the support of a Ph.D. fellowship financed by the Project PNRR ITINERIS—IR0000032, CUP B53C22002150006. Both fellowships were funded by the Italian Ministry of Education, University and Research. The work was also supported by the Italian INFN (Istituto Nazionale Fisica Nucleare), in the framework of the projects IS-ABS (Integrated System for Aerosol and Bioaerosol Studies at the Pierre Auger Observatory) and AT-SVB (Airborne Transmission of SARS-CoV-2, Viruses, and Bacteria in workplaces), and by the Project PER-ACTRIS-IT Enhancement of the Italian Component of the Aerosol, Clouds, and Trace Gases Research InfraStructure (PIR01_00015) funded by the Italian Ministry of Education, University and Research.

Institutional Review Board Statement

Not applicable.

Informed Consent Statement

Not applicable.

Data Availability Statement

Data are contained within the article or in the Supplementary Materials.

Conflicts of Interest

The authors declare no conflicts of interest.

References

  1. Després, V.R.; Huffman, J.A.; Burrows, S.M.; Hoose, C.; Safatov, A.S.; Buryak, G.; Fröhlich-Nowoisky, J.; Elbert, W.; Andreae, M.O.; Pöschl, U.; et al. Primary Biological Aerosol Particles in the Atmosphere: A Review. Tellus B Chem. Phys. Meteorol. 2012, 64, 15598. [Google Scholar] [CrossRef]
  2. Fröhlich-Nowoisky, J.; Kampf, C.J.; Weber, B.; Huffman, J.A.; Pöhlker, C.; Andreae, M.O.; Lang-Yona, N.; Burrows, S.M.; Gunthe, S.S.; Elbert, W.; et al. Bioaerosols in the Earth System: Climate, Health, and Ecosystem Interactions. Atmos. Res. 2016, 182, 346–376. [Google Scholar] [CrossRef]
  3. Kim, K.-H.; Kabir, E.; Jahan, S.A. Airborne Bioaerosols and Their Impact on Human Health. J. Environ. Sci. 2018, 67, 23–35. [Google Scholar] [CrossRef]
  4. Tang, K.; Huang, Z.; Huang, J.; Maki, T.; Zhang, S.; Shimizu, A.; Ma, X.; Shi, J.; Bi, J.; Zhou, T.; et al. Characterization of Atmospheric Bioaerosols along the Transport Pathway of Asian Dust during the Dust-Bioaerosol 2016 Campaign. Atmos. Chem. Phys. 2018, 18, 7131–7148. [Google Scholar] [CrossRef]
  5. Xie, W.; Li, Y.; Bai, W.; Hou, J.; Ma, T.; Zeng, X.; Zhang, L.; An, T. The Source and Transport of Bioaerosols in the Air: A Review. Front. Environ. Sci. Eng. 2021, 15, 44. [Google Scholar] [CrossRef]
  6. Yassin, M.F.; Almouqatea, S. Assessment of Airborne Bacteria and Fungi in an Indoor and Outdoor Environment. Int. J. Environ. Sci. Technol. 2010, 7, 535–544. [Google Scholar] [CrossRef]
  7. Kowalski, M.; Wolany, J.; Pastuszka, J.S.; Płaza, G.; Wlazło, A.; Ulfig, K.; Malina, A. Characteristics of Airborne Bacteria and Fungi in Some Polish Wastewater Treatment Plants. Int. J. Environ. Sci. Technol. 2017, 14, 2181–2192. [Google Scholar] [CrossRef]
  8. Reanprayoon, P.; Yoonaiwong, W. Airborne Concentrations of Bacteria and Fungi in Thailand Border Market. Aerobiologia 2012, 28, 49–60. [Google Scholar] [CrossRef]
  9. Park, D.; Ryu, S.; Kim, S.; Byun, H.; Yoon, C.; Lee, K. Airborne Bacteria and Fungi Associated with Waste-Handling Work. Int. J. Occup. Environ. Health 2013, 19, 311–318. [Google Scholar] [CrossRef]
  10. Rdzanek, M.; Pusz, W.; Gębarowska, E.; Pląskowska, E. Airborne Bacteria and Fungi in a Coal Mine in Poland. J. Caves. Karst Stud. 2015, 77, 177–182. [Google Scholar] [CrossRef]
  11. Jacob, J.H.; Irshaid, F.I.; Alhalib, M.A. Estimation and Identification of Airborne Bacteria and Fungi in the Outdoor Atmosphere of Al-Mafraq Area—Jordan. Jordan J. Biol. Sci. 2016, 9, 3–10. [Google Scholar] [CrossRef]
  12. Gębarowska, E.; Pusz, W.; Kucińska, J.; Kita, W. Comparative Analysis of Airborne Bacteria and Fungi in Two Salt Mines in Poland. Aerobiologia 2018, 34, 127–138. [Google Scholar] [CrossRef] [PubMed]
  13. Anderson, B.D.; Ma, M.; Xia, Y.; Wang, T.; Shu, B.; Lednicky, J.A.; Ma, M.-J.; Lu, J.; Gray, G.C. Bioaerosol Sampling in Modern Agriculture: A Novel Approach for Emerging Pathogen Surveillance? J. Infect. Dis. 2016, 214, 537–545. [Google Scholar] [CrossRef]
  14. Mubareka, S.; Groulx, N.; Savory, E.; Cutts, T.; Theriault, S.; Scott, J.A.; Roy, C.J.; Turgeon, N.; Bryce, E.; Astrakianakis, G.; et al. Bioaerosols and Transmission, a Diverse and Growing Community of Practice. Front. Public Health 2019, 7, 23. [Google Scholar] [CrossRef]
  15. Mbareche, H.; Morawska, L.; Duchaine, C. On the Interpretation of Bioaerosol Exposure Measurements and Impacts on Health. J. Air Waste Manag. Assoc. 2019, 69, 789–804. [Google Scholar] [CrossRef]
  16. Shammi, M.; Rahman, M.M.; Tareq, S.M. Distribution of Bioaerosols in Association with Particulate Matter: A Review on Emerging Public Health Threat in Asian Megacities. Front. Environ. Sci. 2021, 9, 698215. [Google Scholar] [CrossRef]
  17. Maki, T.; Sano, I.; Shimamoto, S.; Miyata, H.; Fujiwara, Y.; Watanabe, K.; Kurosaki, Y.; Aoki, K.; Matsuki, A.; Noda, J.; et al. Long-range transport of airborne microorganisms by Asian dust events: Bioaerosols relating to human health. In Proceedings of the EGU General Assembly Conference Abstracts 2023, Vienna, Australia, 24–28 April 2023. [Google Scholar] [CrossRef]
  18. Innocente, E.; Squizzato, S.; Visin, F.; Facca, C.; Rampazzo, G.; Bertolini, V.; Gandolfi, I.; Franzetti, A.; Ambrosini, R.; Bestetti, G. Influence of Seasonality, Air Mass Origin and Particulate Matter Chemical Composition on Airborne Bacterial Community Structure in the Po Valley, Italy. Sci. Total Environ. 2017, 593–594, 677–687. [Google Scholar] [CrossRef]
  19. Sun, Y.; Xu, S.; Zheng, D.; Li, J.; Tian, H.; Wang, Y. Effects of Haze Pollution on Microbial Community Changes and Correlation with Chemical Components in Atmospheric Particulate Matter. Sci. Total Environ. 2018, 637–638, 507–516. [Google Scholar] [CrossRef]
  20. Romano, S.; Di Salvo, M.; Rispoli, G.; Alifano, P.; Perrone, M.R.; Talà, A. Airborne Bacteria in the Central Mediterranean: Structure and Role of Meteorology and Air Mass Transport. Sci. Total Environ. 2019, 697, 134020. [Google Scholar] [CrossRef]
  21. Calderón-Ezquerro, M.C.; Serrano-Silva, N.; Brunner-Mendoza, C. Metagenomic Characterisation of Bioaerosols during the Dry Season in Mexico City. Aerobiologia 2020, 36, 493–505. [Google Scholar] [CrossRef]
  22. Kang, S.; Cho, K.-S. Microbial Metagenome of Airborne Particulate Matter: Methodology, Characteristics, and Influencing Parameters. Korean J. Microbiol. Biotechnol. 2022, 50, 165–192. [Google Scholar] [CrossRef]
  23. Erkorkmaz, B.A.; Gat, D.; Rudich, Y. Aerial transport of bacteria by dust plumes in the Eastern Mediterranean revealed by complementary rRNA/rRNA-gene sequencing. Commun. Earth Environ. 2023, 4, 24. [Google Scholar] [CrossRef]
  24. Robinson, C.K.; Brotman, R.M.; Ravel, J. Intricacies of Assessing the Human Microbiome in Epidemiologic Studies. Ann. Epidemiol. 2016, 26, 311–321. [Google Scholar] [CrossRef]
  25. Xia, Y. Correlation and Association Analyses in Microbiome Study Integrating Multiomics in Health and Disease. Prog. Mol. Biol. Transl. Sci. 2020, 171, 309–491. [Google Scholar] [CrossRef]
  26. Gloor, G.B.; Macklaim, J.M.; Pawlowsky-Glahn, V.; Egozcue, J.J. Microbiome Datasets Are Compositional: And This Is Not Optional. Front. Microbiol. 2017, 8, 2224. [Google Scholar] [CrossRef]
  27. Fragola, M.; Romano, S.; Peccarrisi, D.; Talà, A.; Alifano, P.; Buccolieri, A.; Quarta, G.; Calcagnile, L. Characterization of the Airborne Microbiome in Different Indoor and Outdoor Locations of a University Building Using an Innovative Compositional Data Analysis Approach. Atmosphere 2023, 14, 1529. [Google Scholar] [CrossRef]
  28. Romano, S.; Catanzaro, V.; Paladini, F. Impacts of the COVID-19 Lockdown Measures on the 2020 Columnar and Surface Air Pollution Parameters over South-Eastern Italy. Atmosphere 2021, 12, 1366. [Google Scholar] [CrossRef]
  29. Romano, S.; Pichierri, S.; Fragola, M.; Buccolieri, A.; Quarta, G.; Calcagnile, L. Characterization of the PM2.5 aerosol fraction monitored at a suburban site in south-eastern Italy by integrating isotopic techniques and ion beam analysis. Front. Environ. Sci. 2022, 10, 971204. [Google Scholar] [CrossRef]
  30. Perrone, M.R.; Paladini, F.; Becagli, S.; Amore, A.; Romano, S. Daytime and Nighttime Chemical and Optical Properties of Fine and Coarse Particles at a Central Mediterranean Coastal Site. Environ. Sci. Pollut. Res. Int. 2022, 29, 43401–43420. [Google Scholar] [CrossRef]
  31. Romano, S.; Becagli, S.; Lucarelli, F.; Rispoli, G.; Perrone, M.R. Airborne Bacteria Structure and Chemical Composition Relationships in Winter and Spring PM10 Samples over Southeastern Italy. Sci. Total Environ. 2020, 730, 138899. [Google Scholar] [CrossRef]
  32. Fragola, M.; Perrone, M.R.; Alifano, P.; Talà, A.; Romano, S. Seasonal Variability of the Airborne Eukaryotic Community Structure at a Coastal Site of the Central Mediterranean. Toxins 2021, 13, 518. [Google Scholar] [CrossRef] [PubMed]
  33. Fragola, M.; Arsieni, A.; Carelli, N.; Dattoli, S.; Maiellaro, S.; Perrone, M.R.; Romano, S. Pollen Monitoring by Optical Microscopy and DNA Metabarcoding: Comparative Study and New Insights. Int. J. Environ. Res. Public Health 2022, 19, 2624. [Google Scholar] [CrossRef] [PubMed]
  34. Mico, S.; Deda, A.; Alushllari, M. Particulate Matter Concentrations: Urban versus Suburban Areas of Vlora, Albania. In Proceedings of the AIP Conference Proceedings, Birmingham, UK, 16–20 July 2017. [Google Scholar] [CrossRef]
  35. Liti, A.; Cara, O.; Mercury, J.; Cara, M. The monitoring of PM2.5 and PM10 in the air in Durres, Albania. J. Int. Sci. Publ. Ecol. Saf. 2020, 14, 75–81. [Google Scholar]
  36. Hysenaj, M.; Duraj, S. Spatiotemporal Variations of Particulate Matter in Tirana. J. Ecol. Eng. 2021, 22, 209–214. [Google Scholar] [CrossRef]
  37. Hajderi, A.; Bozo, L. The Air Pollution from Vehicles and Health Risks in the City of Tirana. Adv. Eng. Days 2023, 7, 116–119. [Google Scholar]
  38. Kaçorri, D.; Totoni, R.; Prifti, L. Multinomial Logistic Regression to Estimate the Public Perception of Air Pollution and Its Impact on Health: A Case Study in Tirana. AS-Proceedings 2023, 1, 312–317. [Google Scholar]
  39. Troja, E.; Pinguli, L.; Troja, R.; Dhamo, E.; Muça, E. Microbiological Air Monitoring and Long-Term Evaluations of Selected Urban Areas in the City of Tirana. Environ. Sci. Proc. 2021, 9, 13. [Google Scholar] [CrossRef]
  40. Qarri, F.; Lazo, P.; Allajbeu, S.; Bekteshi, L.; Kane, S.; Stafilov, T. The Evaluation of Air Quality in Albania by Moss Biomonitoring and Metals Atmospheric Deposition. Arch. Environ. Contam. Toxicol. 2019, 76, 554–571. [Google Scholar] [CrossRef]
  41. Lazo, P.; Kika, A.; Qarri, F.; Bekteshi, L.; Allajbeu, S.; Stafilov, T. Air Quality Assessment by Moss Biomonitoring and Trace Metals Atmospheric Deposition. Aerosol Air Qual. Res. 2022, 22, 220008. [Google Scholar] [CrossRef]
  42. Romano, S.; Perrone, M.R.; Pavese, G.; Esposito, F.; Calvello, M. Optical Properties of PM2.5 Particles: Results from a Monitoring Campaign in Southeastern Italy. Atmos. Environ. 2019, 203, 35–47. [Google Scholar] [CrossRef]
  43. Perrone, M.R.; Romano, S.; Orza, J.A.G. Particle Optical Properties at a Central Mediterranean Site: Impact of Advection Routes and Local Meteorology. Atmos. Res. 2014, 145–146, 152–167. [Google Scholar] [CrossRef]
  44. Perrone, M.R.; Romano, S.; Orza, J.A.G. Columnar and Ground-Level Aerosol Optical Properties: Sensitivity to the Transboundary Pollution, Daily and Weekly Patterns, and Relationships. Environ. Sci. Pollut. Res. Int. 2015, 22, 16570–16589. [Google Scholar] [CrossRef] [PubMed]
  45. Banja, M.; Como, E.; Murtaj, B.; Zotaj, A. Mapping Air Pollution in Urban Tirana Area Using GIS. In Proceedings of the International Conference SDI 2010, Skopje, North Macedonia, 15–17 September 2010. [Google Scholar]
  46. Kopali, A.; Libohova, Z.; Teqja, Z.; Owens, P.R. Bioclimatic Suitability for Wine Vineyards in Mediterranean Climate-Tirana Region, Albania. Eur. J. Hortic. Sci. 2021, 86, 179–188. [Google Scholar] [CrossRef]
  47. Dervishi, S.; Pashako, F.; Dushaj, X.; Dervishi, I.O. Energy Performance Optimization of Traditional Housing in Mediterranean Climate. J. Build. Eng. 2022, 45, 103423. [Google Scholar] [CrossRef]
  48. Robert, D.; Pirro, I. A Comparative Study of Ambient Air Quality Status in Major Cities of Albania. Ann. “VALAHIA” Uni Targoviste 2014, 8. [Google Scholar]
  49. Shu, H.; Xiangchao, C.; Peng, L.; Hui, G. Study on Electret Technology of Air Filtration Material. IOP Conf. Ser. Earth Environ. Sci. 2017, 100, 012110. [Google Scholar] [CrossRef]
  50. Romay, F.J.; Liu, B.Y.H.; Chae, S.-J. Experimental Study of Electrostatic Capture Mechanisms in Commercial Electret Filters. Aerosol Sci. Technol. 1998, 28, 224–234. [Google Scholar] [CrossRef]
  51. King, P.; Pham, L.K.; Waltz, S.; Sphar, D.; Yamamoto, R.T.; Conrad, D.; Taplitz, R.; Torriani, F.; Forsyth, R.A. Longitudinal Metagenomic Analysis of Hospital Air Identifies Clinically Relevant Microbes. PLoS ONE 2016, 11, e0160124. [Google Scholar] [CrossRef]
  52. Perrone, M.R.; Romano, S.; De Maria, G.; Tundo, P.; Bruno, A.R.; Tagliaferro, L.; Maffia, M.; Fragola, M. Compositional Data Analysis of 16S rRNA Gene Sequencing Results from Hospital Airborne Microbiome Samples. Int. J. Environ. Res. Public Health 2022, 19, 10107. [Google Scholar] [CrossRef]
  53. Perrone, M.R.; Romano, S.; De Maria, G.; Tundo, P.; Bruno, A.R.; Tagliaferro, L.; Maffia, M.; Fragola, M. Simultaneous Monitoring of SARS-CoV-2 and Bacterial Profiles from the Air of Hospital Environments with COVID-19 Affected Patients. Aerobiologia 2022, 38, 391–412. [Google Scholar] [CrossRef]
  54. Jaing, C.; Thissen, J.; Morrison, M.; Dillon, M.B.; Waters, S.M.; Graham, G.T.; Be, N.A.; Nicoll, P.; Verma, S.; Caro, T.; et al. Sierra Nevada Sweep: Metagenomic Measurements of Bioaerosols Vertically Distributed across the Troposphere. Sci. Rep. 2020, 10, 12399. [Google Scholar] [CrossRef] [PubMed]
  55. Ginn, O.; Rocha-Melogno, L.; Bivins, A.; Lowry, S.; Cardelino, M.; Nichols, D.; Tripathi, S.N.; Soria, F.; Andrade, M.; Bergin, M.; et al. Detection and Quantification of Enteric Pathogens in Aerosols near Open Wastewater Canals in Cities with Poor Sanitation. Environ. Sci. Technol. 2021, 55, 14758–14771. [Google Scholar] [CrossRef] [PubMed]
  56. Ginn, O.; Berendes, D.; Wood, A.; Bivins, A.; Rocha-Melogno, L.; Deshusses, M.A.; Tripathi, S.N.; Bergin, M.H.; Brown, J. Open Waste Canals as Potential Sources of Antimicrobial Resistance Genes in Aerosols in Urban Kanpur, India. Am. J. Trop. Med. Hyg. 2021, 104, 1761–1767. [Google Scholar] [CrossRef] [PubMed]
  57. Klindworth, A.; Pruesse, E.; Schweer, T.; Peplies, J.; Quast, C.; Horn, M.; Glöckner, F.O. Evaluation of General 16S Ribosomal RNA Gene PCR Primers for Classical and Next-Generation Sequencing-Based Diversity Studies. Nucleic Acids Res. 2013, 41, e1. [Google Scholar] [CrossRef]
  58. Op De Beeck, M.; Lievens, B.; Busschaert, P.; Declerck, S.; Vangronsveld, J.; Colpaert, J.V. Comparison and Validation of Some ITS Primer Pairs Useful for Fungal Metabarcoding Studies. PLoS ONE 2014, 9, e97629. [Google Scholar] [CrossRef]
  59. Bolger, A.M.; Lohse, M.; Usadel, B. Trimmomatic: A flexible trimmer for Illumina sequence data. Bioinformatics 2014, 30, 2114–2120. [Google Scholar] [CrossRef]
  60. Paytuví, A.; Battista, E.; Scippacercola, F.; Aiese Cigliano, R.; Sanseverino, W. GAIA: An integrated metagenomics suite. bioRxiv 2019, bioRxiv:804690. [Google Scholar] [CrossRef]
  61. Pollegioni, P.; Mattioni, C.; Ristorini, M.; Occhiuto, D.; Canepari, S.; Korneykova, M.V.; Gavrichkova, O. Diversity and Source of Airborne Microbial Communities at Differential Polluted Sites of Rome. Atmosphere 2022, 13, 224. [Google Scholar] [CrossRef]
  62. Pawlowsky-Glahn, V.; Egozcue, J.J.; Tolosana-Delgado, R. Modeling and Analysis of Compositional Data, 1st ed.; John Wiley & Sons: Nashville, TN, USA, 2015. [Google Scholar]
  63. Martín-Fernández, J.A.; Barceló-Vidal, C.; Pawlowsky-Glahn, V. Dealing with zeros and missing values in compositional data sets using nonparametric imputation. Math. Geol. 2003, 35, 253–278. [Google Scholar] [CrossRef]
  64. Bian, G.; Gloor, G.B.; Gong, A.; Jia, C.; Zhang, W.; Hu, J.; Zhang, H.; Zhang, Y.; Zhou, Z.; Zhang, J.; et al. The Gut Microbiota of Healthy Aged Chinese Is Similar to That of the Healthy Young. mSphere 2017, 2, 10–1128. [Google Scholar] [CrossRef]
  65. Khaledi, E.; Moghadam, J.N.; Abdollahzadeh, J.; Amini, J. Fungi Associated with Grapevine Trunk Diseases (GTDs) with Emphasize on Pestalotioid Species in Kurdistan Province, Iran. Res. Sq. 2021. [Google Scholar] [CrossRef]
  66. Kaur, H.; Gupta, P.; Ahmad, H.; Shankarnarayan, S.A.; Srivastava, S.; Sahu, S.; Karuna, T.; Narang, T.; Gupta, S.; Ghosh, A.; et al. Cladosporium Halotolerans: Exploring an Unheeded Human Pathogen. Mycopathologia 2023, 188, 1027–1040. [Google Scholar] [CrossRef] [PubMed]
  67. Batra, N.; Kaur, H.; Mohindra, S.; Singh, S.; Shamanth, A.S.; Rudramurthy, S.M. Cladosporium Sphaerospermum Causing Brain Abscess, a Saprophyte Turning Pathogen: Case and Review of Published Reports. J. Mycol. Med. 2019, 29, 180–184. [Google Scholar] [CrossRef] [PubMed]
  68. Aitchison, J. The Statistical Analysis of Compositional Data; Chapman and Hall: London, UK, 1986; 416p. [Google Scholar] [CrossRef]
  69. Quinn, T.P.; Erb, I.; Gloor, G.; Notredame, C.; Richardson, M.F.; Crowley, T.M. A field guide for the compositional analysis of any-omics data. GigaScience 2019, 8, 9. [Google Scholar] [CrossRef]
  70. Zhen, Q.; Deng, Y.; Wang, Y.; Wang, X.; Zhang, H.; Sun, X.; Ouyang, Z. Meteorological factors had more impact on airborne bacterial communities than air pollutants. Sci. Total Environ. 2017, 601–602, 703–712. [Google Scholar] [CrossRef]
  71. Fierer, N.; Jackson, R.B. The diversity and biogeography of soil bacterial communities. Proc. Natl. Acad. Sci. USA 2006, 103, 626–631. [Google Scholar] [CrossRef]
  72. Barberán, A.; Ramirez, K.S.; Leff, J.W.; Bradford, M.A.; Wall, D.H.; Fierer, N. Why are some microbes more ubiquitous than others? Predicting the habitat breadth of soil bacteria. Ecol. Lett. 2014, 17, 794–802. [Google Scholar] [CrossRef]
  73. Fröhlich-Nowoisky, J.; Ruzene Nespoli, C.; Pickersgill, D.A.; Galand, P.E.; Müller-Germann, I.; Nunes, T.; Gomes Cardoso, J.; Almeida, S.M.; Pio, C.; Andreae, M.O.; et al. Diversity and seasonal dynamics of airborne archaea. Biogeosciences 2014, 11, 6067–6079. [Google Scholar] [CrossRef]
  74. Sousa, A.C.A.; Almeida, J.R.S.L.; Pereira, C.C.; Ramiro Pastorinho, M.; Pereira, Â.M.C.; Nogueira, A.J.A.; Taborda-Barata, L.; Teixeira, J.P.; Correia, A.C.M.; Alves, A. Characterization of Fungal Communities in House Dust Samples Collected From Central Portugal—A Preliminary Survey. J. Toxicol. Environ. Health A 2014, 77, 972–982. [Google Scholar] [CrossRef]
  75. Jolliffe, I.T.; Cadima, J. Principal component analysis: A review and recent developments. Philos. Trans. A Math. Phys. Eng. Sci. 2016, 374, 20150202. [Google Scholar] [CrossRef]
  76. Bertolini, V.; Gandolfi, I.; Ambrosini, R.; Bestetti, G.; Innocente, E.; Rampazzo, G.; Franzetti, A. Temporal variability and effect of environmental variables on airborne bacterial communities in an urban area of Northern Italy. Appl. Microbiol. Biotechnol. 2013, 97, 6561–6570. [Google Scholar] [CrossRef] [PubMed]
  77. Lee, J.Y.; Park, E.H.; Lee, S.; Ko, G.; Honda, Y.; Hashizume, M.; Deng, F.; Yi, S.M.; Kim, H. Airborne Bacterial Communities in Three East Asian Cities of China, South Korea, and Japan. Sci. Rep. 2017, 7, 5545. [Google Scholar] [CrossRef] [PubMed]
  78. Peccia, J.; Hernandez, M. Incorporating polymerase chain reaction-based identification, population characterization, and quantification of microorganisms into aerosol science: A review. Atmos. Environ. 2006, 40, 3941–3961. [Google Scholar] [CrossRef]
  79. Chawla, H.; Anand, P.; Garg, K.; Bhagat, N.; Varmani, S.G.; Bansal, T.; McBain, A.J.; Gulati Marwah, R. A comprehensive review of microbial contamination in the indoor environment: Sources, sampling, health risks, and mitigation strategies. Front. Public Health 2023, 11, 1285393. [Google Scholar] [CrossRef] [PubMed]
Figure 1. (a) Geographical location of the two study areas, i.e., south-eastern Italy and Albania, in the Central Mediterranean basin. The exact locations of the seven monitoring sites in Italy are displayed in (b) by blue dots (GA—Galatone, LE—Lecce, ML—Muro Leccese, NA—Nardò, PA—Parabita, SC1—San Cesario 1, SC2—San Cesario 2). The seven monitoring sites in Albania are reported in (c) by red dots, with a focus on the five sites in Tirana depicted in (d) (MA—Tirana Marashi, NO—Lezha Nord, PU—Tirana Pusi, QI—Tirana Qiriazi, SH—Shkodër, TI—Tirana Center, TO—Tirana Tokat).
Atmosphere 15 01155 g001
Figure 2. (a) Heatmap defined on the centered log-ratio (CLR) values of the initial dataset (reads) based on the 23 bacterial species with the highest abundances. (b,c) show the Aitchison distance dendrograms pointing out the relations among samples and among species, respectively.
Atmosphere 15 01155 g002
Figure 3. Two-dimensional principal component analysis biplot via a singular value decomposition of the CLR values of the initial dataset based on the 23 selected bacterial species. The reported biplot illustrates the relationships between samples (score plot, in different colors based on the sampling location: samples collected in Albania are in red, while the ones from Italy are in blue) and species (loading plot, black arrows). The percentages of the total variance explained by the first two principal components are also reported.
Atmosphere 15 01155 g003
Figure 4. (a) Heatmap defined on the centered log-ratio (CLR) values of the initial dataset (reads) based on the 17 fungal species with the highest abundances. (b,c) show the Aitchison distance dendrograms pointing out the relations among samples and among species, respectively.
Atmosphere 15 01155 g004
Figure 5. Two-dimensional principal component analysis biplot via a singular value decomposition of the CLR values of the initial dataset based on the 17 selected fungal species. The reported biplot illustrates the relationships between samples (score plot, in different colors based on the sampling location: samples collected in Albania are in red, while the ones from Italy are in blue) and species (loading plot, black arrows). The percentages of the total variance explained by the first two principal components are also reported.
Atmosphere 15 01155 g005
Disclaimer/Publisher’s Note: The statements, opinions and data contained in all publications are solely those of the individual author(s) and contributor(s) and not of MDPI and/or the editor(s). MDPI and/or the editor(s) disclaim responsibility for any injury to people or property resulting from any ideas, methods, instructions or products referred to in the content.

