Article

Characterization and Sources of VOCs during PM2.5 Pollution Periods in a Typical City of the Yangtze River Delta

1
State Key Laboratory of Organic Geochemistry, Guangdong Key Laboratory of Environmental Protection and Resources Utilization, Guangzhou Institute of Geochemistry, Chinese Academy of Sciences, Guangzhou 510640, China
2
University of Chinese Academy of Sciences, Beijing 100049, China
*
Author to whom correspondence should be addressed.
Atmosphere 2024, 15(10), 1162; https://doi.org/10.3390/atmos15101162
Submission received: 18 August 2024 / Revised: 9 September 2024 / Accepted: 24 September 2024 / Published: 28 September 2024
(This article belongs to the Section Aerosols)

Abstract

:
To investigate the characteristics and sources of volatile organic compounds (VOCs) as well as their impacts on secondary organic aerosols (SOAs) formation during high-incidence periods of PM2.5 pollution, a field measurement was conducted in December 2019 in Hefei, a typical city of the Yangtze River Delta (YRD). During the whole process, the mixing ratios of VOCs were averaged as 21.1 ± 15.9 ppb, with alkanes, alkenes, alkyne, and aromatics accounting for 59.9%, 15.3%, 15.0%, and 9.8% of the total VOCs, respectively. It is worth noting that the contributions of alkenes and alkyne increased significantly during PM2.5 pollution periods. Based on source apportionment via the positive matrix factorization (PMF) model, vehicle emissions, liquefied petroleum gas/natural gas (LPG/NG), and biomass/coal burning were the main sources of VOCs during the research in Hefei. During pollution periods, however, the contribution of biomass/coal burning to VOCs increased significantly, reaching as much as 47.6%. The calculated SOA formation potential (SOAFP) of VOCs was 0.38 ± 1.04 µg m−3 (range: 0.04–7.30 µg m−3), and aromatics were the dominant contributors, with a percentage of 96.8%. The source contributions showed that industrial emissions (49.1%) and vehicle emissions (28.3%) contributed the most to SOAFP during non-pollution periods, whereas the contribution of biomass/coal burning to SOA formation increased significantly (32.8%) during PM2.5 pollution periods. These findings suggest that reducing VOCs emissions from biomass/coal burning, vehicle, and industrial sources is a crucial approach for the effective control of SOA formation in Hefei, which provides a scientific basis for controlling PM2.5 pollution and improving air quality in the YRD region.

Graphical Abstract

1. Introduction

Volatile organic compounds (VOCs) have been identified as significant precursors of tropospheric ozone (O3) and secondary organic aerosol (SOA) [1,2], which constitutes a major component of atmospheric fine particulate matter (PM2.5). Previous studies have indicated that SOA derived from VOCs can contribute up to 25–30% of PM2.5 [3], and this contribution could even increase during periods of severe PM2.5 pollution [4]. In addition, VOCs and their reaction products, such as carcinogens like 1,3-butadiene, benzene, and styrene [5], can affect human health.
VOCs are primarily comprised of alkanes, alkenes, alkynes, and aromatics with varying sources and reactivities [2]. The complex sources of VOCs comprise both natural sources, which are dominated by plant emissions [6], and anthropogenic sources, such as vehicle emissions, solvent usage, gasoline evaporation, industrial emissions, and biomass burning [7,8,9]. The contributions of various emission sources to atmospheric VOCs showed significant spatial and temporal variations [10,11]. Studies have shown that VOC emissions from combustion sources contribute significantly in northern China (23.2 ± 14.3%), while solvent use contributes substantially in eastern China (19.5 ± 7.0%) [12]. Furthermore, key VOCs components also exhibited distinct spatial variations. For example, Li et al. [13] found that ethane, propane, and acetone were the predominant VOCs species in Zhejiang Province, and toluene was the key VOCs species affecting SOA formation; whereas, in the Pearl River Delta (PRD) region [14], the primary VOC components were propane and n-butane, with toluene and m/p-xylene having the most contributions to SOA formation. Therefore, development of pollution prevention and control strategies requires the investigation of local characteristics and source contributions of VOCs.
The Yangtze River Delta (YRD) region, including Shanghai, Zhejiang, Jiangsu, and Anhui Provinces, is one of China’s most important economic zones. With only 4% of China’s land area, the YRD region contained 16% of China’s population in 2019 and accounted for 24% of the Gross Domestic Product (GDP); 25% of the Gross Industrial Output; 14% of vehicle numbers; and 18% of fossil fuel consumption (https://data.stats.gov.cn/; accessed on 7 September 2024). The rapid economic growth and accelerated urbanization in the YRD region have led to a notable increase in air pollutants emissions [15]. For example, the emissions of VOCs and PM2.5 per unit area in the YRD region were 5.2 and 3.4 times that of the national average [16]. As a key target region for the implementation of China’s Blue Sky Defense Program, the YRD region has experienced a great air quality improvement in last decade (https://www.mee.gov.cn; accessed on 7 September 2024). However, air pollution events still frequently happen in the YRD region, especially PM2.5 pollution in wintertime. According to the Reports on the State of the Ecology and Environment in China (https://www.mee.gov.cn; accessed on 7 September 2024), the annual averaged PM2.5 concentration was 41 µg m−3 in the YRD region in 2019, still higher than the PM2.5 annual standard (35 µg m−3) [17], and over 80% of days exceeding the PM2.5 standards occurred in winter. This highlights the importance of reducing winter PM2.5 pollution to sustainably improve air quality in the YRD region, which also has great practical significance in the other regions of China. Spatial patterns show that areas with high PM2.5 concentration are primarily distributed in Hefei, Chuzhou, and Ma’anshan Cities. Hefei, as the capital and economic center of Anhui Province and the sub-center of the YRD Economic zone, has experienced rapid economic and urban development. From 2010 to 2021, the energy consumption of Hefei increased from 15.75 million tons of standard coal to 26.04 million tons of standard coal, the number of motor vehicles increased from 0.39 million to 2.54 million, and the permanent population grew from 7.46 million to 9.47 million (http://tjj.hefei.gov.cn; accessed on 7 September 2024). Meanwhile, Hefei also suffered severe PM2.5 pollution in the YRD region. In 2019, the annual average PM2.5 concentration was 44 µg m−3 in Hefei (https://sthjt.ah.gov.cn; accessed on 7 September 2024), which was 10–26% higher than that in Shanghai, Nanjing, and Hangzhou. VOCs and ozone pollution in Hefei have been studied in previous research [18,19,20,21,22,23], with most studies focused on health risks and the ozone formation of VOCs during summer. However, there is still limited research on VOCs’ characteristics, sources, and their contribution to PM2.5 formation in winter, when PM2.5 pollution occurs frequently.
Therefore, in this study, field observations of atmospheric VOCs were conducted in Hefei during December 2019 with the aim of exploring the characteristics and sources of VOCs as well as their contribution to SOA formation during different periods of PM2.5 pollution in winter. The results are expected to provide support for policy formulation of VOC emission reduction and air quality improvement in Hefei. A flowchart that summarizes the study process is presented in Figure S1 in the Supplementary Materials for quick reference.

2. Materials and Methods
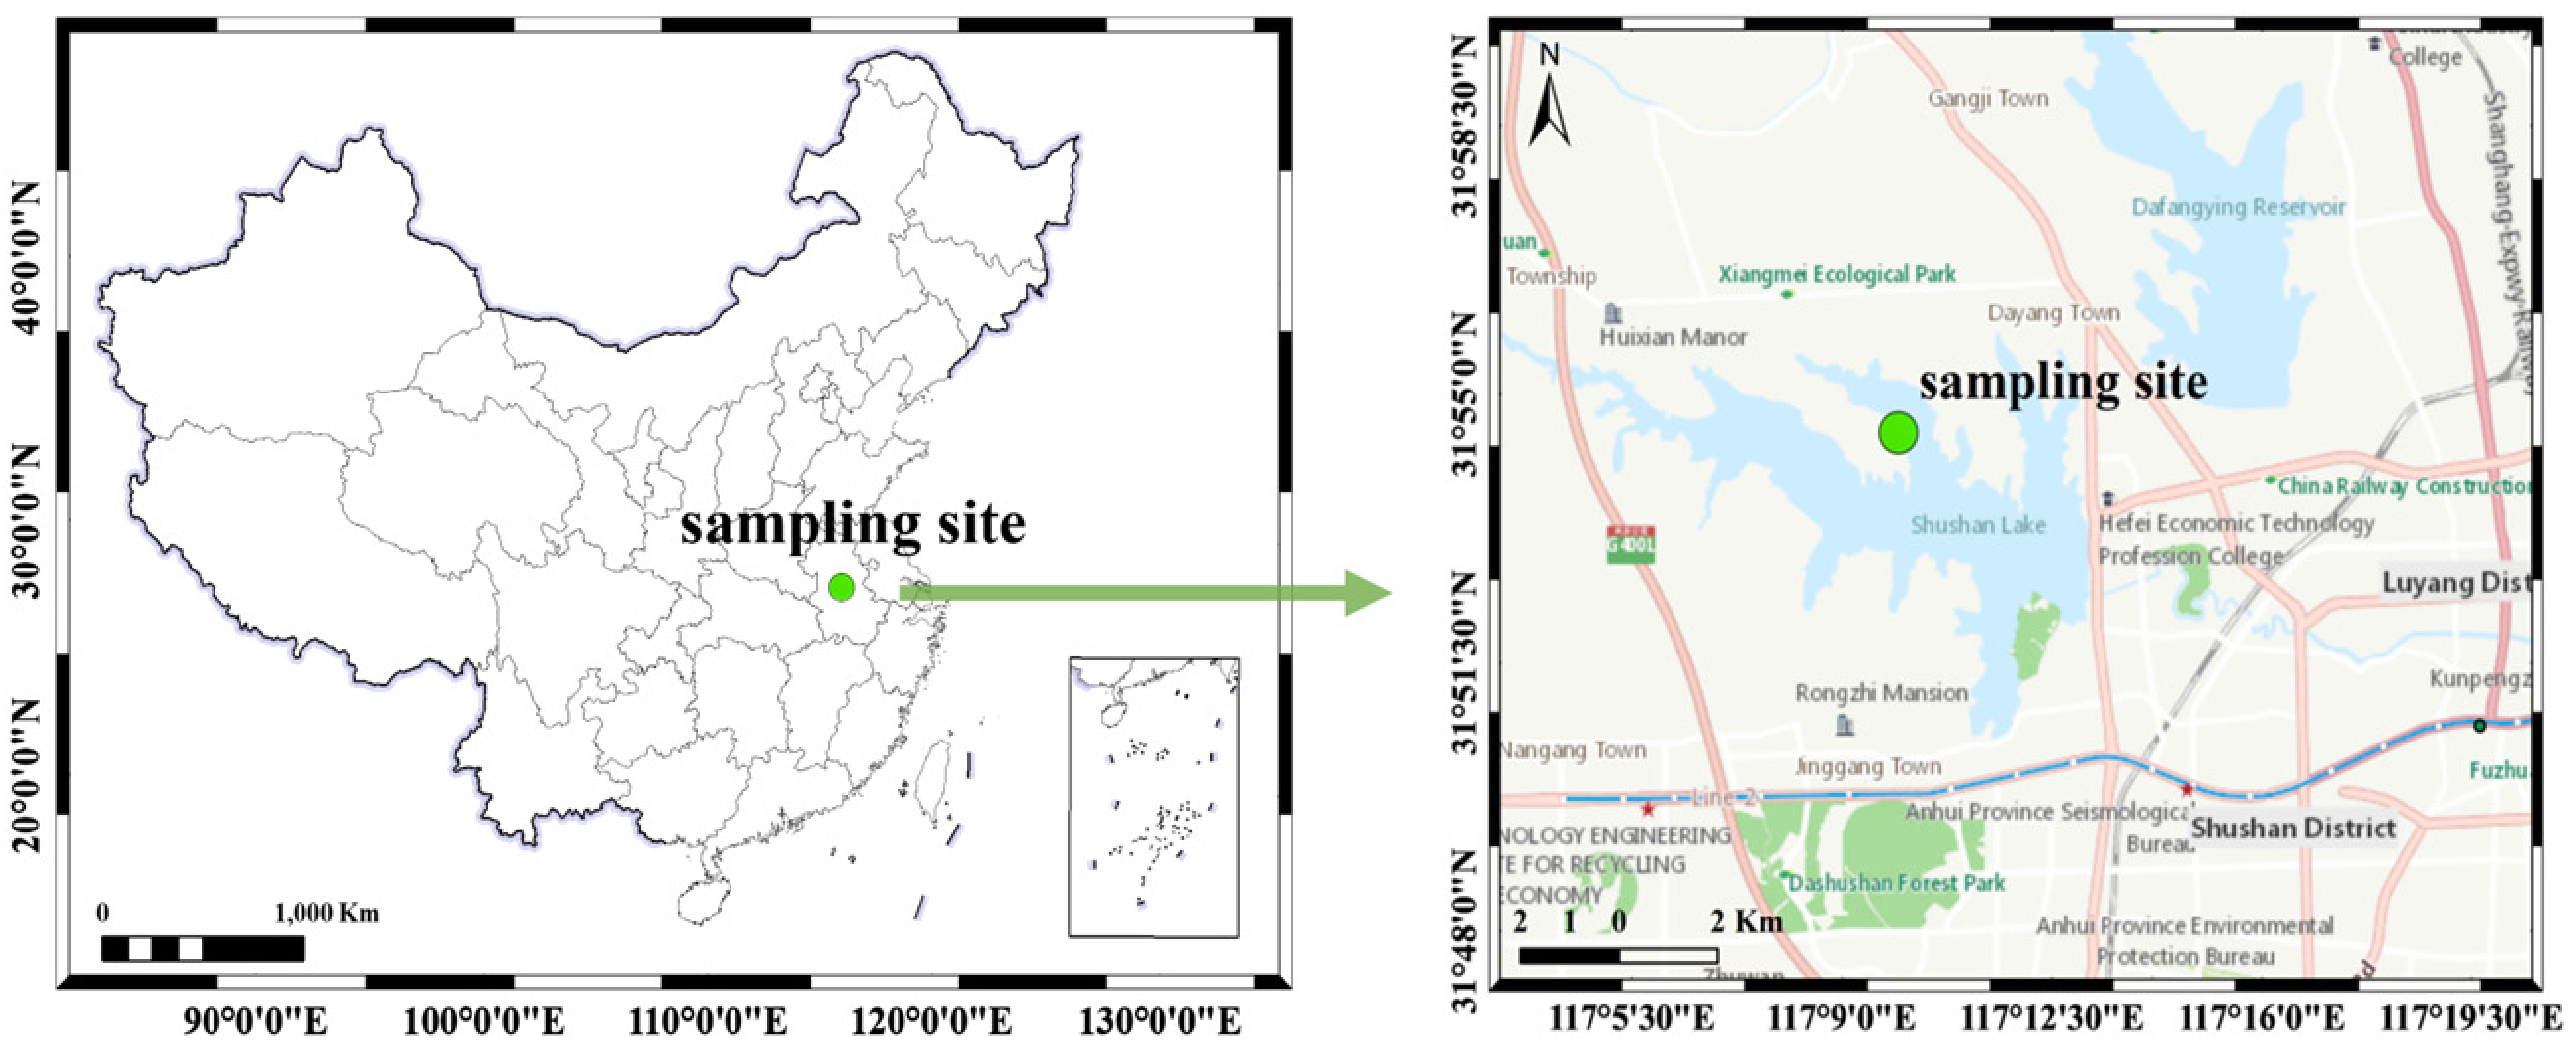
2.1. Field Work

Eighty-four VOCs samples were collected from 4 to 11 December 2019 (except 9 December) at the comprehensive observation laboratory for Environmental Optics of Anhui Institute of Optics and Fine Mechanics (31.903° N, 117.177° E) (Figure 1). Detailed description of the sampling site was elsewhere [19,21,23]. Briefly, the site was located on Science Island in the suburban area of Hefei, in proximity (<500 m) to the national air quality monitoring site (Dongpu Reservoir). The sampling equipment was set up on the third floor of the experimental building, approximately 10 m above the ground. After removing particles, ambient air was drawn through Teflon tubes (1 m × 4.35 mm) at a constant flow rate of 66.7 mL min−1 and pumped into a pre-vacuumed 2-L stainless steel canister using an oil-free vacuum pump (910 Canister Sampler, Xonteck Inc., Fremont, CA, USA). One-hour VOCs samples were consecutively collected daily from 6:00 to 18:00. Meteorological data, including temperature, relative humidity, wind direction, and wind speed, were obtained from a weather station (ZENO, Coastal Environmental Systems, Logan, UT, USA) situated at the same site [24]. Concentration data of air pollutants (PM2.5, PM10, NO2, O3, SO2, and CO) during the sampling period were downloaded from the public dataset at the Dongpu Reservoir monitoring station (http://www.cnemc.cn; accessed on 6 February 2024). They were measured via i-series analyzers from Thermo Fisher Scientific Inc., and by national standard methods [17], i.e., β-ray for PM2.5 and PM10, chemiluminescence for NO2, ultraviolet photometry for O3, pulse fluorescence for SO2, and infrared absorption for CO, respectively.

2.2. Laboratory Analysis

VOCs were analyzed using a pre-concentrator (Model 7100 pre-concentrator; Entech Instruments Inc., Simi Valley, CA, USA) coupled with a gas chromatography-mass selective detector, a flame ionization detector, and an electron capture detector (Agilent 5973N GC-MSD/FID/ECD, Agilent Technologies, Santa Clara, CA, USA). Detailed cryogenic concentration steps were described in our previous studies [25,26,27]. Briefly, a three-stage trapping system was used to concentrate target VOC compounds and remove interfering substances like N2, O2, CO2, and H2O. Then, target VOC compounds were separated and detected via the GC-MSD/FID/ECD systems. C2–C3 hydrocarbons were separated by a PLOT-Q capillary column (30 m × 0.32 mm × 20.0 µm; Agilent Technologies, USA) and detected by the FID, whereas the other species were separated by a DB-1 capillary column (60 m × 0.32 mm × 1.0 µm; Agilent Technologies, Santa Clara, CA, USA) and detected by the MSD and ECD. In this study, a total of 62 non-methane hydrocarbons were further analyzed for their characteristics, sources, and impacts on SOA formation because they are widely measured in ambient air and play key roles in atmospheric chemistry. These target compounds include 26 alkanes, 20 alkenes, 1 alkyne (acetylene), and 15 aromatics (Table S1 in the Supplementary Materials).

2.3. Quality Control and Quality Assurance

Each canister was subjected to leak detection and inside-wall adsorption tests before use to ensure stable storage of the target compounds. Before sampling, each canister was cleaned by repeatedly filling and evacuating with high purity nitrogen gas at least five times. After cleaning, 20% of the canisters were randomly selected for blank tests to ensure the target compounds were not presented below method detection limits. Additionally, daily system blank tests were also conducted before sample analysis to ensure that the pre-concentrator system was clean.
To accurately quantify VOCs, standard curves were established for each VOC using a diluted PAMS standard mixture (100 ppb, Spectra Gases Inc., Princeton, NJ, USA) and a TO-14 standard mixture (100 ppb, Spectra Gases Inc., Fairfield, NJ, USA). Five concentration gradients (0.5, 1, 5, 15, and 30 ppb) and a humidified zero air were analyzed, and the linear correlation coefficients (r2) of standard curves were all greater than 0.99. A working-standard gas (approximately 5 ppb) provided by the Rowland/Blake research group at the University of California, Irvine, was analyzed daily to ensure the validity of the quantification using the standard curves. Internal standards (bromochloromethane, 1,4-difluorobenzene, and chlorobenzene-d5) were also used to correct the fluctuation of detectors. Details were reported in our previous study, and the measurement accuracies of VOCs were within 10% [25,26,27]. The method detection limits (MDLs) for each VOC compound are presented in Table S1.

2.4. OH Radical Loss Rate (LOH)

To better study the impact of VOCs’ secondary transformation on the atmospheric environment, the loss rate of OH radicals (LOH) is usually employed to evaluate the chemical reactivity of various VOC species. The OH radical loss rate is calculated using Equation (1):
L O H i = V O C i × K O H i
where LOHi represents the OH radical loss rate (s−1) for VOCs component i, VOCi represents the concentration for VOCs component i (molecule cm−3), and KOHi is the reaction rate constant between VOCs component i and the OH radical (cm3 molecule−1 s−1). The VOCi is calculated from the measured mixing ratio of species i (ppb) at the average temperature (281 K) and pressure (102,873 Pa) during the sampling periods, i.e., 1 ppb equals 2.65 × 10¹⁰ molecules cm−3 in this study. The value of KOHi is calculated by temperature-dependent expression, as recommended in previous study [28]. Details are presented in Table S1.

2.5. Secondary Organic Aerosol Formation Potential (SOAFP) Calculation

As a significant component of PM2.5, SOA is generated through oxidation of VOCs and gas-particle partitioning, but the rate at which different VOCs produce SOA varies. SOAFP is a parameter used to estimate the contribution of individual VOCs to SOA formation. In this study, the fractional aerosol coefficient (FAC) value compiled by Grosjean [29] was used to estimate the contribution of VOCs to SOA formation and thus, to derive the relative importance of different VOCs in SOA formation. The SOAFP is calculated by the formula shown below:
S O A F P i = F A C i × V O C i 0
where SOAFPi represents the SOA formation potential of VOCs component i (µg m−3), FACi is the SOA formation coefficient of VOCs component i, and VOCi0 is the initial concentration of VOCs component i (µg m−3).
In an ambient environment, VOC concentrations are typically measured after atmospheric reactions rather than as initial emissions. The observed VOC concentrations can be converted to initial concentrations using the following relationship:
V O C i 0 = V O C i t 1 F V O C r i
where VOCit represents the observed concentration of component i (µg m−3) and FVOCri is the mass fraction of VOC component i involved in the reaction (%). FACi and FVOCri in Equations (2) and (3) are derived from smog chamber data [29,30] and presented in Table S1.
Recent studies have found that isoprene and benzene are also important SOA precursors because their oxidation products can react with hydroxyl radicals or photolyze in sunlight to produce SOA [31,32,33]. It has been pointed out that isoprene’s SOA yield ranges from 0.9% to 3.0%, and benzene’s SOA yield ranges from 8% to 25% [34,35]. During the sampling period, the measured concentrations of isoprene and benzene were relatively high, suggesting their contributions to SOA formation should not be overlooked. Therefore, benzene and isoprene were also considered in the calculation of SOA formation potential in this study with the FAC coefficients set at 2%, as referenced by Lu et al. [36].

2.6. Positive Matrix Factorization (PMF) Model

The positive matrix factorization (PMF) model is an effective receptor model for source apportionment proposed by the U.S. Environmental Protection Agency (EPA) in 1993, which quantifies the contribution of each source to the receptor based on the composition and characteristics of the source [37]. With ongoing development, the PMF model has been widely applied in the source apportionment of atmospheric particulate matter and volatile organic compounds [12,38,39,40,41]. The PMF receptor model determines source contributions and distributions by minimizing the objective function (Q). In this study, to identify the optimal solution that minimizes the objective function (Q) during the computation, the PMF receptor model was run 100 times. The uncertainty (Unc) of the data samples was calculated based on sample concentration and detection limits. For compounds with concentrations above the Method Detection Limit (MDL), uncertainty values were calculated using Equation (3). For compounds with concentrations below the MDL, their concentrations were substituted with 1/2 of the MDL, and their uncertainty values were replaced with 5/6 of the MDL [14,38]. Considering the concentration levels and tracer roles of VOCs components, 20 representative VOCs components were selected for input into the model (Table S1).
U n c = ( 0.5 × MDL ) 2 + ( EF × Concentration ) 2
where U n c represents uncertainty, MDL denotes the method detection limit, EF refers to the error fraction (an empirical value of 20% was used in this study [38,39,40,41]), and Concentration indicates the concentration of each component.
It is important to note that the results of the PMF model are susceptible to the input variables as well as the number of factors. Additionally, the variability of the source profiles and the presence of overlapping sources can also complicate the interpretation of the results. To ensure stable and reliable source apportionment, the factor numbers were set from 2 to 9, and, finally, 6 factors were determined to be optimal based on the ratio of Qtrue/Qrobust, Qtrue/Qexpected and the interpretability of factors.

3. Results and Discussion

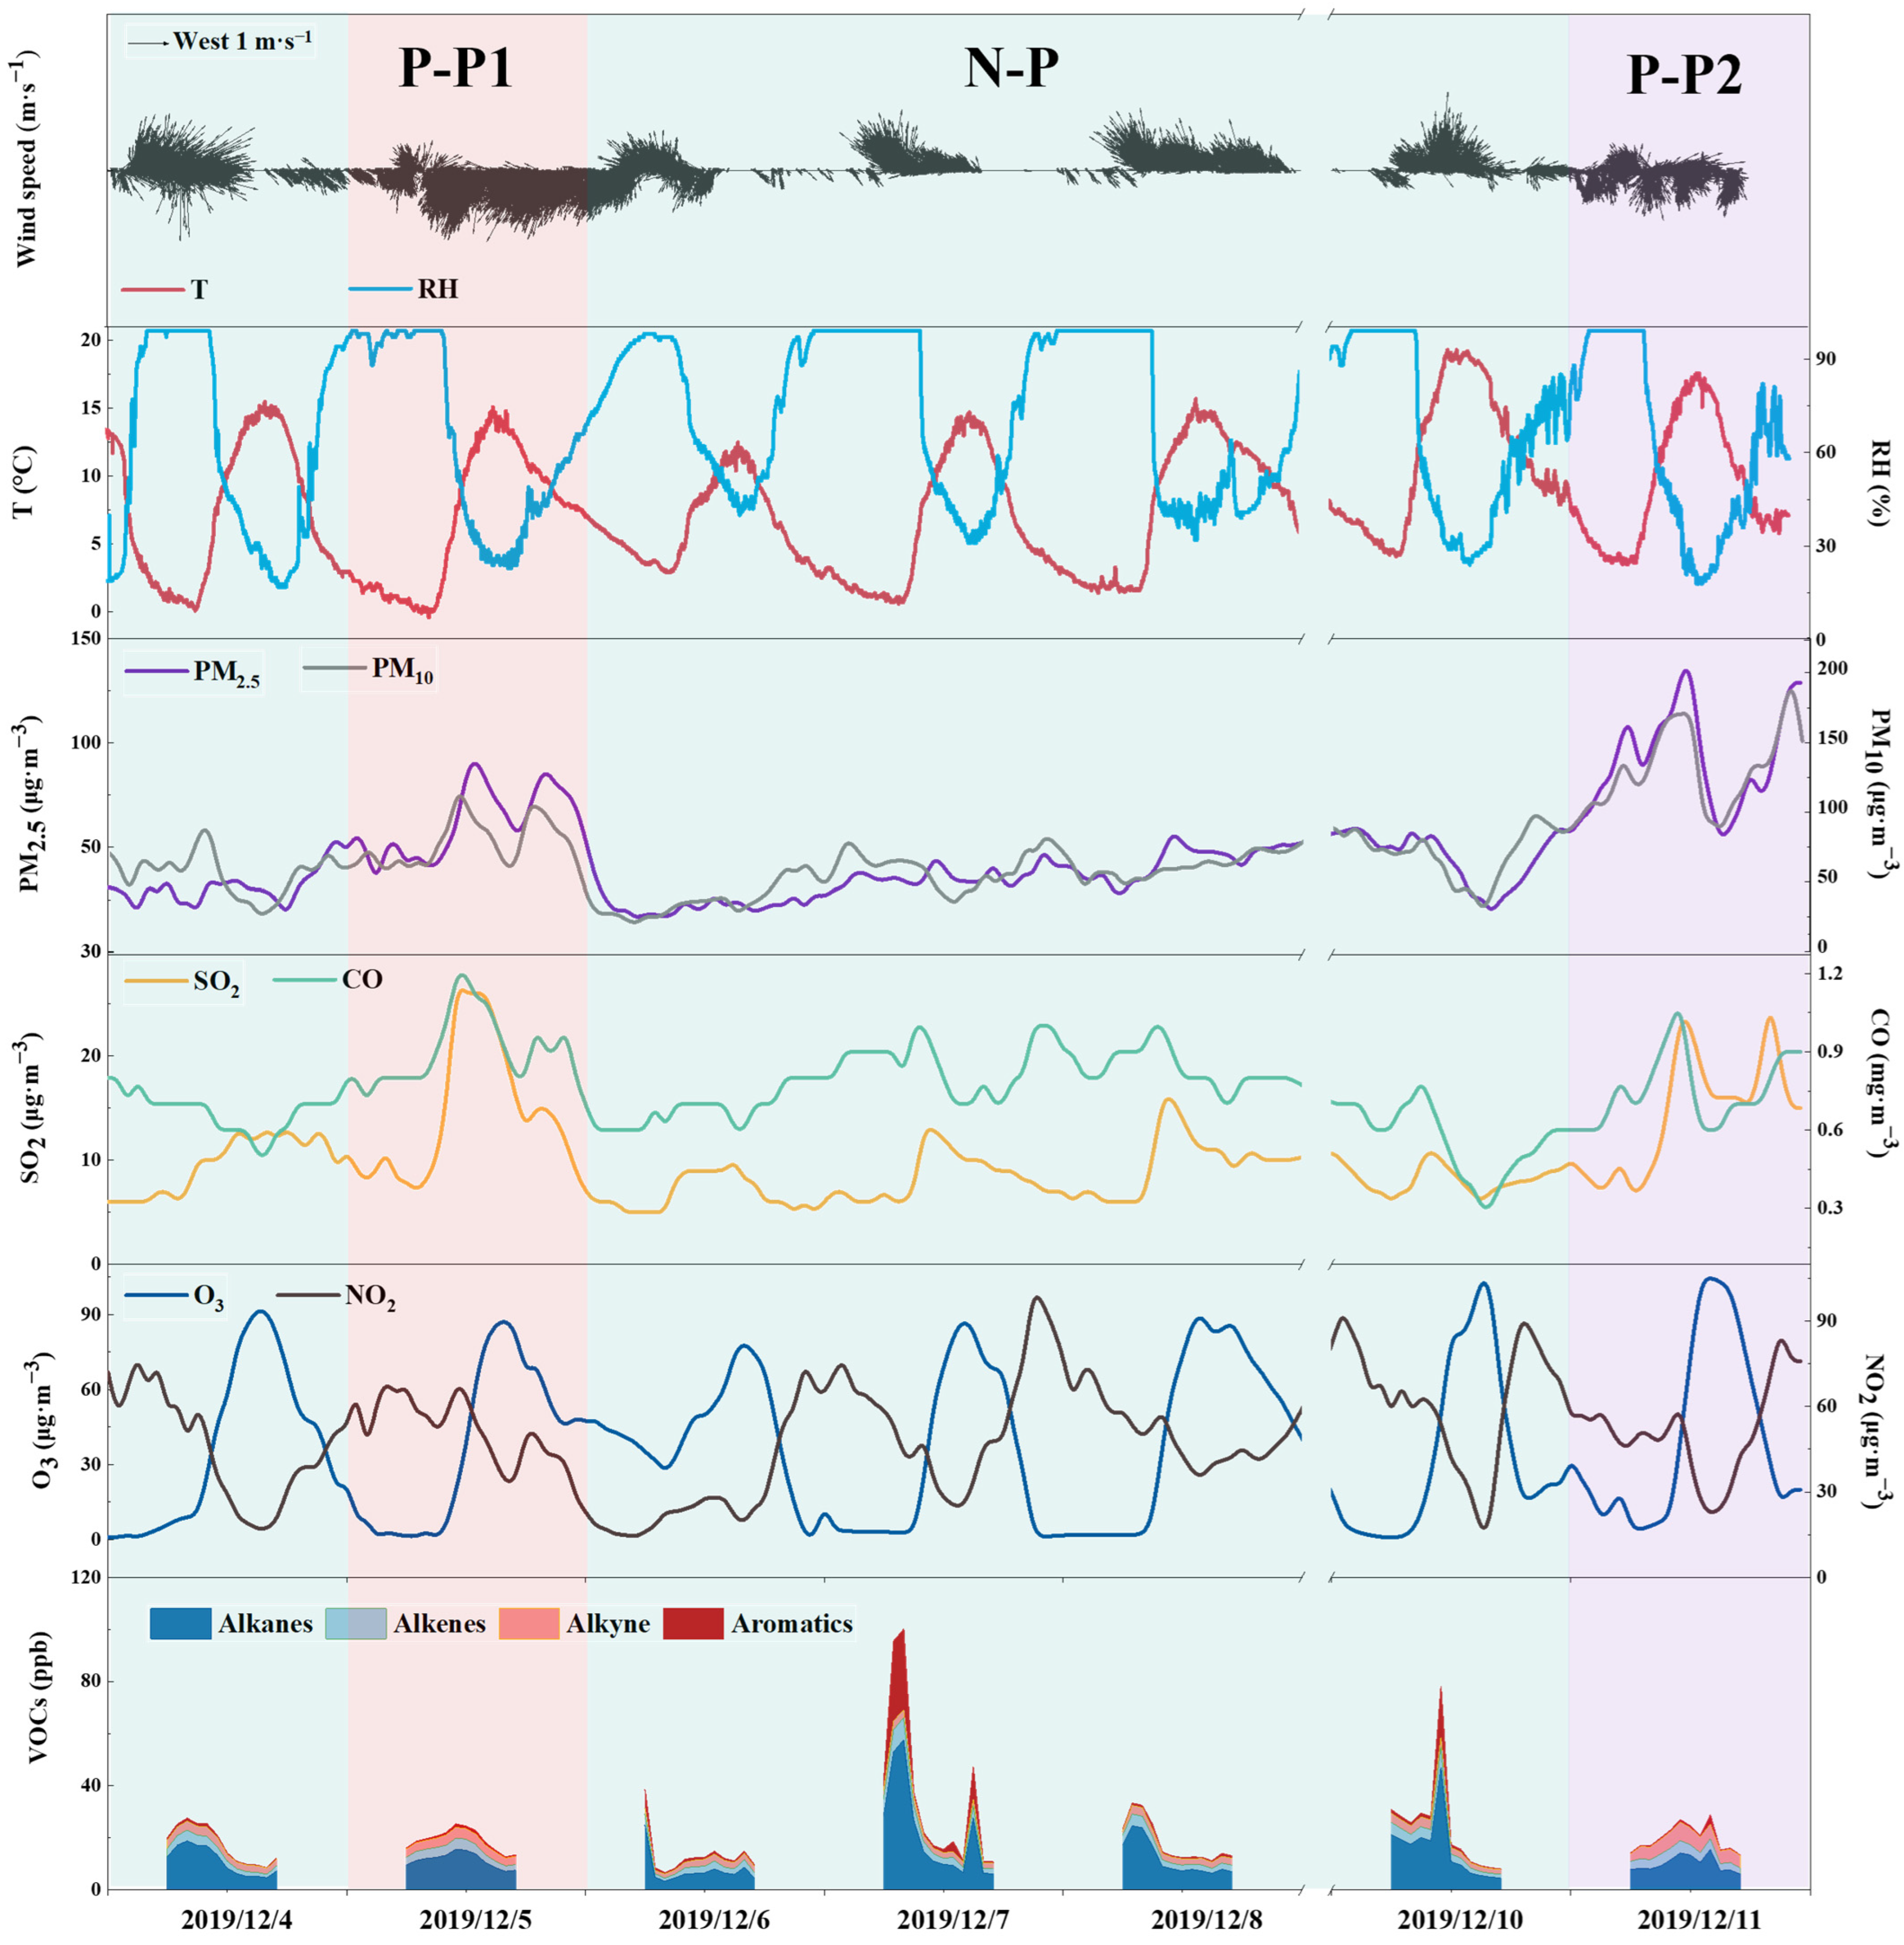
3.1. Concentration Characteristics and Chemical Composition of VOCs

The time series of meteorological parameters (wind direction, wind speed, temperature, and relative humidity) and air pollutants (PM2.5, PM10, SO2, CO, O3, and NO2) during the observation period are presented in Figure 2. Throughout the observation period, average temperature and relative humidity were 8.0 ± 4.9 °C and 67.9 ± 27.3%, respectively, but wind speed varied significantly (0–4.1 m/s). For the air pollutants, the diurnal variations of O3 and NO2 concentrations exhibited a negative correlation, with relatively stable daily averages ranging from 31.1 to 42.0 µg m−3 and 30.8 to 62.1 µg m−3, respectively. Concentrations of PM2.5, PM10, CO, and SO2 showed considerable variations during the observation period. Notably, the daily average concentrations of these four pollutants were higher on December 5 and December 11 than those on the other observation days. The daily average PM2.5 concentrations on December 5 and December 11 were 61.6 ± 17.0 µg m−3 and 89.8 ± 25.0 µg m−3, respectively, with the latter exceeding the national secondary standard of 75 µg m−3 [17]. On the other days, PM2.5 concentrations were relatively lower, with an average of 36.2 ± 12.0 µg m−3. To compare VOCs variation in different PM2.5 levels, this study defines the pollution event on December 5 as PM2.5 pollution period 1 (P-P1), the event on December 11 as PM2.5 pollution period 2 (P-P2), and the remaining days as the non-pollution period (N-P).
The cumulative bar chart of VOC groups (alkanes, alkenes, alkyne, and aromatics) is also shown in Figure 2. It was obvious that relatively high mixing ratios of VOCs occurred in the morning (6:00–10:00) on 7 December with the highest value (99.9 ppb) at 8:00. As compared in Table S2, the mixing ratios of total VOCs and their major compositions (alkanes, alkenes, and aromatics) were all significantly higher during the morning of 7 December than those on December 8. The temperatures, relative humidities (RHs), and dominant wind direction were similar on the two days, whereas wind speed on 7 December (0.3 m s−1) was lower than that on December 8 (0.8 m s−1) (Table S2). The lower wind speed could have lead to the increase of VOCs mixing ratios on 7 December. The influences of the emission source were further analyzed. As shown in the representative chromatogram for 2019/12/7 8:00 (Figure S2), the peaks with notably high responses were identified as isopentane and toluene, with quantified mixing ratios of 17.4 ppb and 26.1 ppb, respectively. In addition, elevated mixing ratios of propane, butanes, and n-pentane were also observed among morning samples on 7 December. Isopentane is a typical tracer of gasoline evaporation [8], and C3–C5 alkanes are generally associated with vehicle exhaust emissions [42,43], implying that the increased mixing ratios may be influenced by vehicular emissions. In addition to vehicular emissions, toluene could also be emitted from industrial solvent, which was confirmed by the extremely high ratios of toluene to benzene (as much as 46.2) during the morning of 7 December [44,45]. Moreover, the ratio of m/p-xylene to ethylbenzene (X/E) ranged from 2.2 to 3.4 on the morning of 7 December, which was higher than those on December 8 (1.1–1.5), indicating the primary influence of local emission sources on 7 December [46,47]. Hence, the high levels of VOCs in the morning of 7 December were probably influenced by the lower wind speeds and increased local source emissions, such as vehicle emissions and industrial solvent.
In this study, the average mixing ratios of alkanes, alkenes, alkyne, and aromatics were 12.6 ± 9.7, 3.2 ± 1.5, 3.2 ± 1.2, and 2.1 ± 5.1 ppb, respectively, accounting for 59.9%, 15.3%, 15.0%, and 9.8% of the total VOCs (21.1 ± 15.9 ppb), respectively. In terms of different periods, the average VOCs mixing ratio during the N-P period was 21.8 ± 18.5 ppb, while comparable mixing ratios were observed during the P-P1 and P-P2 period, with values of 19.0 ± 4.0 and 19.7 ± 4.9 ppb, respectively. It is noteworthy that the diurnal variation of VOCs on PM2.5 pollution periods differed significantly from the non-pollution periods. As shown in Figure 3a, during the N-P period, VOCs mixing ratios tended to be higher in the morning and lower in the afternoon, peaking between 7:00–8:00. However, during P-P1 and P-P2 periods, the highest VOCs mixing ratios were observed at noon, which was mirrored by the trends of PM2.5, PM10, CO, and SO2 concentrations.
Compared with previous studies in the same season (Table 1), the VOCs mixing ratio in Hefei (21.1 ppb) was closer to the observed value in Wuhan (21.2 ppb) [11], but it was significantly lower than those in Nanjing (38.7 ppb) [48] and Zhengzhou (36.7 ppb) [49], and it was slightly lower than those in Beijing (23.4 ppb) [50], Shanghai (24.5 ppb) [10], and Jinan (23.9 ppb) [51]. Compared to cities abroad, the VOCs mixing ratio in Hefei was relatively consistent with the observations recorded in Vancouver (19.2 ppb) [52], slightly lower than that in Nagoya from March 2003 to November 2004 (28.6 ppb) [53], and considerably lower than those in Seoul (45.7 ppb) [54] and Houston (30.5 ppb) [55]. When compared with summertime observation, the VOCs mixing ratio in winter 2019 in Hefei (this study) was much higher than that in summer 2020 in Hefei (13.2 ppb) [22]. In addition, the proportion of alkenes and alkyne significantly decreased from 30.3% in winter 2019 (this study) to 19.8% in summer 2020 [22], suggesting that there may be seasonal differences in the sources of VOCs.
Alkanes were the dominant compounds with the highest mixing ratios during the observation period. The top ten species, in descending order of average mixing ratio, were propane, acetylene, isopentane, ethane, n-butane, ethylene, toluene, isobutane, 1-butene, and n-pentane, accounting for 90.2% of total VOCs. Figure 3b compares the percentage of VOCs groups in different periods. The contributions of alkenes and alkyne significantly increased during the P-P1 and P-P2 periods compared to the N-P period. In particular, the percentages of alkenes and alkyne were 18.5% and 27.4% in P-P2, respectively, which were 1.3 and 2.3 times higher than those in N-P, respectively. Acetylene is generally considered as a tracer of incomplete combustion [56,57], thus, combustion-related sources may contribute more significantly to VOCs mixing ratios during the PM2.5 pollution periods. For comparison, the proportions of alkenes and alkyne in Hefei were higher than those reported in the other cities in the YRD region (Table 1). In contrast, the proportion of aromatics in Hefei was relatively low, accounting for 9.8% in winter (this study) and 12.2% in summer [22]. This proportion was comparable to the winter observations in Jinan, Shanghai, and Guangzhou [10,41,51] but lower than the proportions observed in cities such as Beijing, Hangzhou, and Zhengzhou [13,49,50]. Compared to cities abroad, Hefei exhibited a relatively higher contribution of alkyne, while the contribution of aromatics was consistent with the observations from Vancouver (9.5%) and Houston (9.3%).
Table 1. Comparison of VOCs mixing ratios and percentage of components between Hefei and other cities in China and around the world.
Percentage (%)
CitySampling TimeVOCs (ppb)AlkanesAlkenesAlkyneAromaticsReference
BeijingOctober–November 201423.454.0%12.0%13.0%21.0%[50]
TianjinNovember 2018–March 201930.656.5%21.2%9.5%12.7%[58]
JinanNovember–December 202123.959.6%17.2%10.7%12.5%[51]
ShanghaiDecember 201924.569.8%11.8%7.4%11.0%[10]
NanjingDecember 2019–January 202038.763.5%23.5%- *13.0%[48]
HangzhouJanuary–February 202124.964.0%12.5%8.5%15.0%[13]
WuhanFebruary 202121.262.9%18.2%11.9%7.0%[11]
ZhengzhouDecember 201936.760.0%13.3%9.4%17.3%[49]
GuangzhouJanuary 202034.075.4%10.1%5.4%9.1%[41]
HefeiAugust 202013.268.0%19.8%12.2%[22]
Vancouver2012–201619.274.7%11.0%4.8%9.5%[52]
SeoulJanuary 2018–December 201945.766.3%13.3%3.0%17.3%[54]
NagoyaDecember 2003–November 200428.657.6%17.0%6.7%18.8%[53]
HoustonAugust 2006–September 200630.577.0%13.6%- *9.3%[55]
HefeiDecember 201921.159.9%15.3%15.0%9.8%This study
* The symbol “-” denotes that the information is not mentioned.

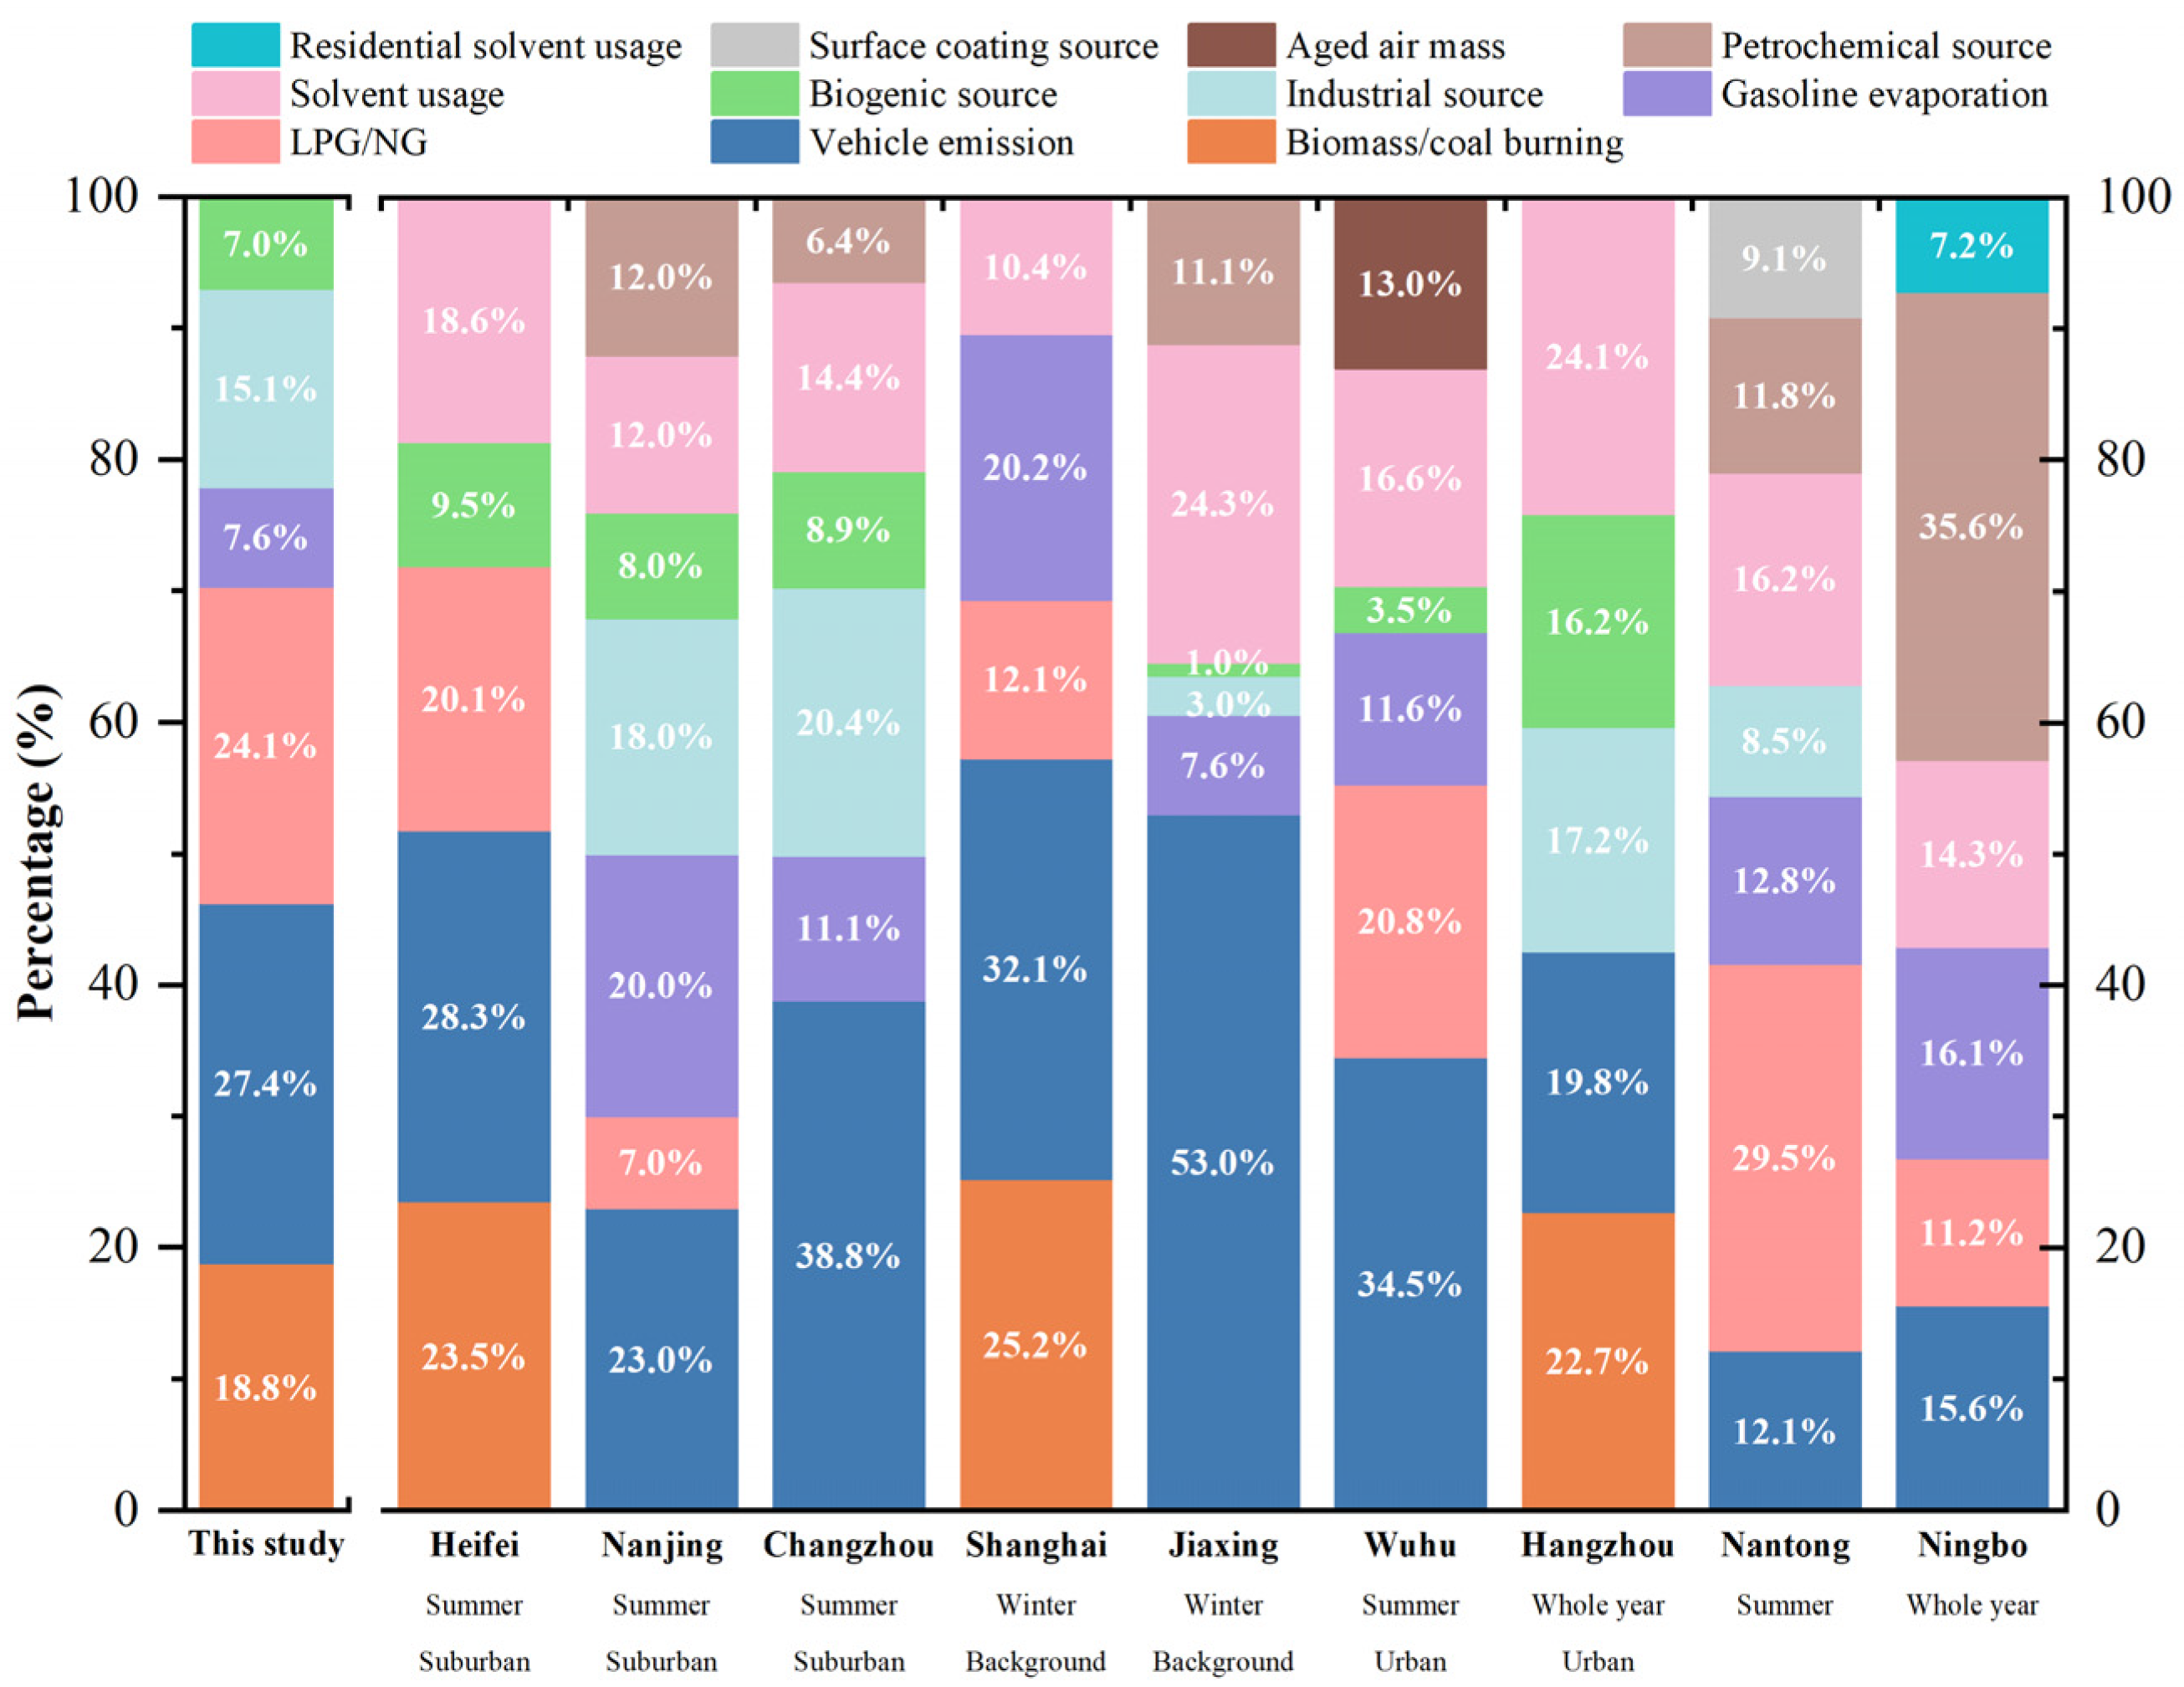
3.2. Source Apportionment of VOCs

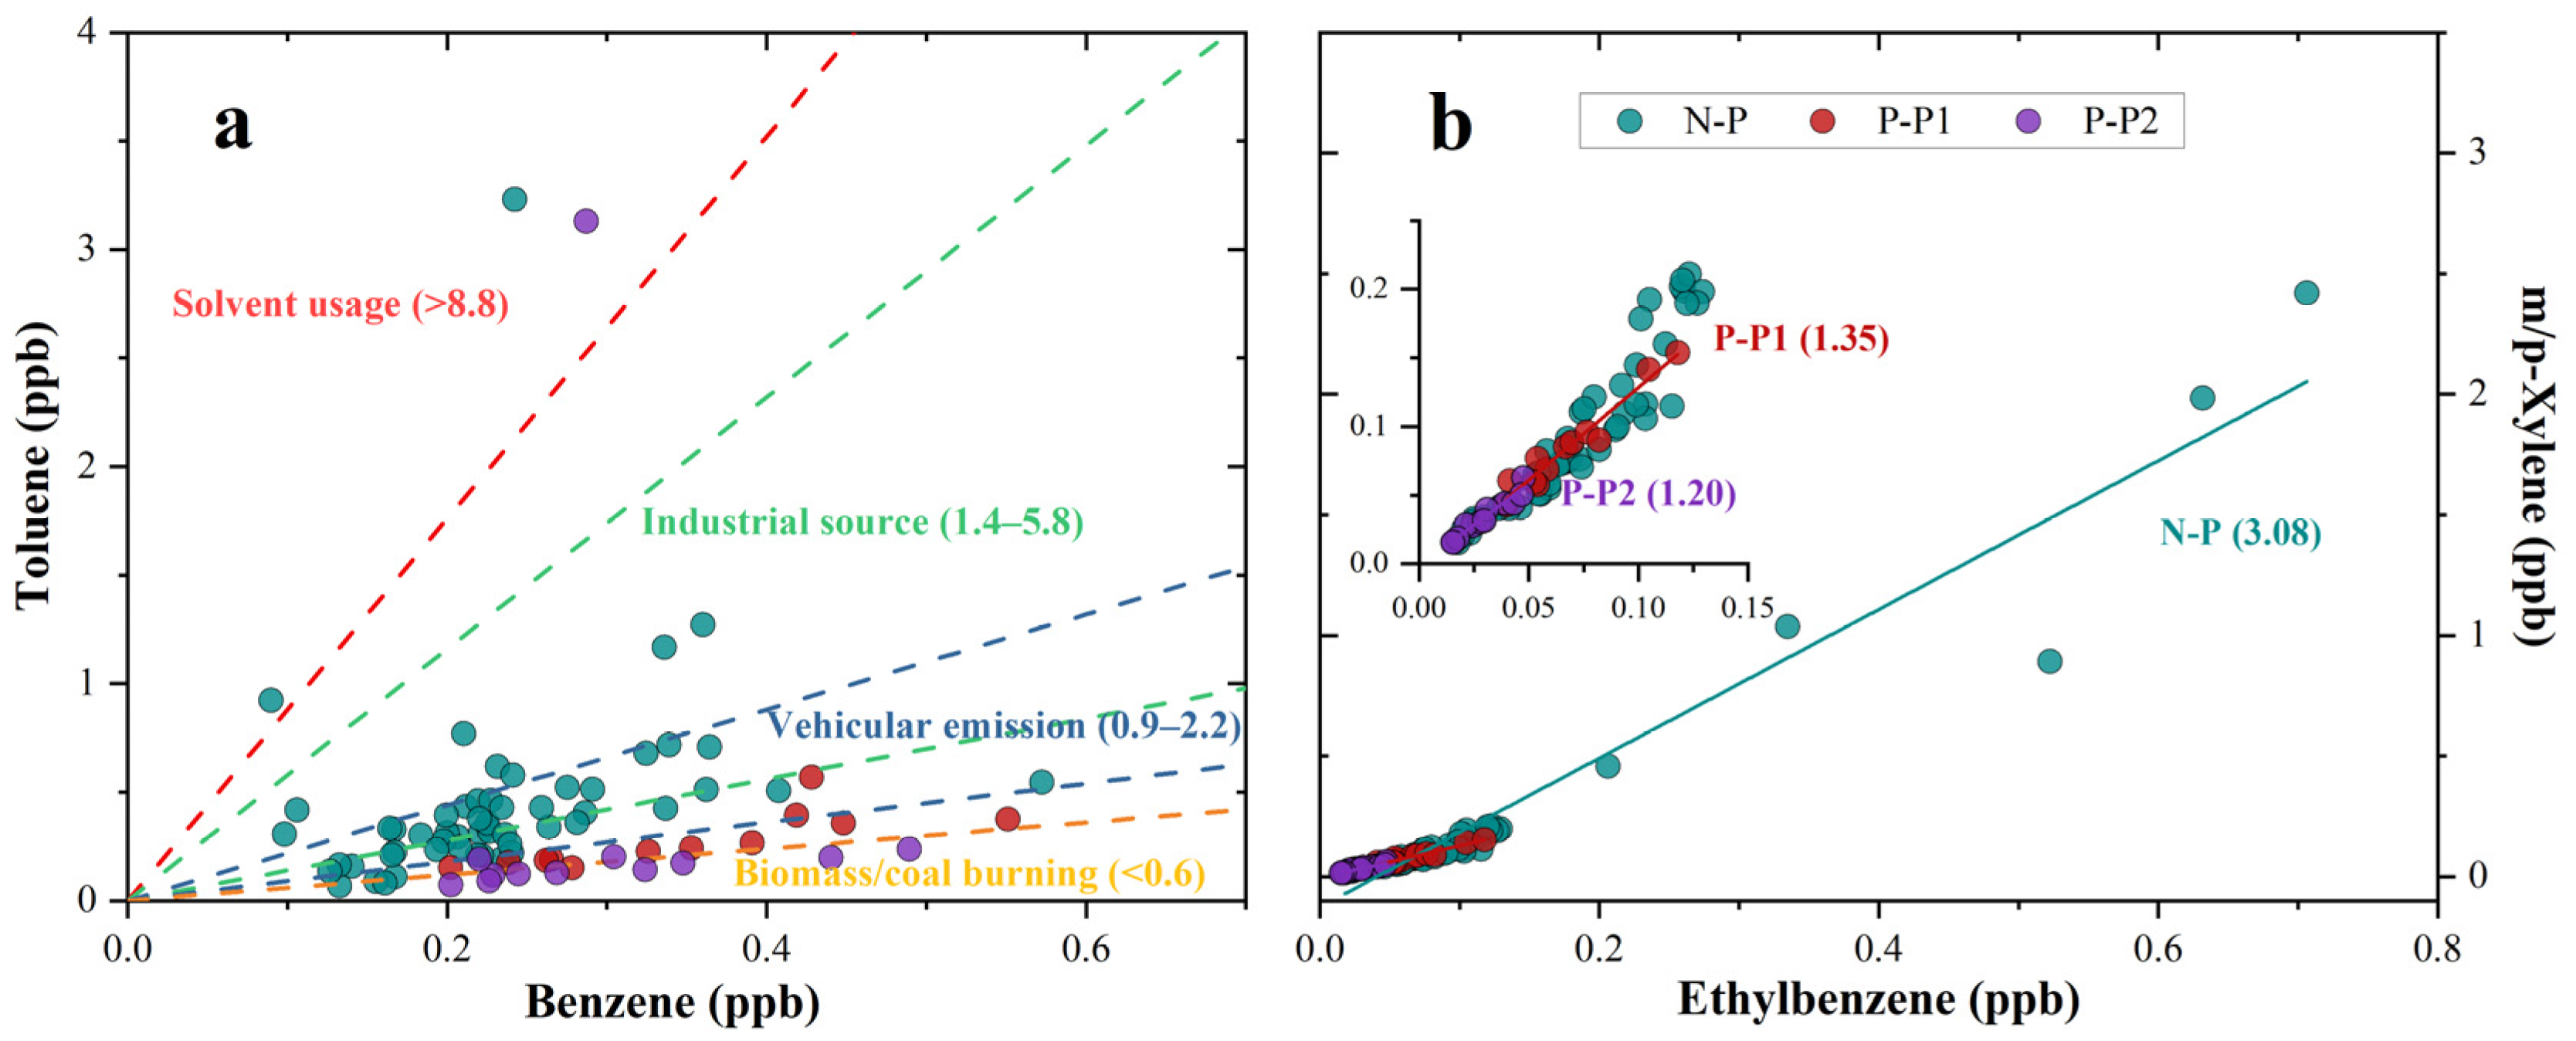
3.2.1. Diagnostic Ratios of VOCs
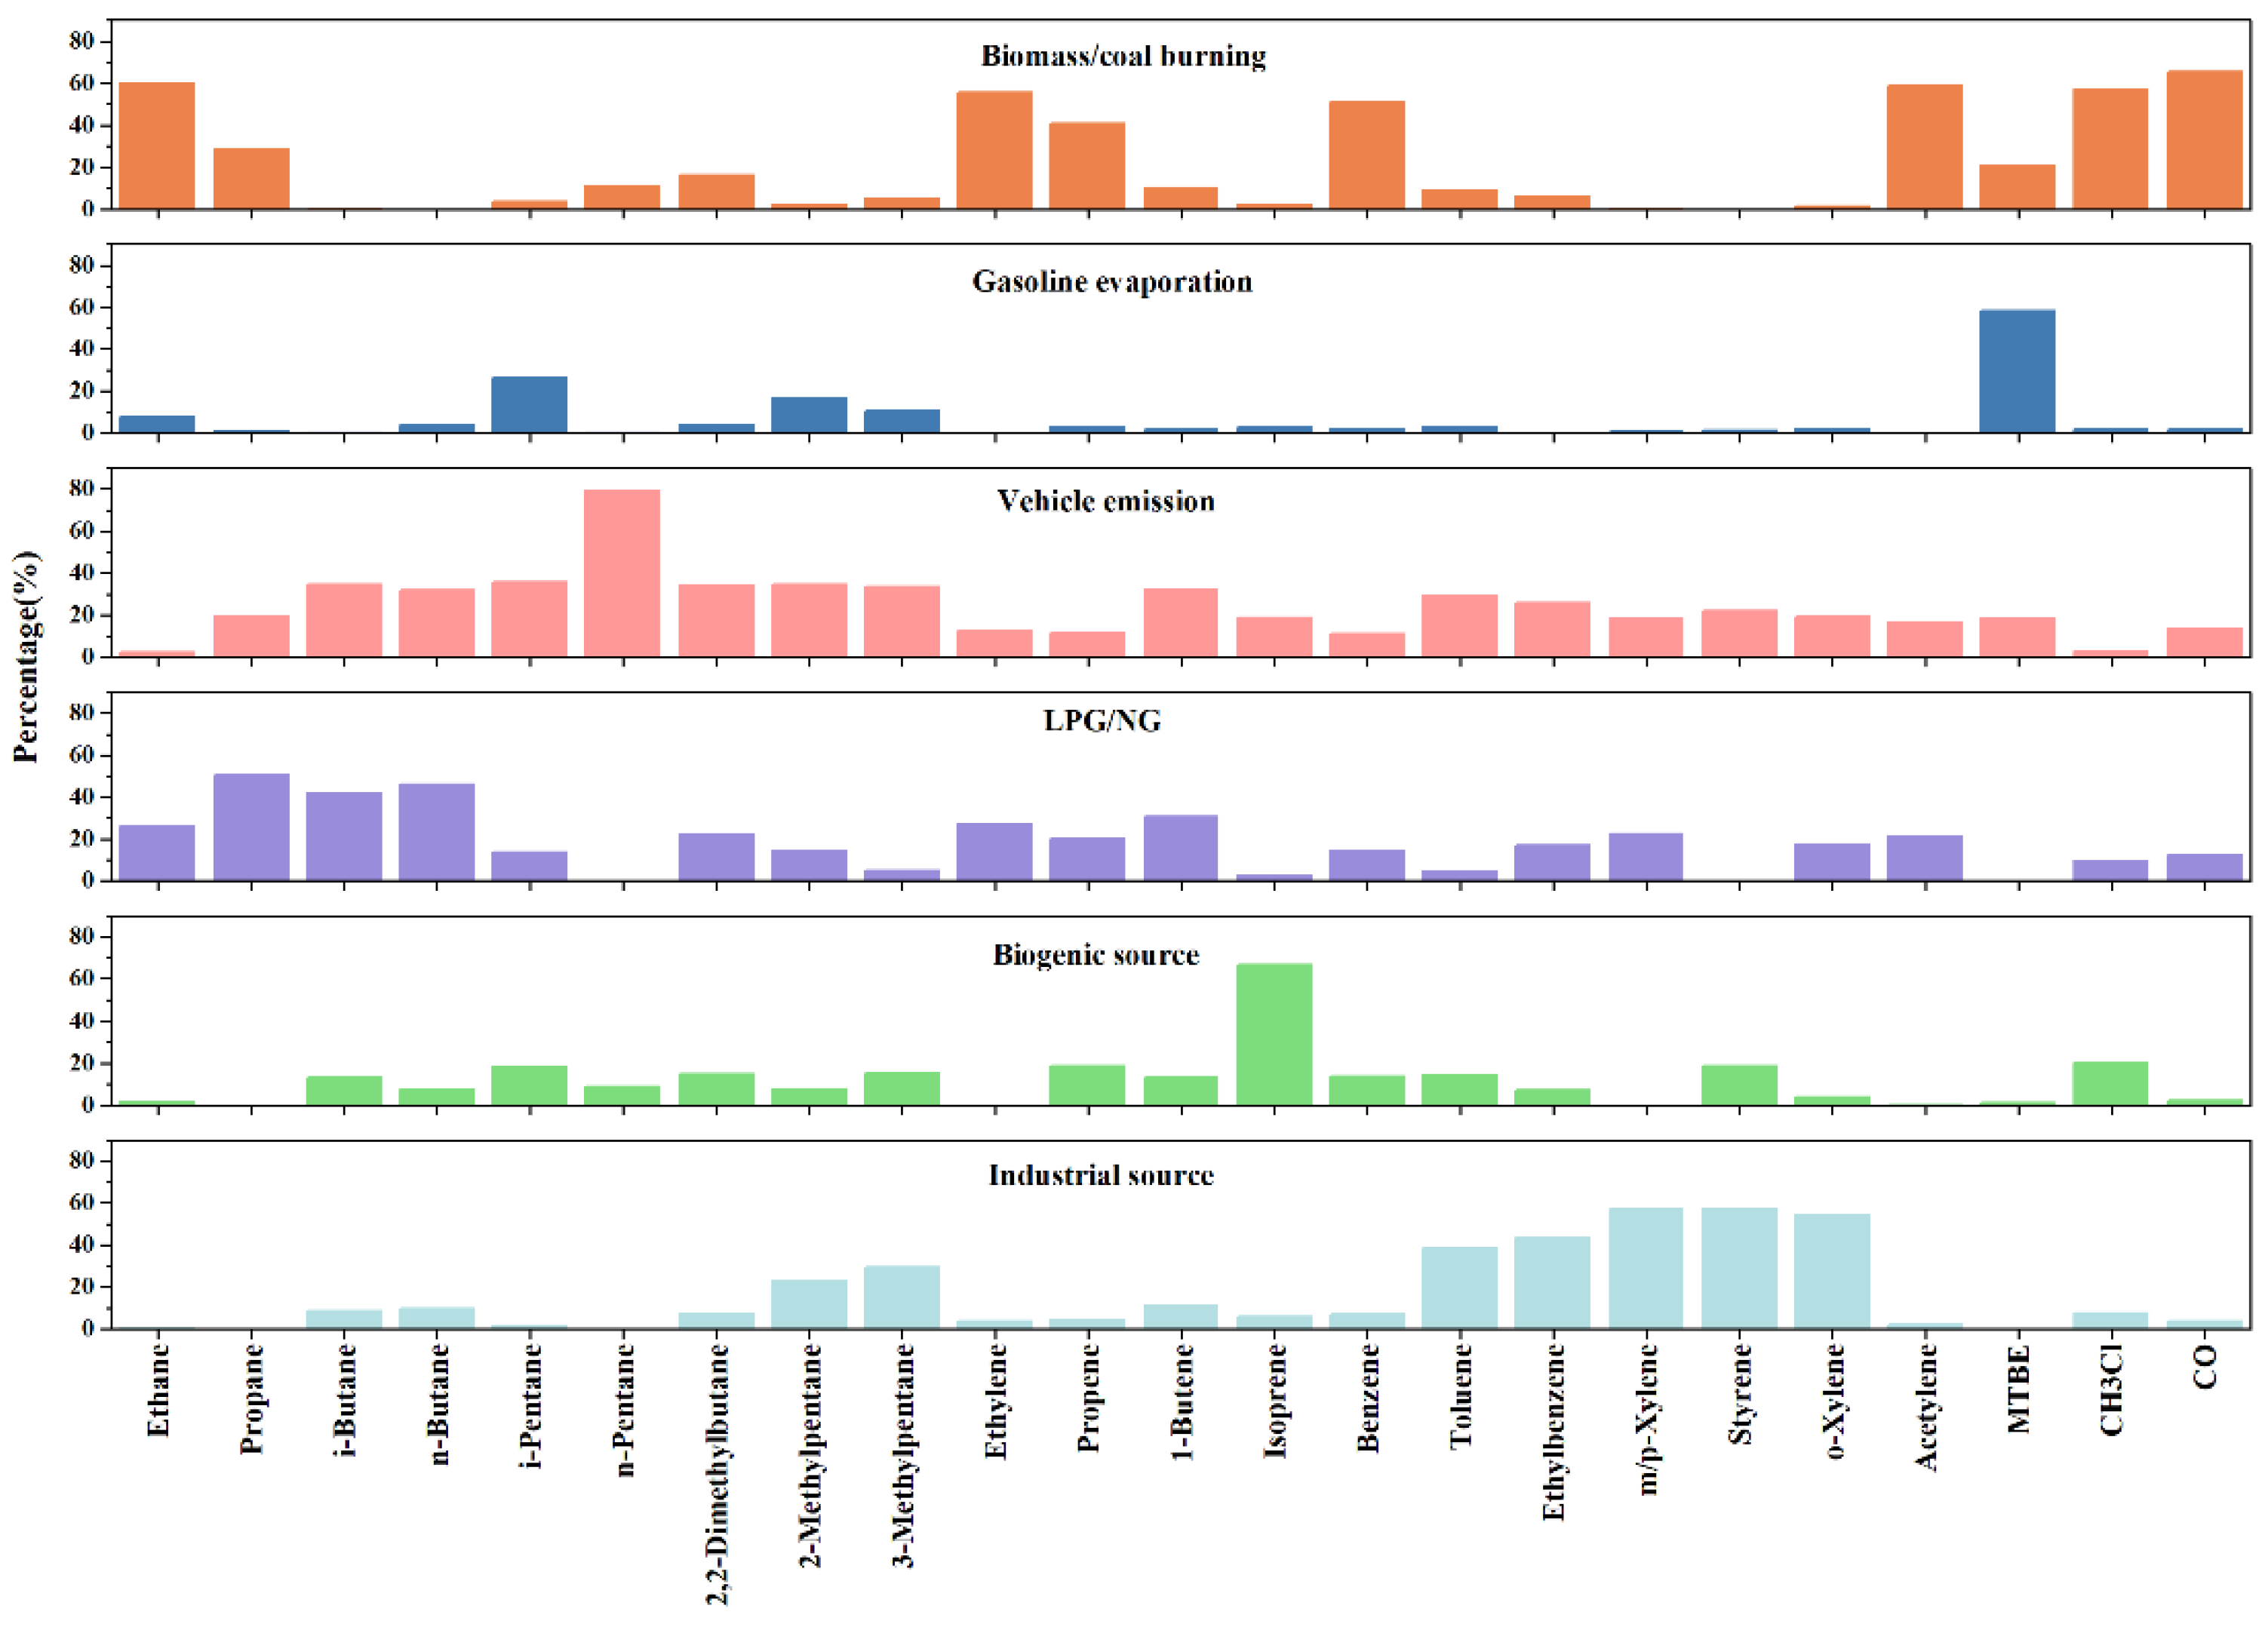
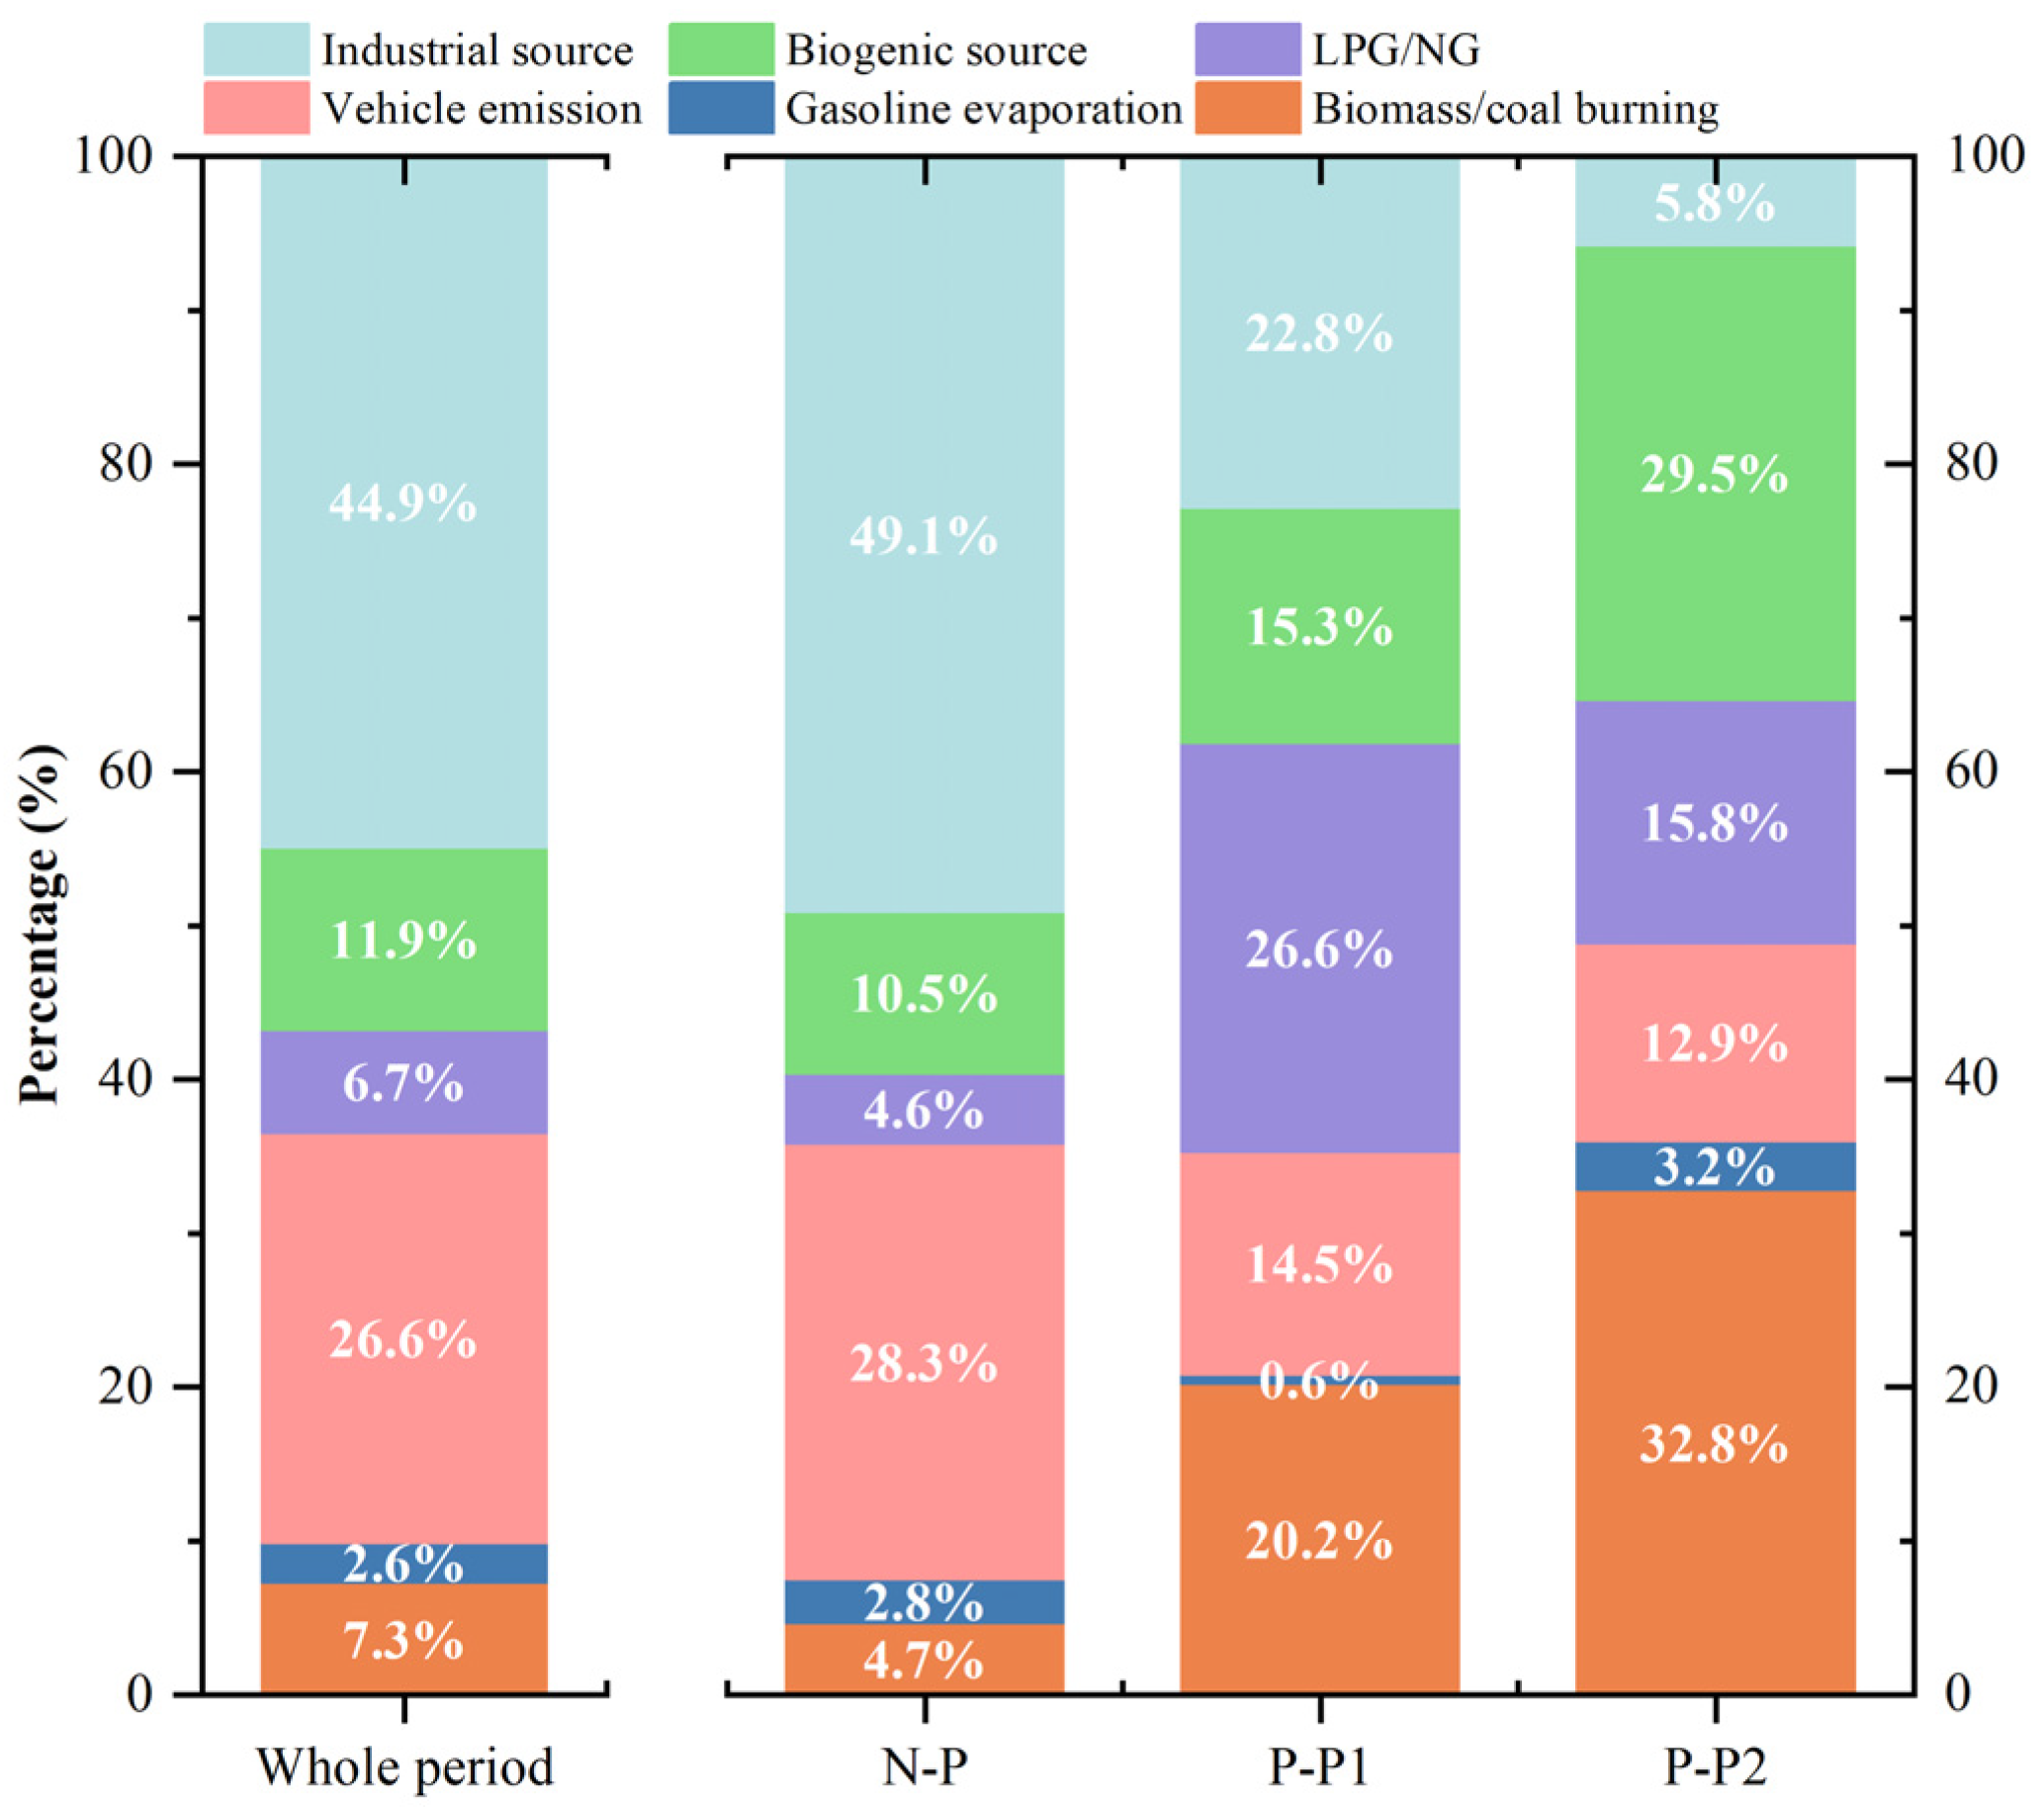
The ratio of compounds with similar atmospheric lifetimes can reflect source characteristics [59,60]. Previous studies indicate that in areas seriously affected by vehicle emissions, the toluene to benzene (T/B) volume ratio ranges from 0.9 to 2.2 [61,62]. The T/B ratio is greater than 8.8 for solvent use [44,45] and ranges from 1.4 to 5.8 for industrial processes [63,64]. For biomass/coal burning sources, the T/B ratio is less than 0.6 [65,66]. In this study, during the non-pollution (N-P) period, the T/B ratio mostly ranges from 1.0 to 2.0, while during the pollution periods P-P1 and P-P2, the T/B ratio ranges from 0.4 to 0.7 (Figure 4a). This indicates a greater influence of vehicle emissions during the N-P period and a larger impact of biomass/coal burning sources during the PM2.5 pollution periods.
The reaction rate of hydroxyl radicals (OH) with m/p-xylene is faster than with ethylbenzene [67,68]. Therefore, the ratio of m/p-xylene (X) to ethylbenzene (E) is commonly used as an indicator of photochemical aging [46,47]. A higher X/E ratio indicates fresher air masses (local sources), while a lower X/E ratio indicates more aged air masses (long-range transport). In this study, significant correlations between m/p-xylene and ethylbenzene were observed during the N-P, P-P1, and P-P2 periods (r2 = 0.93–0.95, p < 0.01) (Figure 4b). The X/E ratios during the N-P, P-P1, and P-P2 periods were 3.08, 1.35, and 1.20, respectively, suggesting that during the P-P1 and P-P2 periods, the air masses were more aged and influenced by long-range transport, while air masses during the N-P period were fresher.

3.2.2. PMF Analysis

The sources of VOCs during the observation period were further analyzed using the PMF receptor model. When the number of factors was set to six, the Qtrue/Qrobust ratio was 1.0, and the Qtrue/Qexpected ratio was less than 1.5, indicating that the results are reliable [69,70]. Figure 5 presents the profiles of six factors resolved by PMF. Factor 1 had high contributions of CO, acetylene, benzene, ethylene, and chloromethane, which are key markers of biomass/coal burning [42,71]. Therefore, factor 1 was identified as a biomass/coal burning source. Factor 2 exhibited high levels of isopentane (26.4%) and methyl tertiary-butyl ether (MTBE) (58.5%). Isopentane is a typical tracer for gasoline evaporation [8,72], and MTBE is a common gasoline additive [73]. The ratios of isopentane to benzene and isopentane to toluene in this factor were 8.5 and 3.1, respectively, which were consistent with those measured in gasoline vapor [8]. Hence, factor 2 was identified as gasoline evaporation. Factor 3 showed higher proportions of n-butane and n-pentane, C3–C5 alkanes, and C7 aromatics, which are typically associated with vehicle emissions [42]. Consequently, factor 3 was identified as vehicle emissions. Factor 4 had high proportions of ethane, propane, and butane, which are major components of liquefied petroleum gas (LPG) and natural gas (NG) [40,74], thus identified as the LPG/NG source. The dominant species in factor 5 was isoprene (66.9%), primarily emitted from vegetation, indicating factor 5 as the biogenic source [75]. Factor 6 contained high proportions of toluene (38.7%), ethylbenzene (43.5%), m/p-xylene (57.3%), and o-xylene (54.6%). Previous studies have found that C7–C8 aromatics are widely used as industrial solvent [42,44]. Hence, factor 6 was identified as the industrial source.
The contributions of various emission sources to total VOCs are shown in Figure 6. During the entire observation period, the distribution of VOCs sources was as follows: vehicle emissions (27.4%) > LPG/NG (24.1%) > biomass/coal burning (18.8%) > industrial sources (15.1%) > gasoline evaporation (7.6%) > biogenic sources (7.0%). During the N-P period, vehicle emissions, LPG/NG, and industrial sources were the largest contributors to VOCs, accounting for 30.3%, 21.3%, and 18.2%, respectively. However, during the pollution periods, the contribution of biomass/coal burning increased significantly, reaching 26.6% in the P-P1 period and 47.6% in the P-P2 period, respectively. This notable increase indicates that during the PM2.5 pollution periods in Hefei, it is crucial to focus on heating and combustion activities to reduce VOCs emissions and potential secondary pollution. The contribution of industrial sources to VOCs was relatively low during the pollution periods, which may be due to the limited industrial activity in the vicinity of the sampling site. Due to low temperature in winter, the contribution of gasoline evaporation and biogenic sources to VOCs remained relatively low (<10%) over different periods, indicating their limited impact on VOCs in winter in Hefei.
Figure 7 compares the source contribution in Hefei with those in the YRD region. A summertime study at a suburban site in Hefei [76] also found that the largest contributors to VOCs were biomass/coal burning, vehicle emissions, and LPG/NG, which was similar to the wintertime results in this study. The contribution of biomass/coal burning in Hefei (18.8%) in this study was comparable to that observed in Shanghai during the winter (25.2%) [77] and in Hangzhou (22.7%) [78], indicating a significant role of biomass/coal burning in VOCs emissions in the YRD region. Some differences in VOC sources in Hefei compared to other cities in the YRD were also revealed in Figure 7. For example, compared to the suburban areas of Nanjing [79] and Changzhou [80], Hefei had a lower contribution from industrial sources and a higher impact from LPG/NG sources. The contribution of vehicle emissions in Hefei was similar with that in Nanjing (23.0%), pointing to the significant role of transportation-related emissions in these areas. However, the much lower contribution in Hefei compared to Changzhou (38.8%) might be due to differences in vehicle fleet composition. In comparison to the background area of Shanghai [77], the VOCs sources in Hefei were similar, with major contributors being vehicle emissions, biomass/coal burning, and LPG/NG usage. However, the contribution of gasoline evaporation in Shanghai (20.2%) was significantly higher than that in Hefei, which may be related to higher motor vehicle ownership in Shanghai. In the background area of Jiaxing [81], the primary VOCs source was vehicle emissions (53.0%), followed by solvent usage (24.3%), which showed substantial differences with VOCs source compositions in Hefei. The high contribution of solvent use in Jiaxing may be related to the recent boom in various industries such as electronics, garments, pharmaceuticals, and electrical machinery, whereas there were fewer factories near the sampling sites in this study. Compared to the source apportionment in Wuhu [82], the similarity in the contribution of LPG/NG sources may indicate similar patterns of residential energy use and fuel preferences. However, the significant differences in the contributions of other sources suggest differences in industrial activities and transportation infrastructure between Hefei and Wuhu. In Hangzhou [78], while the contributions of biomass/coal burning and industrial sources were similar, the contribution of solvent use was much higher. Compared to Nantong [83] and Ningbo [84], VOCs sources were more diverse, with the petrochemical industry contributing up to 35.6% in Ningbo, reflecting the significant impact of local industrial activities on VOCs emission [84]. Overall, the differences in VOCs source composition among various cities in the YRD reflected the complex interplay of local economic structures, industrial activities, energy use patterns, and environmental regulations. Generally, vehicle emissions, biomass/coal burning, LPG/NG, industrial emission and solvent usage were common major contributors to VOCs emissions in the YRD region, though the relative importance of each source varied significantly depending on local conditions. Understanding these variations is critical to developing targeted air quality management strategies that address the specific needs of each city in the YRD.

3.3. OH Loss Rate (LOH) and SOA Formation Potential

Similar to the previous study [85], a robust linear correlation was found between the OH loss rate (LOH) and VOCs mixing ratios (r2 = 0.98), and LOH increased with increased VOCs mixing ratio in this study. The calculated LOH ranged from 0.94 s⁻1 to 17.02 s⁻1 with an average value of 3.23 ± 2.83 s⁻1, which was lower than those in Guangzhou [85] and Beijing [86]. Alkenes contributed 64.9% of LOH in Hefei, followed by alkanes (21.4%), aromatics (11.6%), and alkyne (2.1%). Compared with the composition of the VOCs mixing ratio, the percentage of alkenes significantly increased from 15.3% for VOCs to 64.9% for LOH, whereas the percentage of alkanes decreased from 59.9% for VOCs to 21.4% for LOH. In terms of specific compounds, 1-butene was the compound with the highest OH loss rate in Hefei, followed by propene and ethylene. The diurnal variations of LOH (Figure S3) were similar to those of VOCs mixing ratios, which showed higher values in the morning during the N-P period and higher values at noon during the PM2.5 pollution periods. Moreover, the contributions of alkenes to LOH increased from 62.2% during the N-P period to 73.4% and 75.9% during the P-P1 and P-P2 periods, respectively. These results indicated the crucial role of alkenes in the atmospheric chemistry of Hefei in winter, especially during PM2.5 pollution periods.
During the observation period, the SOAFP of VOCs was calculated to be 0.38 ± 1.04 µg m⁻3, which was comparable to results observed in residential areas (0.46 ± 0.88 µg m⁻3) and background areas (0.41 ± 0.58 µg m⁻3) in Shanghai [77] but lower than the results in industrial areas of Shanghai (1.00 ± 2.03 µg m⁻3) and suburban Nanjing (0.9 µg m⁻3) [1]. Aromatics were the primary contributors to SOAFP (96.8%), consistent with findings from other regions in China [38,77]. The five compounds contributing most to SOAFP were toluene, m/p-xylene, ethylbenzene, benzene, and o-xylene, together accounting for 95.3% of the total SOAFP. Thus, these aromatic species are the critical VOCs to control SOA formation during wintertime in Hefei.
Combining the PMF source apportionment results, we calculated the contributions of various emission sources to SOA formation. As shown in Figure 8, industrial emissions were the largest contributors to SOA formation (44.9%), despite only contributing 15.1% of the total VOCs concentration. This suggested the high aerosol formation potential of aromatics emitted from industrial sources. Additionally, vehicle emissions also significantly contributed to SOA formation (26.6%) in Hefei. These findings are consistent with studies conducted in Guangzhou [85] and Kaifeng [87]. In terms of different periods, industrial sources contributed 49.1% to SOAFP during the N-P period, followed by vehicle emissions (28.3%). During the P-P1 period, the contributions from industrial sources and vehicle emissions decreased to 22.8% and 14.5%, respectively, while the contribution from biomass/coal burning increased significantly to 20.2%. In the P-P2 period, the contribution of biomass/coal burning even increased to 32.8%, making it the largest contributor to SOAFP. This indicates that industrial sources and vehicle emissions play a more crucial role in SOA formation on clean days, while biomass/coal burning contributes significantly during pollution periods. Therefore, targeting specific pollution sources at different periods would be more effective for controlling PM2.5 pollution in Hefei during the winter, ultimately leading to better public health outcomes by reducing exposure to harmful particulate matter.

4. Conclusions

In this study, ambient VOCs samples were collected in wintertime at a suburban site in Hefei and compared between non-pollution periods and PM2.5 pollution periods. During the whole campaign, the mixing ratios of VOCs were averaged as 21.1 ± 15.9 ppb, with alkanes, alkenes, alkyne, and aromatics accounting for 59.9%, 15.3%, 15.0%, and 9.8% of the total VOCs, respectively. Although total VOCs mixing ratios varied little between non-pollution and pollution periods, it was found that the contributions of alkenes and alkyne increased obviously during the PM2.5 pollution periods. Different from VOCs compositions, alkenes showed the highest contribution to LOH (64.9%), whereas aromatics were the dominant contributors to SOAFP (96.8%). The PMF model revealed that vehicle emissions, LPG/NG, and biomass/coal burning were the largest contributors to VOCs, accounting for 27.4%, 24.1%, and 18.8%, respectively. Moreover, during the PM2.5 pollution periods, the contribution of biomass/coal burning to VOCs mixing ratios and SOA formation potentials both increased significantly. This suggested that wintertime heating and combustion activities have a substantial impact on VOCs emissions and PM2.5 pollutions in Hefei. The results of this study revealed the differences of VOCs characteristics, sources, and impacts among different PM2.5 pollution levels and highlighted the necessity of stricter regulations on biomass/coal burning and vehicle emissions to effectively control PM2.5 pollution in wintertime in Hefei. These findings could also contribute to the effective management of PM2.5 pollution in the YRD region and provide a reference for VOCs control in cities with similar energy and population structures. Future research on VOCs and SOA tracers at multisites in different regions is encouraged to further quantify the contribution and mechanism of VOCs to PM2.5 formation.

Supplementary Materials

The following supporting information can be downloaded at: https://www.mdpi.com/article/10.3390/atmos15101162/s1, Figure S1: Flowchart for this study; Figure S2: Chromatogram of the sample collected on 7 December 2019 at 8:00 (a), Chromatogram of the sample collected on 8 December 2019 at 8:00 (b); Figure S3: Diurnal variation (a) and composition (b) of OH loss rate (LOH) in N-P, P-P1 and P-P2 period; Table S1: Relevant VOCs parameters used in this study; Table S2: Comparison of meteorological parameters and air pollutants concentrations between morning time (6:00–10:00) of 7 and 8 December 2019.

Author Contributions

Data curation, D.Z.; Funding acquisition, Y.Z. and X.W.; Methodology, D.Z., X.H. and S.X.; Writing—original draft, D.Z.; Writing—review and editing, Z.Z., Y.Z. and X.W. All authors have read and agreed to the published version of the manuscript.

Funding

This work was supported by the National Natural Science Foundation of China (42321003), Guangdong Foundation for Program of Science and Technology Research (2020B1111360001/2023B0303000007/2023B1212060049), Youth Innovation Promotion Association of the Chinese Academy of Sciences (Y2021096), and Guangzhou Municipal Science and Technology Bureau (202206010057).

Data Availability Statement

The original contributions presented in this study are included in the article/Supplementary Materials. Further inquiries can be directed to the corresponding author.

Conflicts of Interest

The authors declare no conflicts of interest relevant to this study.

References

  1. Mozaffar, A.; Zhang, Y.-L.; Fan, M.Y.; Cao, F.; Lin, Y.-C. Characteristics of summertime ambient VOCs and their contributions to O3 and SOA formation in a suburban area of Nanjing, China. Atmos. Res. 2020, 240, 104923. [Google Scholar] [CrossRef]
  2. Li, M.; Zhang, Q.; Zheng, B.; Tong, D.; Lei, Y.; Liu, F.; Hong, C.P.; Kang, S.C.; Yan, L.; Zhang, Y.X.; et al. Persistent growth of anthropogenic non-methane volatile organic compound (NMVOC) emissions in China during 1990–2017: Drivers, speciation and ozone formation potential. Atmos. Chem. Phys. 2019, 19, 8897–8913. [Google Scholar] [CrossRef]
  3. Huang, R.J.; Zhang, Y.L.; Bozzetti, C.; Ho, K.F.; Cao, J.J.; Han, Y.M.; Daellenbach, K.R.; Slowik, J.G.; Platt, S.M.; Canonaco, F.; et al. High secondary aerosol contribution to particulate pollution during haze events in China. Nature 2014, 514, 218–222. [Google Scholar] [CrossRef]
  4. Guo, S.; Hu, M.; Zamora, M.L.; Peng, J.F.; Shang, D.; Zheng, J.; Du, Z.; Wu, Z.F.; Shao, M.; Zeng, L.M.; et al. Elucidating severe urban haze formation in China. Proc. Natl. Acad. Sci. USA 2014, 111, 17373–17378. [Google Scholar] [CrossRef]
  5. Sexton, K.; Adgate, J.L.; Ramachandran, G.; Pratt, G.C.; Mongin, S.J.; Stock, T.H.; Morandi, M.T. Comparison of personal, indoor, and outdoor exposures to hazardous air pollutants in three urban communities. Environ. Sci. Technol. 2004, 38, 423–430. [Google Scholar] [CrossRef]
  6. Guenther, A.B.; Jiang, X.; Heald, C.L.; Sakulyanontvittaya, T.; Duhl, T.; Emmons, L.K.; Wang, X. The Model of Emissions of Gases and Aerosols from Nature version 2.1 (MEGAN2.1): An extended and updated framework for modeling biogenic emissions. Geosci. Model Dev. 2012, 5, 1471–1492. [Google Scholar] [CrossRef]
  7. Watson, J.G.; Chow, J.C.; Fujita, E.M. Review of volatile organic compound source apportionment by chemical mass balance. Atmos. Environ. 2001, 35, 1567–1584. [Google Scholar] [CrossRef]
  8. Zhang, Y.L.; Wang, X.M.; Zhang, Z.; Lu, S.J.; Shao, M.; Lee, F.S.C.; Yu, J.Z. Species profiles and normalized reactivity of volatile organic compounds from gasoline evaporation in China. Atmos. Environ. 2013, 79, 110–118. [Google Scholar] [CrossRef]
  9. Mozaffar, A.; Zhang, Y.-L. Atmospheric volatile organic compounds (VOCs) in China: A Review. Curr. Pollut. Rep. 2020, 6, 250–263. [Google Scholar] [CrossRef]
  10. Wang, S.Y.; Zhao, Y.L.; Han, Y.; Li, R.; Fu, H.B.; Gao, S.; Duan, Y.S.; Zhang, L.W.; Chen, J.M. Spatiotemporal variation, source and secondary transformation potential of volatile organic compounds (VOCs) during the winter days in Shanghai, China. Atmos. Environ. 2022, 286, 119203. [Google Scholar] [CrossRef]
  11. Zhang, Y.J.; Li, F.; Cheng, Q.; Zhang, C.; Liu, Y.F.; Li, Q.J.; Yin, S.J.; Zhang, S.Q.; Liu, X.G. Characteristics and secondary transformation potential of volatile organic compounds in Wuhan, China. Atmos. Environ. 2023, 294, 119469. [Google Scholar] [CrossRef]
  12. Yang, Y.; Liu, B.; Hua, J.; Yang, T.; Dai, Q.L.; Wu, J.H.; Feng, Y.C.; Hopke, P.K. Global review of source apportionment of volatile organic compounds based on highly time-resolved data from 2015 to 2021. Environ. Int. 2022, 165, 107330. [Google Scholar] [CrossRef] [PubMed]
  13. Li, B.W.; Ho, S.S.H.; Li, X.H.; Guo, L.Y.; Feng, R.; Fang, X.K. Pioneering observation of atmospheric volatile organic compounds in Hangzhou in eastern China and implications for upcoming 2022 Asian Games. J. Environ. Sci. 2023, 124, 723–734. [Google Scholar] [CrossRef] [PubMed]
  14. Zhang, T.; Xiao, S.X.; Wang, X.M.; Zhang, Y.L.; Pei, C.L.; Chen, D.H.; Jiang, M.; Liao, T. Volatile organic compounds monitored online at three photochemical assessment monitoring stations in the Pearl River Delta (PRD) Region during summer 2016: Sources and emission areas. Atmosphere 2021, 12, 327. [Google Scholar] [CrossRef]
  15. Guo, H.; Ling, Z.H.; Cheng, H.R.; Simpson, I.J.; Lyu, X.P.; Wang, X.M.; Shao, M.; Lu, H.X.; Ayoko, G.; Zhang, Y.L.; et al. Tropospheric volatile organic compounds in China. Sci. Total Environ. 2017, 574, 1021–1043. [Google Scholar] [CrossRef]
  16. An, J.Y.; Huang, Y.W.; Huang, C.; Wang, X.; Yan, R.S.; Wang, Q.; Wang, H.L.; Jing, S.A.; Zhang, Y.; Liu, Y.M.; et al. Emission inventory of air pollutants and chemical speciation for specific anthropogenic sources based on local measurements in the Yangtze River Delta region, China. Atmos. Meas. Tech. Phys. 2021, 21, 2003–2025. [Google Scholar] [CrossRef]
  17. GB 3095-2012; Ambient Air Quality Standards. Ministry of Environmental Protection of the People’s Republic of China: Beijing, China, 2012.
  18. Cao, J.H.; Kang, M.; Zhou, X.; Zhou, W.Z.; Lu, Y.; Shen, C.Y.; Huang, C.Q.; Chu, Y.N. Characteristics and source apportionment of volatile organic compounds in Hefei Science Dongpu Reservoir. J. Atmos. Environ. Opt. 2017, 12, 362–370. [Google Scholar]
  19. Hu, R.; Liu, G.; Zhang, H.; Xue, H.; Wang, X. Levels, characteristics and health risk assessment of VOCs in different functional zones of Hefei. Ecotoxicol. Environ. Saf. 2018, 160, 301–307. [Google Scholar] [CrossRef]
  20. Wang, X.; Liu, G.; Hu, R.; Zhang, H.; Zhang, M.; Zhang, F. Distribution, sources, and health risk assessment of volatile organic compounds in Hefei City. Arch. Environ. Contam. Toxicol. 2020, 78, 392–400. [Google Scholar] [CrossRef]
  21. Wang, S.B.; Liu, G.J.; Zhang, H.; Yi, M.J.; Liu, Y.; Hong, X.Y.; Bao, X. Insight into the environmental monitoring and source apportionment of volatile organic compounds (VOCs) in various functional areas. Air Qual. Atmos. Health 2021, 15, 1121–1131. [Google Scholar] [CrossRef]
  22. Yu, H.; Liu, Q.Q.; Wei, N.N.; Hu, M.F.; Xu, X.Z.; Wang, S.; Zhou, J.C.; Zhao, W.X.; Zhang, W.J. Investigation of summertime ozone formation and sources of volatile organic compounds in the suburb area of Hefei: A case study of 2020. Atmosphere 2023, 14, 740. [Google Scholar] [CrossRef]
  23. Hu, F.; Xie, P.H.; Tian, X.; Xu, J.; Li, A.; Lupaşcu, A.; Butler, T.; Hu, Z.; Lv, Y.S.; Zhang, Z.D.; et al. Integrated analysis of the transport process and source attribution of an extreme ozone pollution event in Hefei at different vertical heights: A case of study. Sci. Total Environ. 2024, 906, 167237. [Google Scholar] [CrossRef] [PubMed]
  24. Shan, C.G.; Wang, W.; Liu, C.; Sun, Y.W.; Hu, Q.H.; Xu, X.W.; Tian, Y.; Zhang, H.F.; Morino, I.; Griffith, D.W.T.; et al. Regional CO emission estimated from ground-based remote sensing at Hefei site, China. Atmos. Res. 2019, 222, 25–35. [Google Scholar] [CrossRef]
  25. Zhang, Y.L.; Guo, H.; Wang, X.M.; Simpson, I.J.; Barletta, B.; Blake, D.R.; Meinardi, S.; Rowland, F.S.; Cheng, H.R.; Saunders, S.M.; et al. Emission patterns and spatiotemporal variations of halocarbons in the Pearl River Delta region, southern China. J. Geophys. Res. Atmos. 2010, 115, D15. [Google Scholar] [CrossRef]
  26. Zhang, Y.L.; Wang, X.M.; Blake, D.R.; Li, L.F.; Zhang, Z.; Wang, S.Y.; Guo, H.; Lee, F.S.C.; Gao, B.; Chan, L.Y.; et al. Aromatic hydrocarbons as ozone precursors before and after outbreak of the 2008 financial crisis in the Pearl River Delta region, south China. J. Geophys. Res. Atmos. 2012, 117, D15. [Google Scholar] [CrossRef]
  27. Zhang, Y.L.; Wang, X.M.; Barletta, B.; Simpson, I.J.; Blake, D.R.; Fu, X.X.; Zhang, Z.; He, Q.F.; Liu, T.Y.; Zhao, X.Y.; et al. Source attributions of hazardous aromatic hydrocarbons in urban, suburban and rural areas in the Pearl River Delta (PRD) region. J. Hazard. Mater. 2013, 250–251, 403–411. [Google Scholar] [CrossRef]
  28. Atkinson, R.; Arey, J. Atmospheric degradation of volatile organic compounds. Chem. Rev. 2003, 103, 4605–4638. [Google Scholar] [CrossRef] [PubMed]
  29. Grosjean, D. In situ organic aerosol formation during a smog episode—Estimated production and chemical functionality. Atmos. Environ. Part A-Gen. Top. 1992, 26, 953–963. [Google Scholar] [CrossRef]
  30. Grosjean, D.; Seinfeld, J.H. Parameterization of the formation potential of secondary organic aerosols. Atmos. Environ. 1989, 23, 1733–1747. [Google Scholar] [CrossRef]
  31. Claeys, M.; Graham, B.; Vas, G.; Wang, W.; Vermeylen, R.; Pashynska, V.; Cafmeyer, J.; Guyon, P.; Andreae, M.O.; Artaxo, P.; et al. Formation of secondary organic aerosols through photooxidation of isoprene. Science 2004, 303, 1173–1176. [Google Scholar] [CrossRef]
  32. Bejan, I.G.; Olariu, R.-I.; Wiesen, P. Secondary organic aerosol formation from nitrophenols photolysis under atmospheric conditions. Atmosphere 2020, 11, 1346. [Google Scholar] [CrossRef]
  33. Schueneman, M.K.; Day, D.A.; Peng, Z.; Pagonis, D.; Jenks, O.J.; de Gouw, J.A.; Jimenez, J.L. Secondary organic aerosol formation from the OH oxidation of phenol, catechol, styrene, furfural, and methyl furfural. ACS Earth Space Chem. 2024, 8, 1179–1192. [Google Scholar] [CrossRef]
  34. Kroll, J.H.; Ng, N.L.; Murphy, S.M.; Flagan, R.C.; Seinfeld, J.H. Secondary organic aerosol formation from isoprene photooxidation under high-NOx conditions. Geophys. Res. Lett. 2005, 32, 18. [Google Scholar] [CrossRef]
  35. Martín-Reviejo, M.; Wirtz, K. Is benzene a precursor for secondary organic aerosol? Environ. Sci. Technol. 2005, 39, 1045–1054. [Google Scholar] [CrossRef]
  36. Lü, Z.-F.; Hao, J.-M.; Duan, J.-C.; Li, J.-H. Estimate of the formation potential of secondary organic aerosol in Beijing summertime. Huan Jing Ke Xue 2009, 30, 969–975. [Google Scholar]
  37. Paatero, P.; Tapper, U. Positive matrix factorization: A non-negative factor model with optimal utilization of error estimates of data values. Environmetrics 1994, 5, 111–126. [Google Scholar] [CrossRef]
  38. Hui, L.R.; Liu, X.G.; Tan, Q.W.; Feng, M.; An, J.L.; Qu, Y.; Zhang, Y.H.; Cheng, N.L. VOC characteristics, sources and contributions to SOA formation during haze events in Wuhan, Central China. Sci. Total Environ. 2019, 650, 2624–2639. [Google Scholar] [CrossRef]
  39. Nayebare, S.R.; Aburizaiza, O.S.; Siddique, A.; Carpenter, D.O.; Hussain, M.M.; Zeb, J.; Aburiziza, A.J.; Khwaja, H.A. Ambient air quality in the holy city of Makkah: A source apportionment with elemental enrichment factors (EFs) and factor analysis (PMF). Environ. Pollut. 2018, 243, 1791–1801. [Google Scholar] [CrossRef]
  40. Guan, Y.N.; Wang, L.; Wang, S.J.; Zhang, Y.H.; Xiao, J.Y.; Wang, X.L.; Duan, E.H.; Li, L.A. Temporal variations and source apportionment of volatile organic compounds at an urban site in Shijiazhuang, China. J. Environ. Sci. 2020, 97, 25–34. [Google Scholar] [CrossRef]
  41. Pei, C.L.; Yang, W.Q.; Zhang, Y.L.; Song, W.; Xiao, S.X.; Wang, J.; Zhang, J.P.; Zhang, T.; Chen, D.H.; Wang, Y.J.; et al. Decrease in ambient volatile organic compounds during the COVID-19 lockdown period in the Pearl River Delta region, south China. Sci. Total Environ. 2022, 823, 153720. [Google Scholar] [CrossRef]
  42. Liu, Y.; Shao, M.; Fu, L.L.; Lu, S.H.; Zeng, L.M.; Tang, D.G. Source profiles of volatile organic compounds (VOCs) measured in China: Part I. Atmos. Environ. 2008, 42, 6247–6260. [Google Scholar] [CrossRef]
  43. Li, B.W.; Ho, S.S.H.; Xue, Y.G.; Huang, Y.; Wang, L.Q.; Cheng, Y.; Dai, W.T.; Zhong, H.B.; Cao, J.J.; Lee, S.C. Characterizations of volatile organic compounds (VOCs) from vehicular emissions at roadside environment: The first comprehensive study in Northwestern China. Atmos. Environ. 2017, 161, 1–12. [Google Scholar]
  44. Yuan, B.; Shao, M.; Lu, S.H.; Wang, B. Source profiles of volatile organic compounds associated with solvent use in Beijing, China. Atmos. Environ. 2010, 44, 1919–1926. [Google Scholar] [CrossRef]
  45. Zheng, J.Y.; Yu, Y.F.; Mo, Z.W.; Zhang, Z.; Wang, X.M.; Yin, S.S.; Peng, K.; Yang, Y.; Feng, X.Q.; Cai, H.H. Industrial sector-based volatile organic compound (VOC) source profiles measured in manufacturing facilities in the Pearl River Delta, China. Sci. Total Environ. 2013, 456–457, 127–136. [Google Scholar] [CrossRef] [PubMed]
  46. Shiu, C.-J.; Liu, S.C.; Chang, C.-C.; Chen, J.-P.; Chou, C.C.K.; Lin, C.-Y.; Young, C.-Y. Photochemical production of ozone and control strategy for Southern Taiwan. Atmos. Environ. 2007, 41, 9324–9340. [Google Scholar] [CrossRef]
  47. He, Z.R.; Wang, X.M.; Ling, Z.H.; Zhao, J.; Guo, H.; Shao, M.; Wang, Z. Contributions of different anthropogenic volatile organic compound sources to ozone formation at a receptor site in the Pearl River Delta region and its policy implications. Atmos. Meas. Tech. Phys. 2019, 19, 8801–8816. [Google Scholar]
  48. Wang, M.; Lu, S.H.; Shao, M.; Zeng, L.M.; Zheng, J.; Xie, F.J.; Lin, H.T.; Hu, K.; Lu, X.D. Impact of COVID-19 lockdown on ambient levels and sources of volatile organic compounds (VOCs) in Nanjing, China. Sci. Total Environ. 2021, 757, 143823. [Google Scholar] [CrossRef]
  49. Zhang, D.; He, B.; Yuan, M.H.; Yu, S.J.; Yin, S.S.; Zhang, R.Q. Characteristics, sources and health risks assessment of VOCs in Zhengzhou, China during haze pollution season. J. Environ. Sci. 2021, 108, 44–57. [Google Scholar]
  50. Yang, W.Q.; Zhang, Y.L.; Wang, X.M.; Li, S.; Zhu, M.; Yu, Q.Q.; Li, G.H.; Huang, Z.H.; Zhang, H.N.; Wu, Z.F.; et al. Volatile organic compounds at a rural site in Beijing: Influence of temporary emission control and wintertime heating. Atmos. Meas. Tech. Phys. 2018, 18, 12663–12682. [Google Scholar]
  51. Wang, B.L.; Liu, Z.G.; Li, Z.A.; Sun, Y.C.; Wang, C.; Zhu, C.Y.; Sun, L.; Yang, N.; Bai, G.; Fan, G.L.; et al. Characteristics, chemical transformation and source apportionment of volatile organic compounds (VOCs) during wintertime at a suburban site in a provincial capital city, east China. Atmos. Environ. 2023, 298, 119621. [Google Scholar]
  52. Xiong, Y.; Du, K. Source-resolved attribution of ground-level ozone formation potential from VOC emissions in Metropolitan Vancouver, BC. Sci. Total Environ. 2020, 721, 137698. [Google Scholar] [CrossRef] [PubMed]
  53. Saito, S.; Nagao, I.; Kanzawa, H. Characteristics of ambient C2–C11 non-methane hydrocarbons in metropolitan Nagoya, Japan. Atmos. Environ. 2009, 43, 4384–4395. [Google Scholar] [CrossRef]
  54. Kang, S.; Kim, J.-A.; Lee, M.; Park, J.; Jeon, E.; Shim, M.; Shin, Y. An analysis of the temporal variability in volatile organic compounds (VOCs) within megacity Seoul and an identification of their sources. Atmos. Pollut. Res. 2022, 13, 101338. [Google Scholar] [CrossRef]
  55. Leuchner, M.; Rappenglueck, B. VOC source-receptor relationships in Houston during TexAQS-II. Atmos. Environ. 2010, 44, 4056–4067. [Google Scholar] [CrossRef]
  56. Suthawaree, J.; Kato, S.; Okuzawa, K.; Kanaya, Y.; Pochanart, P.; Akimoto, H.; Wang, Z.; Kajii, Y. Measurements of volatile organic compounds in the middle of Central East China during Mount Tai Experiment 2006 (MTX2006): Observation of regional background and impact of biomass burning. Atmos. Meas. Tech. Phys. 2010, 10, 1269–1285. [Google Scholar] [CrossRef]
  57. Blake, D.R.; Rowland, F.S. Urban leakage of liquefied petroleum gas and its impact on Mexico-city air-quality. Science 1995, 269, 953–956. [Google Scholar] [CrossRef] [PubMed]
  58. Gu, Y.; Liu, B.S.; Li, Y.F.; Zhang, Y.F.; Bi, X.H.; Wu, J.H.; Song, C.B.; Dai, Q.L.; Han, Y.; Ren, G.; et al. Multi-scale volatile organic compound (VOC) source apportionment in Tianjin, China, using a receptor model coupled with 1-hr resolution data. Environ. Pollut. 2020, 265, 115023. [Google Scholar] [CrossRef]
  59. Zhang, Z.; Zhang, Y.L.; Wang, X.M.; Lu, S.J.; Huang, Z.H.; Huang, X.Y.; Yang, W.Q.; Wang, Y.S.; Zhang, Q. Spatiotemporal patterns and source implications of aromatic hydrocarbons at six rural sites across China’s developed coastal regions. J. Geophys. Res.-Atmos. 2016, 121, 6669–6687. [Google Scholar] [CrossRef]
  60. Cui, L.L.; Wu, D.; Wang, S.X.; Xu, Q.C.; Hu, R.L.; Hao, J.M. Measurement report: Ambient volatile organic compound (VOC) pollution in urban Beijing: Characteristics, sources, and implications for pollution control. Atmos. Meas. Tech. Phys. 2022, 22, 11931–11944. [Google Scholar] [CrossRef]
  61. Yao, Z.L.; Wu, B.B.; Shen, X.B.; Cao, X.Y.; Jiang, X.; Ye, Y.; He, K.B. On-road emission characteristics of VOCs from rural vehicles and their ozone formation potential in Beijing, China. Atmos. Environ. 2015, 105, 91–96. [Google Scholar] [CrossRef]
  62. Deng, C.X.; Jin, Y.J.; Zhang, M.; Liu, X.W.; Yu, Z.M. Emission characteristics of VOCs from on-road vehicles in an urban tunnel in Eastern China and predictions for 2017–2026. Aerosol Air Qual. Res. 2018, 18, 3025–3034. [Google Scholar] [CrossRef]
  63. Mo, Z.W.; Shao, M.; Lu, S.H.; Qu, H.; Zhou, M.Y.; Sun, J.; Gou, B. Process-specific emission characteristics of volatile organic compounds (VOCs) from petrochemical facilities in the Yangtze River Delta, China. Sci. Total Environ. 2015, 533, 422–431. [Google Scholar] [CrossRef] [PubMed]
  64. Shi, J.W.; Deng, H.; Bai, Z.P.; Kong, S.F.; Wang, X.Y.; Hao, J.M.; Han, X.Y.; Ning, P. Emission and profile characteristic of volatile organic compounds emitted from coke production, iron smelt, heating station and power plant in Liaoning Province, China. Sci. Total Environ. 2015, 515–516, 101–108. [Google Scholar] [CrossRef] [PubMed]
  65. Akagi, S.K.; Yokelson, R.J.; Wiedinmyer, C.; Alvarado, M.J.; Reid, J.S.; Karl, T.; Crounse, J.D.; Wennberg, P.O. Emission factors for open and domestic biomass burning for use in atmospheric models. Atmos. Chem. Phys. 2011, 11, 4039–4072. [Google Scholar] [CrossRef]
  66. Wang, M.; Shao, M.; Lu, S.-H.; Yang, Y.-D.; Chen, W.-T. Evidence of coal combustion contribution to ambient VOCs during winter in Beijing. Chin. Chem. Lett. 2013, 24, 829–832. [Google Scholar] [CrossRef]
  67. Nelson, P.F.; Quigley, S.M. The meta, para-xylenes-ethylbenzene ratio—A technique for estimating hydrocarbon age in ambient atmospheres. Atmos. Environ. 1983, 17, 659–662. [Google Scholar] [CrossRef]
  68. Atkinson, R. Atmospheric chemistry of VOCs and NOx. Atmos. Environ. 2000, 34, 2063–2101. [Google Scholar] [CrossRef]
  69. Hui, L.R.; Liu, X.G.; Tan, Q.W.; Feng, M.; An, J.L.; Qu, Y.; Zhang, Y.H.; Deng, Y.J.; Zhai, R.X.; Wang, Z. VOC characteristics, chemical reactivity and sources in urban Wuhan, central China. Atmos. Environ. 2020, 224, 117340. [Google Scholar] [CrossRef]
  70. Guan, Y.N.; Liu, X.J.; Zheng, Z.Y.; Dai, Y.W.; Du, G.M.; Han, J.; Hou, L.A.; Duan, E.H. Summer O3 pollution cycle characteristics and VOCs sources in a central city of Beijing-Tianjin-Hebei area, China. Environ. Pollut. 2023, 323, 121293. [Google Scholar] [CrossRef]
  71. de Gouw, J.A.; Cooper, O.R.; Warneke, C.; Hudson, P.K.; Fehsenfeld, F.C.; Holloway, J.S.; Hübler, G.; Nicks, D.K.; Nowak, J.B.; Parrish, D.D.; et al. Chemical composition of air masses transported from Asia to the U. S. West Coast during ITCT 2K2: Fossil fuel combustion versus biomass-burning signatures. J. Geophys. Res.-Atmos. 2004, 109, D23. [Google Scholar] [CrossRef]
  72. Lau, A.K.H.; Yuan, Z.B.; Yu, J.Z.; Louie, P.K.K. Source apportionment of ambient volatile organic compounds in Hong Kong. Sci. Total Environ. 2010, 408, 4138–4149. [Google Scholar] [CrossRef] [PubMed]
  73. Song, Y.; Shao, M.; Liu, Y.; Lu, S.H.; Kuster, W.; Goldan, P.; Xie, S.D. Source apportionment of ambient volatile organic compounds in Beijing. Environ. Sci. Technol. 2007, 41, 4348–4353. [Google Scholar] [CrossRef]
  74. Guo, H.; Cheng, H.R.; Ling, Z.H.; Louie, P.K.K.; Ayoko, G.A. Which emission sources are responsible for the volatile organic compounds in the atmosphere of Pearl River Delta? J. Hazard. Mater. 2011, 188, 116–124. [Google Scholar] [CrossRef] [PubMed]
  75. Zeng, J.Q.; Song, W.; Zhang, Y.L.; Mu, Z.B.; Pang, W.H.; Zhang, H.N.; Wang, X.M. Emissions of isoprenoids from dominant tree species in subtropical China. Front. For. Glob. Chang. 2022, 5, 1089676. [Google Scholar] [CrossRef]
  76. Deng, P. Study on Ozone Pollution Characteristics and Countermeasures in Hefei City. Master’s Thesis, Hefei University of Technology, Hefei, China, 2022. [Google Scholar]
  77. Han, Y.; Wang, T.; Li, R.; Fu, H.B.; Duan, Y.S.; Gao, S.; Zhang, L.W.; Chen, J.M. Measurement report: Volatile organic compound characteristics of the different land-use types in Shanghai: Spatiotemporal variation, source apportionment and impact on secondary formations of ozone and aerosol. Atmos. Meas. Tech. Phys. 2023, 23, 2877–2900. [Google Scholar] [CrossRef]
  78. Wang, X.; Han, Y.; Tu, X.; Shen, J.D.; Zhang, B.J.; Fu, H.B. Distribution of volatile organic compounds (VOCs) in the urban atmosphere of Hangzhou, East China: Temporal variation, source attribution, and impact on the secondary formations of ozone and aerosol. Front. Environ. Sci. 2024, 12, 1418948. [Google Scholar] [CrossRef]
  79. Fan, M.-Y.; Zhang, Y.-L.; Lin, Y.-C.; Li, L.; Xie, F.; Hu, J.; Mozaffar, A.; Cao, F. Source apportionments of atmospheric volatile organic compounds in Nanjing, China during high ozone pollution season. Chemosphere 2021, 263, 128025. [Google Scholar] [CrossRef] [PubMed]
  80. Liu, Z.Q.; Hu, K.; Zhang, K.; Zhu, S.N.; Wang, M.; Li, L. VOCs sources and roles in O3 formation in the central Yangtze River Delta region of China. Atmos. Environ. 2023, 302, 128025. [Google Scholar] [CrossRef]
  81. Xu, Z.N.; Zou, Q.L.; Jin, L.L.; Shen, Y.M.; Shen, J.S.; Xu, B.Y.; Qu, F.Q.; Zhang, F.; Xu, J.W.; Pei, X.Y.; et al. Characteristics and sources of ambient Volatile Organic Compounds (VOCs) at a regional background site, YRD region, China: Significant influence of solvent evaporation during hot months. Sci. Total Environ. 2023, 857, 159674. [Google Scholar] [CrossRef]
  82. Gao, K.; Zhang, H.; Liu, M.-D.; Zhao, X.-Y.; Wu, T.; Jia, Q.-N. Characteristics, Atmospheric reactivity, and source apportionment of ambient volatile organic compounds in Wuhu. Huan Jing Ke Xue 2020, 41, 4885–4894. [Google Scholar]
  83. Zhang, J.; Zhao, Y.; Zhao, Q.Y.; Shen, G.F.; Liu, Q.; Li, C.Y.; Zhou, D.R.; Wang, S.K. Characteristics and source apportionment of summertime volatile organic compounds in a fast developing city in the Yangtze River Delta, China. Atmosphere 2018, 9, 373. [Google Scholar] [CrossRef]
  84. Mo, Z.W.; Shao, M.; Lu, S.H.; Niu, H.; Zhou, M.Y.; Sun, J. Characterization of non-methane hydrocarbons and their sources in an industrialized coastal city, Yangtze River Delta, China. Sci. Total Environ. 2017, 593–594, 641–653. [Google Scholar] [CrossRef] [PubMed]
  85. Yang, W.Q.; Yu, Q.Q.; Pei, C.L.; Liao, C.H.; Liu, J.J.; Zhang, J.P.; Zhang, Y.L.; Qiu, X.N.; Zhang, T.; Zhang, Y.B.; et al. Characteristics of volatile organic compounds in the Pearl River Delta Region, China: Chemical reactivity, source, and emission regions. Atmosphere 2022, 13, 9. [Google Scholar] [CrossRef]
  86. Shao, M.; Fu, L.L.; Liu, Y.; Lu, S.H.; Zhang, Y.H.; Tang, X.Y. Key reactive components and their sources of atmospheric volatile organic compounds in Beijing city. Sci. Sin. Terrae 2005, 35, 123–130. [Google Scholar]
  87. Shi, Y.-Q.; Zheng, K.-Y.; Ding, W.-T.; Liu, J.-P.; Chen, H.-G.; Gao, G.; Wang, L.-L.; Wang, N.; Ma, S.-L.; Zheng, Y.; et al. Pollution characteristics and source apportionment of atmospheric volatile organic compounds in winter in Kaifeng city. Huan Jing Ke Xue 2023, 44, 1933–1942. [Google Scholar]
Figure 1. Sampling site in Hefei city (China Map Review No. GS (2023) 2767).
Atmosphere 15 01162 g001
Figure 2. Time series of meteorological parameters and air pollutants concentrations and cumulative bar chart of observed mixing ratios of VOC groups during the sampling period.
Atmosphere 15 01162 g002
Figure 3. Diurnal variation of VOCs mixing ratio (a) and VOCs composition (b) in N-P, P-P1, and P-P2 period.
Atmosphere 15 01162 g003
Figure 4. Ratios of toluene to benzene (a) and m/p-xylene to ethylbenzene (b) during the P-P1, P-P2, and N-P periods.
Atmosphere 15 01162 g004
Figure 5. Source profiles revolved by PMF.
Atmosphere 15 01162 g005
Figure 6. Comparison of VOCs sources in P-P1, P-P2, and N-P periods.
Atmosphere 15 01162 g006
Figure 7. Comparison of VOCs source contributions resolved by PMF among cities in the YRD region. The information of cities was as follows: suburban of Hefei in December 2019 (this study); suburban of Hefei in August 2020 [76]; suburban of Nanjing in July 2018 [79]; suburban of Changzhou in August 2018 [80]; background of Shanghai in January 2019 [77]; background of Jiaxing during winter of 2017–2019 [81]; urban of Wuhu in 2018 [82]; urban of Hangzhou in 2019 [78]; multisite of Nantong in July 2014 [83]; multisite of Ningbo from December 2012 to October 2013 [84].
Atmosphere 15 01162 g007
Figure 8. Percentage contribution of VOCs sources to SOA formation in P-P1, P-P2 and N-P periods.
Atmosphere 15 01162 g008
Disclaimer/Publisher’s Note: The statements, opinions and data contained in all publications are solely those of the individual author(s) and contributor(s) and not of MDPI and/or the editor(s). MDPI and/or the editor(s) disclaim responsibility for any injury to people or property resulting from any ideas, methods, instructions or products referred to in the content.

