Article

SO2 Diffusion Features of the 2022 Hunga Tonga–Hunga Ha’apai Volcanic Eruptions from DSCOVR/EPIC Observations

1
School of Remote Sensing and Geomatics Engineering, Nanjing University of Information Science and Technology, Nanjing 210044, China
2
Technology Innovation Center for Integration Applications in Remote Sensing and Navigation, Ministry of Natural Resources, Nanjing 210044, China
*
Author to whom correspondence should be addressed.
Atmosphere 2024, 15(10), 1164; https://doi.org/10.3390/atmos15101164
Submission received: 2 August 2024 / Revised: 26 September 2024 / Accepted: 26 September 2024 / Published: 29 September 2024
(This article belongs to the Special Issue Satellite Remote Sensing Applied in Atmosphere (2nd Edition))

Abstract

:
Understanding the volcanic SO2 diffusive characteristics can enhance our knowledge of the impact of volcanic eruptions on climate change. In this study, the SO2 diffusion features of the Hunga Tonga–Hunga Ha’apai underwater volcano (HTHH) 2022 eruptions are investigated based on the Deep Space Climate Observatory (DSCOVR) Earth Polychromatic Imaging Camera (EPIC) dataset, which could provide longer term, more consistent, and higher temporal sampling rate observations to complement current low-orbit satellite-based research. SO2 plume major-direction profile analysis indicates that the SO2 diffusion extent of subaerial eruption initiating at 15:20/13 January 2022 was approximately 1500 km in the Southeast–Northwest major diffusive direction by 20:15/14 January 2022 (about 29 h after the HTHH subaerial eruption). All-direction SO2 plume analysis shows that the HTHH subaerial eruption-emitted SO2 plume could diffuse as far as 6242 km by 02:20/15 January 2022. Furthermore, these two analyses in terms of the HTHH major eruption initiating at 04:00/15 January 2022 imply that HTHH major eruption-emitted SO2 plume could diffuse as far as 8600 km in the Southeast–Northwest major diffusive direction by 02:24/18 January 2022 (about 70 h after the HTHH major eruption). It is also implied that HTHH major eruption-emitted SO2 plume could extend to approximately 14,729 km away from the crater by 13:12/18 January 2022. We believe that these findings could provide certain guidance for volcanic gas estimations, thus helping to deepen our understanding of volcanic impacts on climate change.

1. Introduction

Intense volcanic eruptions release significant amounts of volcanic ash, water vapor, and sulfur compounds. These eruptive substances could be transported to the troposphere and stratosphere by the eruption initial velocity, which would facilitate the formation of the ash cloud to obscure solar incident radiation, thus affecting the regional climate change [1]. Among these eruptive substances, sulfur dioxide (SO2) is significant, which plays an important role in the estimation of volcanic gas and aerosol fluxes (such as carbon dioxide and mercury). Furthermore, the eruptive SO2 would rapidly lift to the troposphere and stratosphere to form sulfuric acid aerosols by combining with water vapor. These sulfuric acid aerosols would evidently strengthen the atmospheric solar reflectance to affect the Earth radiation budget [2]. Therefore, studying the diffusion features of eruptive SO2 is essential for understanding volcanic impacts on climate [3,4].
The underwater volcano Hunga Tonga–Hunga Ha’apai (hereafter abbreviated as HTHH) is a submarine volcano, which is located at (20.57° S, 175.38° W) in a volcanic arc extending from New Zealand to Fiji in the North–Northeast direction at the South Pacific (see Figure 1). HTHH is formed by the subduction of the Pacific Plate towards the Indo-Australian Plate, which lies about 100 kilometers (km) above a large seismic region. The HTHH lays about 2 km above the seafloor with a caldera, which was roughly 150 m below the sea level. HTHH intensely erupted from 13 to 15 January in 2022, which is regarded as one of the most drastic submarine eruptions in the past century [5]. The HTHH eruption consisted of three stages; the first minor phase was detected at 20:40 on 19 December 2021 UTC with the umbrella top reaching as high as 15 km [6,7]. The second subaerial eruption happened at 15:20 UTC on 13 January 2022, with emitted ash plume and ashfall detected in the nearby islands [5]. The third major eruption began at around 04:00 UTC on 15 January 2022, with the emitted ash plume rushing to the 58 km altitude [8,9]. The resulting sulfate aerosols stayed with the ash plume at an average altitude of around 24 km then persisted in the stratosphere for several months [10]. HTHH eruptions from 13 to 15 January in 2022 caused massive tsunamis, earthquakes, and ionospheric disturbances, releasing about 187 kilotons of SO2 into the atmosphere The SO2 diffused globally and reached as far as South Africa, which exerted significant impact on regional and global environments [11,12].
Satellite-based platforms offer several advantages for observing volcanic SO2 emissions over traditional in situ measurements, including lower costs and broader temporal coverage. These advantages are crucial because volcanic eruptions often occur intermittently in uninhabited areas [13]. Recently, satellite-based sensors, such as the Total Ozone Mapping Spectrometer (TOMS), Ozone Monitoring Instrument (OMI), and Ozone Mapping and Profiler Suite (OMPS), had played an important role in the HTHH volcanic eruptive SO2 diffusion estimation and in the eruptive aerosols evaluation [14]. Low-orbit satellite observations indicated a relatively small stratospheric SO2 release from the 2022 HTHH eruption of around 0.4–0.5 teragram (Tg), with a short lifespan due to the substantial water vapor released [15]. Furthermore, it was found that the SO2 emitted from the 2022 HTHH eruption is at least an order of magnitude smaller than that of the 1991 Pinatubo eruption (approximately 18–19 Tg of SO2), which is explained by the low sulfur content in the subducting plate and the porosity influence of the overlying crust in 2022 HTHH eruption [16]. These low-orbit satellite-based observations has provided vital help to deepen our understanding of the SO2 variation in the 2022 HTHH eruption and its climatological impact. However, due to the finite orbital altitude and limited sampling frequency, low-orbit satellite-produced data had marked temporal sampling errors, which would bring evident uncertainties to small-temporal-scale 2022 HTHH eruption SO2 diffusion monitoring [17,18]. In contrast, the Deep Space Climate Observatory (DSCOVR) satellite possesses an instantaneous field of view covering nearly half of the Earth due to its substantial orbital altitude (about 1,500,000 km, Sun–Earth L1 point). This enables DSCOVR to provide longer term, more consistent, and higher temporal resolution data, complementing the existing low-orbit satellite observations [19]. The Earth Polychromatic Imaging Camera (EPIC) onboard DSCOVR can continuously monitor SO2 concentrations in the Earth’s atmosphere with high temporal resolution (68–110 min) and fine spatial resolution (about 24 km) during volcanic activity, which enables the fine surveillance of the SO2 diffusing process across the entire eruptive period [20,21].
The objective of this study is to reveal the diffusion features of SO2 released by the 2022 HTHH eruptions, including the subaerial eruption initiating at 15:20/13 January 2022 and major eruptions beginning on 04:00/15 January 2022, based on DSCOVR EPIC data, to complement current low-orbit satellite-based research. This paper is organized as follows. Section 2 mainly describes the study area and data sources, as well as the data processing approaches. Section 3 and Section 4 are dedicated to the major results and discussion. Main conclusions drawn in this study are depicted in Section 5.

2. Data and Methods

Plume is an effective indicator of the SO2 emitted by the volcanic eruption [22,23]. Identifying the SO2 plume emitted by the 2022 HTHH eruption is the core step of this study. However, due to two deficits in the major data used in this study (DSCOVR_EPIC_L2_O3SO2AI_02), i.e., negative values and sub-solar point-induced abnormal values, corresponding corrections should be implemented initially. The total workflow of this study is shown in Figure 2.

2.1. DSCOVR EPIC SO2 Data

DSCOVR EPIC Level 2 Sulfur dioxide Product (DSCOVR_EPIC_L2_O3SO2AI_02) is the main data used in this study, with a temporal resolution of 68 to 110 min and a spatial resolution of about 24 km. This product is the latest version of the DSCOVR EPIC SO2 data derived by the EPIC volcanic SO2 algorithm, which uses all four EPIC ultraviolet bands (317, 325, 340, 388 nm) to derive the vertical amounts of SO2. Since the substantial orbital altitude (about 1,500,000 km, Sun–Earth L1 point) of the DSCOVR satellite, DSCOVR_EPIC_L2_O3SO2AI_02 provides the first opportunity to continuously record the drifting SO2 on a global scale using a single sensor, which facilitates the longer term, more consistent, and higher temporal sampling of the volcano-erupted SO2 diffusion.

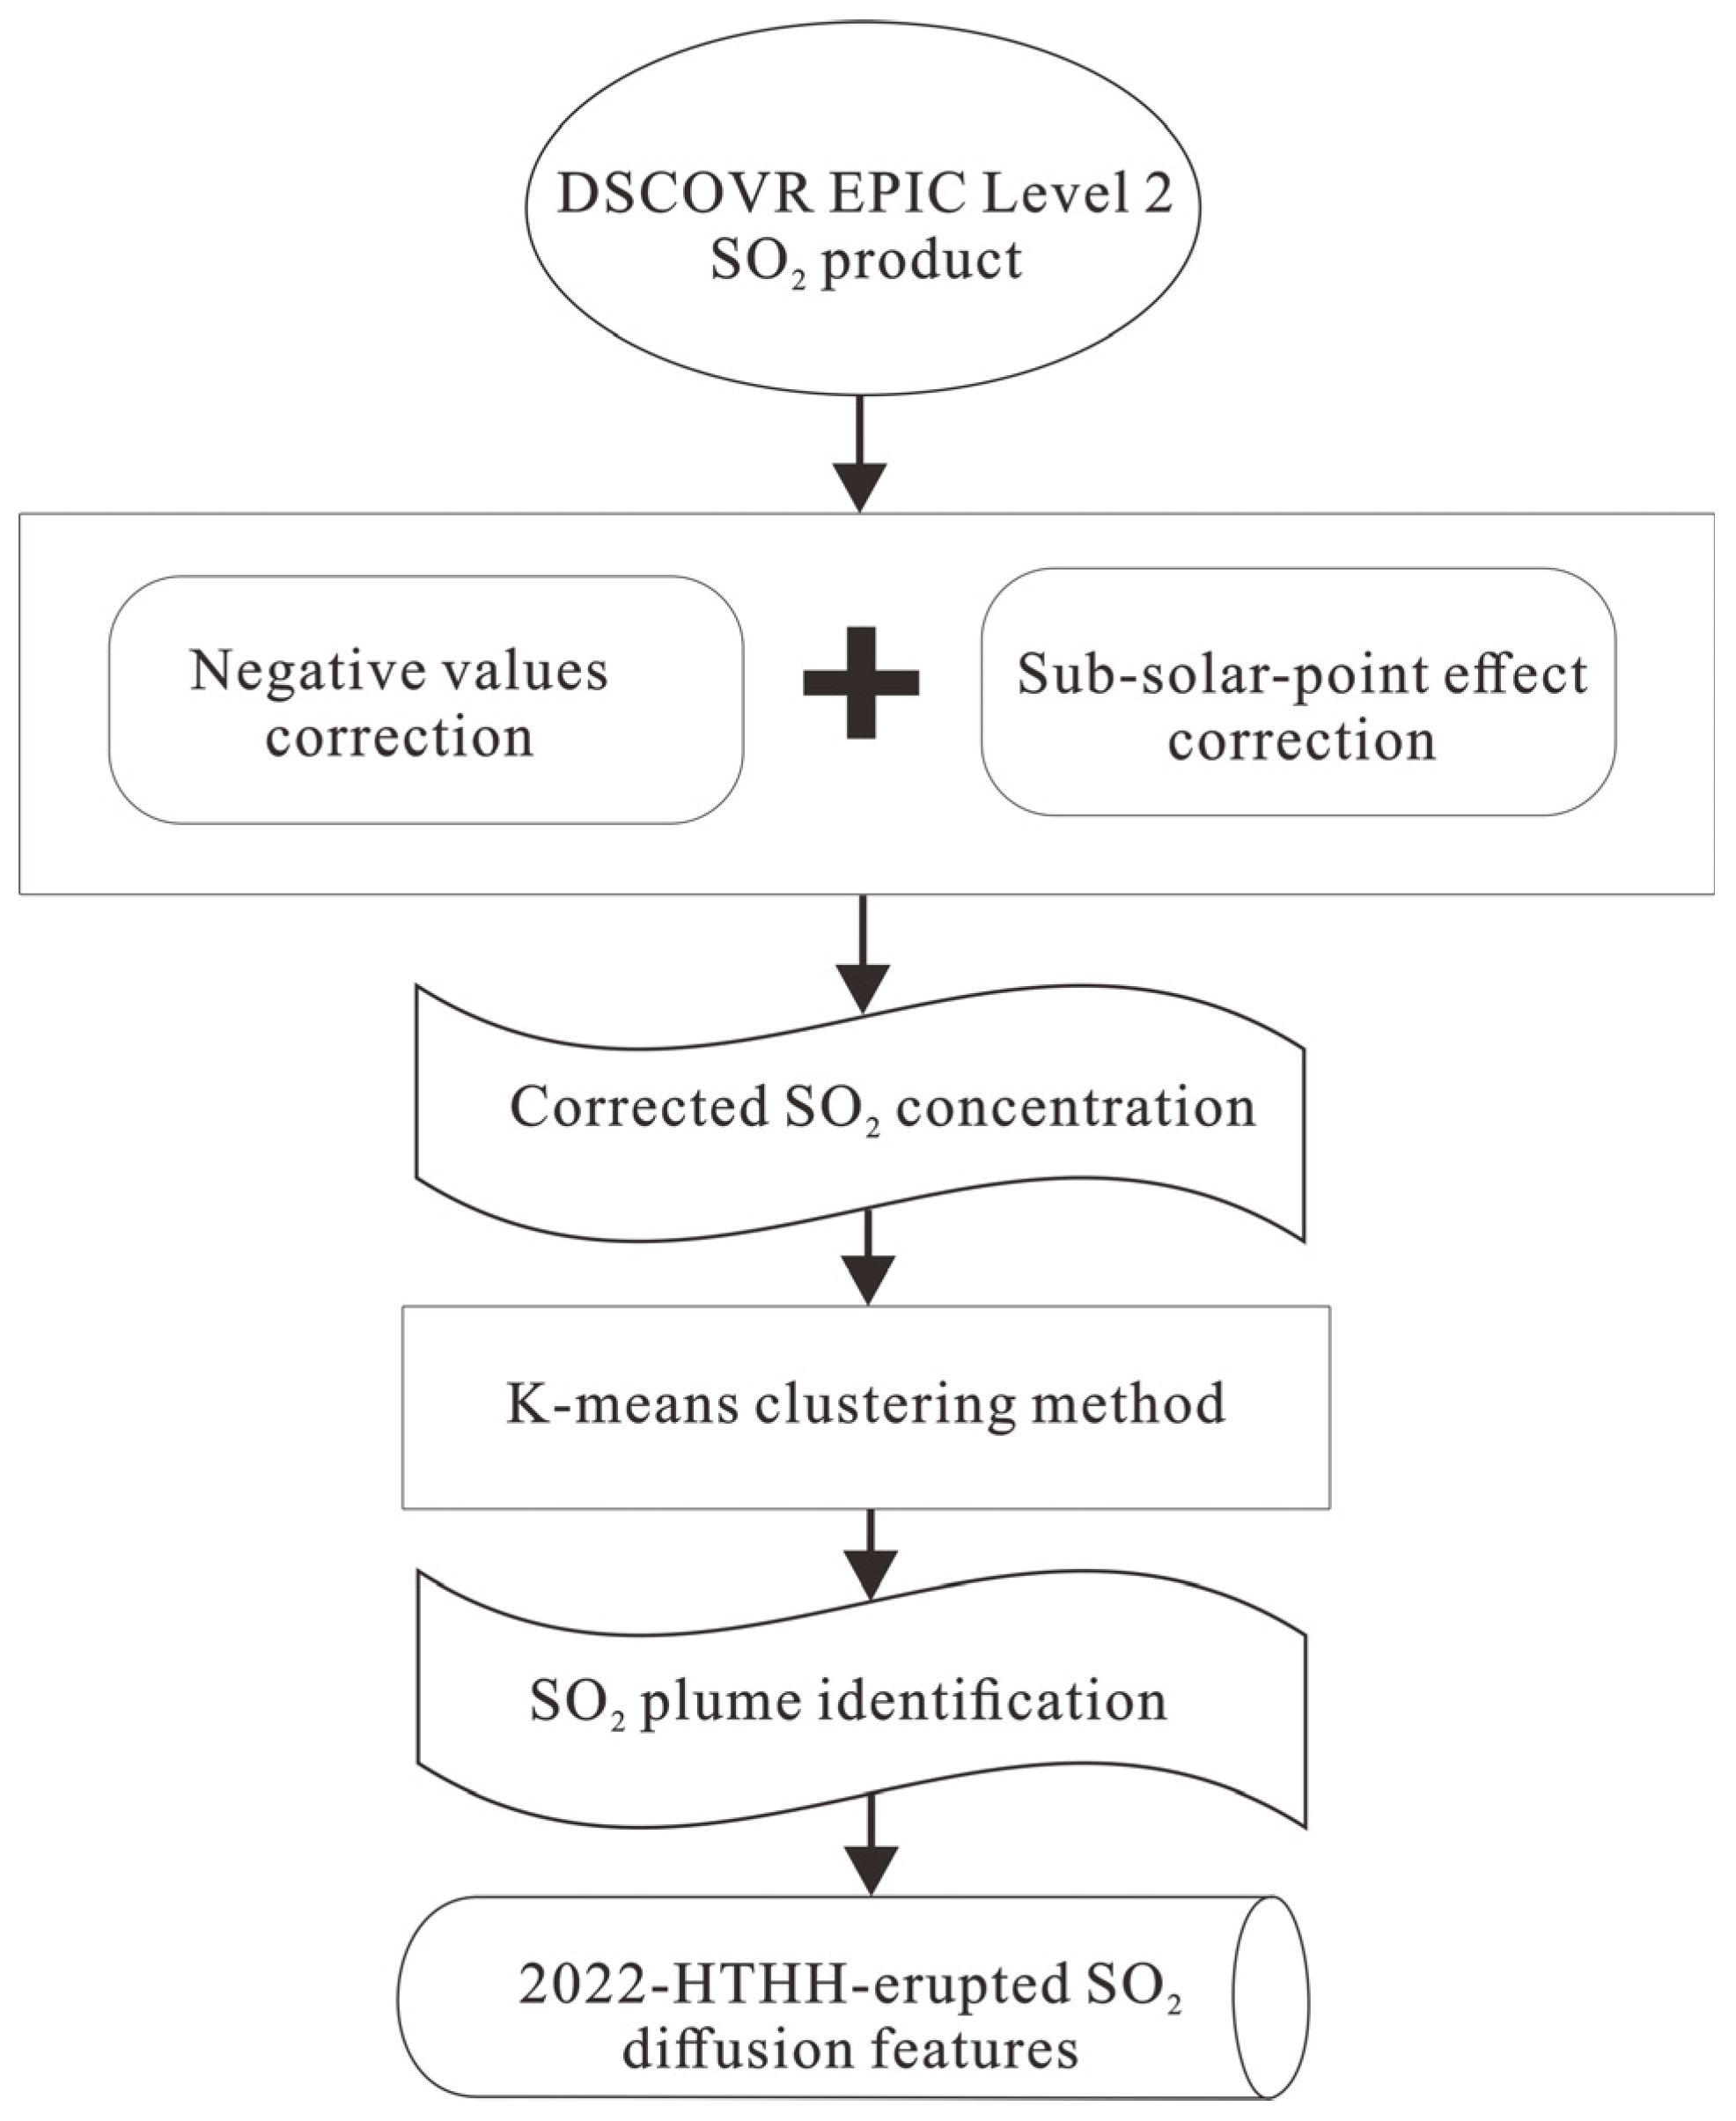
2.2. Negative Values and Sub-Solar-Point Effect Corrections

There exist abnormally negative SO2 concentration values in these data at the studied areas during the 2022 HTHH eruption, which may be caused by random errors from multiple sources. The first error source is the uncertainty in the retrieved O3 and SO2 columns, which is mainly caused by the biases in the radiance measurements and measurements noises. The second comes from retrieval errors in the major parameters of the DSCOVR EPIC SO2 retrieving model, including the atmosphere temperature profile and molecular absorption cross section [24]. Correcting these negative values requires deep amendments of the DSCOVR EPIC SO2 algorithm; therefore, retaining these negative values or replacing them with the interpolated values based on the positive SO2 concentrations are feasible processing methods [22]. However, we think that although these negative values are caused by random errors, they still contain certain low-value SO2 variation information; replacing them with their absolute values may be an intermediate way to both retain the potential low-value SO2 variability and to eliminate effects from negative SO2 concentrations. In comparison, interpolation will generate new values according to the positive SO2 concentration, which may obscure the actual measured variation of the low-value SO2 included in the negative SO2 concentrations. Importantly, we compare the negative value-absolutization approach with the method that replaces the negative SO2 concentration with the interpolated values based on the positive SO2 concentration. It was found that the correlation coefficient (R2) of these two methods reached 0.88 and their root mean square error (RMSE) was 0.97 DU for processing 2022 HTHH SO2 concentrations at 18:46 on 15 January in 2022 (15 h after the 2022 HTHH major eruption) (Figure 3). Furthermore, it was indicated that the average R2 and RMSE between these two approaches were 0.78 and 3.08 DU, respectively, for the total DSCOVR_EPIC_L2_O3SO2AI_02 data used in this study. The above information implies that the negative value-absolutization approach is a feasible way for DSCOVR_EPIC_L2_O3SO2AI_02. Nevertheless, these negative values have limited consequences for SO2 plume identification in this study. The SO2 plume is found by SO2 concentrations ≥ 15 DU to facilitate finding the major diffusion trends. However, samples with SO2 concentrations ≤ −15 DU only account for about 2.2% of the total DSCOVR_EPIC_L2_O3SO2AI_02 used in this study. In sum, compared to interpolation, absolution correction is considered to be a better way to process the negative SO2 values in DSCOVR_EPIC_L2_O3SO2AI_02 data, since the absolution correction retains the actual measured variation in the low-value SO2 included in the negative SO2 concentrations. Though the absolution way would bring certain uncertainty to the low-value SO2 concentrations, it had less consequences for the final results due to the very few absolute negative SO2 concentrations used in this study (about 2.2%).
Despite the negative SO2 concentrations, it was also found that there were several abnormal high SO2 concentrations (SOC) in the DSCOVR EPIC data, which were closely related to the sub-solar point instead of the HTHH eruption activity. This is probably attributed to the influence of reflectivity on the EPIC SO2 algorithm, which needs further exploration in future studies. To eliminate this effect, we have compared different interpolation methods, including the linear, cubic spline, adaptive inverse distance weighted (IDW), and kriging methods. It was found that kriging had the least root mean squared error (RMSE) (RMSEs for linear, cubic spline, IDW, and kriging are 4.7%, 3.9%, 6.4%, and 3.5%). Therefore, kriging was eventually used to correct the sub-solar point effect. Furthermore, this approach was also used in this study to correct the abnormal SOC that was apparently irrelative to the HTHH eruption.

2.3. SO2 Plume Identification

The SO2 plume was recognized by the k-means clustering method, which was proven to be a reliable approach for identifying gas plumes [25,26]. The core rationale of this approach was to find the optimized aggregation of SO2 in order to alleviate the influence from the non-volcano SO2 sources. The objective of the k-means method was to find the plume center that had the minimum Euclidean distance E:
E = min i = 1 m λ S i λ η i 2
where ηi is the centroid of point in Si, which can be derived by
η i = 1 | S i | λ S i λ
where s i is the size of Si. The k-means cluster was implemented by 2 steps. The first one was to give an initial set of k-means, then to assign every observation to the cluster with the least squared Euclidean distance. The second step was to update the centroids. Iterations of steps 1 and 2 were then utilized to find the best cluster centroids.

3. Results

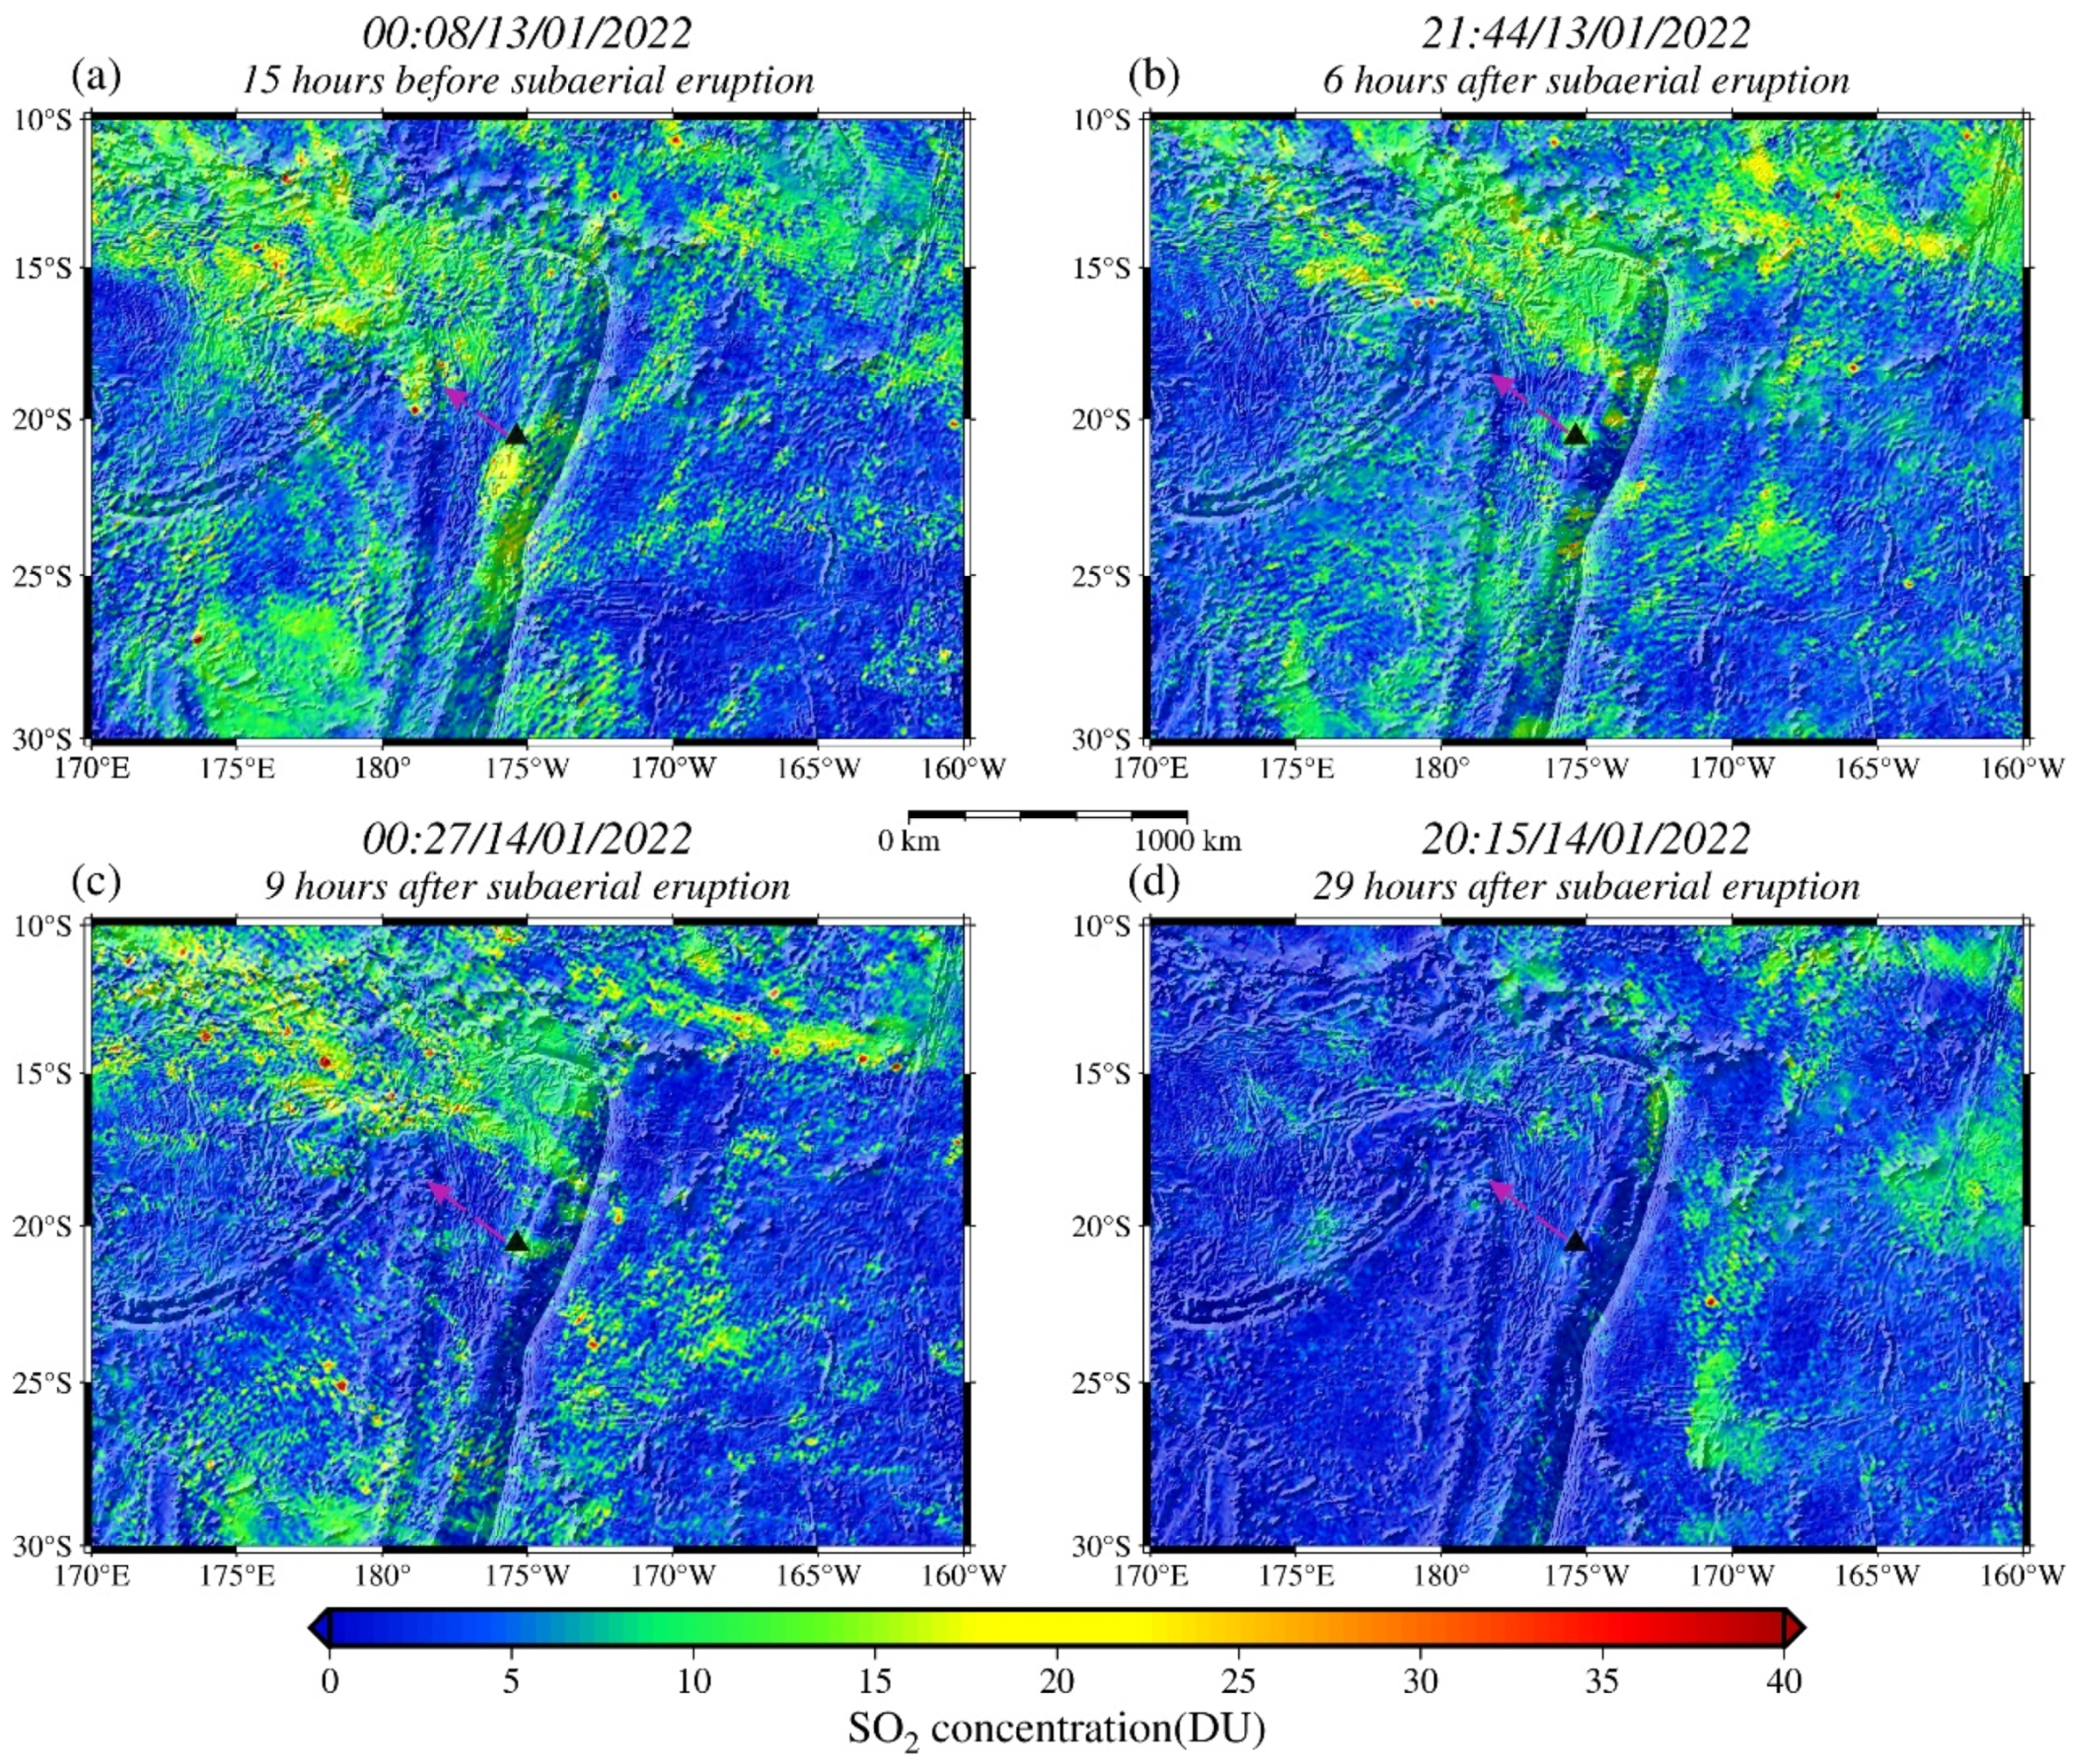
3.1. SO2 Diffusion Features of HTHH Subaerial Eruption Beginning at 15:20 on 13 January 2022 UTC

Volcanic eruptions are typically continuous processes. Before the 13 January 2022 subaerial eruption at 15:20, magma from the Earth interior gradually filled the volcanic conduit, which can release SO2 to the atmosphere. This hypothesis is supported by DSCOVR EPIC observations (Figure 4a); it was shown that there existed evident high SO2 concentration (SOC) areas around the HTHH volcano 15 h before the HTHH subaerial eruption, of which the SOC was approximately 20 Dobson units (DU) higher than the normal case (1 DU). Furthermore, the released SO2 had diffused to more than 1000 km away in the Southeast–Northwest direction, where the maximum SOC could be larger than 35 DU (Figure 4a). After the subaerial eruption, the SOC near the HTHH crater dramatically decrease with time from 20 DU on average (6 h after eruption, Figure 4b) to less-than 5 DU (29 h after eruption, Figure 4d). Furthermore, the comparison of the SO2 spatial distribution from Figure 4b–d indicated that the major SO2 diffusive direction was Southeast–Northwest, for which we think the most plausible reason was the driving force of the Southeast trade wind.
To clarify the SO2 diffusive characteristic along the major diffusive direction, the SOC against the distance from the HTHH crater along the Southeast–Northwest major diffusive direction at the time when fully diffused (20:15/14 January 2022) was extracted (Figure 5a). It was found that there were many SO2 plumes along the major diffusive direction (the purple dash rectangles in Figure 5a), and the farthest SO2 plume was found about 1500 km away from the HTHH crater, which indicated that the SO2 diffusion extent was 1500 km in the Southeast–Northwest major diffusive direction at this time. Particularly, we used the SO2 plumes to analyze the HTHH eruption SO2 diffusion extent to alleviate the influence from non-HTHH SO2 sources; the SOC of the SO2 plumes was defined by SOC ≥ 15 DU to facilitate the major diffusion trend findings. Particularly, there existed certain uncertainties in the major diffusion SOC results. The regional airflow may have brought SO2 from other sources to the HTHH SO2 plume, which could disturb the original statistically temporal-spatial distribution features of the HTHH SOC. Regionally high precipitable water could reduce the SOC by rainfall processes, thus affecting the HTTT SO2 diffusion features.
We also investigated the time-dependent HTHH eruption SO2 diffusion extent in all directions to evaluate the total SOC diffusive capabilities of the 15:20/13 January 2022 HTHH subaerial eruptions (Figure 5b). Results show that the HTHH subaerial eruption-emitted SO2 plumes had diffused as far as 6242 km by 02:20/15 January 2022 (about 1.5 h before the HTHH major eruption). It was also found that there existed an increase-then-decrease variation in the SO2 diffusion extent before the subaerial eruption. We consider that the most plausible reason was the energetic variation in the intermittent small eruptions before 15:20/13 January 2022, which may have boosted the SO2 diffusion extent soon after the eruptive activity happened, while the SO2 diffusion extent would then have decreased when the driving forces diminished. It was also found that there existed a short decrease in the SO2 diffusion extent after the 15:20/13 January 2022 HTHH subaerial eruptions up until 14 January (Figure 5b). This was attributed to the fact that the SO2 plumes induced by the subaerial eruption is near the crater; therefore, the SO2 diffusion extent during this period was dominated by the decreased driving forces of the intermittent small eruptions before 15:20/13 January 2022. After 14 January, the SO2 diffusion extent increased when the strengthening driving forces of the 13 January 2022 HTHH subaerial eruptions exceeded those of the pre-13 January 2022 small eruptive activities.
In this study, we utilized the basic k-means clustering method to identify the SO2 plume for computational simplicity, which was proven to be a reliable approach [25,26]. Other clustering methods may perform better, including hierarchical clustering, density-based clustering, model-based clustering, and conventional neural network clustering. Comparing and selecting the optimal clustering method could enable finer identification of SO2 plumes. However, these need substantial work and are beyond the scope of this study, but will be looked into in our future research.

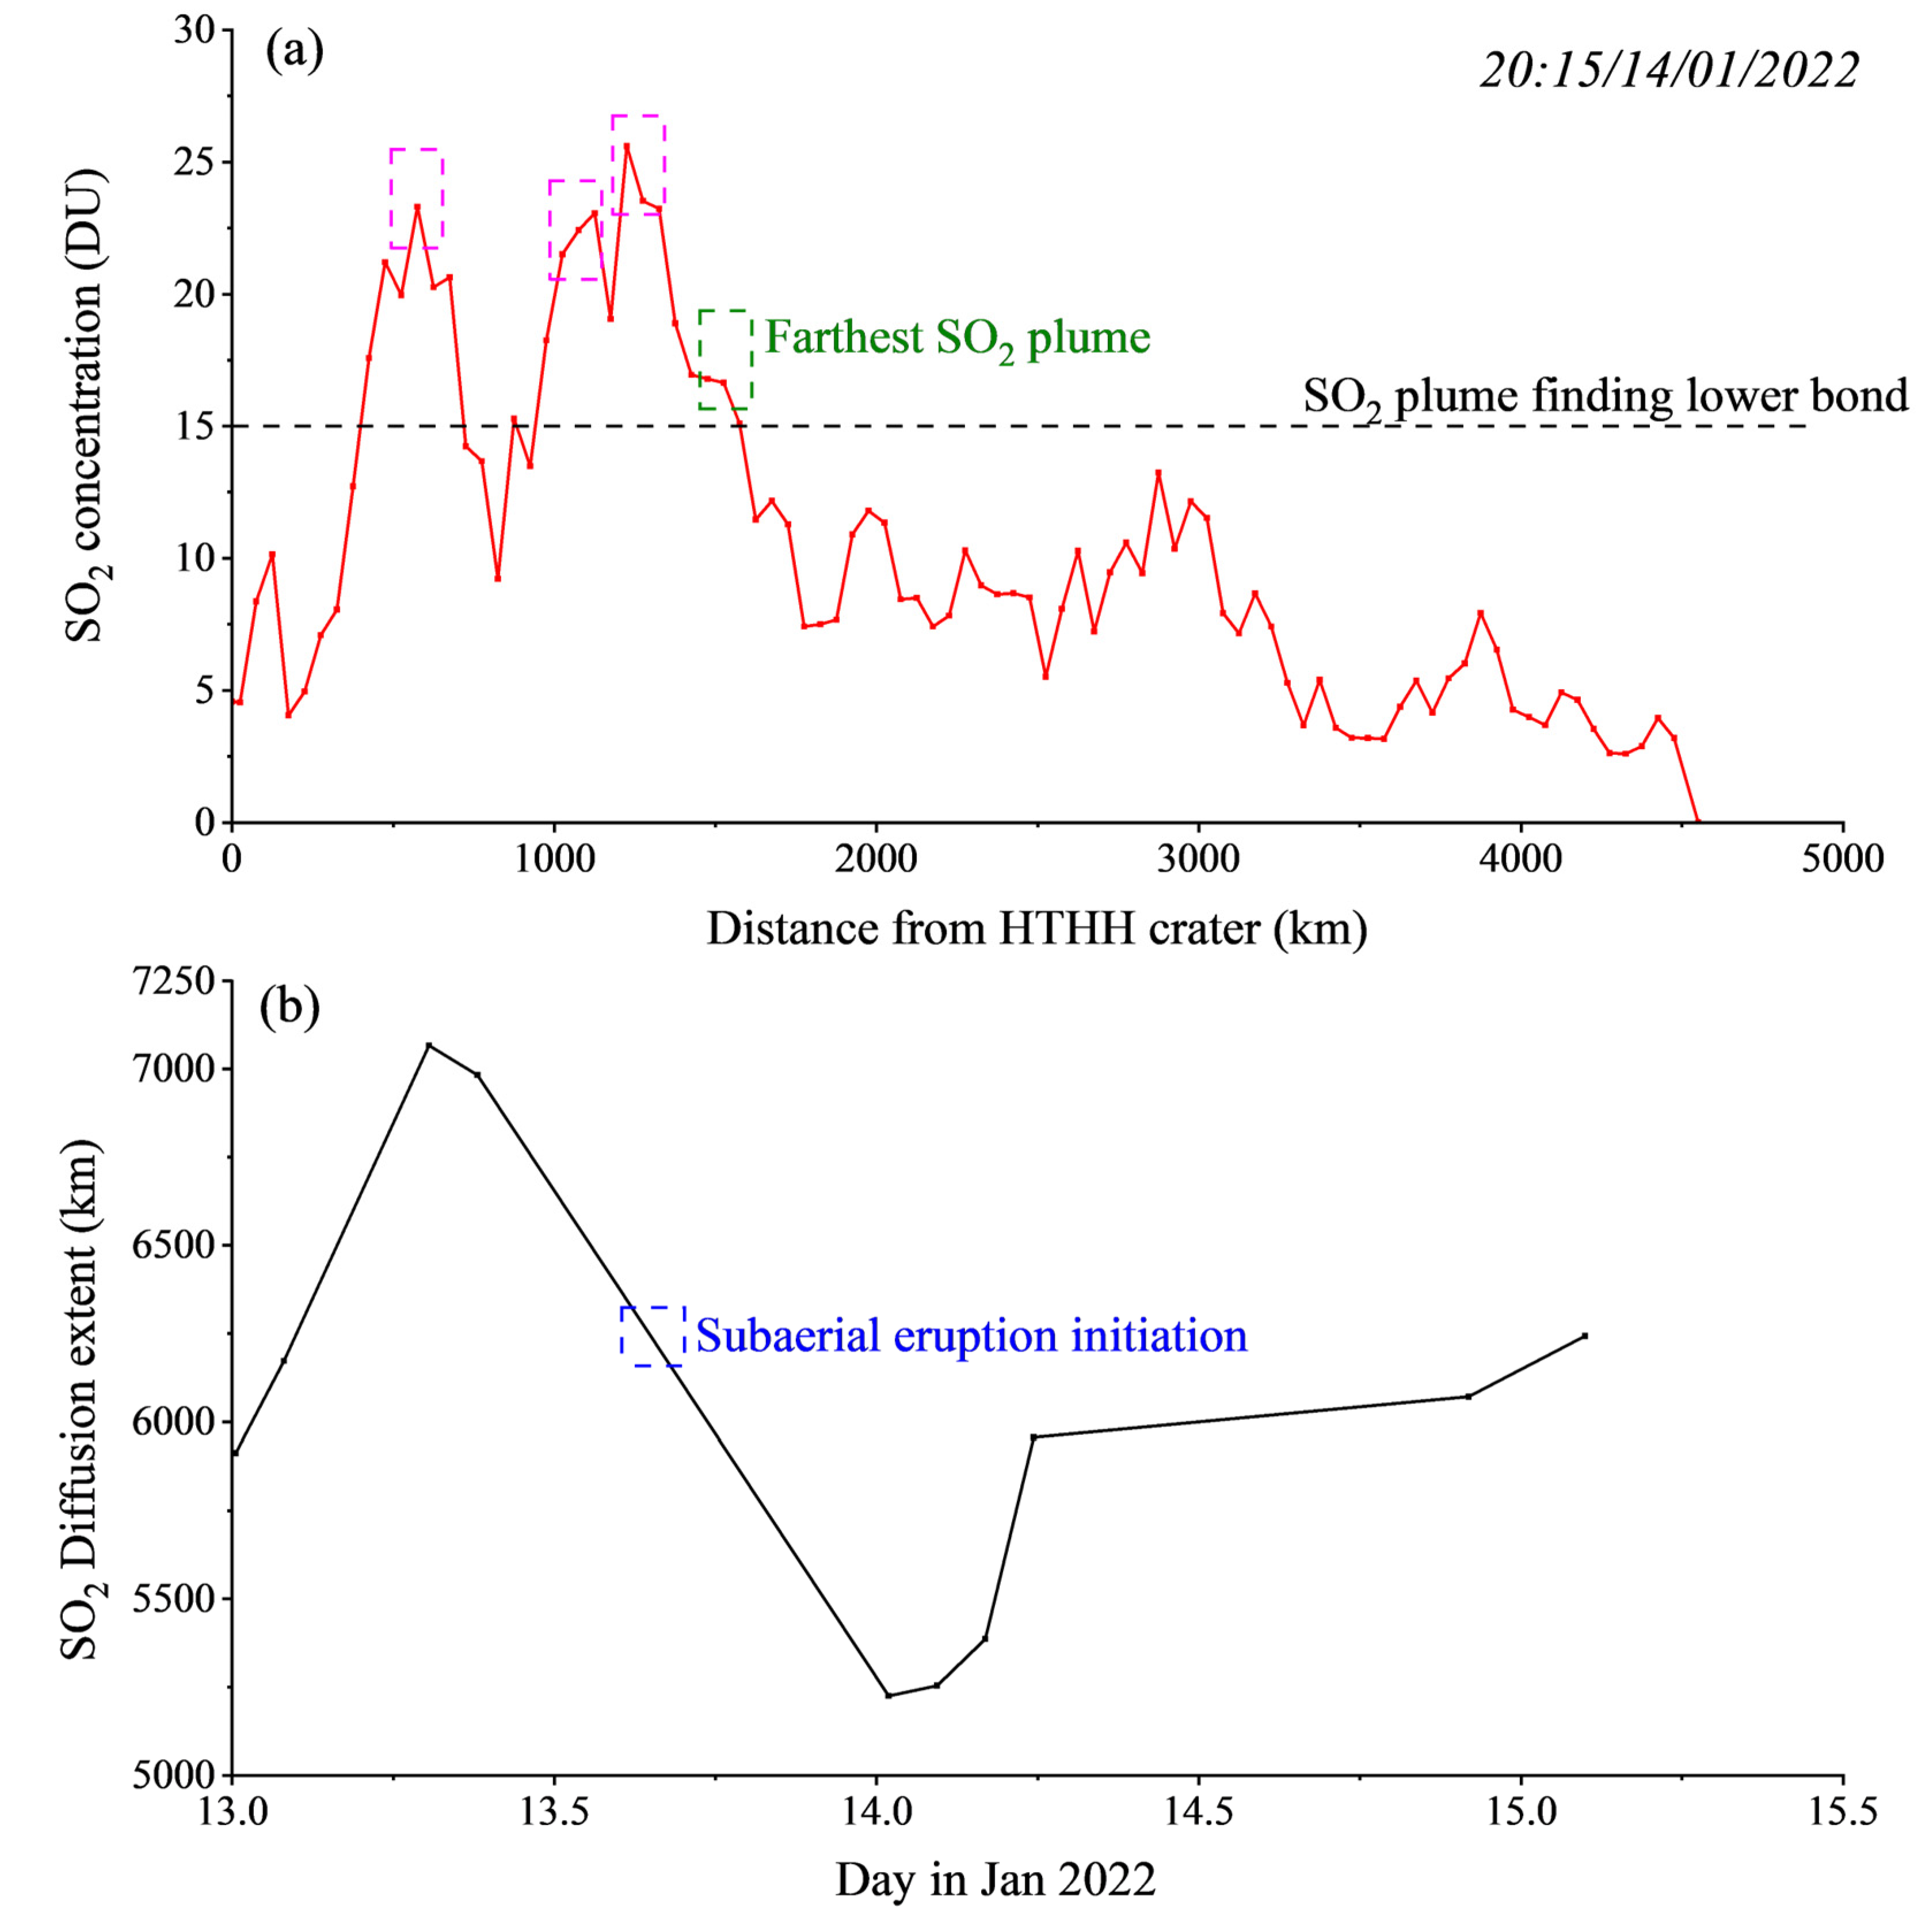
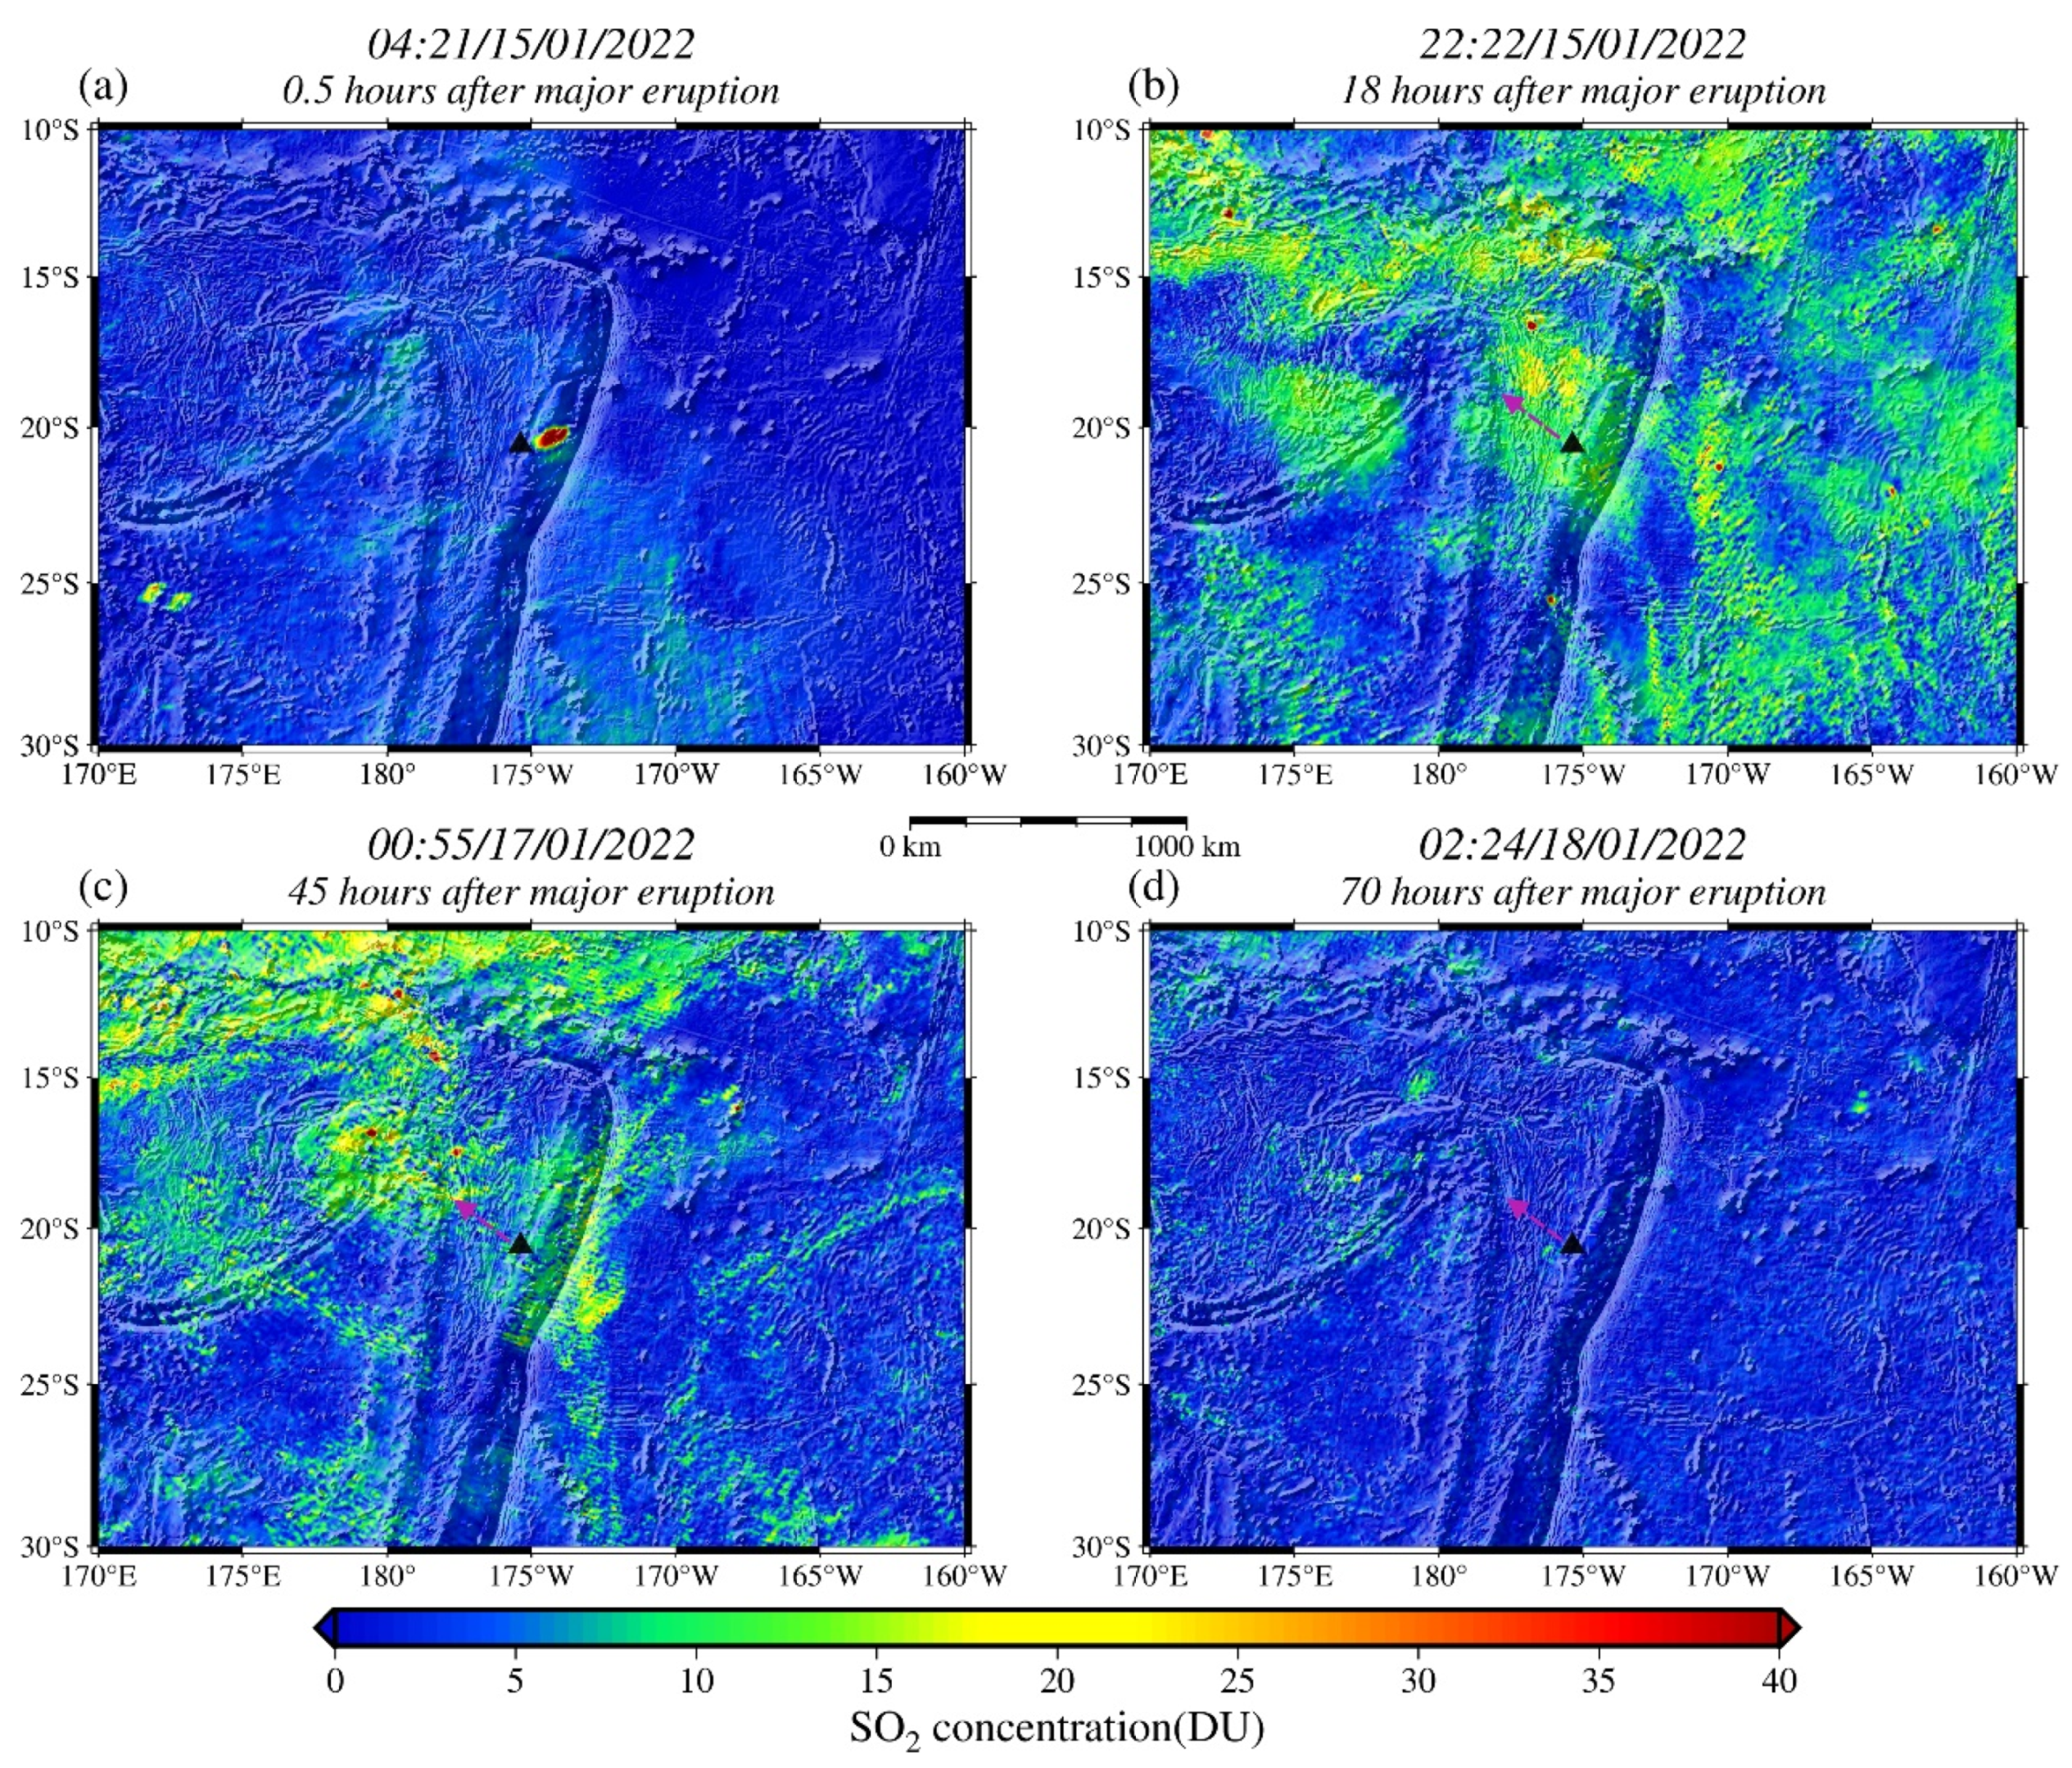
3.2. SO2 Diffusion Features of HTHH Major Eruption Initiating at 04:00 on 15 Jan 2022 UTC

After the major eruption, there was a rapid and significant increase in the SOC near the HTHH volcano (large SOC gradient near the black triangle in Figure 6a). It was also found that the SOC remains at the normal stage (1 DU) 0.5 h after the major eruption, except for the small eruptive umbrella areas, due to the fact that the DSCOVR EPIC can capture the SO2 just below the altitude of 13 km and that the SO2 released by the HTHH major eruption could reach as high as 58 km in altitude [8]. The location of the large SOC gradient slightly mismatched the HTHH volcano crater 0.5 h after the HTHH major eruption (Figure 6a), which we consider was probably induced by the nearby strong advection at that time [6].
Comparing Figure 6a–d shows that the major SO2 direction is Southeast–Northwest, which we think is probably driven by the Southeast trade wind. It was also found that the SOC near the HTHH volcano dramatically decreased to the normal stage (around 1DU) 70 h after the major eruption, i.e., the HTHH major erupted SO2 diffused out of the HTHH volcanic region in less than 70 h. Due to the influence of the Southeast trade wind, the SO2 plumes present the Northwest moving and aggregation style, indicating that the high-SOC regions mainly exist in the Northwest region to the HTHH volcano. Further analysis of the diffusion characteristics of the major direction in which the SO2 was spreading indicated that the 15 January 2022 HTHH major eruption-emitted SO2 plume diffused as far as 8600 km (crater distance of the farthest SO2 plume, green dash box in Figure 7a) in the Southeast–Northwest major diffusive direction by 02:24/18 January 2022 (about 70 h after the HTHH major eruption). Despite this, the time-dependent HTHH major eruption SO2 diffusion extent at all directions was also investigated (Figure 7b). It was indicated that the 15 January 2022 HTHH major eruption-emitted SO2 plume could extend to approximately 14,729 km away from the crater by 13:12/18 January 2022. Thereafter, the SO2 diffusion extent was not analyzed due to the absence of the DSCOVR EPIC SO2 product from 19 January to 11 February in 2022, when the volcanic activity nearly diminished. It was also found that there existed a short decrease in the SO2 diffusion extent after the major eruption until 08:00/15 January 2022 (4 h after the major eruption); this was attributed to the fact that SO2 plumes induced by the major eruption were near the crater during this period. Therefore, the SO2 diffusion extent was dominated by the decreased driving forces of the subaerial eruption initiating at 15:20/13 January 2022.
This preliminary study revealed the SO2 diffusion characteristics of the 2022 HTHH eruption. However, due to the limitation of the DSCOVR EPIC spatial-temporal resolution and operation scheduling, refining the SOC at a specific region is difficult. This we think could be resolved by combining an air pollution dispersion model like FLEXPART, which could enable more precise simulations of SO2 and the aerosol diffusion process and trajectory. We hope to carry this out in our future work.

4. Discussion

Benefiting from the substantial orbital altitude (about 1,500,000 km, Sun–Earth L1 point) of DSCOVR, our study provides a continuous record of the SO2 diffusion extent based on the DSCOVR EPIC SO2 product, which provides key input parameters for the tropospheric sulfate aerosol estimating model. This could help to deepen our understanding of the impact of the 2022 HTHH eruption on the global atmospheric environment and to provide vital information for the volcanic released-SO2-induced O3 variation research. Despite these, the 2022 HTHH eruption SO2 diffusion features derived in this study offer crucial constraints for the estimations of other HTHH eruption gasses and substances, including CO2 and toxic trace metals like mercury.
There existed abnormally negative SOC values in DSCOVR-EPIC-L2-SO2-v03 during the HTHH eruptions, which were caused by random errors. Partial errors came from the O3 and SO2 columns retrieving uncertainties, which resulted from biases in the radiance measurements and measurements noises. Others were mainly retrieval errors in the DSCOVR EPIC SO2 retrieving model input parameters, including the atmosphere temperature profile and molecular absorption cross section [24]. In this study, we used their absolute values to fix them. Though comparisons with the normal SOC observations regarding magnitude and trend indicate that such an absolute-value correction is reasonable, we still consider that further research about this EPIC negative value correction, with the aim of discovering the mechanism underlying it, is necessary. Though we made an effort to the correct the negative value for the DSCOVR EPIC SO2 product, these negative SO2 concentrations have limited consequences for this study’s findings. This is due to the fact that the SO2 plumes with SO2 concentrations ≥ 15 DU were found to facilitate the major diffusion trend findings; however, samples with SO2 concentrations ≤ −15 DU account for about 2.2% of the total DSCOVR_EPIC_L2_O3SO2AI_02 used in this study. Furthermore, as mentioned in Section 2.2, we corrected several abnormal high SOCs with the adaptive reverse distance weight approach, which is closely related to the sub-solar point instead of the HTHH eruption activity, to improve the data quality. We consider one of the major reasons behind this abnormality to be the influence of the sub-solar point on the temperature profile, which is one of the core input parameters of the DSCOVR EPIC SO2 model [24]. Further quantification of such an effect instead of inverse distance correction could increase the credibility of the research based on the DSCOVR EPIC SO2 product. However, such a quantification involves the DSCOVR EPIC basic algorithm and atmospheric physics, which are beyond the scope of this study. We hope to conduct this research in our future work.
Furthermore, when we compared the DSCOVR EPIC SO2 data with those from sentinel-5p and GOES-17, it was found that there were evident differences between their SOC values: the SOC of DSCOVR EPIC stayed around magnitudes of ten, whereas the SOCs of sentinel-5p and GOES-17 exhibited magnitudes in the hundreds, though the trends from these three datasets were consistent. We think the most plausible reason for this SOC magnitude discrepancy is the altitude restriction in their base algorithm. The EPIC base algorithm indicates that the SOC is calculated by the vertical SO2 content summation below 13 km, whereas there are no altitude restrictions in the Sential-5p and GOES-17 SOC base algorithm. A uniform altitude restriction and consistent spatial resolution resampling could improve data fusion, which we plan to explore in future work.

5. Conclusions

This study investigated the SO2 diffusion features of the 2022 HTHH eruptions based on DSCOVR EPIC SO2 products to complement current low-orbit satellite research. The analysis of the SO2 plumes’ major direction profiles indicated that the SO2 diffusion extent of the subaerial eruption initiating at 15:20/13 January 2022 was approximately 1500 km in the Southeast–Northwest major diffusive direction by 20:15/14 January 2022 (about 29 h after the HTHH subaerial eruption). All-direction SO2 plume analysis showed that the HTHH subaerial eruption-emitted SO2 plume diffused as far as 6242 km by 02:20/15 January 2022. Furthermore, these two analyses focusing on the HTHH major eruption initiating at 04:00/15 January 2022 implied that the HTHH major eruption-emitted SO2 plumes diffused as far as 8600 km in the Southeast–Northwest major diffusive direction by 02:24/18 January 2022 (about 70 h after the HTHH major eruption). It was also implied that the HTHH major eruption-emitted SO2 plumes extended approximately 14,729 km away from the crater by 13:12/18 January 2022. These findings could provide certain guidance for volcanic gas estimations, thus helping to deepen our understanding of the volcanic impact on climate change.

Author Contributions

Conceptualization, W.D.; methodology, W.D.; software, Y.H.; validation, Y.H.; formal analysis, Y.H. and W.D.; visualization, Y.H. and W.D. writing, Y.H. and W.D. All authors have read and agreed to the published version of the manuscript.

Funding

This work was supported by the National Natural Science Foundation of China (Grant No.: 42301541) and China Postdoctoral Science Foundation (Grant No.: 2022M711668).

Institutional Review Board Statement

Not applicable.

Informed Consent Statement

Not applicable.

Data Availability Statement

The DSCOVR EPIC SO2 product can be freely accessed at https://eosweb.larc.nasa.gov/project/DSCOVR/DSCOVR_EPIC_L2_O3SO2AI_02, accessed on 20 March 2024.

Acknowledgments

We would like to thank Rui Cao for results plotting.

Conflicts of Interest

The authors declare no conflicts of interest.

References

  1. Chim, M.M.; Aubry, T.J.; Abraham, N.L.; Marshall, L.; Mulcahy, J.; Walton, J.; Schmidt, A. Climate Projections Very Likely Underestimate Future Volcanic Forcing and Its Climatic Effects. Geophys. Res. Lett. 2023, 50, e2023GL103743. [Google Scholar] [CrossRef]
  2. Pope, F.D.; Braesicke, P.; Grainger, R.G.; Kalberer, M.; Watson, I.M.; Davidson, P.J.; Cox, R.A. Stratospheric aerosol particles and solar-radiation management. Nat. Clim. Change 2012, 2, 713–719. [Google Scholar] [CrossRef]
  3. Aubry, T.J.; Staunton-Sykes, J.; Marshall, L.R.; Haywood, J.; Abraham, N.L.; Schmidt, A. Climate change modulates the stratospheric volcanic sulfate aerosol lifecycle and radiative forcing from tropical eruptions. Nat. Commun. 2021, 12, 4708. [Google Scholar] [CrossRef] [PubMed]
  4. Marshall, L.R.; Maters, E.C.; Schmidt, A.; Timmreck, C.; Robock, A.; Toohey, M. Volcanic effects on climate: Recent advances and future avenues. Bull. Volcanol. 2022, 84, 54. [Google Scholar] [CrossRef]
  5. Clare, M.A.; Yeo, I.A.; Watson, S.; Wysoczanski, R.; Seabrook, S.; Mackay, K.; Hunt, J.E.; Lane, E.; Talling, P.J.; Pope, E.; et al. Fast and destructive density currents created by ocean-entering volcanic eruptions. Science 2023, 381, 1085–1092. [Google Scholar] [CrossRef] [PubMed]
  6. Gupta, A.K.; Bennartz, R.; Fauria, K.E.; Mittal, T. Eruption chronology of the December 2021 to January 2022 Hunga Tonga-Hunga Ha’apai eruption sequence. Commun. Earth Environ. 2022, 3, 314. [Google Scholar] [CrossRef]
  7. Xu, J.; Li, D.; Bai, Z.; Tao, M.; Bian, J. Large Amounts of Water Vapor Were Injected into the Stratosphere by the Hunga Tonga–Hunga Ha’apai Volcano Eruption. Atmosphere 2022, 13, 912. [Google Scholar] [CrossRef]
  8. Barone, B.; Letelier, R.M.; Rubin, K.H.; Karl, D.M. Satellite Detection of a Massive Phytoplankton Bloom Following the 2022 Submarine Eruption of the Hunga Tonga-Hunga Ha’apai Volcano. Geophys. Res. Lett. 2022, 49, e2022GL099293. [Google Scholar] [CrossRef]
  9. Shikwambana, L.; Sivakumar, V.; Xongo, K. Tracking the Transport of SO2 and Sulphate Aerosols from the Tonga Volcanic Eruption to South Africa. Atmosphere 2023, 14, 1556. [Google Scholar] [CrossRef]
  10. Boichu, M.; Grandin, R.; Blarel, L.; Torres, B.; Derimian, Y.; Goloub, P.; Brogniez, C.; Chiapello, I.; Dubovik, O.; Mathurin, T.; et al. Growth and Global Persistence of Stratospheric Sulfate Aerosols From the 2022 Hunga Tonga–Hunga Ha’apai Volcanic Eruption. J. Geophys. Res. Atmos. 2023, 128, e2023JD039010. [Google Scholar] [CrossRef]
  11. Li, R.; Lei, J.; Kusche, J.; Dang, T.; Huang, F.; Luan, X.; Zhang, S.-R.; Yan, M.; Yang, Z.; Liu, F.; et al. Large-Scale Disturbances in the Upper Thermosphere Induced by the 2022 Tonga Volcanic Eruption. Geophys. Res. Lett. 2023, 50, e2022GL102265. [Google Scholar] [CrossRef]
  12. Basha, G.; Ratnam, M.V.; Kumar, A.H.; Jiang, J.H.; Babu, S.R.; Kishore, P. Impact of Hunga Tonga-Hunga Ha’apai Volcanic Eruption on Stratospheric Water Vapour, Temperature, and Ozone. Remote Sens. 2023, 15, 3602. [Google Scholar] [CrossRef]
  13. Jiang, N.; Gao, Z.; Xu, Y.; Xu, T.; Guo, A.; Wu, Y.; Li, S. Response Analysis on Multi-Parameters in the 2022 Tonga Volcanic Eruption Using Satellite-Ground Combined Data. J. Geophys. Res. Atmos. 2023, 128, e2023JD038839. [Google Scholar] [CrossRef]
  14. Pandey, P.C. Highlighting the role of earth observation Sentinel5P TROPOMI in monitoring volcanic eruptions: A report on Hunga Tonga, a Submarine Volcano. Remote Sens. Lett. 2022, 13, 912–923. [Google Scholar] [CrossRef]
  15. Carn, S.A.; Krotkov, N.A.; Fisher, B.L.; Li, C. Out of the blue: Volcanic SO2 emissions during the 2021–2022 eruptions of Hunga Tonga—Hunga Ha’apai (Tonga). Front. Earth Sci. 2022, 10, 1–18. [Google Scholar] [CrossRef]
  16. Matoza, R.S.; Fee, D.; Assink, J.D.; Iezzi, A.M.; Green, D.N.; Kim, K.; Toney, L.; Lecocq, T.; Krishnamoorthy, S.; Lalande, J.-M.; et al. Atmospheric waves and global seismoacoustic observations of the January 2022 Hunga eruption, Tonga. Science 2022, 377, 95–100. [Google Scholar] [CrossRef] [PubMed]
  17. Smith, G.L.; Wong, T.; Bush, K.A. Time-Sampling Errors of Earth Radiation From Satellites: Theory for Outgoing Longwave Radiation. IEEE Trans. Geosci. Remote Sens. 2015, 53, 1656–1665. [Google Scholar] [CrossRef]
  18. Smith, G.L.; Wong, T. Time-Sampling Errors of Earth Radiation From Satellites: Theory for Monthly Mean Albedo. IEEE Trans. Geosci. Remote Sens. 2016, 54, 3107–3115. [Google Scholar] [CrossRef]
  19. Burt, J.; Smith, B. Deep Space Climate Observatory: The DSCOVR mission. In Proceedings of the 2012 IEEE Aerospace Conference, Big Sky, MT, USA, 3–10 March 2012; pp. 1–13. [Google Scholar]
  20. Marshak, A.; Herman, J.; Adam, S.; Karin, B.; Carn, S.; Cede, A.; Geogdzhayev, I.; Huang, D.; Huang, L.-K.; Knyazikhin, Y.; et al. Earth Observations from DSCOVR EPIC Instrument. Bull. Am. Meteorol. Soc. 2018, 99, 1829–1850. [Google Scholar] [CrossRef] [PubMed]
  21. Ahn, C.; Torres, O.; Jethva, H.; Tiruchirapalli, R.; Huang, L.-K. Evaluation of Aerosol Properties Observed by DSCOVR/EPIC Instrument From the Earth-Sun Lagrange 1 Orbit. J. Geophys. Res. Atmos. 2021, 126, e2020JD033651. [Google Scholar] [CrossRef]
  22. Efremenko, D.S.; Loyola, R.D.G.; Hedelt, P.; Spurr, R.J.D. Volcanic SO2 plume height retrieval from UV sensors using a full-physics inverse learning machine algorithm. Int. J. Remote Sens. 2017, 38, 1–27. [Google Scholar] [CrossRef]
  23. Esse, B.; Burton, M.; Hayer, C.; Pfeffer, M.A.; Barsotti, S.; Theys, N.; Barnie, T.; Titos, M. Satellite derived SO2 emissions from the relatively low-intensity, effusive 2021 eruption of Fagradalsfjall, Iceland. Earth Planet. Sci. Lett. 2023, 619, 118325. [Google Scholar] [CrossRef]
  24. Huang, X.; Yang, K. Algorithm theoretical basis for ozone and sulfur dioxide retrievals from DSCOVR EPIC. Atmos. Meas. Tech. 2022, 15, 5877–5915. [Google Scholar] [CrossRef]
  25. Govender, P.; Sivakumar, V. Application of k-means and hierarchical clustering techniques for analysis of air pollution: A review (1980–2019). Atmos. Pollut. Res. 2020, 11, 40–56. [Google Scholar] [CrossRef]
  26. Funk, C.C.; Theiler, J.; Roberts, D.A.; Borel, C.C. Clustering to improve matched filter detection of weak gas plumes in hyperspectral thermal imagery. IEEE Trans. Geosci. Remote Sens. 2001, 39, 1410–1420. [Google Scholar] [CrossRef]
Figure 1. Geolocation of the Hunga Tonga–Hunga Ha’apai (HTHH) submarine volcano (The red triangle).
Atmosphere 15 01164 g001
Figure 2. Total workflow of this study.
Atmosphere 15 01164 g002
Figure 3. (a) Absolute SO2 concentration (SOC) and (b) interpolated SOC along the distance from the HTHH crater in the north diffusive direction at 18:46 on Jan 15 2022 (15 h after the 2022 HTHH major eruption). The correlation coefficient (R2) and root mean square error (RMSE) between (a,b) are 0.88 and 0.97 DU, respectively.
Atmosphere 15 01164 g003
Figure 4. SO2 spatial distributions (a) 15 h before, (b) 6 h after, (c) 9 h after, and (d) 29 h after the 15:20 13 January 2022 HTHH subaerial eruption, respectively. Black triangle represents the HTHH volcano location; the purple dash arrow line represents the major Southeast-to-Northwest SO2 diffusion direction.
Atmosphere 15 01164 g004
Figure 5. (a) SO2 concentration along the distance from the HTHH crater in the Southeast–Northwest major diffusive direction at 20:15 on 14 January 2022 (29 h after the 2022 HTHH subaerial eruption). Red line denotes the SO2 concentration, purple frames indicate the SO2 plumes. (b) Temporally dependent SO2 diffusive extent of the HTHH subaerial eruption initiating at 15:20/13 January 2022 UTC.
Atmosphere 15 01164 g005
Figure 6. SO2 spatial distributions (a) 0.5 h (b) 18 h, (c) 45 h, and (d) 70 h after the 04:00 15 January 2022 HTHH major eruption, respectively. The black triangle represents the HTHH volcano location; the purple dash arrow line represents the major Southeast-to-Northwest SO2 diffusion direction.
Atmosphere 15 01164 g006
Figure 7. (a) SO2 concentration along the distance from the HTHH crater in the Southeast–Northwest major diffusive direction at 02:24 on 18 January 2022 (70 h after the 2022 HTHH major eruption). (b) Temporally dependent SO2 diffusive extent of the HTHH major eruption initiating at 04:00/15 January 2022 UTC. Red solid line in (a) denotes the SO2 concentration, black solid line in (b) indicates the SO2 diffusion extent.
Atmosphere 15 01164 g007
Disclaimer/Publisher’s Note: The statements, opinions and data contained in all publications are solely those of the individual author(s) and contributor(s) and not of MDPI and/or the editor(s). MDPI and/or the editor(s) disclaim responsibility for any injury to people or property resulting from any ideas, methods, instructions or products referred to in the content.

