Systematic Review

Feasibility and Affordability of Low-Cost Air Sensors with Internet of Things for Indoor Air Quality Monitoring in Residential Buildings: Systematic Review on Sensor Information and Residential Applications, with Experience-Based Discussions

1
Design & Health Lab, Department Architecture, Built Environment and Construction Engineering, Politecnico di Milano, Via G. Ponzio 31‚ 20133 Milan, Italy
2
Department of Environment and Health, Italian National Institute of Health (Istituto Superiore di Sanità), 00161 Rome, Italy
*
Author to whom correspondence should be addressed.
Atmosphere 2024, 15(10), 1170; https://doi.org/10.3390/atmos15101170
Submission received: 31 July 2024 / Revised: 10 September 2024 / Accepted: 18 September 2024 / Published: 30 September 2024
(This article belongs to the Special Issue Enhancing Indoor Air Quality: Monitoring, Analysis and Assessment)

Abstract

:
In residential buildings that are private, autonomous, and occupied spaces for most of the time, it is necessary to maintain good indoor air quality (IAQ), especially when there are children, elderly, or other vulnerable users. Within the development of sensors, their low-cost features with adequate accuracy and reliability, as well as Internet of Things applications, make them affordable, flexible, and feasible even for ordinary occupants to guarantee IAQ monitoring in their homes. This systematic review searched papers based on Scopus and Web of Science databases about the Low-Cost Sensors (LCS) and IoT applications in residential IAQ research, and 23 studies were included with targeted research contents. The review highlights several aspects of the active monitoring strategies in residential buildings, including the following: (1) Applying existing appropriate sensors and their target pollutants; (2) Applying micro-controller unit selection; (3) Sensors and devices’ costs and their monitoring applications; (4) Data collection and storage methods; (5) LCS calibration methods in applications. In addition, the review also discussed some possible solutions and limitations of LCS applications in residential buildings based on the applications from the included works and past device development experiences.

1. Introduction

Maintaining good Indoor Air Quality (IAQ) is important for the occupant’s health and well-being in living and working spaces. However, most indoor air pollutants are not monitored to better understand the resulting metrics and exceed the “vision” of thermal comfort [1,2]. Medium/long-term exposure to these pollutants can result in serious and irreversible health conditions, making it imperative to implement IAQ monitoring strategies [2,3]. These strategies not only help to detect and visualize otherwise invisible threats but also play a critical role in identifying necessary interventions and promoting behavioral changes among occupants to improve IAQ outcomes [4,5,6]. This is particularly relevant in residential environments where individuals spend more than 65% of their time, with vulnerable populations and remote workers (e.g., those engaged in smart working) spending even more time indoors [7,8,9].
Those private, autonomous, and occupied spaces are highly influenced by residential activities, users’ lifestyles, housing characteristics, continuous presence, varying intensity of use, activities performed, behaviors, occupancy density, workstations, technological equipment (e.g., computers, photocopiers, printers, etc.), air changes, and materials. Pollutants resulting from the previous points and pollutants already present that have become concentrated require better IAQ management [10,11,12,13]. Adopting good IAQ practices within residential environments can lead to the application of these practices across various other contexts [11].
With the development of sensors and the Internet of Things (IoT), the combination of Low-Cost Sensors (LCS) and IoT provided more feasible and affordable solutions for IAQ monitoring, which provide ad-hoc information and responses, and help to improve primary prevention interventions, thus reducing unintended health consequences. It found that even if the LCS technology still has some defects, such as requiring regular calibration, the monitoring results are reliable for civilian use [14,15]. The big data from the extensive air sensor can also be used for training an intelligent model, which can be applied to building IAQ management in return [15].
As LCS and IoT are trending topics in air quality monitoring, there are many other review works published in recent years:
  • Karagulian et al. [16] published a non-systematic review in 2019 on the performance of LSC in the 105 papers published between 2010 and 2019, which evaluated the quality of data in results and calibrations with different algorithms, with the cost of sensors included in details. However, this work included more commercial devices with LCS rather than individual sensors, and the cost of devices is based on the price of sensors before 2019. In the included references, there were already many works designed with IoT technology, but this review did focus on this aspect.
  • Chojer et al. [13] published a systematic review in 2020 among the 35 papers published between 2012 and 2019, which focused on monitoring devices development and related information such as sensor types and principles, detection range, reference instruments, calibration methods, and accuracy vs. reference. In the discussion and conclusion, they focused more on the performance of the devices’ calibration accuracy and how to improve it.
  • Saini et al. published two systematic reviews. The one in 2020 [17] discussed more about the measurement system with IoT applications. It summarized useful information, such as on Micro-Control Unit (MCU), data transmission, reading, storage, notification methods, and system power supply methods, in the 40 papers published from 2015 to 2020. The other one in 2021 [18] reviewed 40 papers published between 2015 and 2021. This one focused on and summarized the sensors applied in the included papers, which are classified according to their target parameters, and found answers for the applied sensors, with their features and costs mentioned.
  • Sá et al. [15] published a systematic review in 2022 among the 48 papers published before 2021 (and it is also included in this review). This work summarises the sensor information of those applied in fieldwork applications and makes comparisons of their performances.
  • García et al. [19] published a non-systematic review in 2022 without specifying the sources of the included papers. It discussed the pros and cons of LCS devices, their applications, and many key issues based on the findings from many previous reviews and related works.
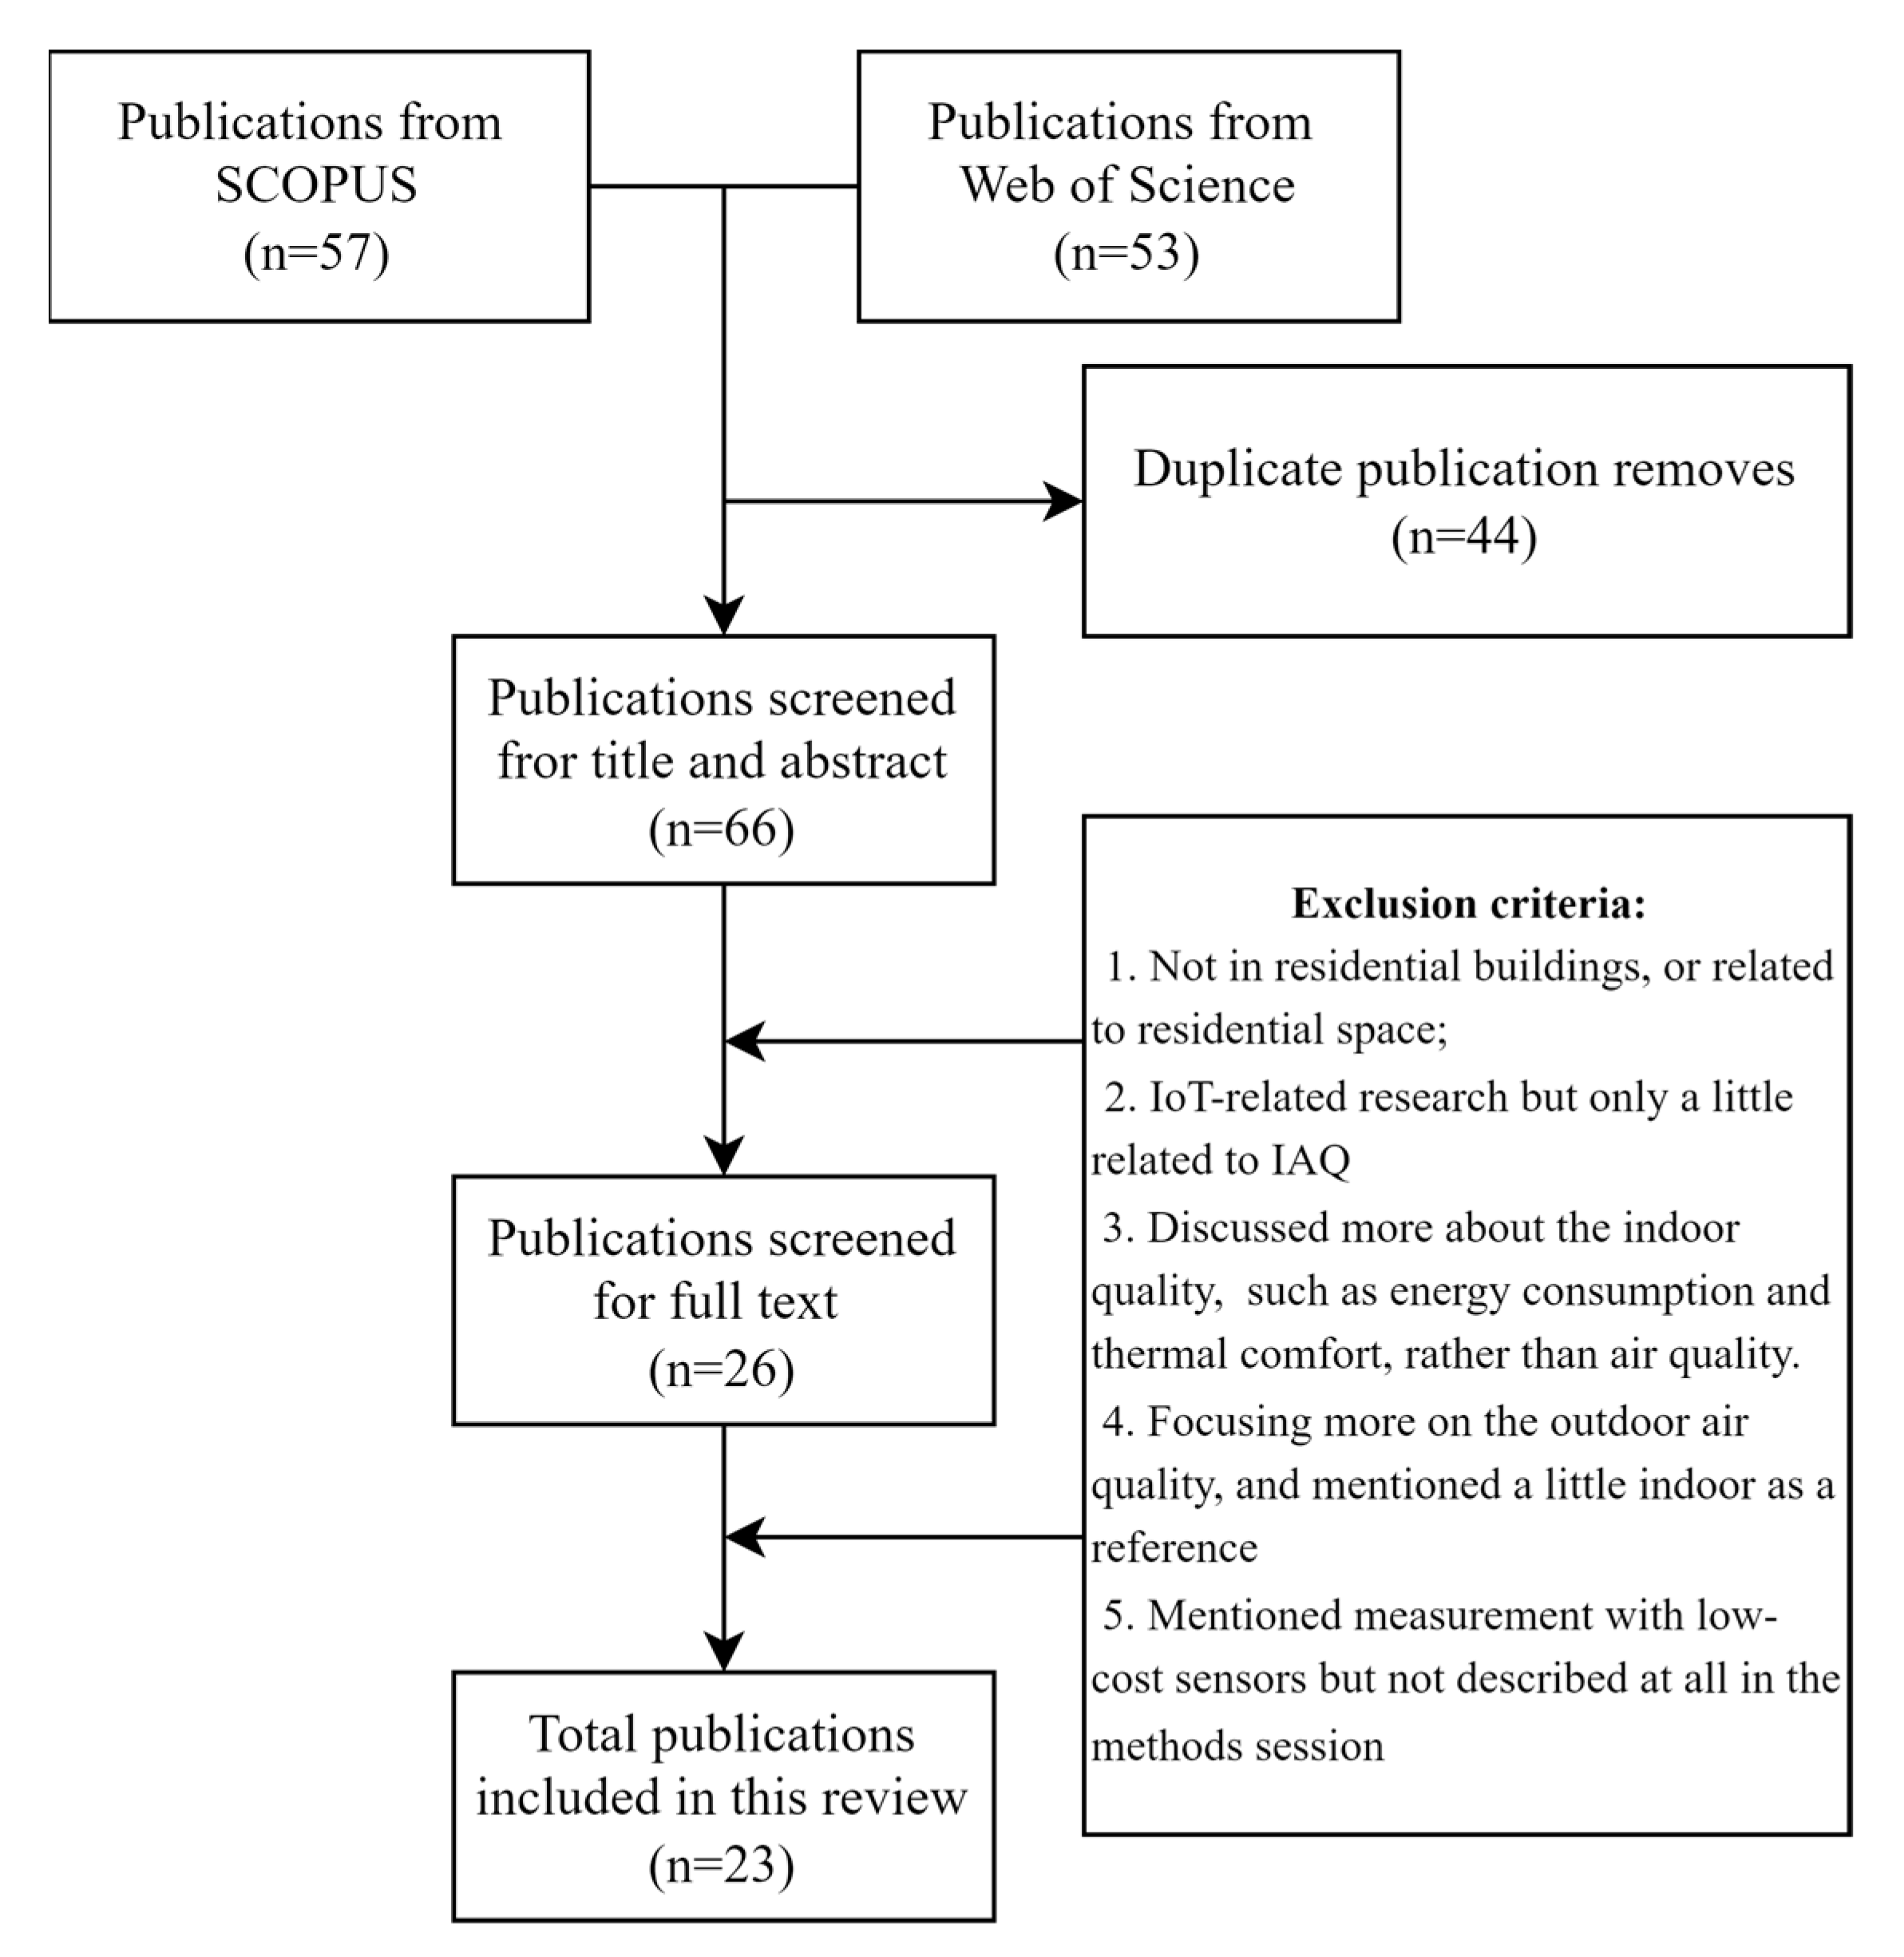
In general, these reviews provided comprehensive summaries of sensor types [13,15,18,19], performance [15,16,19], and IoT systems [17], and their findings are still practical in recent research.
They are based on the research needs and requirements, but for a more private civilian application, the devices for medium/long-term monitoring in the residential environments will have more specific and different needs. For example, the cost of devices and sensors may have higher priority than their accuracy, and the target pollutants will be more focused on residential emissions. With the awareness of improving air quality from autonomous air monitoring, the occupants of the rooms will try to improve their living environments, compared to any external personnel.
In addition to this review, searching for sensors from manufacturers’ websites, such as Alphasense, Sensirion, Plantower, etc., has also been tried. The authors have been aware that there are too many existing low-cost sensors from different brands and suppliers, and this review is not able to cover and review all of them in the limited time and will contain much less than what is found by the previous reviews. The focus of this review is to know what sensors have been applied and examined in the fieldwork practice and how they were applied in their methods, focusing on those with IoT applications inside residential buildings.
The scope of the systematic literature review is to highlight and learn from the existing research on low-cost air sensors (PM, CO2, VOC, TVOC, CO, etc.) and their IoT applications in residential buildings and to summarize the features of those sensors and the methods of their application in the research of residential environments. It also discussed the possibilities and feasibility of implementing or improving the IAQ monitoring applications, specifically in residential buildings, and their existing limitations in its application. This review will also provide useful information, including the most popular sensors, the potential costs, and measured indoor air pollutants, for beginners or amateurs who want to know and try out IAQ monitoring in residential environments.
The analysis and discussion of this review are more related to the situations in residential environments where the spaces are smaller, private and also more related to the emissions from residential sources such as the PMs and VOCs. Additionally, the possibility of implementing IAQ monitoring not only by researchers but also by occupants themselves is one of the targets. The discussions in this review would also help in the design of devices, the implementation of the monitoring of activities, and many related considerations in residential applications, as well as improving the feasibility of monitoring in living spaces.
This review, in fact, is developed in parallel with sensor development in another research topic (the PhD thesis of one of the authors), which requires the review results in a search for suitable sensors and their application methods.

2. Methods

The aim of the review is to search for the LCS for IAQ measurement that has been tested and applied in residential buildings with IoT applications, including their types and features, their pros and cons in measurement applications, their feasibility and affordability in residential applications, etc.
Therefore, the systematic review follows the PRISMA process, as Figure 1 shows. It searched papers from 2 databases, Scopus and Web of Science, with the following keywords ((“IAQ” OR “indoor air quality”) AND (“internet of things” OR “IoT” OR “low-cost sensor*”) AND (“resident*” OR “home*” OR “house*” OR “domestic”)). During the query in both databases, “open access” is the only 1 filter used, and no more filters on years, fields, and languages. The research team found 57 papers from Scopus and 53 papers from Web of Science. After removing duplicated papers (n = 44), there are 66 papers left for the 2 rounds of screening on the title and abstract and the full text.
After the 2 rounds of screening (Figure 1), a total number of 23 papers are included in this review. The 2 rounds of screening are based on the following exclusion criteria: (1) Introducing or advertising some products or brands rather than scientific tests or applications; (2) Research that is not applied in residential buildings; (3) More related to thermal comfort and energy consumption than IAQ; (4) More about outdoor air quality but not indoor; (5) Using LCS but not describing in the main texts.
All the 23 included papers are related to the targeted contents of LCS with IoT applications in residential buildings.
In the data extraction from the included papers, there are several topics focused on:
  • What is applied: sensor type, target pollutants, used micro-controllers, used data collection platforms, etc.;
  • How it is applied in devices: data reading and collection method, sensor interfaces working condition, power supply, costs, etc.;
  • How it is applied in fieldwork: sampling numbers, measurement periods, reading intervals, calibration methods, etc.
However, this review does not focus on the sensors’ performance, such as reading accuracy, drift or stability, etc. On the one hand, the evaluation of sensor performance was not the aim of all included papers, and their methods were not designed for sensor performance evaluations (not with tests and detailed data analysis). On the other hand, the performance indicators, such as the coefficient of determination (R2) and the correlation coefficient (r—Pearson correlation and ρ—Spearman’s correlation) mentioned in previous reviews [15], are calculated based on applied sensors and reference devices in the research, which were different types and were tested in different environments. The direct comparison of their indicators is not convincing due to the various environmental variables skipped by the authors, especially in fieldwork applications. To conclude it comprehensively, it needs an individual experiment on this topic or a focused review on sensor performance, such as the one by García et al. [19], Chojer et al. [13], or Karagulian et al. [16] with specific criteria for different types of sensors and focusing on performance. As already argued, the review aims to support the development of a methodology for the IAQ monitoring campaign. As there was no groundbreaking LSC found since the query for this review, such as in costs or detection gas, the papers published after the query are not updated since the review outcomes on sensor types and application methods would not change much.
All the information presented in Section 3 (Results) is derived directly from the referenced papers. Any interpretations, comments, or additional findings will be further explored and discussed in Section 4 (Discussion).
In addition to the information summarized in Section 3 and Section 4.4, the key features of all mentioned sensors from papers are summarized according to published datasheets of those sensors. Section 4.4 includes the features provided by their suppliers, including the measurement features (target parameters, detection range, reading resolution and accuracy, sensor response time, drift, lifespan) and device development features (sensors interface, supply voltage, and power consumption in different conditions).
These included features in Section 3 and Section 4.4 are the common sensors and application features that have to be considered during the device assembling and monitoring. Meanwhile, there are many other important features that have to be skipped in these sections, such as the power supply stability and device lifespan with battery, device installations and sizes, etc., because they are dependent on the real devices and monitoring situations and merely from the papers and datasheets it is hard to effectively discuss them. These features have to be considered in the real application, but some of them involve products from many other fields, such as the battery, and they are not mentioned much in the included papers and other related references. Part of the skipped features, which are not in Section 3 (Results) or Section 4.4, will be discussed in Section 4.5.
Additionally, the information on the sensors skipped by the original authors (for example, some sensor provides more outputs than what is not used or mentioned by the original authors) can be referred to in this section or their datasheet individually in the list of References.

3. Results

3.1. The Included Papers

The main issues that emerged from the 23 papers are summarized in Table 1. Their research themes can be classified into four types based on their methods and contents, as Figure 2a shows:
(a)
LCS application in residential buildings (n = 16);
(b)
Testing specific devices and sensor’s performance (n = 4);
(c)
Device and IoT system development logs (n = 2);
(d)
Review paper (n = 1).
The research application mainly discussed how they implemented the LCS inside the residential buildings for medium/long- or short-term IAQ monitoring and tried to understand and improve the existing IAQ conditions in real situations or simulated residential environments. The device performance test research focused on evaluating the feasibility and capability of LCS applications by monitoring residential buildings rather than solving existing IAQ issues. The development logs mainly discussed how they developed their device and IoT system step by step, including how they selected sensors, how to build the IoT systems, etc. The review paper focused on the accuracy and performance of LCS through previous research on its application in both living and working spaces.
The publication years of the 23 included papers are shown in Figure 2b. The number of papers is increasing from 2017 (just one) to 2022 (seven). Since the query was performed in the middle of 2023 (18th May), so there are only four papers included from 2023. It can be found that there has been an increasing trend of IAQ applications with IoT technology in residential buildings since 2017 because, during the query in the databases, there was no filter on the years of publication. It highlights how this field of interest is emerging in the last few years [11].
The difference between this review work and the included review paper [15] is that the following hold:
  • The included review focused on the performance of LCS in research from 2013 to 2021, such as their application methods and accuracy of results. It covered the research not just in a specific indoor space and did not focus on the application with IoT [15];
  • This review does not focus on the resulting data of LCS in the resulting data, but its application methods, especially those in residential buildings, those with IoT technology, their affordability, calibration methods in detail, advantages and limitations for medium/long-term IAQ monitoring in residential buildings, from papers between 2017 and 2023.
Meanwhile, these two reviews also have some discussions in common. For example, they both summarized the sampling information such as on sampling environment and durations, applied sensor types, target pollutants, reference devices, etc. Many results from this review follow the findings from the included one, such as the most measured pollutants and calibration methods, even if they were searching in different applications and different years.

3.2. Monitored Parameters and Corresponding Sensors

Figure 3 summarizes the measured parameters among the 22 papers, except the review paper. They include the following pollutants: Particulate Matter (PM) in general (n = 22), with dust (n = 1) and Particle Number (PN) (n = 1), Carbon dioxide (CO2) (n = 10), Carbon monoxide (CO) (n = 7), Nitrogen Dioxide (NO2) (n = 6), Volatile Organic Compound (VOC) or TVOC (total VOC) (n = 5), Formaldehyde (CH2O) (n = 1), Black Carbon (BC) (n = 1), Ammonia (NH3) (n = 1), and oxidizing gas (Ox) (n = 1). The PM includes those discussed PM1.0, PM2.5, PM10, and Total Suspended Particles (TSP), but not the one for dust since the definition of dust in the paper is not clear.
Apart from air pollutants, there are also some environmental parameters measured with sensors, including Temperature (T) (n = 14), Relative Humidity (RH) (n = 14), daylight (n = 3), Air Pressure (AP) (n = 2) and noise (n = 1). In addition, there are other parameters measured, including distance (n = 1), geolocation (n = 1), altitude (n = 1), and traffic flow (n = 1).
Meanwhile, all sensors mentioned in the included papers are summarized in Table 2, with a total number of 55 sensors marked with their target pollutants. Some sensors are designed to measure multiple parameters at the same time, and it is hard to classify them with parameters, so they are displayed in alphabetical order.
The parameters are based on what the sensors measured in the papers, but it does not mean they are not able to measure some others. For instance, PMSx003 particle sensors also provide values of particle numbers, but none of the papers used those readings, so they are not listed in the table. Only the parameters measured in the literature are included in the following Section 4.2.
Moreover, some of the sensors are not gas or low-cost sensors, such as LTR-559 and (VDS)-718,297, but they provided supporting data for monitoring.
The manufacturer and brand of sensors are listed in Table 2, according to what is mentioned in the papers, as a reference for searching for further information on the sensors. Some of them are labs from universities or individual DIY makers, and some of them are professional gas sensor manufacturers with more types of air sensors can be found on their websites. Sensor “GPY1010AU0F” mentioned by Demanega et al. [14] was probably a typo and should be “GP2Y1010AU0F”. More details about the listed sensors are summarized in Section 4.4.

3.3. Calibration

Among the twenty-three included papers, nineteen papers mentioned that their sensors had a calibration process, three papers did not mention if there was any calibration, and the included review paper was not applicable. Among the nineteen papers with calibrations, six of them described in detail how they did the calibration with data clearly, six of them argued about calibration methods or reference tools but with no details on the process, and seven of them mentioned they did but skipped describing the process or reference tools. The calibration details in the papers will be discussed in the following paragraphs (refer to Section 4.4).

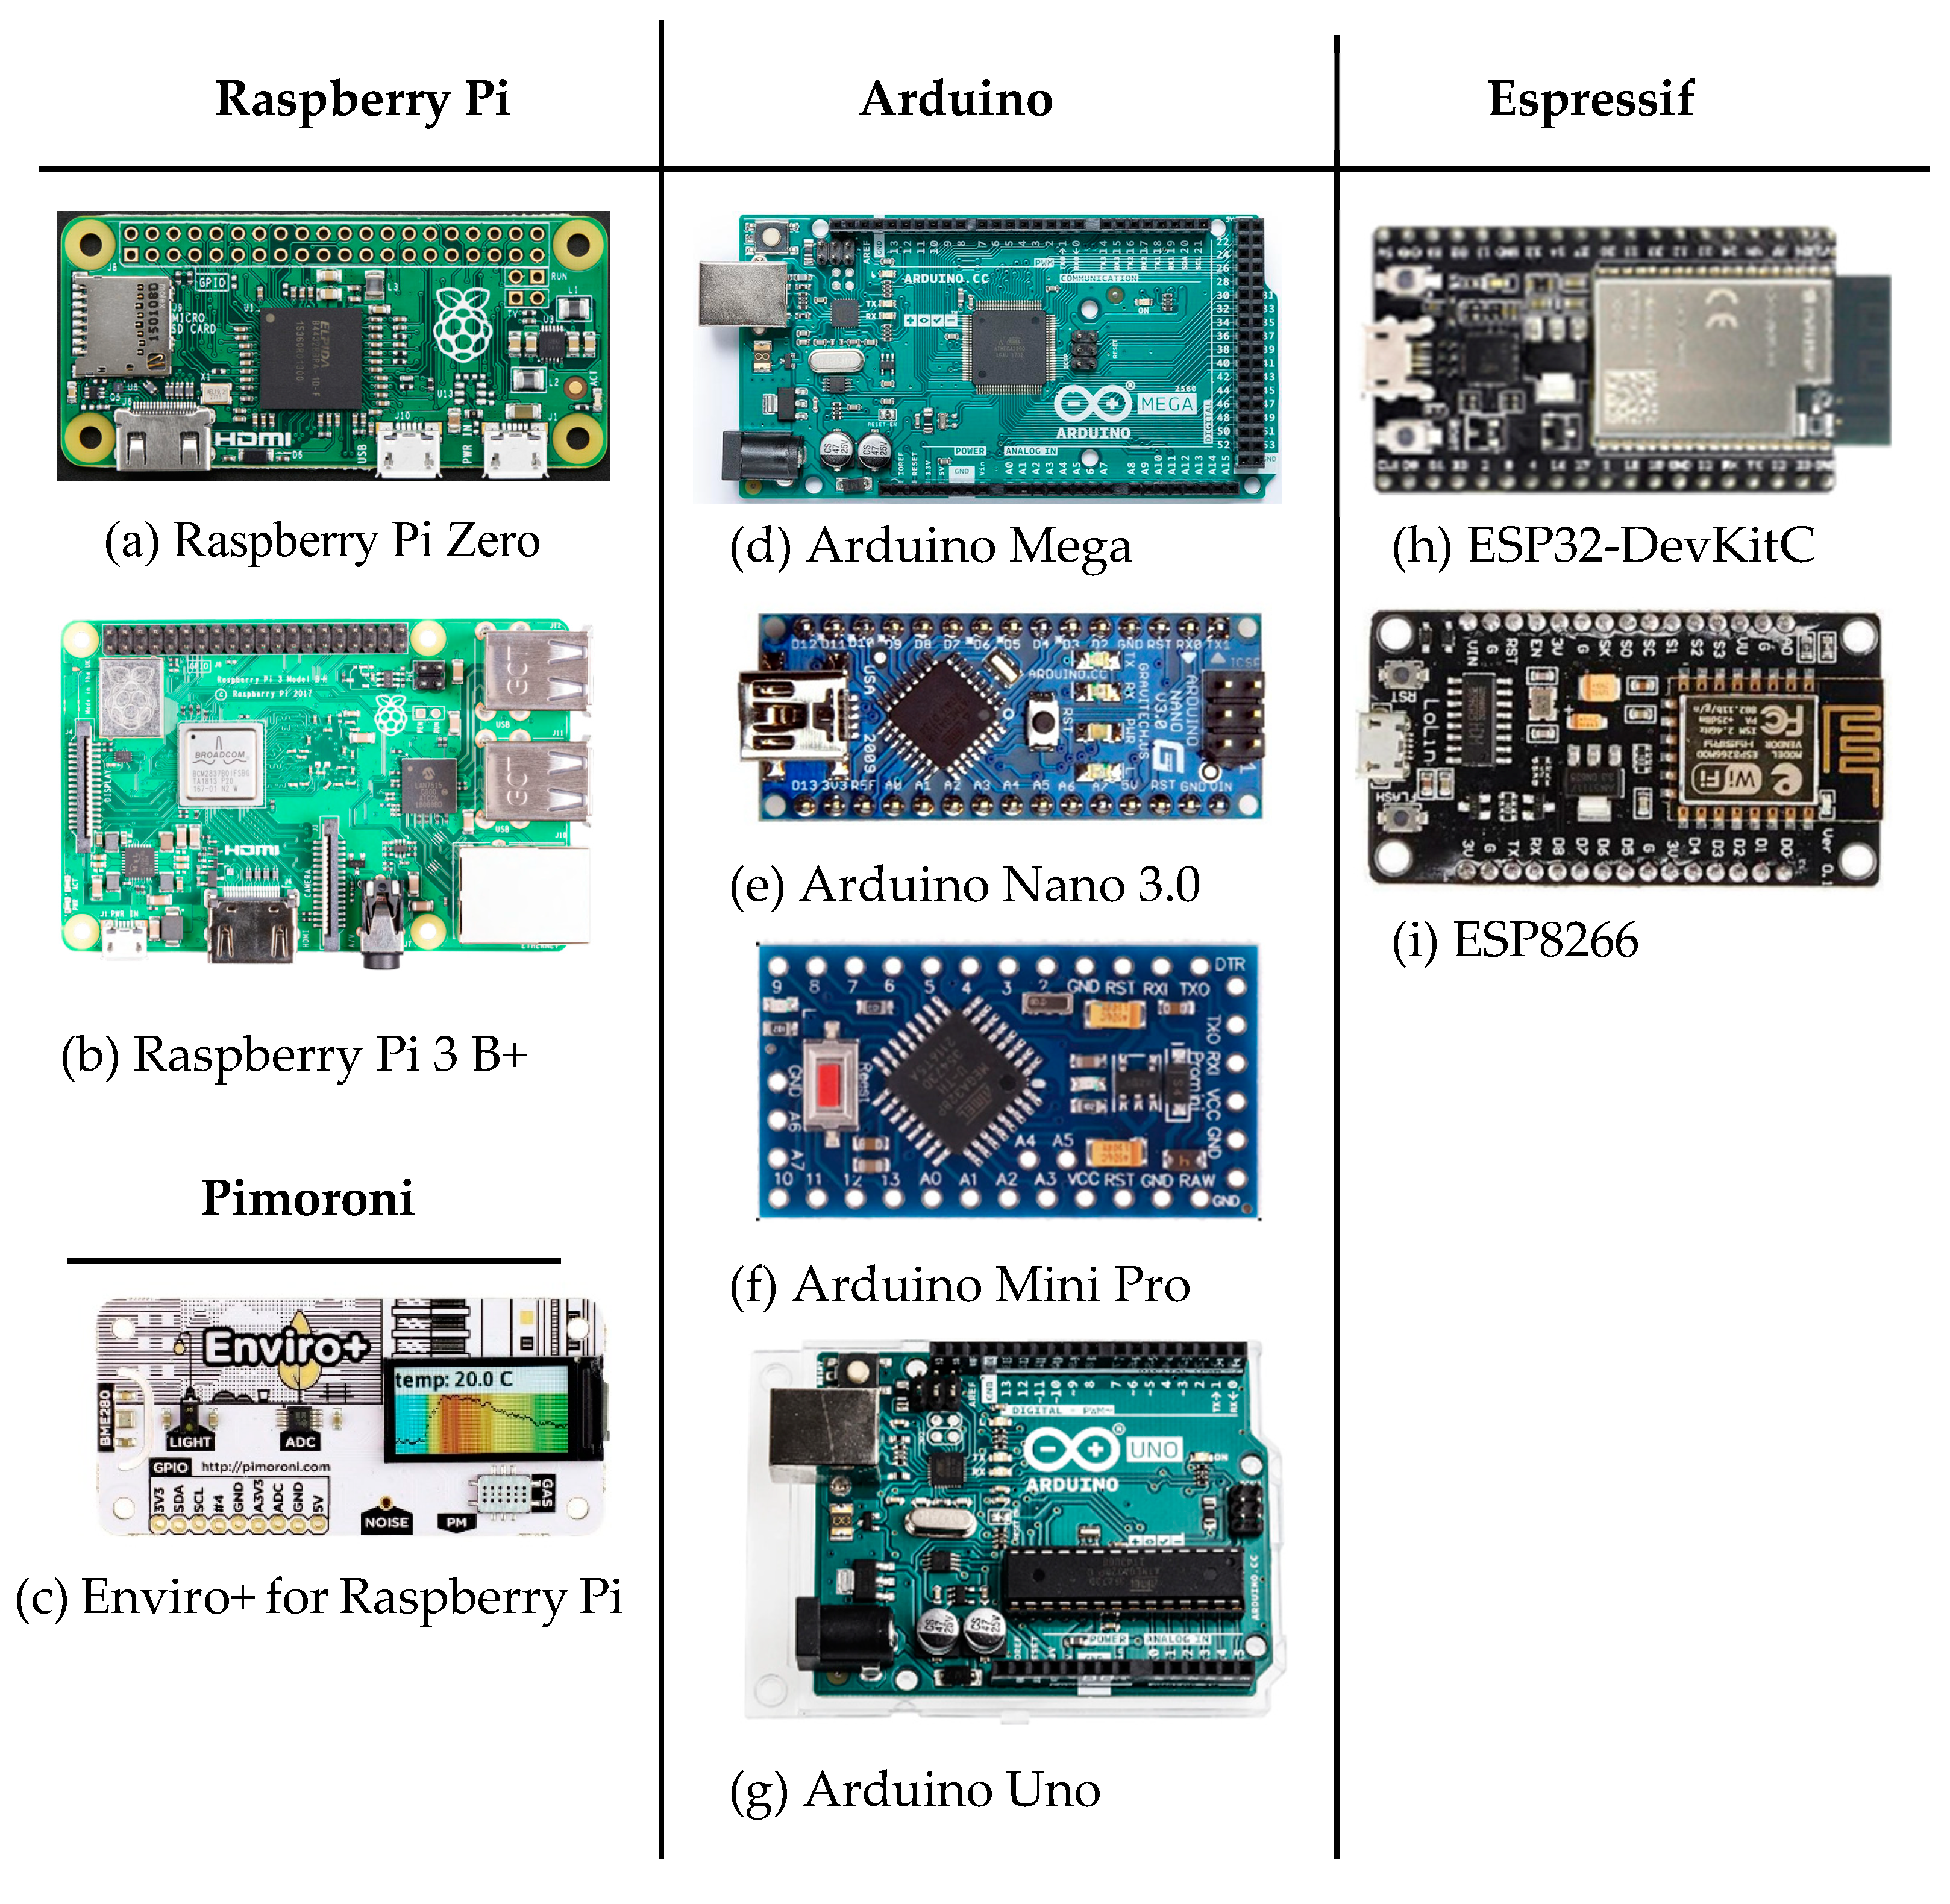
3.4. Micro-Control Unit in Device Development

Apart from the air sensors, another core component in the IoT system with LCS is the Micro-Control Unit (MCU, or Microcontroller). Only part of the papers mentioned about MCUs in their applications, and they are summarized in Figure 4.
In the research on device performance tests and development logs, they also introduced the MCUs they used in the development, which are Raspberry Pi 3 B+, Raspberry Pi Enviro+, Arduino Uno, and ESP8266. Those MCUs are also low-cost, user-friendly, and popular in the community of DIY developers, and there are already many existing resources and tutorials ready online. Non-commercial applications are capable of IoT developments.
On the other hand, the research on commercial devices did not mention the MCU types, but for commercial devices, they usually adapt the core modules by themselves in order to minimize the size of the device and the cost of materials. For example, ESP-12E is the core of ESP 8266, and the Printed Circuit Board (PCB) can be designed and integrated with all needed sensors of the devices. Also, there are many modules, such as Netbook, Wasmote, TI MSP430, etc., with different data transmission protocols, Bluetooth, Zigbee, etc. They have features that allow for less energy consumption and longer data transmission distances.
MCUs are not only used as the controller of sensors for reading data but, according to their data transmission features, some of them can also work as central hubs for receiving and collecting data. For example, there is ESP8266 with Wi-Fi or Bluetooth module.
Most MCUs are not specifically designed for air quality monitoring, but Enviro+ from Raspberry Pi is a special one. It is integrated with several environmental and air sensors already on the board, even with a Liquid-Crystal Display (LCD) for real-time display. It left additional connections to the additional sensors, such as PM sensors. The cost, of course, will be higher than the others, but its integrated functionality is interesting and helpful. And it can be a promising trend in air monitoring device development.

4. Discussion

4.1. Most Measured Parameters, “User-Friendly” and “Low-Cost” Sensors

As indicated in Figure 3, it can be seen that PM, Temperature, Humidity and CO2 are the most measured parameters. In terms of PM, the research on PM discussed cooking-related topics such as burning sources, cooking styles, equipment, and range hoods, which is one common topic in the house. For CO2, the reason for the measurement was the density of occupants in the house. Additionally, their high inclusion numbers are not only because they are most related to thermal comfort and indoor pollutant emissions but also because there are more options and less expensive alternatives on the sensors of these parameters, as Table 2 shows. So, for living spaces, the devices should select more of those sensors according to the typical residential emissions or focus more on the target pollutants according to the specific spaces.
Meanwhile, another reason why the gas sensors for CO, NO2, OX, NH3, and TVOC are less used is that they are less “user-friendly”. Most active gas sensors are semiconductor sensors, which contain sensitive materials inside and output analog readings of their changing resistance or pin voltage values according to the environmental gas level. These output values must be calculated according to an additional algorithm, which also includes compensations from temperature, humidity, or other influential gas.
These algorithms are sometimes confidential from their manufacturer, such as BME680 from Bosch or SGP4x from Sensirion, but the sensors highly rely on calibration to adjust all the algorithm-related parameters. So, in this way, some research gave up providing the concentration level as output [28] or changed the method for calibration [14,24]. The “user-friendly” and “low-cost” features are important and influential in the user’s preference and selection of sensors and their further applications.

4.2. Unclear Definition of “Low-Cost” in Gas Sensor

Table 3 summarizes only the sensors mentioned in the included papers with specific cost values, as well as their reference. Their prices are from the literature 2–3 years ago and there might be some advanced version recently, so they are only used as references. From the comparison of the prices, it is not hard to find that their prices vary a lot, and, except for the research-level devices, they are all called “low-cost” sensors.
Even if all the research mentioned the “low-cost” air sensors, their definitions of the “low-cost” concept are quite different. For example, the PM sensors, Alphasense OPC-N3, cost around GBP250, but Shinyei PPD42NS (≈USD 22) particle sensors, Sharp GP2Y1010 (≈USD 11), Honeywell HPM series (≈USD 67), PMS sensors (≈USD 11) can be cheaper, even if the accuracy is not as high as OPC-N3.
Also, the prices of commercial devices are not very economical for single users. They are 160 to 300USD/device, and in an entire house, there may be at least three devices for the living room, bedroom, kitchen, etc. They are still expensive even if they provide high-quality services.
Additionally, the cost of the sensor and the price of devices highly depend on the region and local market. For example, similar household IAQ devices from China (USD 31~42) can cost half more or even triple in Europe (USD 45~134), which may also be due to many reasons such as local tax on electronic devices, materials costs, or the premium on price according to the local economic situation.
Compared with the prices summarized by Karagulian et al. [16] before 2019, the cost of commercial devices for IAQ monitoring seems to have dropped with more options in the acceptable price range, and there are more new types of LCS invented in recent years. But the lowest prices are still at a similar level (at least USD 150 for measuring the basic parameters).
In general, the unclear definition of “low-cost” can make it not so affordable for residents. Sensors with lower accuracy but economical prices are not capable of being used for research purposes without regular calibration, but they can be enough for medium/long-term monitoring.

4.3. The Increase from Device Cost to Commercial Price

Consumer-level IAQ monitoring systems or products are still not so easy to provide to the market of private users such as those in residential spaces. One single device with basic monitoring parameters with prices in the hundreds of euros will keep most individual customers away.
Even if the sensors and other related hardware are low-cost and affordable for consumers, formal products are other things. There are many costs to be added to the final prices:
  • Costs on hardware: it includes the cost of selected sensors, other materials such as those for circuits and coatings, device design and tests, assembling and manufacturing, calibration, etc.;
  • Costs on software: end user’s app design, data collection platform design, data collection API (Application Programming Interface) and data storage, online server maintenance, etc.;
  • Costs on services: marketing and advertising, after-services for device maintenance, Q&A, etc.;
  • Other costs on commercial operations: shipment and storage of devices materials, taxes on company, products and shipping, etc.;
  • Profits of the products, etc.
So, the price increases dramatically when the monitoring device turns from a box of sensors to a monitoring product, from around 55 to 330USD, which is the price to the customers in the end.
Excluding operational business expenses, the IoT-related services for data storage and collection also increase significant costs. If a device has been measuring for many years, the cost of the online platform for data collection and storage will be even higher than the device itself. That is why some companies, such as PurpleAir [48], choose to introduce some extra payments for data downloading or subscription fees for the cloud. Maybe the residential users do not care about historical data, but it is still part of the cost of commercial devices to keep those data.
The conditions in the office building or the school might be different; after all, such a monitoring system in a building with public function can be split or afforded by the organizations. But for the occupants of private houses, how many residents would like to pay for the devices?
So, some functions can be simplified to cut down costs and improve affordability. For example, the IoT functions can be simplified just with data storage and display through Local Area Network (LAN) by Wi-Fi or Bluetooth, or even just with local memory inside the devices and without IoT when it is not necessary in residential buildings.

4.4. Some Basic Features of All the Mentioned Sensors in the Included Papers

According to the summarized sensor list in Table 2, more detailed information about them is summarized according to the datasheet from their suppliers, including their features for measurement and device development (see Table 4). Here are more explanations on the existing condition of sensors, according to these specifications of sensors.
In Table 4, the measurement features are those basic configurations of sensors. It includes their target parameters and detectable range, resolution and accuracy in reading, the time to get stable reading (response time), and the expected life span (lifespan) or how the readings are expected to be stable during the measurement (drift).
The features of Interface, supply voltage, and energy consumption are the important configurations during the development of the device. The interface is the protocol to send readings from the sensor to the other data collector. The supply voltage is how much voltage is needed to make the sensor work properly. The power consumption is the sensors’ energy consumption during different working conditions.
Here some explanations of the information are listed in Table 4:
  • The detection range is the maximum range to be detected, but most sensors have another small range with higher accuracy.
  • Resolution means when the reading changes, the minimum changes in reading values.
  • Accuracy values are every reading will be in the range of (50 + 3% of the reading) (values from T-110 as an example [49]), or the higher range between ±75 and ±10% (values from Amphenol Telaire T6703-5 K as an example [50]).
  • Drift means how much the value will shift from the accurate level during the time, which is based on the result of simulation, such as the 200-h test by SGP30 [51]. And the lifespan is the expected time to provide reliable readings.
  • The interface is the protocol for data reading from sensors, including I2C (Inter-Integrated Circuit), UART (universal asynchronous receiver/transmitter), PWM (Pulse-Width Modulation), SPI (Serial Peripheral Interface), Analog signal and other two special methods (USB (Universal Serial Bus) and ALARM (this is not an abbreviation and it is a particular method in S-300 sensor [52])). They are more dependent on the principles of how sensors read from the environment and are selected by the designer of the sensors.
  • Supply Voltage is displayed in “typical voltage (minimum~maximum voltage)”. If the supply voltage is outside of this range, the sensor will not start working or get burned.
  • Power consumption is the energy consumption of sensors while working, sleeping, or heating period. It is mentioned in units of W (watt) or A (ampere). It is important to know if the devices are designed to be supplied by the batteries.
Table 4 only summarizes very few but common features of all the mentioned sensors in the papers based on Table 2 (except for the three devices measuring the other parameters). According to the working principles of sensors, each sensor has many different features that should be paid attention to, and there are too many to be summarized here.
For some sensors, part of these basic features is not found or described in their datasheet, marked as “not mentioned” in Table 4. The datasheet of a sensor is not always the official product manual by its manufacturer, and it can also be written by its retail seller, the persons who adapted the sensor, etc. For one single sensor, if its manufacturer did not provide an official document, there would be many different versions by third parties with secondhand test results. So, in this way, many key information may be missing or even wrong. After all, the real quality of sensors has to be considered, along with their defective rate and tests in hand, rather than just reading from the datasheet.
GPY1010AU0F mentioned in their table by Demanega et al. [14] was not found on any website or datasheet, and it was probably a typo by the authors. GP2Y1010AU0F from SHARP should be the one they used in their research.
Y-Pods is a device designed by Hannigan Lab, University of Colorado Boulder [27], so there is no public datasheet found for it. Similarly, with AirVisual M25b and iAM, their products were found online but a datasheet was not found. The sensor PM-Model-II and its company (Green Built EnvMent) mentioned by Shen et al. [35] were not found online, and maybe it was sold only in their local market.
Table 4. The basic feature of the sensors mentioned in the included papers (except for the 3 devices for the other parameters).
SensorRef. 1Measurement Features 4Device Development Features
Parameters 3Detect RangeResolutionAccuracyResponse TimeDrift/LifespanInterfaceSupply
Voltage (V)
Power Consumption
AHT10[53]T (°C)−40~850.01±25–30 s<0.04/yr2I2C3.3 (1.8~3.6)3.3 μW(working)
0.9 μW(sleeping)
RH (%)0–1000.024±0.38 s<0.5/yr
AirCO2ntrol Mini[54]T (°C)0~500.1±1.520~30 minNM 2USB5300 mA (working)
CO2 (ppm)0~30001±(100 + 7%)2 minNM
AirVisual M25bNo information found
Amphenol Telaire T6703-5 K[50]CO2 (ppm)0~5000NM±75 or ±10%<3 min10yrI2C, UART(4.5~5.5)25 mA (working)
BH1750[55]Light (lux)NM1NMNMNMI2C5NM
BME280[56]T (°C)−40~850.01±1NMNMI2C, SPI1.8 (1.7~3.6)340~714 μA (working)
0.1~0.2 μA (sleeping)
RH (%)0~1000.008±3%1 s0.5/yr
AP(hPa)300~11000.18±1.7NM1/yr
BME680[57]T (°C)−40~850.01±1NMNMI2C, SPI1.8 (1.7~3.6)340~714 μA (working)
0.15~0.29 μA (sleeping)
RH (%)0–1000.008±0.38 s0.5/yr
AP(hPa)300–11000.18±0.12NM1/yr
IAQ index0–5001±15<1 sNM
BMP180[58]AP(hPa)300~11000.01±0.12NM1/yr2.5 (1.8~3.6)5 μA (working)
BMP280[59]AP(hPa)300~11000.01±1NM1/yr2.5 (1.8~3.6)2.8 μA (working)
CO-B4[60]CO (ppm)0~10002±5<30<10/yrI2C(1.7~3.6)<2.15 mA (working)
<5 μA (sleeping)
CSS811[61,62]T (°C)−5~50NMNMNMNMI2C3.3 (1.8~3.6)60 mW (working)
RH (%)10~95NMNMNMNM
TVOC (ppb)0~1187NMNMNMNM
CO2eq (ppm)400~8192NMNMNMNM
DHT22[63]T (°C)−40~800.1±0.22 sNMsingle-bus(3.3~6)NM
RH (%)0~1000.1%±12 s0.5%/yr
GP2Y1010AU0F[64]dust0–0.5(mg/m3)NM±0.5V/(0.1 mg/m3)NMNMNM5.0 (4.5–5.5)11 mA (working)
GPY1010AU0FNo information found
HPM Series[65,66]PM (2.5/10) (μg/m3)0~1000NM±15<6 s10yrUART5 (4.8~5.2)80 mA (working)
HPMA115S0-XXXThe same sensor as HPM Series above
iAMProduct found, but datasheet not found
K30[67]CO2 (ppm)0~5000NM±(30 + 3%)NM>15 yrI2C, UART(4.5~14)NM
Lit92[68]T (°C)-55~150 NM±0.2NMNMAnalog signalNMNM
MH-Z14[69]CO2 (ppm)0~5000NM±(50 + 5%)<90 s>5 yrUART, Analog signal(4.5~5.5)<85 mA (working)
MH-Z14A[70]CO2 (ppm)0~10,000NM±(50 + 5%)<120 s>5 yrUART, Analog signal(4.5~5.5)<60 mA (working)
MH-Z19A[71]CO2 (ppm)0~5000NM±(50 + 5%)<60 s>5 yrUART(3.6~5.5)<18 mA (working)
MICS-4514[72]T (°C)-30~85NMNMNMNMAnalog signal5 (4.9–5.1)76 mW (heating)
8 mW (working)
RH (%)5–95NMNMNMNM
Reducing gas (ppm)1–1000NMNMNMNM
Oxiding gas (ppm)0.05–10NMNMNMNM
MICS-6814[73]T (°C)-30~85NMNMNMNMAnalog signal5 (4.9–5.1)88 mW (heating)
8 mW (working)
RH (%)5–95NMNMNMNM
Reducing gas (ppm)1–1000NMNMNMNM
Oxiding gas (ppm)0.05–10NMNMNMNM
NH3 (ppm)1–300NMNMNMNM
MQ7[74]CO (ppm)10~500NMNMNMNMAnalog signal5.0 (4.9–5.1)<900 mW (heating and working)
OPC-N3[75]PM (1.0/2.5/10) (μg/m3)0~2000NMNMNMNMSPI, Micro USB(4.8~5.2)180 mA (working)
OPC-R1[76]PM (0.35~12.4) (μg/m3)NMNMNMNMNMSPI(4.8~5.2)95~100 mA (working)
PASDD Model 11-D[77]PM (1/2.5/4/10/coarse) (μg/m3)0~100,000NMNMNMNMNA13 5.4 W (working)
Particle numbers (total)NA 2NANANMNM
PMS3003[78]PM (0.1/0.3/2.5/1.0) (μg/m3)0~5001±10%10 s 3 yrUART5.0 (4.5–5.5)<100 mA
Particle numbers (0.3/0.5/1.0)NANANA10 s 3 yr
PMS6003[79]PM (0.1/0.3/2.5/1.0) (μg/m3)0~5001±10%<10 s >10 yrUART5.0 (4.5–5.5)<100 mA
Particle numbers (0.3/0.5/1.0)NANANA<10 s >10 yr
PMS7003[80]PM (0.1/0.3/2.5/1.0) (μg/m3)0~5001±10%<10 s >10 yrUART5.0 (4.5–5.5)<100 mA
Particle numbers (0.3/0.5/1.0)NANANA<10 s >10 yr
PM-Model-IINo information found
Purple Air PA-II[81,82]Particle numbers (0.3/0.5/1.0)0~5001±10%<10 s >3 yrNANANA
S-300[52]CO2 (ppm)0~10,000NM±(30 + 3%)60 sMNI2C, UART, PWM,
Analog signal, ALARM
5.0 (4.5–5.5)25 mA (working)
<0.5 mA (sleeping)
SCD30[83]T (°C)0~50NM±(0.4 + 0.023×(T-25))20 s0.03/yr (15 yr)I2C, UART(3.3~5.5)19 mA (working)
RH (%)0~100NM±38 s0.25/yr (15 yr)
CO2 (ppm)0~40,000NM±(30 + 3%)<10 s50/calibration (15 yr)
SCD40[84]T (°C)−10~60NM±0.8120 s0.03/yr (>10 yr)I2C3.3/5.0 (2.4~5.5)15/11 mA (working)
RH (%)0~100NM±690 s0.25/yr (>10 yr)
CO2 (ppm)0~40,000NM±(50 + 5%)60 s(5 + 5%)/calibration (>10 yr)
SDS018[85]PM (2.5/10) (μg/m3)0~999.9NM±(10 + 15%)1 s NMUART5 (4.7~5.3)60 mA (working)
<4 mA (sleeping)
SenseAir S8[86]CO2 (ppm)400~10,000NM±(40 + 3%)<30 s>15 yrUART(4.5~5.25)18 mA (working)
SGP30[51]TVOC (ppb)0–60,0001–32NMNM1.3%/10 yrI2C1.8 (1.62–1.98)48.8 mA (working)
2 μA (sleeping)
CO2eq (ppm)400–60,0001~31NMNMNM
Shinyei ppd42[87]PM (1.0) (pcs/liter)0~28,000NMNMNMNMPWM5 (4.5~5.5)90 mA (working)
SHT11[88]T (°C)−40~123.80.01±0.55~30 s<0.5/yrI2C3.3 (2.4~5.5)0.55 mA (working)
0.3 μA(sleeping)
RH (%)0~1000.05±4.58 s<0.04/yr
SHT20[89]T (°C)−40~1250.01~0.04±0.35~30 s<0.02/yrI2C3.0 (2.1~3.6)0.9 mW (working)
0.5 μW (sleeping)
RH (%)0~1000.04~0.7±38 s<0.25/yr
SHT30[90]T (°C)−40~1250.01±0.2> 2 s<0.03/yrI2C3.0 (2.1~3.6)0.9 mW (working)
0.5 μW (sleeping)
RH (%)0~1000.01±28 s<0.25/yr
SHT31-D[90]T (°C)−40~1250.01±0.2> 2 s<0.03/yrI2C3.0 (2.1~3.6)0.9 mW (working)
0.5 μW (sleeping)
RH (%)0~1000.01±28 s<0.25/yr
SPS30[91]PM(1.0/2.5/4/10) (μg/m3)0~100010±101 s10 yrI2C, UART5 (4.5–5.5)55 mA (working)
38 μA (sleeping)
Particle numbers (0.5/1/2.5/4/10)NANANA1 s10 yr
SPEC DGS-NO2[92]NO2 (ppm)0~50.02±3%<30 s>5 yrUART3.3 (2.6~3.6)14 mW (working)
100 μW (sleeping)
SPEC DGS-CO[93]CO (ppm)0~10000.1±15%<30 s>5 yrUART3.0 (2.6~3.6)12 mW (working)
SVM30[94]T (°C)5~550.01±1NM<0.02/yrI2C5 (4.5–5.5)49 mA (working)
RH (%)25~750.01±58 s<0.25/yr
Ethanol (ppm)0~10000.2%±7%NM15%/10 yr
H2 (ppm)0~10000.2%±7%NM10%/10 yr
TVOC (ppb)0~60,0001–32±7%NMNM
CO2eq (ppm)400~60,0001~31±7%NMNM
T-110[49]CO2 (ppm)400~10,000NM±(50 + 3%)90 s NMUART, Analog signal, PWM5 (4.5–5.5)20 mA (working)
TSL2591[95]Light (lux)NMNMNMNMNMI2C3.0 (2.7~3.6)20 mA (working)
3.0 mA (sleeping)
WZ-S formaldehyde module[96]Formaldehyde (ppm)0~20.001NM<40 s5 yrUART5 (5~7)NM
Y-PodsA device designed by Hannigan Lab, University of Colorado Boulder. No datasheet was found for it.
Note: 1 All the data in this table are collected from the datasheets of these sensors mentioned in the included papers. For more information, it can be referred to their references. 2 “NM” refers to “Not mentioned in the datasheet”, “NA” refers to “not applicable”, and “No information found” means the sensors are not found with a published datasheet and will be discussed in the main texts. “yr” refers to “year” 3 For all the parameter abbreviations, PM for Particulate Matters; CO for Carbon Monoxide; CO2 for Carbon Dioxide; CO2eq for equivalent Carbon Dioxide; TVOC for Total Volatile Organic Compound; NO2 for Nitrogen Dioxide; NH3 for Ammonia; H2 for Dihydrogen; T for Temperature; RH for Relative Humidity; AP for Air Pressure. 4 For the units of values in the table, if there is not specific description, the unit of all numbers follows the units mentioned in the column of “Parameter”.
The five mentioned devices, (1) PASDD Model 11-D, (2) Purple Air PA-II, (3) AirCO2ntrol Mini, (4) AirVisual M25b, and (5) iAM, are not independent sensors but integrated devices. Purple Air PA-II used the PMS5003 sensor inside for PM measurement, so the measurement features’ are actually all based on the PMS5003 datasheet [82]. Apart from Purple Air PA-II, the sensors used inside are not specified in their manuals.
Some sensors were introduced to measure CO2, but actually, it is CO2eq (equivalent Carbon Dioxide) such as CSS811 [61,62] and SGP30 [51] in Table 4. But what is measured in CO2eq is not specified. It must be checked carefully when selecting a CO2 sensor.
How long a time before a sensor needs another calibration is a controversial issue for the LCS. Some sensors mentioned their drift, but more for the temperature and humidity sensors, and the drift values did not confirm if the drift was increasing or decreasing. Some sensors used lifespan to describe it, but 5~10 years is too long to be trusted. In general, considering the drift and quality of sensors, a regular calibration every 2~3 months is needed for medium/long-term monitoring, according to Sá et al. [15].
Some of the gas sensors indicated an issue of cross-sensitivity, such as DGS-NO2 [92] and CO-B4 [60], which means there are many influential gases that will influence the reading apart from their target pollutant. For example, most of the reducing gas will influence the CO sensors, as it is the sensor principle of the metal oxide (MOX) changing analog output (voltage or current) based on the gas concentration. This also happens to the TVOC sensors, which are not able to specify what is captured by the sensors.
Some sensors request a pre-heating period before each stable reading, such as MQ7 [74], MiCS-4514 [72] and MiCS-6814 [73]. These sensors are not very suitable for medium/long-term monitoring with battery supply because the heating periods consume more energy than the measurement.
Also, “power consumption” from the sensors is not always the main energy consumption in the assembled devices. Data transmission (such as Wi-Fi connection) and working consumption in MCUs, small but long-term consumptions during the sleeping mode, and much additional waste of energy in the circuits, etc., need more optimization while devices developed with battery supply. And, of course, if the devices can use the plugs on the walls, they will be free from all these energy issues, and the sleep mode will not be so important for both MCU and sensor selections.
The interface of the sensor is an important feature for device development as the MCUs usually have very limited numbers of pins for each type of protocol. For example, on ESP8266, apart from I2C, which works on most GPIO (general-purpose input/output) pins, there are only four for SPI, eight for PWM, two for UART, and one for Analog input (depending on different version, number maybe one or two differences) [97]. It means that if an analog reading sensor, such as MQ7 for CO, occupies only one analog input pin, the other analog reading sensors need to find other solutions, like a multiplexer, which is complicated. So, when multiple sensors are assembled together in one device, their interfaces and MCU have to be considered accordingly.
After all, the selection of sensors while assembling monitoring devices is not a simple puzzle putting pieces together, but distinguishing all these sensor features before making decisions. Meanwhile, the unclear, mistaken, and misleading information from papers, the internet, and their datasheets have to be checked, compared, and tested to eliminate potential mistakes and bugs.

4.5. The Skipped Features in Sections 3 (Results) and 4.4

As argued in Section 2 (Methods), there are many other features that are important but not summarized in previous tables. Most of them are very specific and practical aspects of the device assembling and application, but most included papers did not discuss them, such as the device lifespan, power supply, device installations, and the sketch that controls the sensors.
For example, the device lifespan with battery depends on the total power consumption from sensors, MCU, data transmission methods, designed reading intervals, other additional components like an LCD monitor, and most importantly, the types of battery and their qualities. As the lifespan of devices is not a fixed number, in the applications, it is better to decide how long time the devices need to work, then select all components and design the internal sketch accordingly.
The battery supply is more necessary for positions that cannot reach the plugs, such as outdoor measurements. The selection of batteries is another big topic to be discussed, which is highly related to the types, brands, and qualities of different rechargeable or disposable batteries, and it will not be discussed here. As for the medium/long-term indoor monitoring in the residential space, the devices either use the plug for battery supply or simplify what can be measured and avoid those sensors with pre-heating needs.
The device’s dimensions and weight are very dependent on the needs and decisions of device designers. In terms of the dimensions, assembling with cables or soldering results in different final sizes in the devices. The cable connections with the breadboard have more flexibility in modifying the devices in case of any new needs in monitoring and the more air sensors integrated, the larger the size. Meanwhile, the soldering during assembly can have a smaller size and no problems in cable disconnection with shaking during storage or transportation, but it will be hard to change the sensors, especially when the total quantity of devices is large. If the devices need to integrate with other components such as an LCD [28,29] and battery box or a power bank, the size will be even larger.
As for the weight, basically, the sensors and MCU are not heavy and can be around 4 to 30 g for each sensor [60,75,76,86,96], and the batteries or coating boxes can have a higher proportion in weight. For example, if there is an included sensor required for a 5 V supply, then there will be four batteries 1.5 V (around 25 g each) to make sure the sensor is working properly. The weight of devices similar to their dimension can be designed according to the target pollutants and sensor selections. But designing devices was not usually the main purpose of research, so apart from those commercial-level products, most papers did not specify their battery, dimensions, and weight.
Installations of devices in the fieldwork site depend on where there is free space to install them. In addition, the monitoring needs to be placed at the breathing level while sitting or walking. Placing it on the table [25] or attaching it to the wall with a drill or tapes [23] and fixing with cable ties on the handrails or pipes [28] are common ways of device installation. Note that all the installations in the included research were still temporary installations and had to be removed after the monitoring activities. For personal medium/long-term monitoring in residential spaces, it is better to have a stable position and power supply to avoid accidental disconnections, which also need communication with the occupants during installations.
Sketches to run the sensors are another important topic, but they are not mentioned in any included papers or supplementary materials. Usually, a sketch should be uploaded to the MCU or other controller to control the data reading and collection process, which is performed in the IDE (Integrated development environment) software, such as Arduino ver. 2.3.2, programmed with computer language (no matter C, Python, or others). The sketches are important things because they also contain the key algorithms for the applied sensors to convert the raw data to readable values as outputs. Some sensors are designed with special or confidential algorithms such as the self-check or self-calibration function. Also, the sketches have to coordinate together in a single device, and it highly influences the device’s performance. For example, the different orders in data reading have to follow the response time of sensors during each working period. There are too many details to be fully discussed regarding the sketches in the device design, but they are equally important as all the other features. This information is always missed in the published works; maybe it was considered as confidential content or redundant to be included in the main texts.
There are many other missed details that can be discussed, but they are usually not mentioned as part of the methodology in the application papers. These skipped aspects might be confidential as they were part of their works, but the missing information also made it hard to replicate or compare their research.

4.6. Calibration Methods of Low-Cost Sensors

As mentioned in Section 3 (Results), apart from the three papers without mentioning their calibrations [20,23,25] and the review paper [15], there are 19 papers confirmed that they had calibration on their LCS devices. Among them, 7 of the 19 works did not describe their calibration details; they skipped it as the reason of “calibrated by manufacturers” [30,31,38] or without mentioning any details and reference devices [32,36,37], with a paper referring to another publication but it cannot be found online from its publisher [21].
In addition, 6 of 19 papers described briefly how they did the calibration and at least listed the type of reference devices as summarized in Table 5. Although the descriptions are brief and the methods are different from each other, their methods are enlightening. For example, the humidity compensation on PM reading [28], the multiple levels calibrations of PM sensors [22], and intercomparison between the target device and two reference devices [39] are more reasonable than the simple data comparisons. For the calibration by Taştan [40], both Xiaomi Mijia and Dienmern DM72B are consumer-level environmental monitors, and they probably have low-cost sensors inside. For the calibration by Pantelic et al. [22], the calibrated levels at 900 μg/m3 are quite a high level for PM because this work focused on the performance of stove hoods while cooking, where PM emission is higher than in normal living space.
Apart from the papers above, there are six other papers that illustrated their calibration in detail, in the papers or in their previous publications, as Table 6 summarizes. The main difference between these six papers and the six papers with brief descriptions above is that they provide calibration results with numbers, figures, or tables, which helps to understand how they implemented the calibration methods clearly.
Fritz et al. [24] had a detailed description of their calibration in the preview publication, which calibrated all parameters totally separately and involved two calibration sessions for PM and CO2. As mentioned in Section 4.1, PM and CO2 have more options in terms of their applications, even in calibration methods, and for TVOC and CO, there are fewer options. In terms of CO, they used calibration gas to calibrate at a certain level environment in the air chamber. As for TVOC, there was no comparison with reference devices and just normalization among the readings from tested sensors.
Bousiotis et al. [33] found that the PM readings, especially those from outdoor sensors, are highly influenced by RH, so they performed calibration according to RH. However, they did not mention the specific method or algorithm on how they are calibrated with RH. They used Pearson correlations as the criteria to evaluate the calibration performance.
In the research by Patel et al. [34], the GP2Y1010AU0F PM sensor uses an Electro-optical method to output PM level, which means the output received by MCU is not direct values of PM concentration in μg/m3, but an output voltage according to the concentration. And it shows a linear correlation that is quite straight between dust density and output voltage between 0.05 and 0.3 mg/m3 [64] according to its datasheet. But the correlation of this sensor is just an example, and each sensor still needs calibration one by one to confirm the factors (Slope and Intercept) in the linear correlation and convert output voltage into PM concentration. In Patel’s work, the analog readings of voltage were calibrated with a factor after comparison with reference devices. This method is applicable to sensors with analog readings, such as sensors for Ox, NOx, CO, etc.
There is one defect in the calibration and a critical issue in measurement in this research by Patel et al. [34]. For the calibration, the reference device (Sidepak) was collocated with only one device. They assumed that before cooking activities, all the sensors were reading at the same level, which might be close in readings in reality, but they still ignored the difference in different rooms and outdoor roofs. As for the one problem, sometimes the cooking generated PM levels higher than 5 mg/m3 and exceeded the detection threshold (around 0.5 mg/m3) of GP2Y1010AU0F a lot (in case of copyright issue, the diagram refers to “Figure 3 Output Voltage vs. Dust Density” in its datasheet [64]), and the sensor cannot detect them anymore. This made the readings during those high-level periods useless. This also indicates that all the other features of sensors, such as the detection range, are equally important as their target pollutant during the sensor selection.
For calibration methods in general, there are two types:
(1)
Calibration with reference reading sources, whether from research-level devices or local meteorological stations.
(2)
Calibration with calibration gas at a confirmed level in the air chamber.
In any case, the calibration requires a lot on the reference devices, the calibration gas, and the test environments.
In terms of data analysis of calibration mentioned in the six papers with details, the linear model (like Yi = α + βXi by Fritz et al. [24,98]) is the basic method for evaluating the sensor data accuracy. The linear model compares the two series of data: one from the LCS and another one from the reference devices. The coefficient of determination (R2), root mean square error (RMSE), mean absolute error (MAE), bias, slope, and intercept of linear regression are typical metrics used to describe errors for many applications involving LCS data [16,99]. By generating the linear regression algorithm between two series of data, and then the sensor measurement from the fieldwork can be converted to the calibrated values.
For the one paper calibrated with machine learning [26,100], the idea is similar to the comparison of 2 datasets in the linear model, but the machine learning models are better at processing large numbers of data in a short time, and their high functionality in calculation with programming can make calibration process quicker. Meanwhile, the machine learning model is able to give multiple inputs, which means it can also calibrate the influential parameters at the same time. For example, as Kureshi et al. [26,100] discussed in their calibration, the PM values are also influenced by humidity, and they calibrated with Absolute Humidity (AH) as well as Relative Humidity (RH) and found that AH is more influential to the PM in calibration. Also, in this case, even the non-linear correlation from another parameter could be detected through the model, such as in an environment with multiple gases that could be detected by one sensor.
In addition, the specific calibration and data analysis method should also be chosen according to the features of the sensor. For example, the analog output by GP2Y1010AU0F has to be calculated following the instructions in its datasheet [34,64], and some sensors like SCD40 [84] and SensorAir S8 [86] for CO2 have automatic calibration algorithms inside the sensor sketch. And some of their calibration algorithms are confidential or have to be calibrated in their official software such as BME680 [57] from Bosch.
Table 6. Calibration methods of the 6 papers with detailed method description.
ReferenceParametersReference DevicesCalibration MethodsData Analysis Methods
[24,98]TMichell instruments S8000Sensors are calibrated with reference devices in a 10 L incubator from 21 to 32 °C.A linear regression model of the form Yi = α + βXi.
PM2.5TSI Aerodynamic Particle Sizer Model 33212-step calibration for PM and CO2 in the test house and environmental chamber:
In the test house, 20 devices collocated with reference devices.
They filled CO2 to 2000 ppm with pressurized gas to calibrate CO2 and used a nebulizer with 3–5 μm particles to calibrate PM separately.
In an 8 m3 environmental chamber, they let the research sit inside for 30 min and move out and measure during the increase and decrease period to calibrate CO2; they used a nebulizer again, while PM2.5 lower than 50 μg/m3, to calibrate PM.
Univariate linear models of the form y = b + mx, with b and m calculated from average value in 3 experiments.
CO2LI-COR Model 6252
TVOCNo reference devicesResearchers are used as TVOC source in a 27 m3 chamber and calibrated device to output the same values.By comparing the average, reference curve among test sensors.
CON/AGas standard with Zero Air Gas (ZAG) was applied to achieve levels of 0, 1, 2, and 4 ppm in a 5 L chamber. The data in the 60 min in the middle of the 2 h test at each standard level are used for calibration.Four data points at each level are used to fit a linear model to correct CO readings.
[26,100]PM10, PM2.5Palas Fidas 200Machine Learning models are applied to calibrate PM readings with Absolute Humidity and Relative Humidity. Then, the readings are compared with a reference device.Calibration used 4 Machine learning models: Multivariate Linear Regression (MLR), Multi-Layer Perceptron (MLP), Convolution Neural Network (CNN), and Random Forest (RF). Then, they used a scatter plot with a regression-fitted line to evaluate the performance of calibration.
[33]T, RHmeteorological station at the Birmingham International AirportNMNM
PM1, PM2.5, PM10TSI-3330TSIs were collocated with the sensor in the target rooms during monitoring. LCS are calibrated according to RH level and calculated the correlation with TSIs’ readings.Pearson correlation (r).
[14]TModel 425 and 435, TestoAll the devices for test and reference are collocated together to compare the readings together.Linear regression and Pearson correlation coefficients.
PMGrimm Model 1371 (miniWRAS)
CO2The LI-COR 850
VOCGreyWolf IQ-610 and Aeroqual Photoionization Detector
[34]PMSidepakThe reference device was collocated with one of the devices, and then the data comparison was used to calculate the linear algorithm for the analog reading from the sensors, according to the linear correlation feature between PM level and output voltage.A linear regression model is provided by the sensor and the calculation for the slope and intercept with comparison to the reference readings.
[35]PMThermo Scientific FH 62 C14Sensors are deployed close together in the living room and calibrated against the reference device for 50 h immediately prior to the experiment.Linear regression over the origin, and we used the regression coefficients to calibrate individual particle counters.
Note: N/A means “not applicable” and NM means “not mentioned”.

4.7. Possible Solutions for Medium/Long-Term IAQ Monitoring Applications in Residential Buildings

4.7.1. Integrated IAQ Monitoring with Building System

The integration of an IAQ monitoring system into the existing building system or Building Information Modeling (BIM), such as the alarm or internet system, can be a better way for medium/long-term IAQ management [101,102].
On the one hand, it will be much more economical than building individual systems by the users themselves, no matter whether the IAQ system connects to the internet or monitoring locally unit by unit. On the other hand, the monitoring system can provide useful data for smart appliances and the ventilation system’s automatic control. In this way, less attention from users will not be distracted, bothered, or stressed by air quality or other related work such as system installation and maintenance. The air monitoring devices can also be hidden inside furniture or internal finishing, such as inside the wall or suspended ceilings, just like the other building services engineering, rather than an additional protruding device fixed on the wall.
Even if the awareness of IAQ is important for improving it through users’ adaptive behaviors, it is still better if a building can optimize its living and working environment without interrupting users’ activities.

4.7.2. Local Network and Data Storage with IoT

Local data storage and real-time display of IAQ results are more useful than the IoT remote monitoring feature in private residential spaces. Local data collection can cut down the cost of the online database, maintenance, after-sales service, etc. It is also suitable for the privacy and security needs of the residents.
In this way, the data can be stored in the individual devices or collected in one central hub composed of one capable MCU, for collecting from all the separate monitoring devices in one unit. The coverage of one hub is enough for one residential unit or house, and its autonomous working environment can protect users’ privacy.

4.7.3. Modular Design of Air Sensors and Components

The modular design of devices and air sensors increases the flexibility and is more user- or developer-friendly. The standardized serial communication protocols for different sensors are equally important.

4.7.4. IAQ Data Real-Time Display

Real-time measurement is an important feature and advantage of low-cost sensors and can be integrated with direct visualization solutions, such as with LCD screen display on the table or through apps on the phone.
The local display of data is not expensive to achieve. For the devices with local data storage, an additional LCD or LED screen can be integrated into the devices or the hub for data collection, such as MCU Enviro+, as Figure 4 shows. For the devices connected to the internet, the data display can be more flexible on mobile apps, websites, wearable smart devices, etc.
By visualizing the data of invisible air pollutants, users can react more promptly to minimize unwanted exposure such as during cooking and cleaning.

4.7.5. Air Quality Monitoring Network

As the IAQ is highly influenced by outdoor air quality, the monitoring and forecasting function by the LCS network can be more effective in managing air quality, especially after the integration with the IoT system. The World Meteorological Organization (WMO) argued that LCS must be integrated with other data sources in a comprehensive air quality management system [99]. Unlike the application inside a single family, extensive monitoring can be supported by public funding. Monitoring networks on the community scale can also help to identify if the pollutant source is indoor or outdoor [31].

4.8. Limitations to Implementing Medium/Long-Term IAQ Monitoring in Residential Buildings

4.8.1. Awareness of IAQ from Users

In general, IAQ is not always as perceptible as thermal comfort. If the residents do not smell anything terrible, the IAQ will always be ignored until symptoms show up. However, residential buildings are private spaces managed by the users themselves, and the reference values for pollutant levels aim to ensure that the user’s exposure is lower than the level leading to symptoms. So, awareness of IAQ from users is important in monitoring implementation.
Additionally, the monitoring of IAQ will cost extra money and time for the purchasing and maintenance of the equipment, which mainly relies on residents’ willingness.

4.8.2. Occupants May Not Realize the Need for and Significance of Medium/Long-Term IAQ Monitoring

Since occupants usually spend their rest hours in residential buildings, their activities are more flexible, and they do not have to stay in a single room when they perceive the smell of air pollutants. They can control ventilation as needed or move to another room while waiting for ventilation to clear any smells from emissions. This flexibility reduces the perceived urgency for continuous IAQ monitoring, impacting their willingness to try and invest in monitoring devices.

4.8.3. Limitations on Low-Cost Sensor Types

As Figure 3 shows, PM and CO2 are the two most discussed pollutants. But it is not only due to the indoor source but also the limitation of pollutant types. It is because the cost of PM and CO2 sensors are cheaper than all the other air sensors, and there are more options.
Also, the VOC sensors can detect only a few types of VOC pollutants, and they cannot specify the level of each type. That is too general to describe the VOC level, and in some spaces, the pollutants are not able to be detected by the sensor even when the smells are strong. This limitation is not only on the selection, usage, and application of VOC sensors, but also their calibration methods, which leads to less reliability in their readings in the on-site monitoring.
For example, among the VOC sensors included in this review, their datasheets show different substance responses. SGP30 and SVM30 from Sensirion mentioned a reaction on Ethanol and no other VOCs [51,94], BME680 from BOSCH mentioned a reaction on Ethane, Isoprene/2-methyl-1,3 Butadiene, Ethanol, Acetone and Carbon monoxide [57] (the included paper in this review did not use VOC readings from BME680, so it is not listed in Table 2). And the CCS811 chip from AMS did not mention any specific type of detectable VOC in its datasheet [61], but its PCB-adapted version by Adafruit mentioned that it could detect Alcohols, Aldehydes, Ketones, Organic Acids, Amines, Aliphatic, and Aromatic Hydrocarbons [62].
So, the VOC sensors are quite misleading. They are branded as being capable of detecting VOC, but they do not clearly declare what type is to be detected specifically. It also means that if the application does not confirm the target VOC substances in the monitoring site, the VOC sensors may not react at all, even if the smell from VOC is strong enough to be precepted by users.

4.8.4. Limitations on Pollutant Detection Range, Precision and Accuracy

Apart from the limitation on sensor types, the detection range of sensors and their precision is another problem. For example, many authors reported that the PM sensor can only detect particles from 0.35 to 40 μm, so particles smaller than 0.35 μm are missed in the measurement. Some gas sensors, such as MiCS-6814 for NOX and CO, their a detection range that is too high for living environments and more suitable for gas leakage alarms in the factory.
Meanwhile, most low-cost sensors require calibration to ensure their precision. Some of them also need a certain period of pre-heating time before measurement to ensure accuracy. That means the user or developer still needs a professional device to calibrate them before starting the measurement.

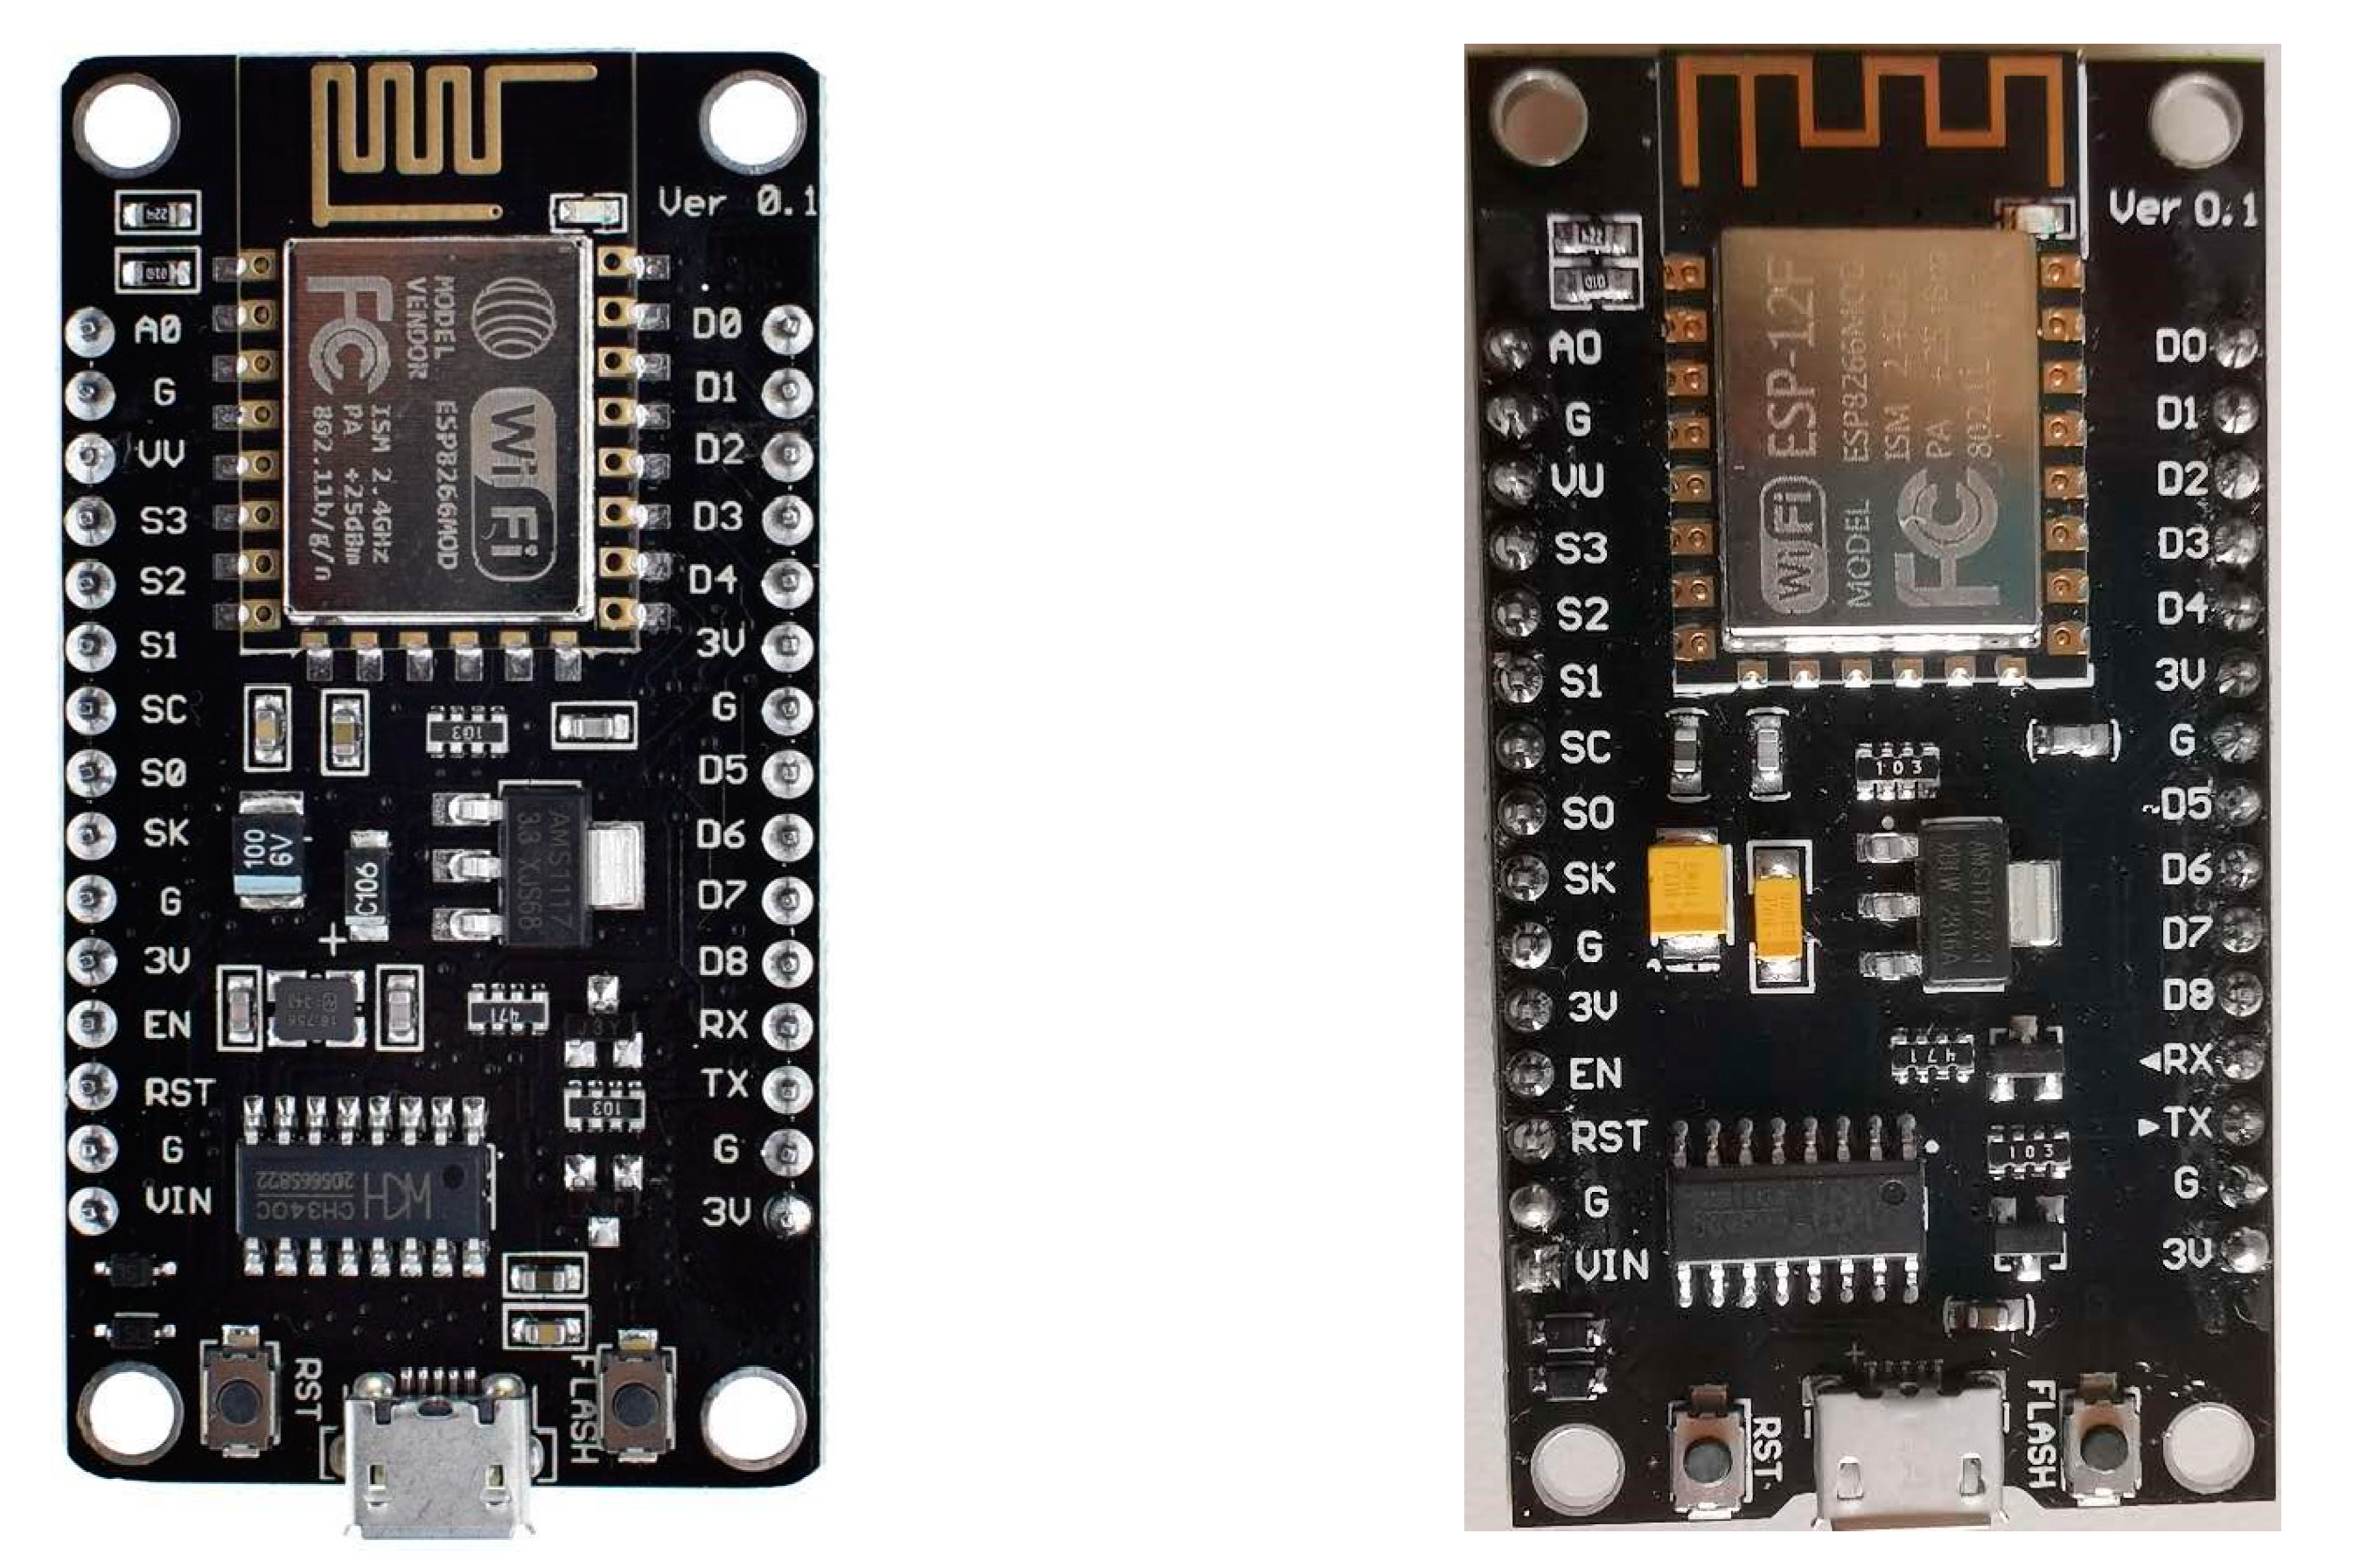
4.8.5. The Misleading Information about Sensors and MCUs from the Internet and Inadequate Instruction from the Manufacturers

Discussion in the online developer community and forums such as Arduino Forum and GitHub. They are good sources of learning new sensors and MCU, but meanwhile, there is also too much misleading information.
Some posts in online forums like GitHub shared the algorithm of sensors, but after comparison with posts on the same sensors, such as NOX and CO measured by MiCS-6814, their parameters in the algorithm are different from each other post, which is confusing. The manufacturer did not provide clear instructions in the datasheet, so the data had to be displayed in an original way rather than in concentrations, and it was also hard to calibrate as in Chakraborty et al. [28].
In addition, many cloned open-source MCUs and air sensors have different versions with minor adjustments by the third-party designers, but the users may not have realized the differences while assembling devices at the beginning. For example, ESP-8266 has several different versions or clones in the market at the same time (Figure 5). Their main functions are the same and can run in the same way, but there are still some differences, such as the VU pin’s voltage difference when the battery power supply and one’s (as Figure 5 shows, refer to the left one) deep-sleep function require reset bottom pressed twice. These differences are inconspicuous but can lead to fatal issues in the development of devices and waste a lot of time for troubleshooting. That is also one reason why, in the posts of online forums, many developers cannot find real solutions.
Due to this issue above, the purchase of materials is equally confusing. Different versions or clones are provided on different platforms, even when searching with the same keywords or version codes.
Another confusing point is the naming of chips, SoC (System on Chips), modules, and development boards (also called DevKits), and this point is also among sensors. Take ESP82666 as an example:
  • ESP8266 usually refers to the DevKits based on ESP8266 modules or other clones;
  • ESP-12E/F is one of the ESP8266 modules developed by a third-party manufacturer (Ai-Thinker) based on ESP8266EX [103];
  • ESP8266EX is one of the SoCs developed by Espressif [97] with Wi-Fi communication;
  • Xtensa® L106 is its chips as a microprocessor inside ESP8266EX [97].
So, chips, SoCs, modules, and DevKits are organized in a way where each encompasses the previous one as a component within. But the confusing point is that “ESP8266” is used in the name of multiple DevKits, clone versions, and related modules.
Similar confusion exists among the included papers. For example, the “ESP32 board” in Taştan’s work [40] actually is not the name of a specific DevKit, and there are dozens of boards integrated with the SoC called “ESP32”.
This exists not only with MCUs but also with air sensors. For example, MiCS-6814 is a gas sensor module developed by SGX Sensortech [73] with multiple sensor versions in the market with different I/O pins, but all are displayed with the keyword “MiCS-6814” since they used its module name.
These issues bring many difficulties to the search for useful and correct information on sensors and devices, and unexpected problems will pop up during the device development.

4.8.6. Commercial Sensor Platform and Open-Source Integrated Development Environment

Starting from the aims and scope of the analysis, it is not appropriate to discuss the issues in professional sensor development, but the mess from commercial sensor platforms is not very friendly to individual IAQ monitoring device developers. Some companies provide their own data reading platform such as SGP40 from Sensirion and BME 680 from Bosch. The platforms can help translate the raw data from sensors to concentration values. It also means that different sensors output and store data in multiple ways, which is not flexible when many sensors are reading together in a single device. On the other hand, if not reading through the commercial platform, the sensor outputs will not be calculated through the confidential algorithms designed by their manufacturers, which may not provide reliable results and need extra calibrations.
In online developer forums, one of the common questions is how to interpret the readings from the sensor, especially when using gas sensors with analog readings of voltage or resistance value as output. Without a clear algorithm or illustration of the sensor features, the sensors are hard and time-consuming to test and apply to a device.

5. Conclusions

To achieve medium/long-term IAQ monitoring, devices equipped with LCS or IoT applications hold significant promise for ordinary residential building occupants. Although LCS devices still require precise calibration for research purposes, they are suitable for use in everyday residential settings, which provide at least a reference level of IAQ. From a public health perspective, these devices can support adaptive behaviors, helping users to avoid overexposure to poor air quality environments.
For individual users in residential buildings, the price of a single device is still quite high to say it is affordable. To optimize costs for medium/long-term monitoring, the IoT systems could be simplified for private use by incorporating features like local data storage and display. Additionally, consumer-level devices could focus on sensors for specific pollutants relevant to particular environments, such as the kitchen, to cut down the cost of unnecessary sensors.
As noted by Sá et al. [15], the data quality from some of the low-cost sensors is sufficient to be applied in residential buildings; and with the IoT technology, intelligent model learning can benefit IAQ management, with feasible and affordable solutions in the near future.
Meanwhile, IoT systems with remote internet connectivity offer an optional approach for IAQ monitoring. In residential buildings, IoT can be implemented through a localized network within a family unit, allowing for control, data collection, and display without the need to transmit data to the Internet.
The sensors should be selected carefully since not all sensors are designed for monitoring in normal living and working environments, even if they can measure the parameters needed. Also, their calibration method should match the corresponding features of the sensors.
The values from the datasheets, manuals, or any other online instructions are more like reference indicators and may not always represent the real quality of the sensors bought from retail sellers. The tests and calibrations before applications are always needed.
Two-thirds of the included papers discussed their calibration methods, and many mentioned the key points of LCS calibrations such as the humidity calibration on PM sensors and calibration for the sensors with analog readings. It has been emphasized that LCS calibration for medium/long-term monitoring is a must [104] and there is a regular need [15,29] to maintain accuracy. A reference device or usage of calibration gas with a test chamber is necessary for the calibration. Even if some sensors provided the drift of reading, the trimonthly calibration is needed to confirm the reading stability.

6. Limitations of This Research

The discussions and findings are based on the applications in the selected publications, which cover only a small part of this field and may not be totally correct; for example, there are the following:
  • Some sensors actually are able to measure multiple parameters, but those readings are not used or mentioned in their papers;
  • Some names or versions of sensors may not be correctly recorded by the authors of the included papers due to the reasons mentioned in Section 4.8.5;
  • The costs of sensors in Table 3 are from at least 2~3 years ago; there may be new prices, and the costs also vary from the local markets in different regions.
  • The datasheets of all sensors are not verified one by one, so it is not certain if there are more cases of sensor misuse as mentioned in Section 4.4.
All the missing information or minor errors from the included papers cannot be verified one by one due to the limited time.
The most advanced research on low-cost sensors still relies on sensor designing and manufacturing companies, electronics engineering research, and related labs, which possess more detailed technical data on electronic sensors and the current market situations.
Many sensors are not sold in the local market or even online, depending on the region, so their real performance and capacities are not examined in this review research, which may be different from what is written in their datasheet online.
The sensors listed in Table 2 and Table 4 are only those mentioned in the research in residential buildings, which are just small numbers of all air sensors. For more information about existing sensors not involved in this review, they can be checked online through the names of their brands and manufacturers. Many existing sensors are not selected, which may be due to some reasons, such as the high costs or inappropriate accuracy and gas detection range. In any case, in general, the limitations of sensors’ properties are also the limitations of their applications in IAQ research.
As argued at the beginning, this review focused only on the existing LCS applied with IoT applications in residential buildings and their limited information, such as sensor features and cost, but it did not review the performance of their readings. This is because this review is not focused on the sensors of a single target gas, and different sensors are not directly comparable due to their different measurement principles. In future research, for the same type of sensors, it is better to have a horizontal comparison with experiments in the test room or air chamber to check the sensor’s performance. The form of review is not the best way to test the sensor performance as the real practice has too many environmental variables that are not specified by the authors.
Also, in terms of the sensor performance with different working principles, an acceptable or good reading (such as a recommended RMSE or R2 values or range) should be set for calibration and data drift in future research based on the horizontal sensor tests or provided by the manufacturers. So, in the application research, every author will confirm similar sensor performance even when they use different types of sensors.
With big data from IoT applications, machine learning will be a useful method in IAQ data analysis not only in the analysis of measurement results but also in the sensor calibration processes. As many gas sensors are influenced by multiple pollutants, in future research, the machine learning model can benefit these or new sensors in identifying the influential factors from different gases.

Author Contributions

Conceptualization, M.G. and Y.Y.; methodology, M.G. and Y.Y.; validation, M.B. and S.C.; formal analysis, Y.Y.; investigation, Y.Y.; resources, G.S. and Y.Y; data curation, Y.Y.; writing—original draft preparation, M.G. and Y.Y.; writing—review and editing, M.G., G.S., M.B. and S.C.; supervision, M.G., M.B. and S.C.; project administration, S.C.; funding acquisition, Y.Y. All authors have read and agreed to the published version of the manuscript.

Funding

This research refers to the State of the Art of the PhD thesis, already in progress, by Yong Yu (PhD program in Architecture, Built Environment and Construction Engineering at Politecnico di Milano). His scholarship is funded by the China Scholarship Council with funding number as 202108420048.

Institutional Review Board Statement

Not applicable.

Informed Consent Statement

Not applicable.

Data Availability Statement

No new data were created.

Conflicts of Interest

The authors declare no conflicts of interest.

References

  1. Wang, Y.; Tahmasebi, F.; Cooper, E.; Stamp, S.; Chalabi, Z.; Burman, E.; Mumovic, D. Exploring the relationship between window operation behavior and thermal and air quality factors: A case study of UK residential buildings. J. Build. Eng. 2022, 48, 103997. [Google Scholar] [CrossRef]
  2. World Health Organization (WHO). WHO Guidelines for Indoor Air Quality: Selected Pollutants; 9289002131; World Health Organization, Regional Office for Europe: Copenhagen, Denmark, 2010. [Google Scholar]
  3. World Health Organization (WHO). WHO Global Air Quality Guidelines: Particulate Matter (PM2.5 and PM10), Ozone, Nitrogen Dioxide, Sulfur Dioxide and Carbon Monoxide; World Health Organization: Geneva, Switzerland, 2021. [Google Scholar]
  4. Poli, T.; Mainini, A.G.; Speroni, A.; Blanco Cadena, J.D.; Moretti, N. The effect of real-time sensing of a window on energy efficiency, comfort, health and user behavior. In Research for Development; Springer: Berlin/Heidelberg, Germany, 2020; pp. 291–296. [Google Scholar] [CrossRef]
  5. Settimo, G.; Yu, Y.; Gola, M.; Buffoli, M.; Capolongo, S. Challenges in IAQ for Indoor Spaces: A Comparison of the Reference Guideline Values of Indoor Air Pollutants from the Governments and International Institutions. Atmosphere 2023, 14, 633. [Google Scholar] [CrossRef]
  6. Settimo, G.; Manigrasso, M.; Avino, P. Indoor air quality: A focus on the european legislation and state-of-the-art research in Italy. Atmosphere 2020, 11, 370. [Google Scholar] [CrossRef]
  7. Leech, J.A.; Nelson, W.C.; Burnett, R.T.; Aaron, S.; Raizenne, M.E. It’s about time: A comparison of Canadian and American time-activity patterns. J. Expos. Anal. Environ. Epidemiol. 2002, 12, 427–432. [Google Scholar] [CrossRef]
  8. Brasche, S.; Bischof, W. Daily time spent indoors in German homes–Baseline data for the assessment of indoor exposure of German occupants. Int. J. Hyg. Environ. Health 2005, 208, 247–253. [Google Scholar] [CrossRef] [PubMed]
  9. Klepeis, N.E.; Nelson, W.C.; Ott, W.R.; Robinson, J.P.; Tsang, A.M.; Switzer, P.; Behar, J.V.; Hern, S.C.; Engelmann, W.H. The National Human Activity Pattern Survey (NHAPS): A resource for assessing exposure to environmental pollutants. J. Expos. Anal. Environ. Epidemiol. 2001, 11, 231–252. [Google Scholar] [CrossRef]
  10. Capolongo, S.; Settimo, G. Indoor Air Quality in Healing Environments: Impacts of Physical, Chemical, and Biological Environmental Factors on Users. In Indoor Air Quality in Healthcare Facilities; Capolongo, S., Settimo, G., Gola, M., Capolongo, S., Settimo, G., Gola, M., Eds.; Springer Public Health: New York, NY, USA, 2017; pp. 1–11. [Google Scholar] [CrossRef]
  11. Gola, M.; Settimo, G.; Capolongo, S. No Impacts on Users’ Health: How Indoor Air Quality Assessments Can Promote Health and Prevent Disease. In Internet of Things; Springer Science and Business Media Deutschland GmbH: Berlin/Heidelberg, Germany, 2022; pp. 43–54. [Google Scholar] [CrossRef]
  12. BRANZ Ltd. Designing Quality Learning Spaces: Ventilation & Indoor Air Quality; Ministry of Education: Wellington, New Zealand, 2007. [Google Scholar]
  13. Chojer, H.; Branco, P.T.B.S.; Martins, F.G.; Alvim-Ferraz, M.C.M.; Sousa, S.I.V. Development of low-cost indoor air quality monitoring devices: Recent advancements. Sci. Total Environ. 2020, 727, 138385. [Google Scholar] [CrossRef] [PubMed]
  14. Demanega, I.; Mujan, I.; Singer, B.C.; Andelkovic, A.S.; Babich, F.; Licina, D. Performance assessment of low-cost environmental monitors and single sensors under variable indoor air quality and thermal conditions. Build. Environ. 2021, 187, 107415. [Google Scholar] [CrossRef]
  15. Sá, J.P.; Alvim-Ferraz, M.C.M.; Martins, F.G.; Sousa, S.I.V. Application of the low-cost sensing technology for indoor air quality monitoring: A review. Environ. Technol. Innov. 2022, 28, 102551. [Google Scholar] [CrossRef]
  16. Karagulian, F.; Barbiere, M.; Kotsev, A.; Spinelle, L.; Gerboles, M.; Lagler, F.; Redon, N.; Crunaire, S.; Borowiak, A. Review of the performance of low-cost sensors for air quality monitoring. Atmosphere 2019, 10, 506. [Google Scholar] [CrossRef]
  17. Saini, J.; Dutta, M.; Marques, G. Indoor air quality monitoring systems based on internet of things: A systematic review. Int. J. Environ. Res. Public Health 2020, 17, 4942. [Google Scholar] [CrossRef] [PubMed]
  18. Saini, J.; Dutta, M.; Marques, G. Sensors for indoor air quality monitoring and assessment through Internet of Things: A systematic review. Environ. Monit. Assess. 2021, 193, 66. [Google Scholar] [CrossRef] [PubMed]
  19. Ródenas García, M.; Spinazzé, A.; Branco, P.T.B.S.; Borghi, F.; Villena, G.; Cattaneo, A.; Di Gilio, A.; Mihucz, V.G.; Gómez Álvarez, E.; Lopes, S.I.; et al. Review of low-cost sensors for indoor air quality: Features and applications. Appl. Spectrosc. Rev. 2022, 57, 747–779. [Google Scholar] [CrossRef]
  20. Yang, H.H.; Kwak, M.J.; Kim, K.J.; Kim, H.H. Analysis of Factors Influencing Indoor PM2.5 and CO2 Concentrations in Households using IoT Technology after Indoor Garden Installation. J. People Plant. Environ. 2022, 25, 571–583. [Google Scholar] [CrossRef]
  21. Justo Alonso, M.; Moazami, T.N.; Liu, P.; Jørgensen, R.B.; Mathisen, H.M. Assessing the indoor air quality and their predictor variable in 21 home offices during the COVID-19 pandemic in Norway. Build. Environ. 2022, 225, 109580. [Google Scholar] [CrossRef] [PubMed]
  22. Pantelic, J.; Son, Y.J.; Staven, B.; Liu, Q. Cooking emission control with IoT sensors and connected air quality interventions for smart and healthy homes: Evaluation of effectiveness and energy consumption. Energy Build. 2023, 286, 112932. [Google Scholar] [CrossRef]
  23. Yadav, R.; Chen, C.C.; Lee, C.Y.; Chen, N.T. Establishing a screening system of indoor air pollutants using mems sensor to create internet of things sensing platform. Sens. Mater. 2021, 33, 2275–2285. [Google Scholar] [CrossRef]
  24. Fritz, H.; Tang, M.; Kinney, K.; Nagy, Z. Evaluating machine learning models to classify occupants’ perceptions of their indoor environment and sleep quality from indoor air quality. J. Air Waste Manag. Assoc. 2022, 72, 1381–1397. [Google Scholar] [CrossRef]
  25. Kim, H.H.; Kwak, M.J.; Kim, K.J.; Gwak, Y.K.; Lee, J.H.; Yang, H.H. Evaluation of IaQ management using an iot-based indoor garden. Int. J. Environ. Res. Public Health 2020, 17, 1867. [Google Scholar] [CrossRef] [PubMed]
  26. Kureshi, R.R.; Thakker, D.; Mishra, B.K.; Barnes, J. From Raising Awareness to a Behavioural Change: A Case Study of Indoor Air Quality Improvement Using IoT and COM-B Model. Sensors 2023, 23, 3613. [Google Scholar] [CrossRef]
  27. Shrestha, P.M.; Humphrey, J.L.; Carlton, E.J.; Adgate, J.L.; Barton, K.E.; Root, E.D.; Miller, S.L. Impact of outdoor air pollution on indoor air quality in low-income homes during wildfire seasons. Int. J. Environ. Res. Public Health 2019, 16, 3535. [Google Scholar] [CrossRef] [PubMed]
  28. Chakraborty, R.; Heydon, J.; Mayfield, M.; Mihaylova, L. Indoor air pollution from residential stoves: Examining the flooding of particulate matter into homes during real-world use. Atmosphere 2020, 11, 1326. [Google Scholar] [CrossRef]
  29. Hegde, S.; Min, K.T.; Moore, J.; Lundrigan, P.; Patwari, N.; Collingwood, S.; Balch, A.; Kelly, K.E. Indoor household particulate matter measurements using a network of low-cost sensors. Aerosol Air Qual. Res. 2020, 20, 381–394. [Google Scholar] [CrossRef]
  30. Laltrello, S.; Amiri, A.; Lee, S.H. Indoor Particulate Matters Measured in Residential Homes in the Southeastern United States: Effects of Pandemic Lockdown and Holiday Cooking. Aerosol Air Qual. Res. 2022, 22. [Google Scholar] [CrossRef]
  31. Connolly, R.E.; Yu, Q.; Wang, Z.; Chen, Y.H.; Liu, J.Z.; Collier-Oxandale, A.; Papapostolou, V.; Polidori, A.; Zhu, Y. Long-term evaluation of a low-cost air sensor network for monitoring indoor and outdoor air quality at the community scale. Sci. Total Environ. 2022, 807, 150797. [Google Scholar] [CrossRef] [PubMed]
  32. Casey, J.G.; Ortega, J.; Coffey, E.; Hannigan, M. Low-cost measurement techniques to characterize the influence of home heating fuel on carbon monoxide in Navajo homes. Sci. Total Environ. 2018, 625, 608–618. [Google Scholar] [CrossRef] [PubMed]
  33. Bousiotis, D.; Alconcel, L.N.S.; Beddows, D.C.S.; Harrison, R.M.; Pope, F.D. Monitoring and apportioning sources of indoor air quality using low-cost particulate matter sensors. Environ. Int. 2023, 174, 107907. [Google Scholar] [CrossRef] [PubMed]
  34. Patel, S.; Li, J.; Pandey, A.; Pervez, S.; Chakrabarty, R.K.; Biswas, P. Spatio-temporal measurement of indoor particulate matter concentrations using a wireless network of low-cost sensors in households using solid fuels. Environ. Res. 2017, 152, 59–65. [Google Scholar] [CrossRef] [PubMed]
  35. Shen, H.; Hou, W.; Zhu, Y.; Zheng, S.; Ainiwaer, S.; Shen, G.; Chen, Y.; Cheng, H.; Hu, J.; Wan, Y.; et al. Temporal and spatial variation of PM2.5 in indoor air monitored by low-cost sensors. Sci. Total Environ. 2021, 770, 145304. [Google Scholar] [CrossRef]
  36. Sung, W.T.; Hsiao, S.J. Building an indoor air quality monitoring system based on the architecture of the Internet of Things. Eurasip J. Wirel. Commun. Netw. 2021, 2021, 153. [Google Scholar] [CrossRef]
  37. Taştan, M.; Gökozan, H. Real-time monitoring of indoor air quality with internet of things-based e-nose. Appl. Sci. 2019, 9, 3435. [Google Scholar] [CrossRef]
  38. Seiderer, A.; Aslan, I.; Dang, C.T.; Andre, E. Indoor Air Quality and Wellbeing—Enabling Awareness and Sensitivity with Ambient IoT Displays. In Proceedings of the AMBIENT INTELLIGENCE (AMI 2019), Rome, Italy, 13–15 November 2019; pp. 266–282. [Google Scholar] [CrossRef]
  39. Lopes, M.; Reis, J.; Fernandes, A.P.; Lopes, D.; Lourenço, R.; Nunes, T.; Faria, C.H.G.; Borrego, C.; Miranda, A.I. Indoor air quality study using low-cost sensors. WIT Trans. Ecol. Environ. 2020, 244, 1–13. [Google Scholar] [CrossRef]
  40. Taştan, M. A low-cost air quality monitoring system based on Internet of Things for smart homes. J. Ambient. Intell. Smart Environ. 2022, 14, 351–374. [Google Scholar] [CrossRef]
  41. Lady Ada. Introducing the Raspberry Pi Zero. 2024. Available online: https://cdn-learn.adafruit.com/downloads/pdf/introducing-the-raspberry-pi-zero.pdf (accessed on 12 June 2024).
  42. Raspberry Pi Ltd. Raspberry Pi 3 Model B+. 2023. Available online: https://datasheets.raspberrypi.com/rpi3/raspberry-pi-3-b-plus-product-brief.pdf (accessed on 12 June 2024).
  43. Pimoroni. Enviro for Raspberry Pi—Enviro + Air Quality. Available online: https://shop.pimoroni.com/cdn/shop/products/Enviro-Plus-pHAT-on-white-2_1500x1500_crop_center.jpg?v=1573820030 (accessed on 12 June 2024).
  44. Arduino®. Arduino® MEGA 2560 Rev3 Product Reference Manual. 2024. Available online: https://docs.arduino.cc/resources/datasheets/A000067-datasheet.pdf (accessed on 12 June 2024).
  45. Arduino®. Arduino® Nano Product Reference Manual. 2024. Available online: https://docs.arduino.cc/resources/datasheets/A000005-datasheet.pdf (accessed on 12 June 2024).
  46. Arduino®. Arduino Pro Mini. Available online: https://docs.arduino.cc/retired/boards/arduino-pro-mini/ (accessed on 12 June 2024).
  47. Espressif. Development Boards. Available online: https://www.espressif.com/en/products/devkits (accessed on 12 June 2024).
  48. PurpleAir. API Pricing. Available online: https://community.purpleair.com/t/api-pricing/4523 (accessed on 12 June 2024).
  49. ELT Sensor. T-110 Series. Available online: http://www.eltsensor.co.kr/2016/products/oem_modules/T-110.html (accessed on 28 August 2024).
  50. Telaire. Telaire T6703 Series CO2 Module. 2022. Available online: https://f.hubspotusercontent40.net/hubfs/9035299/Documents/AAS-920-640E-Telaire-T6703-020619-web.pdf (accessed on 28 August 2024).
  51. Sensirion. Datasheet SGP30 Sensirion Gas Platfrom. 2020. Available online: https://sensirion.com/media/documents/984E0DD5/61644B8B/Sensirion_Gas_Sensors_Datasheet_SGP30.pdf (accessed on 30 April 2024).
  52. Sensor, E. ELT Sensor Data Sheet for S-300. 2014. Available online: https://gasdetect.com/wp-content/uploads/2014/08/DS_S-300_v2.2.pdf (accessed on 28 August 2024).
  53. ASAIR. AHT10 Technical Manual. Available online: https://www.maritex.com.pl/product/attachment/147096/c5093eda6658ef654b651f3d5705c2ef (accessed on 28 August 2024).
  54. TFA. Bedienungsanleitung Instruction Manual Mode D’emploi Istruzioni per L’uso Gebruiksaanwijzing. 2014. Available online: https://com-tradebyte-core-tbone-media-live.s3.eu-central-1.amazonaws.com/media/1768/1800-600f2260b7b04.pdf (accessed on 28 August 2024).
  55. Handson Technology. BH1750 Ambient Light Sensor Module. Available online: https://www.handsontec.com/dataspecs/sensor/BH1750%20Light%20Sensor.pdf (accessed on 28 August 2024).
  56. BOSCH. BME280 Combined Humidity and Pressure Sensor. 2018. Available online: https://www.mouser.com/datasheet/2/783/BST-BME280-DS002-1509607.pdf (accessed on 28 August 2024).
  57. BOSCH. BME680-Datasheet. 2024. Available online: https://www.bosch-sensortec.com/media/boschsensortec/downloads/datasheets/bst-bme680-ds001.pdf (accessed on 30 April 2024).
  58. Bosch. Datasheet BMP180 Digital Pressure Sensor. 2013. Available online: https://cdn-shop.adafruit.com/datasheets/BST-BMP180-DS000-09.pdf (accessed on 28 August 2024).
  59. Bosch. Datasheet BMP280 Digital Pressure Sensor. 2015. Available online: https://cdn-shop.adafruit.com/datasheets/BST-BMP280-DS001-11.pdf (accessed on 28 August 2024).
  60. Alphasense. Technical Specifications Version 1.1 CO-B4/CO-B4+ Carbon Monoxide Sensor. Available online: https://ametekcdn.azureedge.net/mediafiles/project/oneweb/oneweb/alphasense/products/datasheets/alphasense_co-b4_datasheet_en_2.pdf?revision:87f7d42e-02c4-4b00-b888-bd9c8d07ed3f (accessed on 28 August 2024).
  61. ams. CCS811 Ultra-Low Power Digital Gas Sensor for Monitoring Indoor Air Quality. 2016. Available online: https://cdn.sparkfun.com/assets/learn_tutorials/1/4/3/CCS811_Datasheet-DS000459.pdf (accessed on 30 April 2024).
  62. Miller, D. Adafruit CCS811 Air Quality Sensor. 2024. Available online: https://cdn-learn.adafruit.com/downloads/pdf/adafruit-ccs811-air-quality-sensor.pdf (accessed on 30 April 2024).
  63. Aosong Electronics Co., Ltd. DHT22. Available online: https://www.sparkfun.com/datasheets/Sensors/Temperature/DHT22.pdf (accessed on 28 August 2024).
  64. SHARP. GP2Y1010AU0F. Available online: https://global.sharp/products/device/lineup/data/pdf/datasheet/gp2y1010au_e.pdf (accessed on 30 April 2024).
  65. Honeywell. Honeywell Laser Particle Sensor Module HPM-Series. 2016. Available online: https://www.tme.com/Document/e8973830bc95298716ba0a77d39489cc/HPMdte.PDF (accessed on 28 August 2024).
  66. Honeywell. HPM Series Particulate Matter Sensor. 2021. Available online: https://prod-edam.honeywell.com/content/dam/honeywell-edam/sps/siot/en-us/products/sensors/particulate-matter-sensors-hpm-series/documents/sps-siot-particulate-hpm-series-datasheet-32322550-ciid-165855.pdf (accessed on 28 August 2024).
  67. Senseair. Senseair K30. 2023. Available online: https://rmtplusstoragesenseair.blob.core.windows.net/docs/publicerat/PSH0131.pdf (accessed on 28 August 2024).
  68. Littelfuse. USP11492 Thermistor Probe. 2018. Available online: https://www.littelfuse.com/~/media/electronics/datasheets/thermistor_probes_and_assemblies/littelfuse_thermistor_probes_assemblies_straight_usp11492_datasheet.pdf.pdf (accessed on 28 August 2024).
  69. Zhengzhou Winsen Electronics Technology CO., Ltd. Intelligent Infrared Carbon Dioxide Module (Model: MH-Z14) User’s Manual V2.4. 2014. Available online: https://www.winsen-sensor.com/d/files/MH-Z14.pdf (accessed on 28 August 2024).
  70. Zhengzhou Winsen Electronics Technology CO., Ltd. Intelligent Infrared Carbon Dioxide Module (Model: MH-Z14A) User’s Manual V1.2. 2019. Available online: https://www.winsen-sensor.com/d/files/MH-Z14A.pdf (accessed on 28 August 2024).
  71. Zhengzhou Winsen Electronics Technology CO., Ltd. Intelligent Infrared Carbon Dioxide Module (Model: MH-Z19) User’s Manual V1.0. 2015. Available online: https://www.winsen-sensor.com/d/files/PDF/Infrared%20Gas%20Sensor/NDIR%20CO2%20SENSOR/MH-Z19%20CO2%20Ver1.0.pdf (accessed on 28 August 2024).
  72. SGX Sensortech. Datasheet MiCS-4514 0278 rev 15. Available online: https://www.sgxsensortech.com/content/uploads/2014/08/0278_Datasheet-MiCS-4514.pdf (accessed on 12 June 2024).
  73. SGX Sensortech. Datasheet MiCS-6814 1143 rev 8. Available online: https://www.sgxsensortech.com/content/uploads/2015/02/1143_Datasheet-MiCS-6814-rev-8.pdf (accessed on 12 June 2024).
  74. Zhengzhou Winsen Electronics Technology Co., Ltd. Toxic Gas Sensor (Model: MQ-7) Manual. 2014. Available online: https://cdn.sparkfun.com/datasheets/Sensors/Biometric/MQ-7%20Ver1.3%20-%20Manual.pdf (accessed on 28 August 2024).
  75. Alphasense. OPC-N3 Particle Monitor. Available online: http://www.apollounion.com/Upload/DownFiles/202108/OPC-N3.pdf (accessed on 28 August 2024).
  76. Alphasense. Alphassense User Manual OPC-R1 Optical Particle Counter. 2019. Available online: https://kolegite.com/EE_library/datasheets_and_manuals/sensors/OPC/072-0500_OPC-R1_manual_issue_1_250219.pdf (accessed on 28 August 2024).
  77. GROUP, G. 11-D Dust Decoder—Portable Aerosol Spectrometer. Available online: https://www.durag.com/mediafiles/stream/?id=4/1/5/a/415ae9786003f185440db854e09cf07880128d21_Datasheet_11_D_en_final.pdf (accessed on 28 August 2024).
  78. Yong, Z. Digital Universal Particle Concentration Sensor PMS3003 Series Data Manual. 2016. Available online: https://www.dynamoelectronics.com/descargas/PMS3003.pdf (accessed on 28 August 2024).
  79. Plantower. PMS6003. Available online: https://www.plantower.com/en/products_33/75.html (accessed on 28 August 2024).
  80. Yong, Z. Digital Universal Particle Concentration Sensor PMS7003 Series Data Manual. 2016. Available online: https://download.kamami.pl/p564008-PMS7003%20series%20data%20manua_English_V2.5.pdf (accessed on 28 August 2024).
  81. Yong, Z. Digital Universal Particle Concentration Sensor PMS5003 Series Data Manual. 2016. Available online: https://www.digikey.jp/htmldatasheets/production/2903006/0/0/1/pms5003-series-manual.html (accessed on 28 August 2024).
  82. Air Quality Sensor Performance Evaluation Center (AQ-SPEC). PurpleAir PA-II. Available online: https://www.aqmd.gov/aq-spec/product/purpleair-pa-ii (accessed on 28 August 2024).
  83. Sensirion. Datasheet Sensirion SCD30 Sensor Module. 2020. Available online: https://sensirion.com/media/documents/4EAF6AF8/61652C3C/Sensirion_CO2_Sensors_SCD30_Datasheet.pdf (accessed on 28 August 2024).
  84. Sensirion. SCD4x. 2023. Available online: https://sensirion.com/media/documents/48C4B7FB/64C134E7/Sensirion_SCD4x_Datasheet.pdf (accessed on 28 August 2024).
  85. Nova Fitness Co., Ltd. Laser PM2.5 Sensor Specificationtd. Product Model: SDS018 Version V1.5. 2015. Available online: https://ecksteinimg.de/Datasheet/SDS018%20Laser%20PM2.5%20Product%20Spec%20V1.5.pdf (accessed on 28 August 2024).
  86. Senseair. Senseair S8 LP. 2024. Available online: https://rmtplusstoragesenseair.blob.core.windows.net/docs/Dev/publicerat/PSH1944.pdf (accessed on 28 August 2024).
  87. Shinyei. Particle Sensor Model PPD42NS. 2010. Available online: https://nettigo.eu/attachments/533 (accessed on 28 August 2024).
  88. Sensirion. Datasheet SHT1x. 2011. Available online: https://sensirion.com/media/documents/BD45ECB5/61642783/Sensirion_Humidity_Sensors_SHT1x_Datasheet.pdf (accessed on 28 August 2024).
  89. Sensirion. Datasheet SHT20. 2022. Available online: https://sensirion.com/resource/datasheet/sht20 (accessed on 28 August 2024).
  90. Sensirion. Datasheet SHT3x-DIS. 2022. Available online: https://sensirion.com/media/documents/213E6A3B/63A5A569/Datasheet_SHT3x_DIS.pdf (accessed on 28 August 2024).
  91. Sensirion. Datasheet SPS30. 2023. Available online: https://sensirion.com/media/documents/8600FF88/64A3B8D6/Sensirion_PM_Sensors_Datasheet_SPS30.pdf (accessed on 28 August 2024).
  92. SPEC SENSORS. DGS-NO2 Ditital Gas Sensor—Nitrogen Dioxide. 2017. Available online: https://www.spec-sensors.com/wp-content/uploads/2017/01/DGS-NO2-968-043_9-6-17.pdf (accessed on 28 August 2024).
  93. SPEC SENSORS. DGS-CO Ditital Gas Sensor—Carbon Monoxide. 2017. Available online: https://www.spec-sensors.com/wp-content/uploads/2017/01/DGS-CO-968-034.pdf (accessed on 28 August 2024).
  94. Sensirion. Datasheet SVM30 Multi-Gas, Humidity and Temperature Sensor Combo Module 2019. Available online: https://sensirion.com/media/documents/9152AD80/616538A9/Sensirion_Gas_Sensors_Datasheet_SVM30.pdf (accessed on 30 April 2024).
  95. Ams. TSL2591. 2013. Available online: https://cdn-shop.adafruit.com/datasheets/TSL25911_Datasheet_EN_v1.pdf (accessed on 28 August 2024).
  96. ProSense Technologies Co., Ltd. Dart Sensors WZ-S Formaldehyde Module Operation Manual. Available online: https://www.dart-sensors.com/wp-content/uploads/2017/07/formaldehyde_module_operation-manual.pdf (accessed on 28 August 2024).
  97. Espressif. ESP8266 A Cost-Effective and Highly Integrated Wi-Fi MCU for IoT Applications. Available online: https://www.espressif.com/en/products/socs/esp8266 (accessed on 12 June 2024).
  98. Fritz, H.; Bastami, S.; Lin, C.; Nweye, K.; To, T.; Chen, L.; Le, D.; Ibarra, A.; Zhang, W.; Park, J.Y.; et al. Design, fabrication, and calibration of the Building EnVironment and Occupancy (BEVO) Beacon: A rapidly-deployable and affordable indoor environmental quality monitor. Build. Environ. 2022, 222, 109432. [Google Scholar] [CrossRef]
  99. World Meteorological Organization (WMO). Integrating Low-Cost Sensor Systems and Networks to Enhance Air Quality Applications; World Meteorological Organization (WMO): Geneva, Switzerland, 2024. [Google Scholar]
  100. Kureshi, R.R.; Mishra, B.K.; Thakker, D.; John, R.; Walker, A.; Simpson, S.; Thakkar, N.; Wante, A.K. Data-Driven Techniques for Low-Cost Sensor Selection and Calibration for the Use Case of Air Quality Monitoring. Sensors 2022, 22, 1093. [Google Scholar] [CrossRef] [PubMed]
  101. Rampini, L.; Re Cecconi, F. Is the Construction Sector Ready for Artificial Intelligence. In Advances in Science, Technology and Innovation; Springer: Berlin/Heidelberg, Germany, 2024; pp. 165–172. Available online: https://www.scopus.com/record/display.uri?eid=2-s2.0-85189563498&doi=10.1007%2f978-3-031-52303-8_12&origin=inward&txGid=ba9a0715fb60009f2b3442a70b6b4e88 (accessed on 18 July 2024).
  102. Mannino, A.; Dejaco, M.C.; Re Cecconi, F. Building information modelling and internet of things integration for facility management-literature review and future needs. Appl. Sci. 2021, 11, 3062. [Google Scholar] [CrossRef]
  103. AI-Thinker Team. ESP-12E WiFi Module Version1.0. 2015. Available online: https://components101.com/sites/default/files/2021-09/ESP12E-Datasheet.pdf (accessed on 12 June 2024).
  104. Gherman, M.P.; Cheng, Y.; Gomez, A.; Saukh, O. Compensating Altered Sensitivity of Duty-Cycled MOX Gas Sensors with Machine Learning. In Proceedings of the Annual IEEE Communications Society Conference on Sensor, Mesh and Ad Hoc Communications and Networks workshops, Rome, Italy, 6–9 July 2021; Available online: https://www.scopus.com/record/display.uri?eid=2-s2.0-85111740124&doi=10.1109%2fSECON52354.2021.9491586&origin=inward&txGid=1af56e4a183870ee85c4cca3d4f6087f (accessed on 18 July 2023).
Figure 1. Flowchart of the bibliographic review process.
Atmosphere 15 01170 g001
Figure 2. Themes of selected papers (a) and years of the included publications (b).
Atmosphere 15 01170 g002
Figure 3. Sensor measured parameters and mentioned times.
Atmosphere 15 01170 g003
Figure 4. MCUs used in the included publications. Images (g,i) are taken by Y.Y. (one of the authors), (a) is from [41], (b) is from [42], (c) is from [43], (d) is from [44], (e) is from [45], (f) is from [46], (h) is from [47] respectively.
Atmosphere 15 01170 g004
Figure 5. Two different versions of the esp8266 board with totally different conditions in sleep mode (photos by Y.Y., one of the authors).
Atmosphere 15 01170 g005
Table 1. Summary of the main characteristics of the reviewed studies using low-cost sensors with IoT applications in residential buildings.
Study TypesRef.Publication YearPlace of Research 1Research PeriodTotal PeriodSamplesMeasured
Parameters 2
Sensors ImplementedMeasurement
Interval
CalibrationMicro-Controller UnitInternet ConnectionData Transmission ProtocolData Collection PlatformData Analysis Platform
Devices Application[20]2022South KoreaJune 2017–May 201924 months10 householdsT, RH, CO2, PM2.5
  • HPM Series
  • S-300
  • SHT11
5 minNMNM 3YesNMNMIBM SPSS Statistics software version 27.
[21]2022Trondheim, Norway8 December 2020—28 February 2021/
21 May 2021–21 June 2021
3 + 1 month21 housesT, RH, CO2, Formaldehyde,
TVOC
  • SCD30
  • WZ-S formaldehyde module
  • SVM30
5 minYes
  • Raspberry Pi
NoN/A 3Local memoryIBM® SPSS® (Ver. 28.0).
[22]2023Rochester, USANMNM1 test lab 6PM2.5
  • Purple Air PA-II
2 minYesNAYesBACnetWell Living Lab CloudMicrosoft Azure (Microsoft, Redmond, WA, USA)
[23]2021NMNMNM1 test lab 6VOC
  • MEMS sensor type not mentioned
NMNMNMNMBluetoothBeacon systemBeacon system
[24]2022California, USAJuly 2016–April201821 months93 residencesT. RH, light, CO2, CO, PM2.5, TVOC, NO2
  • SPS30
  • SCD30
  • SGP30
  • SPEC DGS-NO2
  • SPEC DGS-CO
  • TSL2591
NMYesNMNMNMNMNM
[25]2020Pyeongtaek, South KoreaJune 2017–September 201815 months8 householdsT, RH, CO2, PM
  • HPM Series Particle Sensor
  • Sensors not mentioned
5 minNMNMYesEthernetHoneywellNM
[26]2023Bradford, UKSeptember 2021–October 20212 months8 householdsT, RH, PM10, PM2.5
  • BME680
  • SDS011
15 minYesNMYesWi-FiNMNM
[27]2019Colorado, USA17 August–10 October 2016/
28 June–12 September 2017
2 + 3 months10 houses in 2016, 19 houses in 2017T, RH, CO, PM2.5, Other pollutants with passive samplers 4
  • Dylos-1700
  • Y-Pods
Other pollutants with passive samplers 4
NMYesNMNoNMLocal memoryNM
[28]2020Sheffield, UKJanauary–April 20204 months20 households with fuel stovesT, RH, light, noise, air pressure, distance, CO, PM2.5, PM1, NO2, NH3
  • BME280
  • LTR-559
  • PMS5003
  • MICS6814
145 sYes
  • Raspberry Pi Zero
  • Raspberry Pi Enviro+
YesWi-FiVirtual server from the University of SheffieldNM
[29]2020Cottonwood Heights, USA19 May–19 July 20162 months1 houseT, RH, altitude PM, location
  • BMP180
  • DHT22
  • PMS3003
  • Ultimate GPS chip
1 minYes
  • Raspberry Pi 3
YesEthernetInfluxDBNM
[30]2022North Alabama/Texas, USAMay 2019–May 2020305 days2 residencesPM
  • PASDD Model 11-D
NMYesNMYesNMNMNM
[31]2022Los Angeles, USADecember 2017–June 201919 months1 community with 30 sensorsPM, NO2, Traffic flow
  • Purple Air-II
  • (VDS)-718,297
  • NO2 sensor not mentioned
80–120 sYesNMYesWi-FiPurpleAir SERVERNM
[32]2018Navajo Nation, USAFebruary–April 20143 months41 homesCO
  • CO-B4 sensors
15 sYesNMNoNALocal memoryMATLAB
[33]2023Worcestershire, UK16 December 2021–2 February 20221.5 months1 houseT, RH, PM
  • BME-280
  • OPC-N3
10 minYesNMNoNMNMNM
[34]2017Raipur, IndiaNMNM2 householdsPM
  • GP2Y1010AU0F
  • Sidepak AM510
NMYes
  • Nano 3.0
NoZigBeeNMNM
[35]2021Beijing, China14 March–24 March 202010 days14 rooms and 1 outdoor pointPM, particle numbers
  • PMS3003
  • PM-Model-II
1 minYesNMNMNMNMSPSS Statistics 24 (IBM Corp., NY, USA)
Development Log[36]2021N/AN/AN/AN/ACO2, CO, PM2.5
  • MH-Z14A
  • MQ7
  • GP2Y1010AU0F
NMYes
  • Arduino Uno
  • ESP8266
NoWi-FiHome gas detection and monitoring systemExcel
[37]2019N/A21 March–24 March 20194 days1 houseT, RH, CO2, CO, NO2, dust 7
  • DHT22
  • MH-Z14
  • MICS-4514
  • GP2Y1010AU
1 minYes
  • ESP32
YesWi-FiBlynk (2.28.17v) IoT platformNM
Devices Performance Test[38]2019NMN/AN/AN/AT, RH, air pressure, light, CO2, VOC,
  • BMP280
  • SCD30
  • AirCO2ntrol
  • iAM
  • BH1750
N/AYes
  • Raspberry Pi 3 B+
  • Arduino Mini Pro
  • ESP8266
YesWi-FiPostgreSQL
  • Eventerpretor
  • PostgreSQ
[39]2020Salreu/Gafanha/Aveiro, PortualSeptember 2019–March 20206 months3 housesT, RH, CO2, CO, PM10, PM2.5, NO2, OX Sensors not mentioned 15 minYesNMNMNMNMNM
[14]2021Fribourg, Switzerland.N/AN/A1 test chamber 6T, RH, CO2, PM, TVOC Many sensors within commercial products 510 s to 5 min depending on the devicesYesN/ANoN/AN/ANumPy package of Python
[40]2022Manisa, Turkey6 Novmber –13 Novmber 20207 days1 houseT, RH, CO2, PM
  • AHT10
  • MH-Z19A
  • PMS7003
5 sYes
  • ESP8266-12E
YesWi-FiBlynk (2.28.17v) IoT platformNM
Review[15]2022N/AN/AN/AN/AN/AN/AN/AN/AN/AN/AN/AN/AN/A
Note: N/A means “not applicable” and NM means “not mentioned”. 1 T for Temperature; RH for Relative Humidity; CO2 for Carbon Dioxide; CO for Carbon Monoxide; PM for Particulate Matters; NO2 for Nitrogen Dioxide; (T)VOC for (Total) Volatile Organic Compound; OX for Oxidizing gas; and NH3 for Ammonia. 2 The place of research is the location where researchers did the measurement, rather than the affiliations and origins of researchers. 3 N/A for not applicable in this research, NM for not mentioned in this publication. Some methods, such as a development log, do not need a specific place and time for measurement. Some information just skipped or missed to be mentioned in the publications. 4 In this research, there are some other pollutants measured by passive samplers, which are skipped in this table. 5 This research not only applied its own devices but also compared with many existing commercial devices in the market. Since there are too many involved sensors, they are skipped in the table and will be discussed in the following paragraphs. 6 Rather than as an empty room or chamber, the test lab or test chamber is furbished to simulate a residential house, or just the inside of a house, to create a residential settings. 7 The definition of dust is not as clear as PM, so it is listed separately.
Table 2. Summary of sensors mentioned in the included research with their codes, brands and measurement parameters.
Sensor or Device CodeManufacturer or Brand 1Air Pollutant 2,3Environmental Factor 2,3Other Parameters
PM1.0PM2.5PM10dustCO2CH2OTVOCVOCCONO2NH3PNTRHAPLightDistanceAltitudeLocationTraffic
AHT10
AirCO2ntrol MiniTFA
AirVisual M25b
Amphenol Telaire T6703-5 K
BH1750 4
BME280Bosch
BME680Bosch
BMP180Bosch
BMP280
CO-B4Alphasense
CSS811
DHT22Aosong Electronics
GP2Y1010AU0FSHARP
GPY1010AU0FSHARP
HPM SeriesHoneywell
HPMA115S0-XXXHoneywell
iAMAMS
K30CO2meter
Lit92Littelfuse
MH-Z14
MH-Z14A
MH-Z19A
MICS-4514
MICS6814
MQ7
OPC-N3Alphasense
OPC-R1Alphasense
PASDD Model 11-DGrimm Technologies
PMS3003Plantower
PMS6003Plantower
PMS7003Plantower
PM-Model-IIGreen Built EnvMent
Purple Air PA-IIPurpleAir
S-300ELT Sensor
SCD30Sensirion
SCD40Sensirion
SDS018NovaFitness
SenseAir S8SenseAir
SGP30Sensirion
Shintei ppd42
SHT11Sensirion
SHT20Sensirion
SHT30Sensirion
SHT31-DSensirion
SPS30Sensirion
SPEC DGS-NO2
SPEC DGS-CO
SVM30Sensirion
T-110ELT sensor
TSL2591 4
WZ-S formaldehyde moduleDART
Y-PodsHannigan Lab
LTR-559 4
Ultimate GPS breakout 4Adafriut
(VDS)-718,297 4CalTrans
included sensor numbers1316911113163111513231111
Notes: 1 The manufacturer or brand is usually the company, university, or person that manufactures and sells the sensors. The blank means in the papers the author did not mention their manufacturers. 2 For air pollutants: PM for Particulate Matters; TSP for Total Suspended Particles; CO2 for Carbon Dioxide; CH2O for Formaldehyde; TVOC and VOC for (Total) Volatile Organic Compound; CO for Carbon Monoxide; NO2 for Nitrogen Dioxide; NH3 for Ammonia; PN for Particle Numbers; For environmental parameters: T for Temperature; RH for Relative Humidity; AP for Air Pressure. 3 The sensor for noise is not mentioned by the author of the included paper. Black carbon is measured with MicroAeth®AE51, in a passive way, so they are skipped in the table. 4 These sensors are not gas or air sensors but other devices mentioned for supporting air quality monitoring.
Table 3. Cost of several commercial devices and independent air sensors from included papers.
Sensor TypeRef.ParametersRetail Price
TRHPMVOCCO2CONO2
Commercial devices with low-cost sensors mentioned in the literature with their cost 1
Netatmo (I/O unit) [14] USD 165
Awair 2nd Edition (Awair) [14] USD 199
Foobot [14] USD 199
Kaiterra Laser Egg (Kaiterra) [14] USD 199
AirU [29] USD 200
AirVisual Pro (AirVisual) [14] USD 269
uHoo (uHoo) [14] USD 329
UMDS [29] USD 366
Clarity Node (Clarity) [14] USD 1000
Research level devices as reference mentioned in the literature with their cost 1
TSI Sidepak AM510 [34] USD 3500
AirMetrics MiniVol[29] USD 3650
TSI DustTrak II [29] USD 5000
GRIMM 1.109 [29] USD 12,000
Part of the sensors mentioned in the literature with their costs 1
DHT22 [37] USD 3.0
SHT 31 2 [14] USD 14.5
LIT 92[14] USD 16.5
GP2Y1010AU [37] USD 5.0
PMS7003 [40] USD 17.0
Honeywell HPM series [29] <USD 20
Sharp GP2Y1010[29] <USD 20
Shinyei PPD42NS [29] <USD 20
Plantower PMS series [29] <USD 20
SDS018[14] USD 26.8
SPS30 [14] USD 46.7
Alphasense OPC-R1 [14] USD 116.0
Alphasense OPC-N3 [14,33] USD 305.0/GBP 250
MH-Z19A[40] USD 15.0
MH-Z14[37] USD 25.0
K30 [14] USD 85.0
Alphasense CO-B4[32] USD 80.0
USB-EL-CO300[32] USD 125.0
MICS-4514[37] USD 20.0
1 The cost of the sensor or device is based on the search results 2–3 years ago. The specific cost refers to the specific product type. Also, in different regions, the price will be quite different. 2 SHT31 is designed as a humidity sensor but can also measure Temperature, which is not mentioned in the literature. Similar situations may exist in the other sensors.
Table 5. Calibration methods of the 6 papers with brief descriptions.
Ref.ParametersReference DevicesCalibration Methods
[22]PM
  • Teledyne T640
Calibrated at background level, 150, 400, and 900 μg/m3 with the reference device.
[27]PN, BC, CO, NO2NMCalibrated with federal reference monitors from the Colorado Department of Public Health and Environment.
[28]PM
  • Palas Fidas 200
Humidity-based bias correction and k -Köhler theory are methods used to calibrate LCS PM sensors with Palas Findas 200 as reference devices.
[39]CO, CO2, NO2, PM10, PM2.5, O3
  • GrayWolf (IQ-610, TG-501 and PC-3016A);
  • YESAIR
The two reference devices and the LCS devices had intercomparison as calibration.
[29]PM
  • GRIMM 1.109;
  • DustTrak II;
  • Airmetrics MiniVol
One calibration week with LCS and four research-level devices together in the rooms (door closed).
[40]T, RH, PM, CO2
  • Dienmern DM72B;
  • Xiaomi Mijia
1-week calibration, T and RH calibrated with Xiaomi Mijia; PM and CO2 calibrated with Dienmern DM72B.
Note: NM means “not mentioned” in the paper.
Disclaimer/Publisher’s Note: The statements, opinions and data contained in all publications are solely those of the individual author(s) and contributor(s) and not of MDPI and/or the editor(s). MDPI and/or the editor(s) disclaim responsibility for any injury to people or property resulting from any ideas, methods, instructions or products referred to in the content.

