Article

Effects of Wildfire Smoke on Volatile Organic Compound (VOC) and PM2.5 Composition in a United States Intermountain Western Valley and Estimation of Human Health Risk

by
Damien T. Ketcherside
1,2,
Dylan D. Miller
3,
Dalynn R. Kenerson
1,
Phillip S. Scott
1,4,
John P. Andrew
1,5,
Melanie A. Y. Bakker
1,
Brandi A. Bundy
1,
Brian K. Grimm
1,
Jiahong Li
1,
Laurel A. Nuñez
1,
Dorian L. Pittman
1,
Reece P. Uhlorn
1 and
Nancy A. C. Johnston
1,*
1
Physical, Life, Movement & Sport Sciences Division, Lewis-Clark State College, Lewiston, ID 83501, USA
2
Department of Chemistry, University of Montana, Missoula, MT 59812, USA
3
School of Medicine, University of Washington, Seattle, WA 98195, USA
4
School of Osteopathic Medicine of the Pacific Northwest, Western University of Health Sciences, Lebanon, OR 97355, USA
5
Health Science Center, University of Texas, San Antonio, TX 78229, USA
*
Author to whom correspondence should be addressed.
Atmosphere 2024, 15(10), 1172; https://doi.org/10.3390/atmos15101172
Submission received: 4 September 2024 / Revised: 25 September 2024 / Accepted: 27 September 2024 / Published: 30 September 2024
(This article belongs to the Special Issue Outdoor Air Pollution and Human Health (3rd Edition))

Abstract

:
With a warmer and drier climate, there has been an increase in wildfire events in the Northwest US, posing a potential health risk to downwind communities. The Lewis–Clark Valley (LCV), a small metropolitan area on the Washington/Idaho border in the United States Intermountain West region, was studied over the time period of 2017–2018. The main objective was to determine the community’s exposure to particulate matter (PM2.5) and volatile organic compounds (VOCs) during wildfire smoke events and to estimate the associated health risk. VOCs were analyzed previously in the LCV using sorbent tube sampling and thermal-desorption gas-chromatography mass-spectrometry (TD-GC-MS) during several local smoke events in the 2017–2018 fire seasons. PM2.5 measurements were obtained from nearby agency monitors. PM2.5 reached up to 200 µg/m3 in 2017 and over 100 µg/m3 in 2018 in the LCV, and has been observed to be increasing at a rate of 0.10 µg m−3/yr over the past two decades. Benzene, a carcinogen and air toxic, was measured with concentrations up to 11 µg/m3, over ten times the normal level in some instances, in the LCV. The health risk in the LCV from benzene was calculated at seven extra cancers per million for lifetime exposure and thirteen extra cancers per million considering all air toxics measured. The other cities monitored showed similar lifetime cancer risk, due to benzene of about 6–7 extra cancers per million. This work is important, as it measures ground-level exposures of VOCs and demonstrates decreases in PM2.5 air quality over time in the region.

1. Introduction

Wildfires have become increasingly prevalent in the Western United States (U.S.) due to climate change, prolonged droughts, and land-use practices [1,2,3,4]. During 1984–2011, large U.S. wildfires increased at the rate of seven fires per year, or 355 square kilometers per year [5]. In the Western U.S., from 1950 until 2019, wildfire frequency and annual area burned followed an exponential growth, and mega-fires have doubled [6]. The forecast for large, simultaneous fires in the west is also increasing [7]. In the Western United States, the number of rain-wetting days between May and September from 1984 to 2015 exhibited a decreasing trend, which has been directly correlated to an increase in forested area burned [8]. Anthropogenic climate impacts have led to an excess of 4.2 million hectares of additional area burned within Western United States forests [9].
As the frequency and area of wildfires escalate, their associated emissions have surged to the forefront of environmental and public health concerns. Biomass burning (BB) contributes to the majority of carbonaceous fine aerosol emissions, and is the second largest source of trace gases in the atmosphere [10]. These emissions lead to the formation of secondary organic aerosols, as well as downwind ozone formation [11]. Studies have shown high concentrations of various VOCs, including alkenes, benzene, furans, phenols, and sulfur-containing compounds in wildfire smoke [12,13,14,15,16]. Fine particulate matter (PM2.5) has been shown to be increasing in the Northwest U.S., at a rate of 0.21 (±0.12) µg m−3/yr, while it is on a downward trend for the rest of the country [17]. Most data to date show health effects from particulates and smoke but overlook ground-level speciated gas components. These can be just as important in human health.
Both primary and secondary biomass-burning emissions have been shown to be harmful to human health. Exposure to benzene, a trace gas emitted through biomass burning, can lead to acute lymphoblastic leukemia and chronic myeloid leukemia, as well as chromosomal damage in humans [18,19]. Exposure to PM2.5 can exacerbate pre-existing respiratory illnesses such as asthma and emphysema [20]. These particles are so small that they make their way into the lung tissue, eventually leading to alveolar wall corrosion [21]. While this decreases overall pulmonary function, it also leads to the formation of lung cancers and adenocarcinoma [22]. A study conducted by the American Cancer Society found that with each increase of 10 µg m−3 in the PM2.5 concentration, mortality due to lung cancer increases by 8% [23]. Models predict a 2.8% increase in overall mortality from short-term exposures for each additional 10 µg m−3 in the PM2.5 concentration [24]. Large cities and urban centers can pose a human health risk to their respective populations due to air pollution, but rural and small urban areas have been frequently overlooked with respect to air pollution from trace gases or particulates. These rural or small urban areas, which have less pollution due to numbers of people and transportation, tend to be impacted during winter months, due to biomass burning for heating homes and during summer/early fall, due to agriculture or wildfire smoke events [25]. Although some studies and regional monitoring have been conducted during wildfire seasons [13,16,26,27,28], there is generally a lack of information from these less populated areas, due to minimal or non-existent ground-based monitoring.
The Lewis–Clark Valley (LCV) is a small urban area located along the Northern Idaho–Eastern Washington border with a combined population of about fifty thousand. Wildfire smoke can travel short or long distances and remain stagnant in the LCV for several days or weeks. This leads to spikes in PM2.5 concentrations, at times raising the air quality index to unhealthy and very hazardous levels, as seen in the last decade [28]. While wildfire smoke does have an impact on the area, it is not the lone source of air pollution. There are various industrial sources within the valley which contribute to the local air pollution, including a Kraft process pulp paper mill. The authors have assessed the valley’s emissions and health risk in the past, but without particular focus on wildfire smoke impacts [29]. The Nez Perce Tribe conducted a study on various volatile organic compounds such as benzene and formaldehyde [30,31]. Benzene levels in the LCV were found to be greater than the national mean , while formaldehyde was found to be decreasing over time [30,31]. Health risks attributed to the local pollution were seen as low risk, ranging from 2 to 11 extra cancers per million [29]. In these studies, health risk attributed to wildfire smoke in the LCV has not been reported.
This current work aimed to determine the impact that wildfire smoke has on the concentration of volatile organic compounds (VOCs) and PM2.5 in the Lewis–Clark Valley and nearby cities of Coeur d’Alene, Boise and Spokane. Specifically, how did two major smoke events in the summers of 2017–2018 affect health risk, based on these exposures to the communities? VOC concentrations obtained previously during this time from thermal-desorption gas-chromatography mass-spectrometry (TD-GC-MS) by the coauthors [29] were used with PM2.5 values to classify wildfire smoke versus normal air-quality days. Human health risk due to benzene and other elevated air toxic exposure in wildfire smoke was determined. PM2.5 trends over the past 23 years in the LCV were also investigated. This work addresses the impact of ground-level VOCs and PM2.5 from wildfire smoke on these communities in the Northwest, where smoke influence is growing at the greatest rate [17].

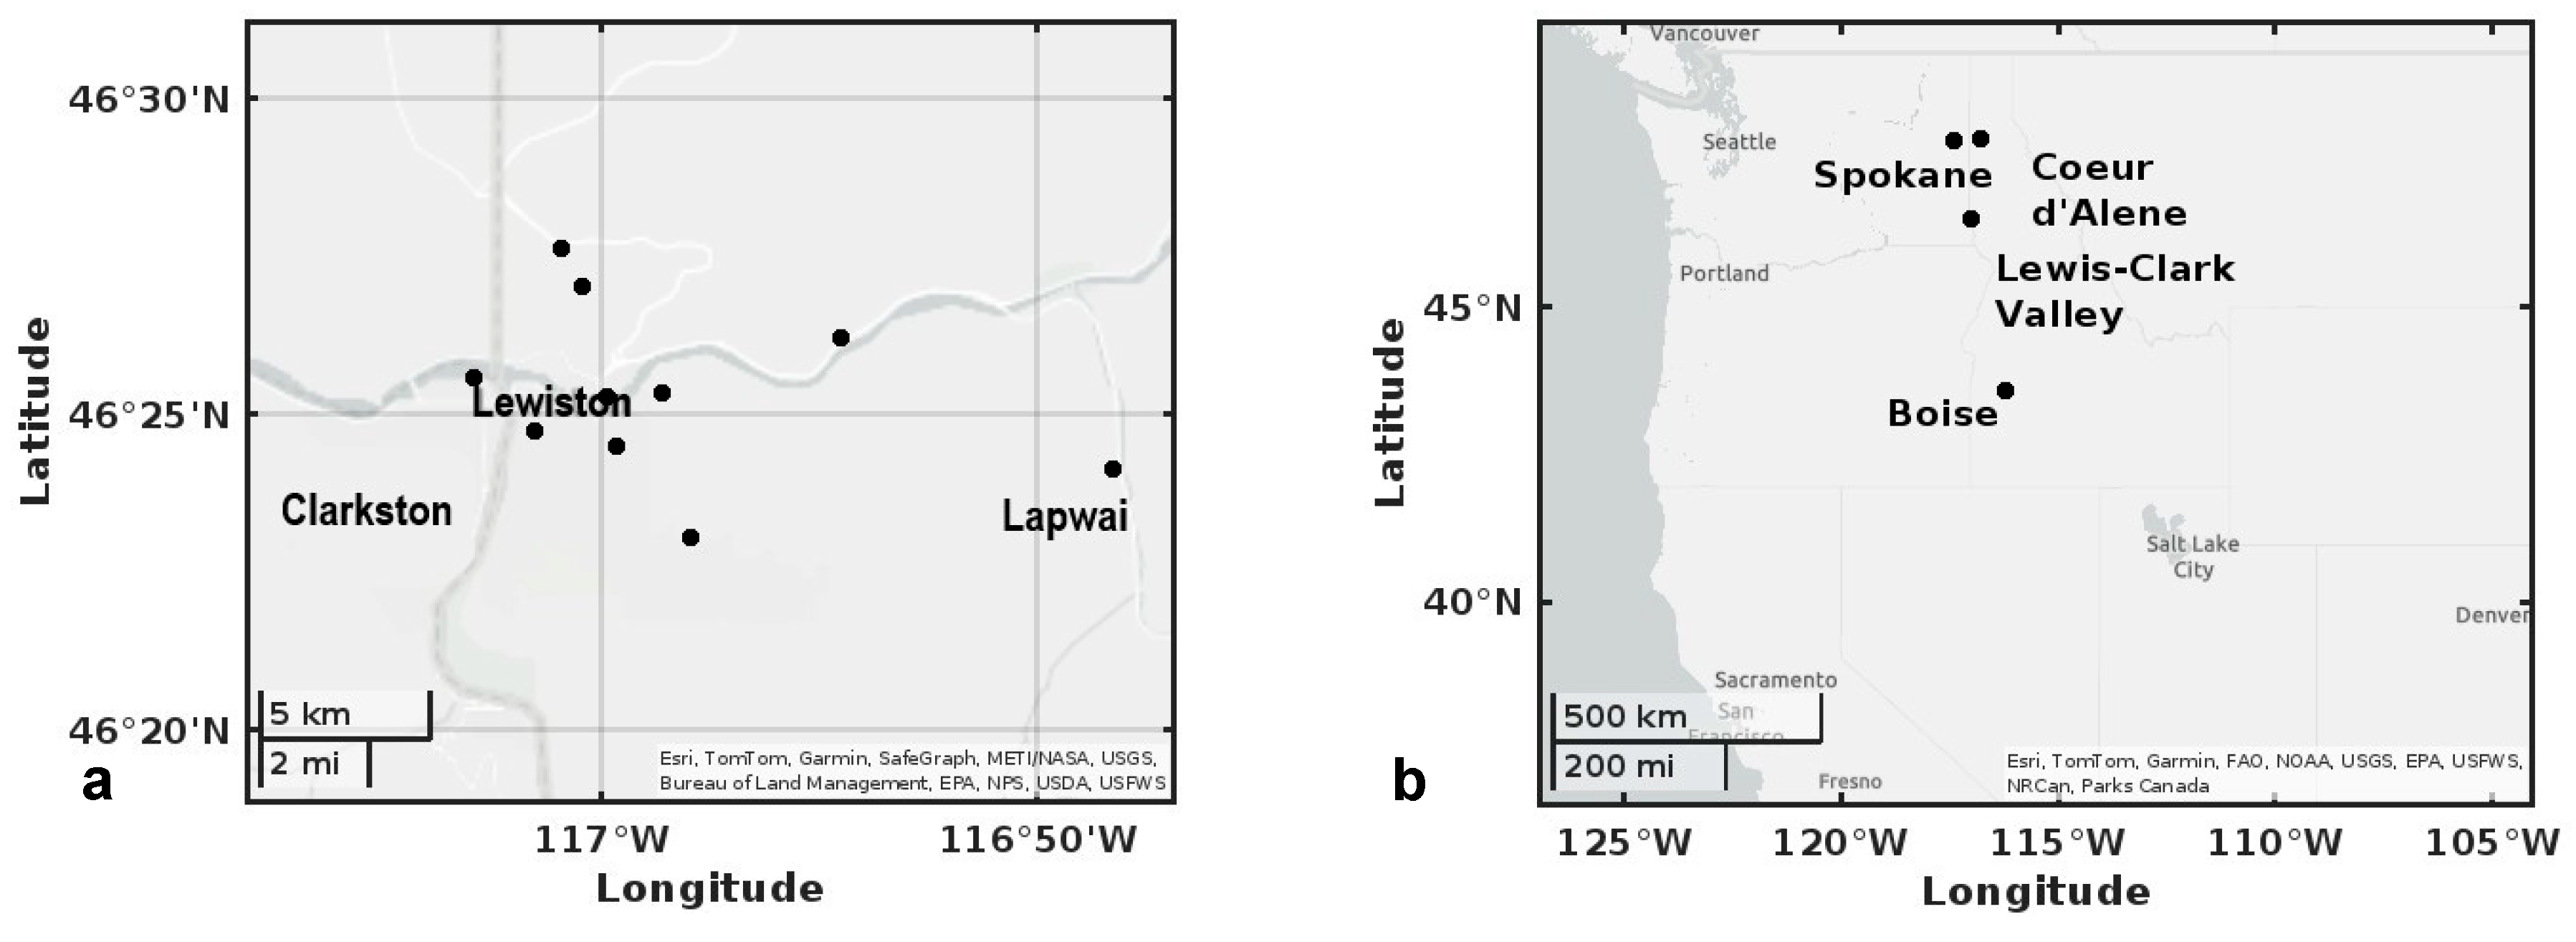
2. Materials and Methods

2.1. Volatile Organic Compound (VOC) Data

VOC concentration data used in this study were obtained previously by the coauthors [29]. In brief, Markes International (Bridgend, UK) dual sorbent tubes (Tenax®TA-Sulficarb) were used for weekly active sampling at 10 sites in the LCV in 2017–2018 (Figure 1a), and Markes Tenax®TA sorbent tubes were used for biweekly-to-monthly passive sampling at LCV and three other cities: Boise, ID, Coeur d’Alene, ID and Spokane, WA in 2018 only (Figure 1b) [29]. Analysis of 50 VOCs using thermal-desorption gas-chromatography mass-spectrometry followed U.S. EPA Methods TO-17 and 325 [29,32,33,34]. Benzene, ethylbenzene and xylenes were analyzed additionally in passive samples, as these uptake rates were available [35]. This dataset of VOCs is available in Scott et al. as Supplement Materials [29]. For this current study, 337 samples from June to early October 2017–2108 were utilized for the smoke and health risk analysis.

2.2. PM2.5 Data

Daily mean particulate matter data (PM2.5) were obtained from the monitoring sites of the Idaho Department of Environmental Quality and/or Washington Department of Ecology through the U.S. EPA Air Quality System [28]. The monitoring sites were matched to the closest VOC sites and are as follows: Lewiston–Sunset Park, Boise–St. Luke’s in Meridian, Coeur d’Alene–Lancaster Road, and Spokane–Augusta Ave (Figure 1b) [28]. PM2.5 data were taken the same day and same hour for comparison with active VOC samples from 2017 to 2018. Passive samples of VOCs were of two-week to monthly duration and were compared to daily mean PM2.5 levels averaged during the respective time period. In addition, the daily mean PM2.5 record from 2000 to 2023 was utilized to observe longer term trends in the LCV [28].
Direct observation of wildfire smoke during grab sampling, as well as observation of PM2.5 levels, were used to designate smoke-impacted samples. For the background observation designation, daily mean PM2.5 was below 25 µg/m3, while biomass burning levels were considered above this threshold during the summer/early fall months (June–October), unless smoke was directly observed. For reference, the regulatory daily 24 h PM2.5 standard is 35 µg/m3, and the annual is 9 µg/m3 [36]. Student t-tests of differences of standard deviation and means (95% confidence level) were performed on VOCs that had at least 20% detection, to determine differences in background versus smoke samples. Correlations between PM2.5 and VOCs were also calculated with both the background (BG) and smoke samples (BB), and tested for significance (95% confidence level) using the critical values for the correlation coefficients.

2.3. Health Risk Calculations

The health risks of exposure to VOCs in smoke were determined by use of U.S. EPA exposure methods [37,38]. This approach used the upper confidence limit (UCL), exposure concentration multiplied by a risk factor for selected compounds. The unit risk factors and risk categories were available through the Integrated Risk Information System [39]. The following equations were used in calculating risk [37]:
R i s k = E C × I U R
where EC is the exposure concentration in μg/m3, calculated by Equation (2),
E C = ( C A × E T × E F × E D ) A T
and IUR is the inhalation unit risk in (μg/m3)−1, or the lifetime risk for an individual exposed to 1 µg/m3 of developing cancer. CA is the measured concentration in µg/m3, which was taken as the UCL or the upper confidence limit (95%) of the chemical, ET is the exposure time (h/day), or 24 h/day (residential), EF is the exposure frequency (days/year), 30 days for smoke and 320 days for background, totaling 350/year (residential), ED is the exposure duration (years), 26 years (residential) or 70 years (lifetime), and AT is the averaging time (h) = 70 years × 365 days/year × 24 h/day = 6 × 10⁵ h (expected lifetime) [38]. For benzene, risk factor = EC (μg/m3) × (7.8 × 10−6 m3/μg), where the upper estimate of IUR is used [39]. For multiple VOCs measured, a cumulative cancer risk was based on the summation of the individual risks.
For non-carcinogenic VOCs, a hazard quotient (HQ) was calculated, based on the inhalation chronic reference concentration (RfC) in (μg/m3), where EC was calculated using ET of 24 h, ED of 30 days for smoke and 335 days for background, and ED of 26 and 70 years for residential and lifetime exposures [37]:
H Q = E C R f C
Specifically, the HQ was used to assess the non-carcinogenic effects from compounds like benzene and toluene. An HQ greater than one indicates that estimated exposure may cause non-carcinogenic health effects [37]. If the HQ is less than one, then non-carcinogenic health effects should not be likely to occur. The hazard index (HI) is the sum of HQs of each compound [37].

3. Results/Discussion

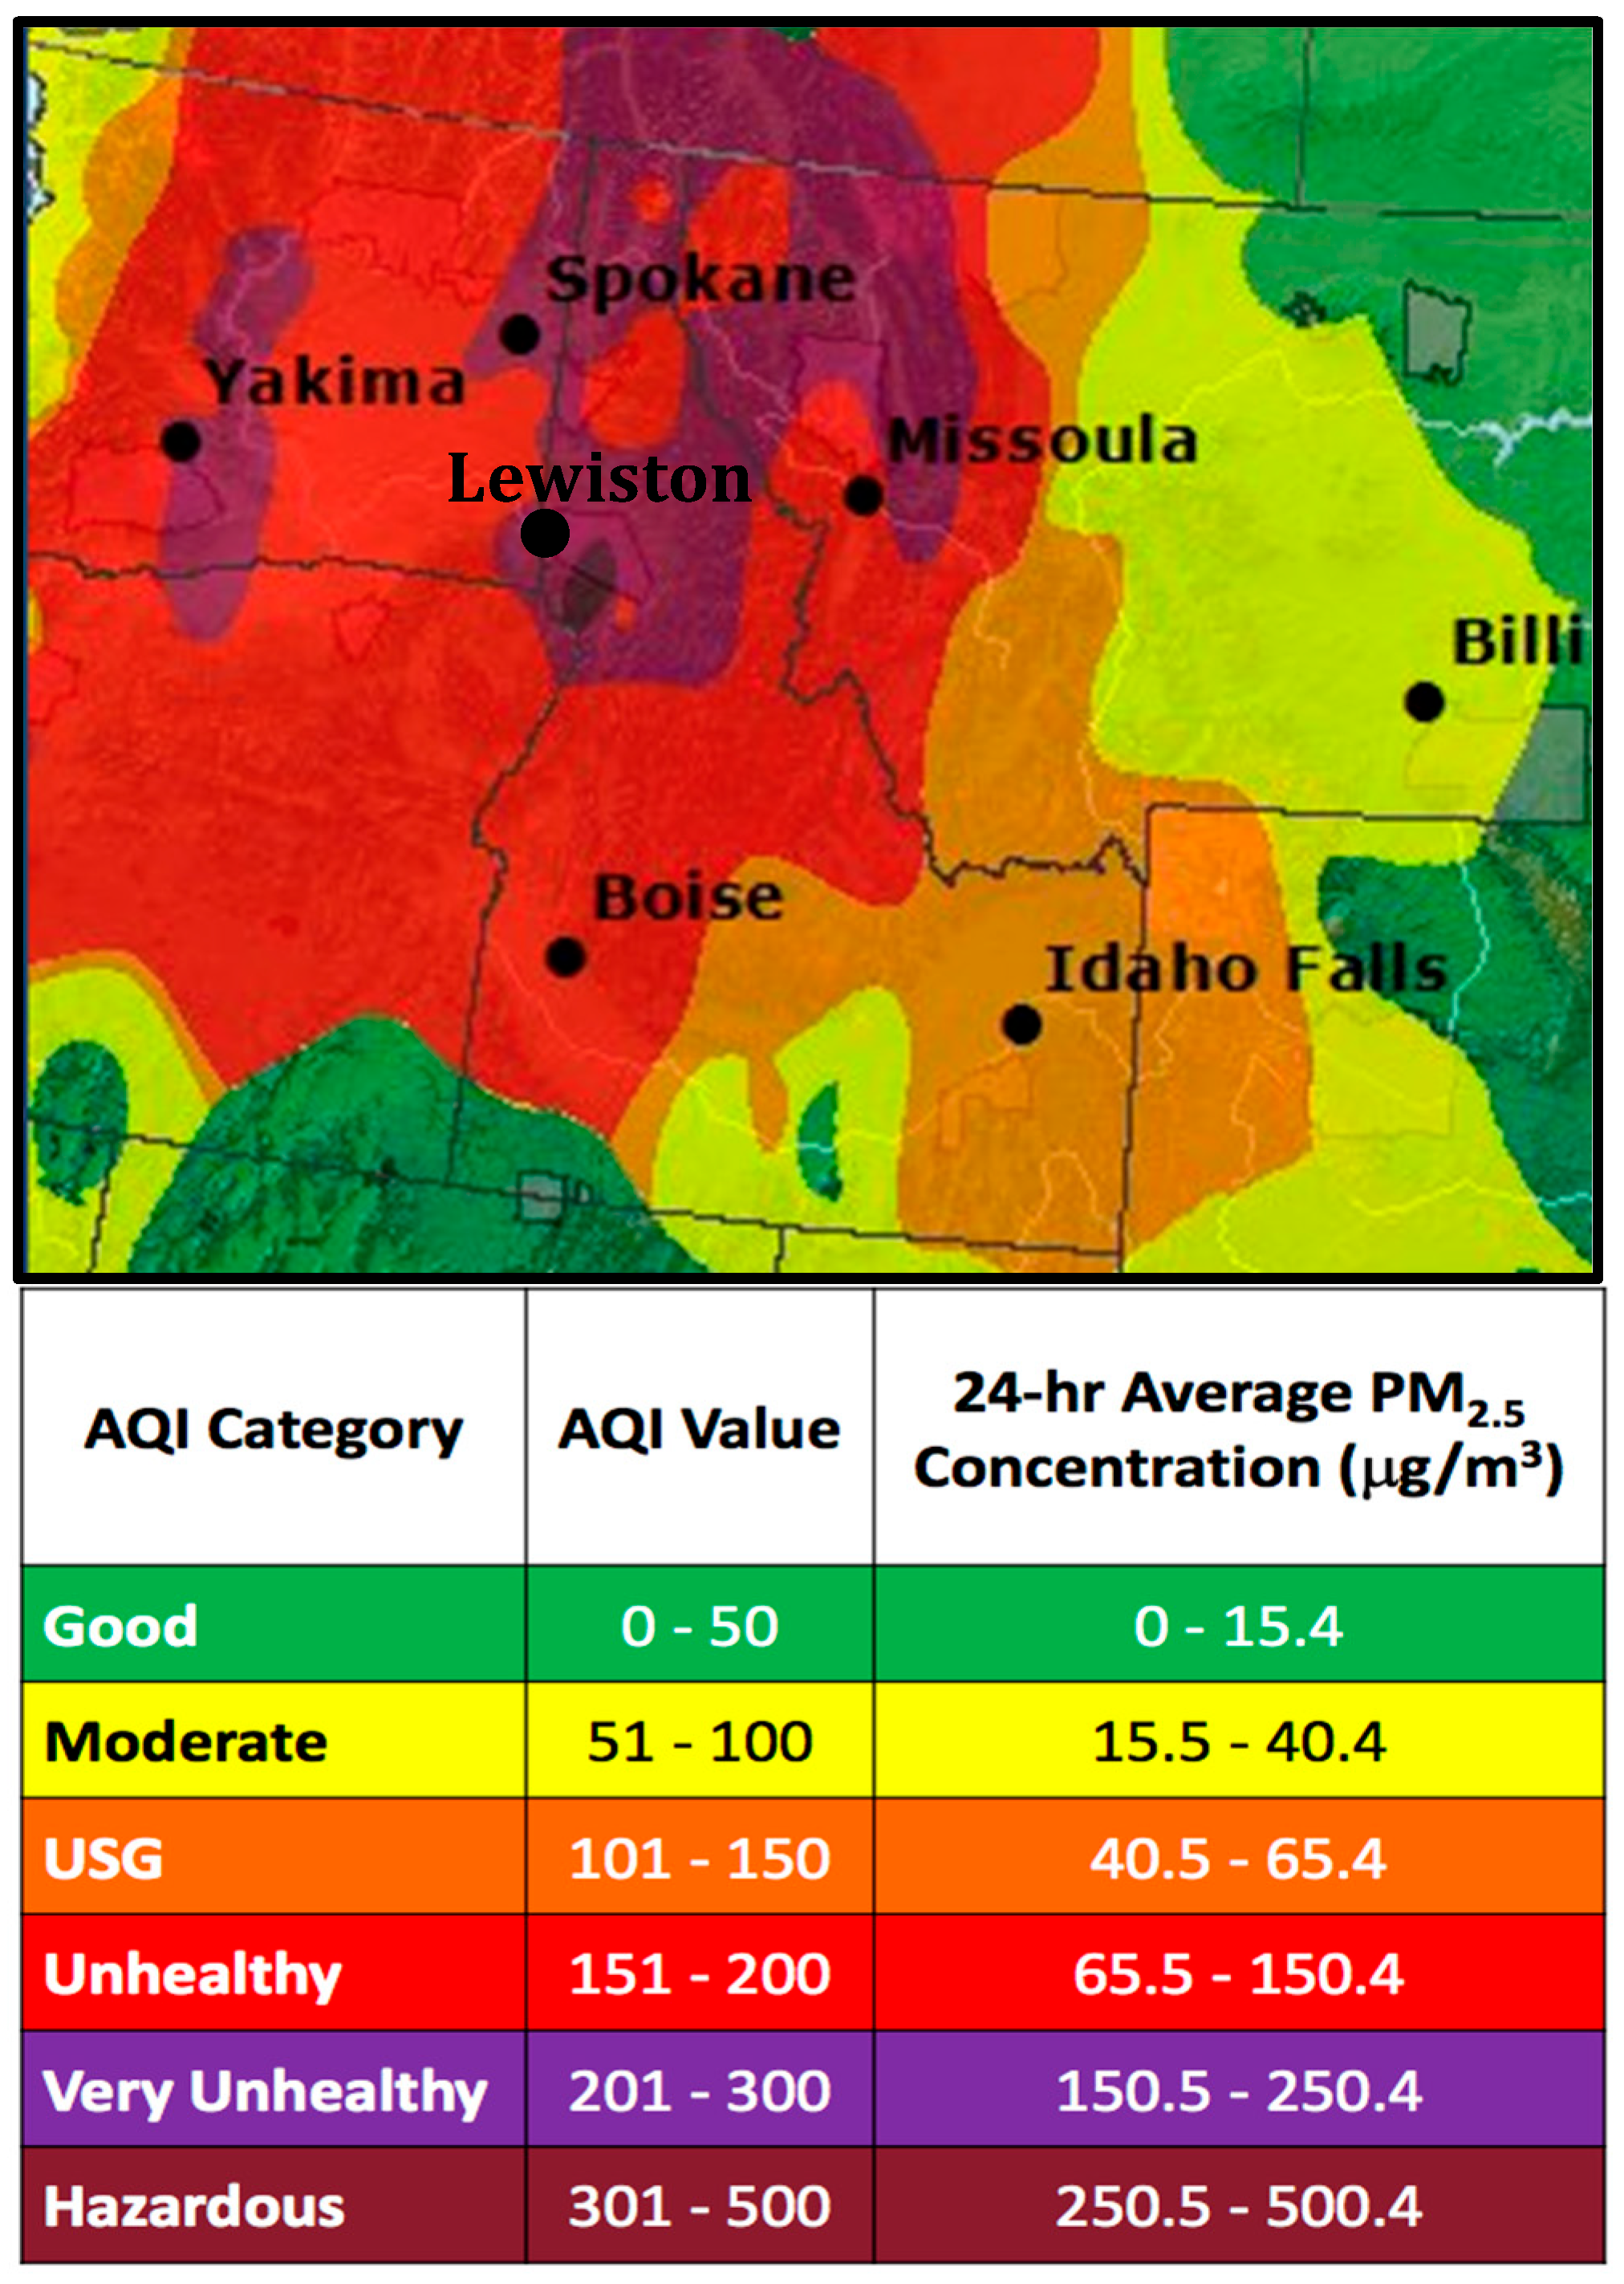
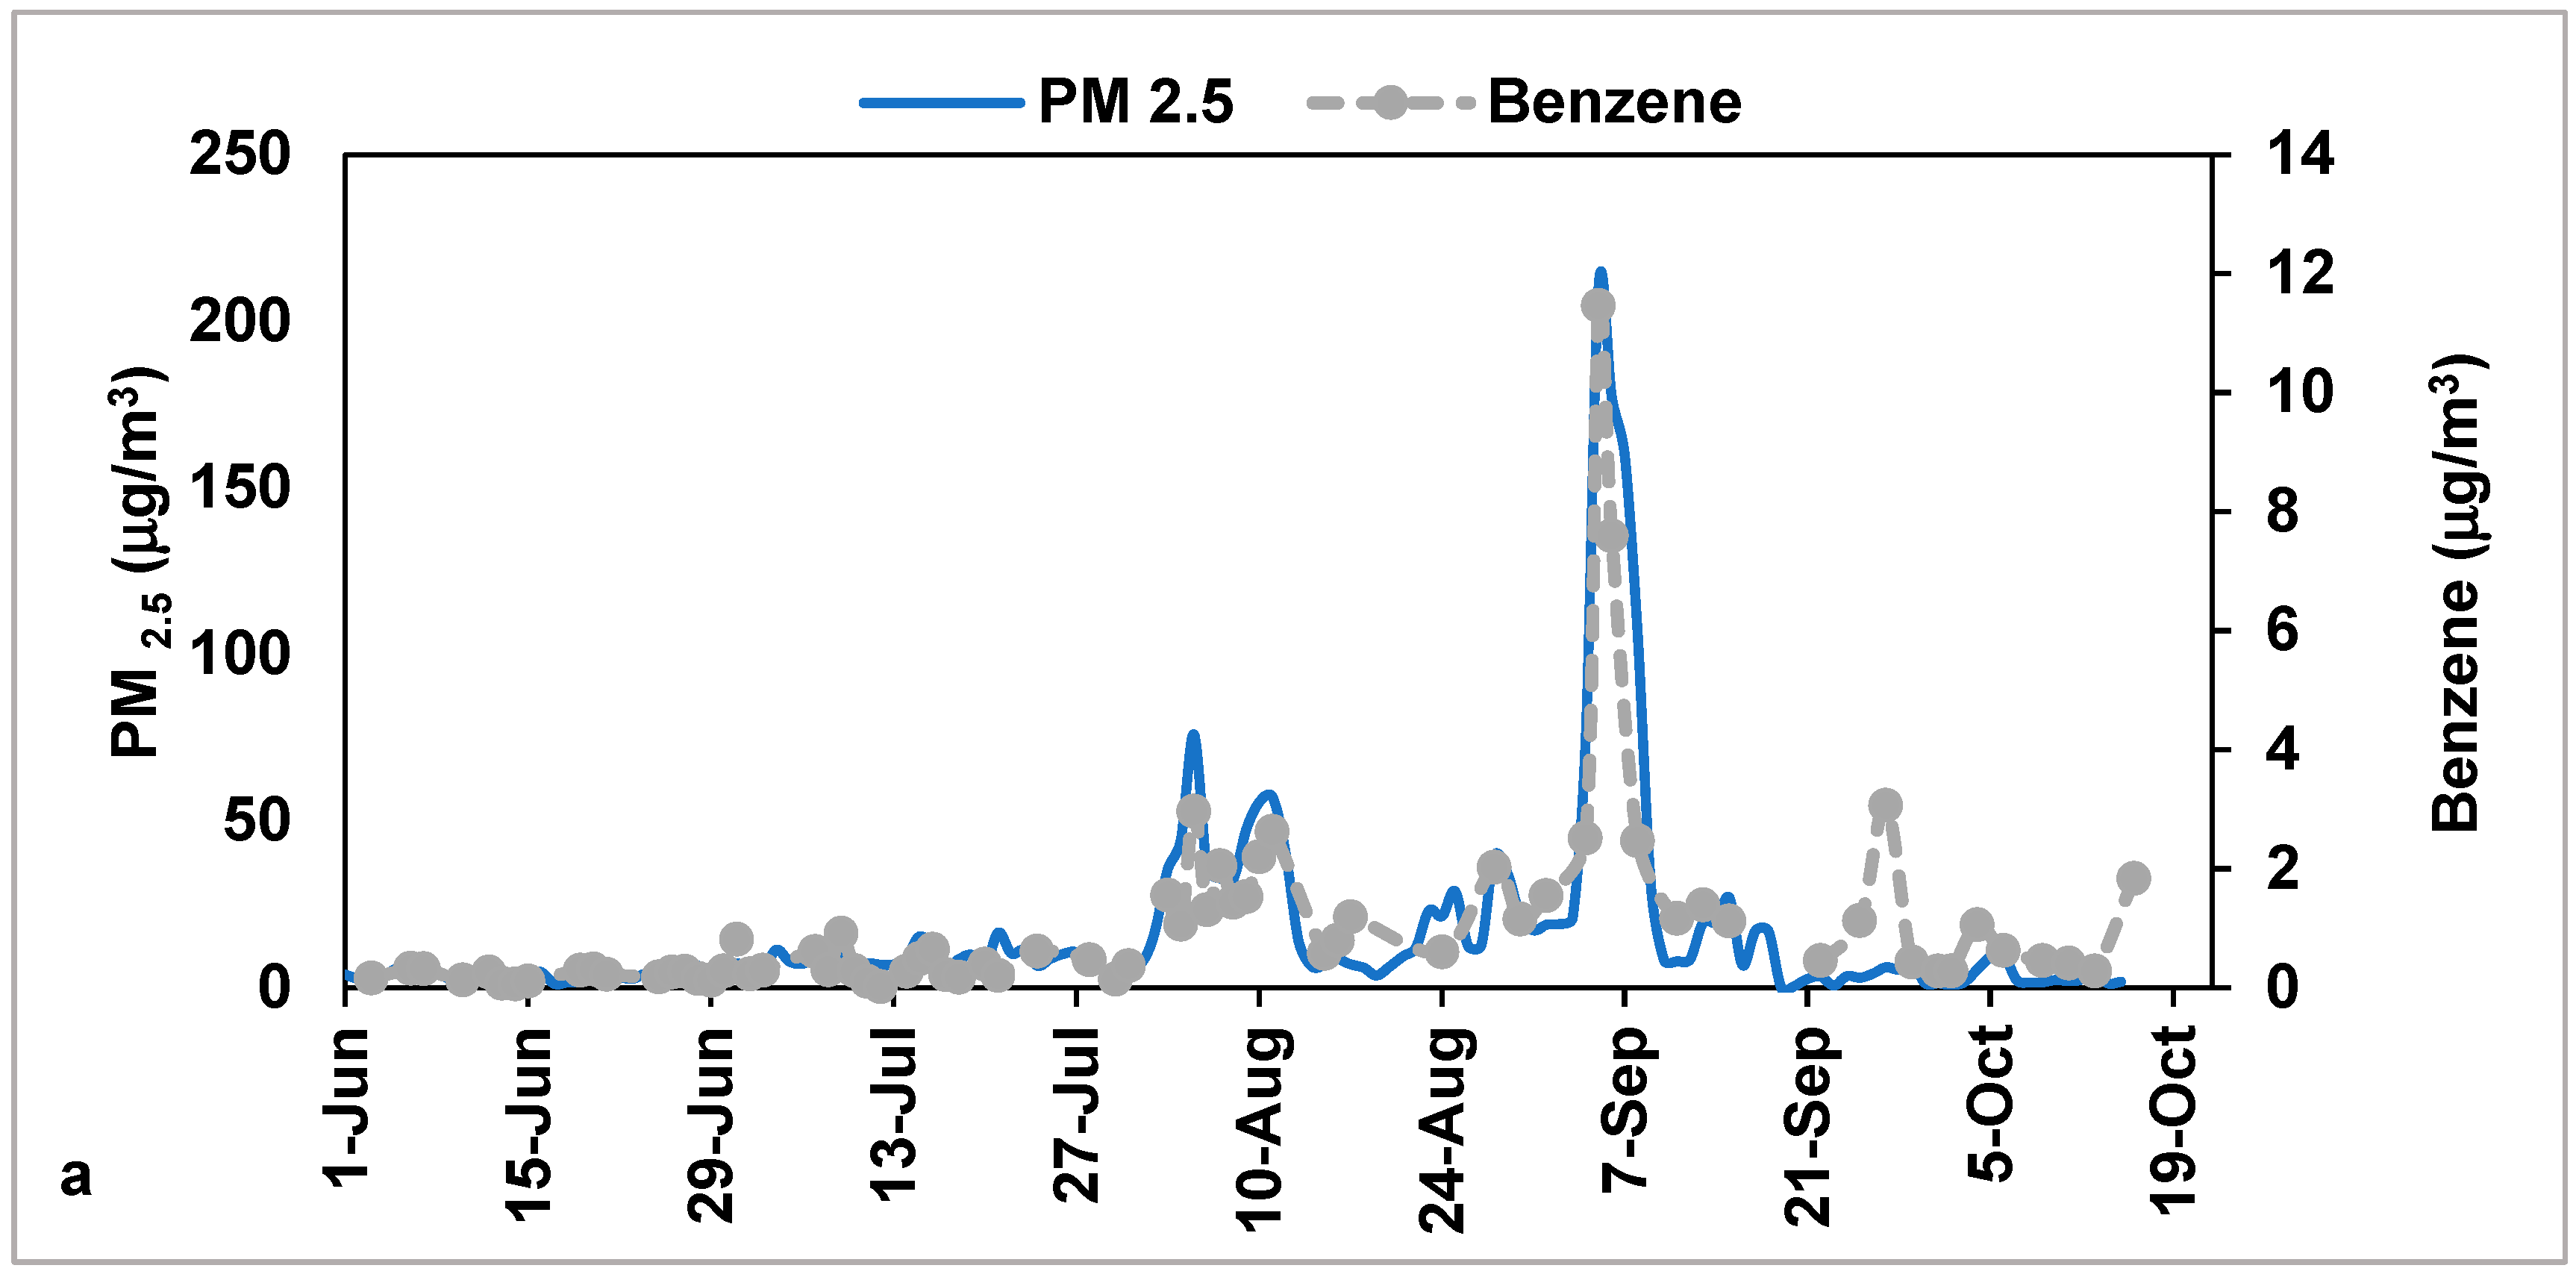
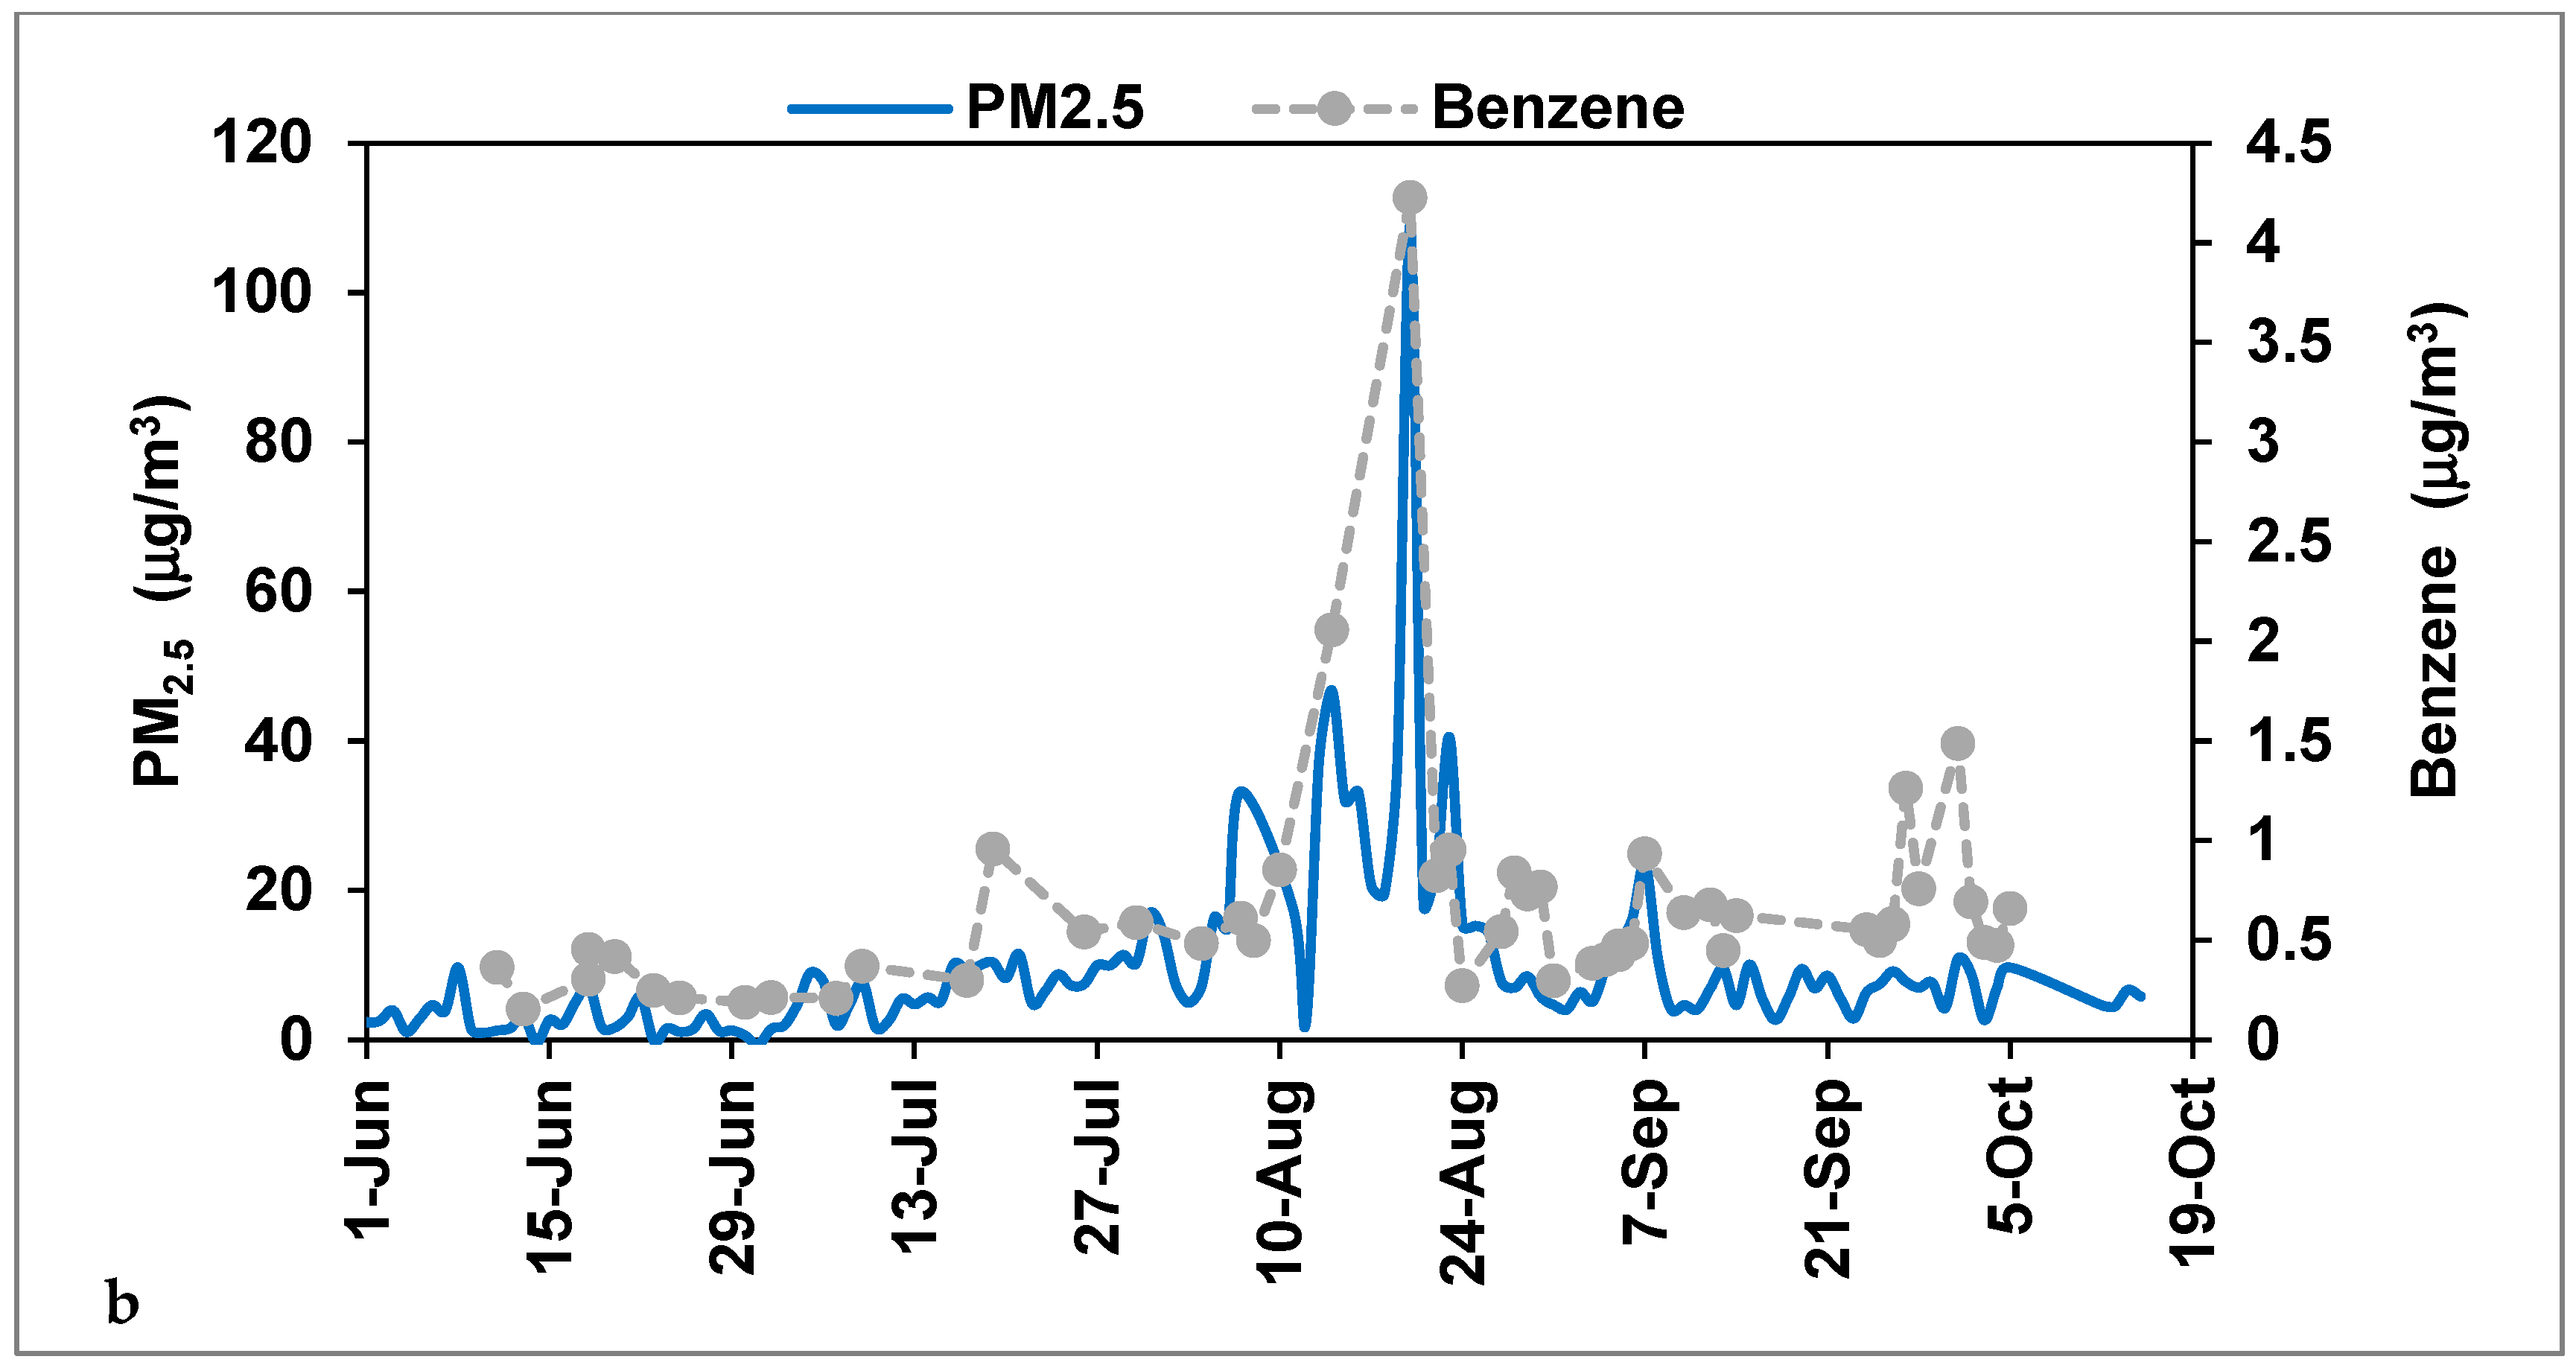
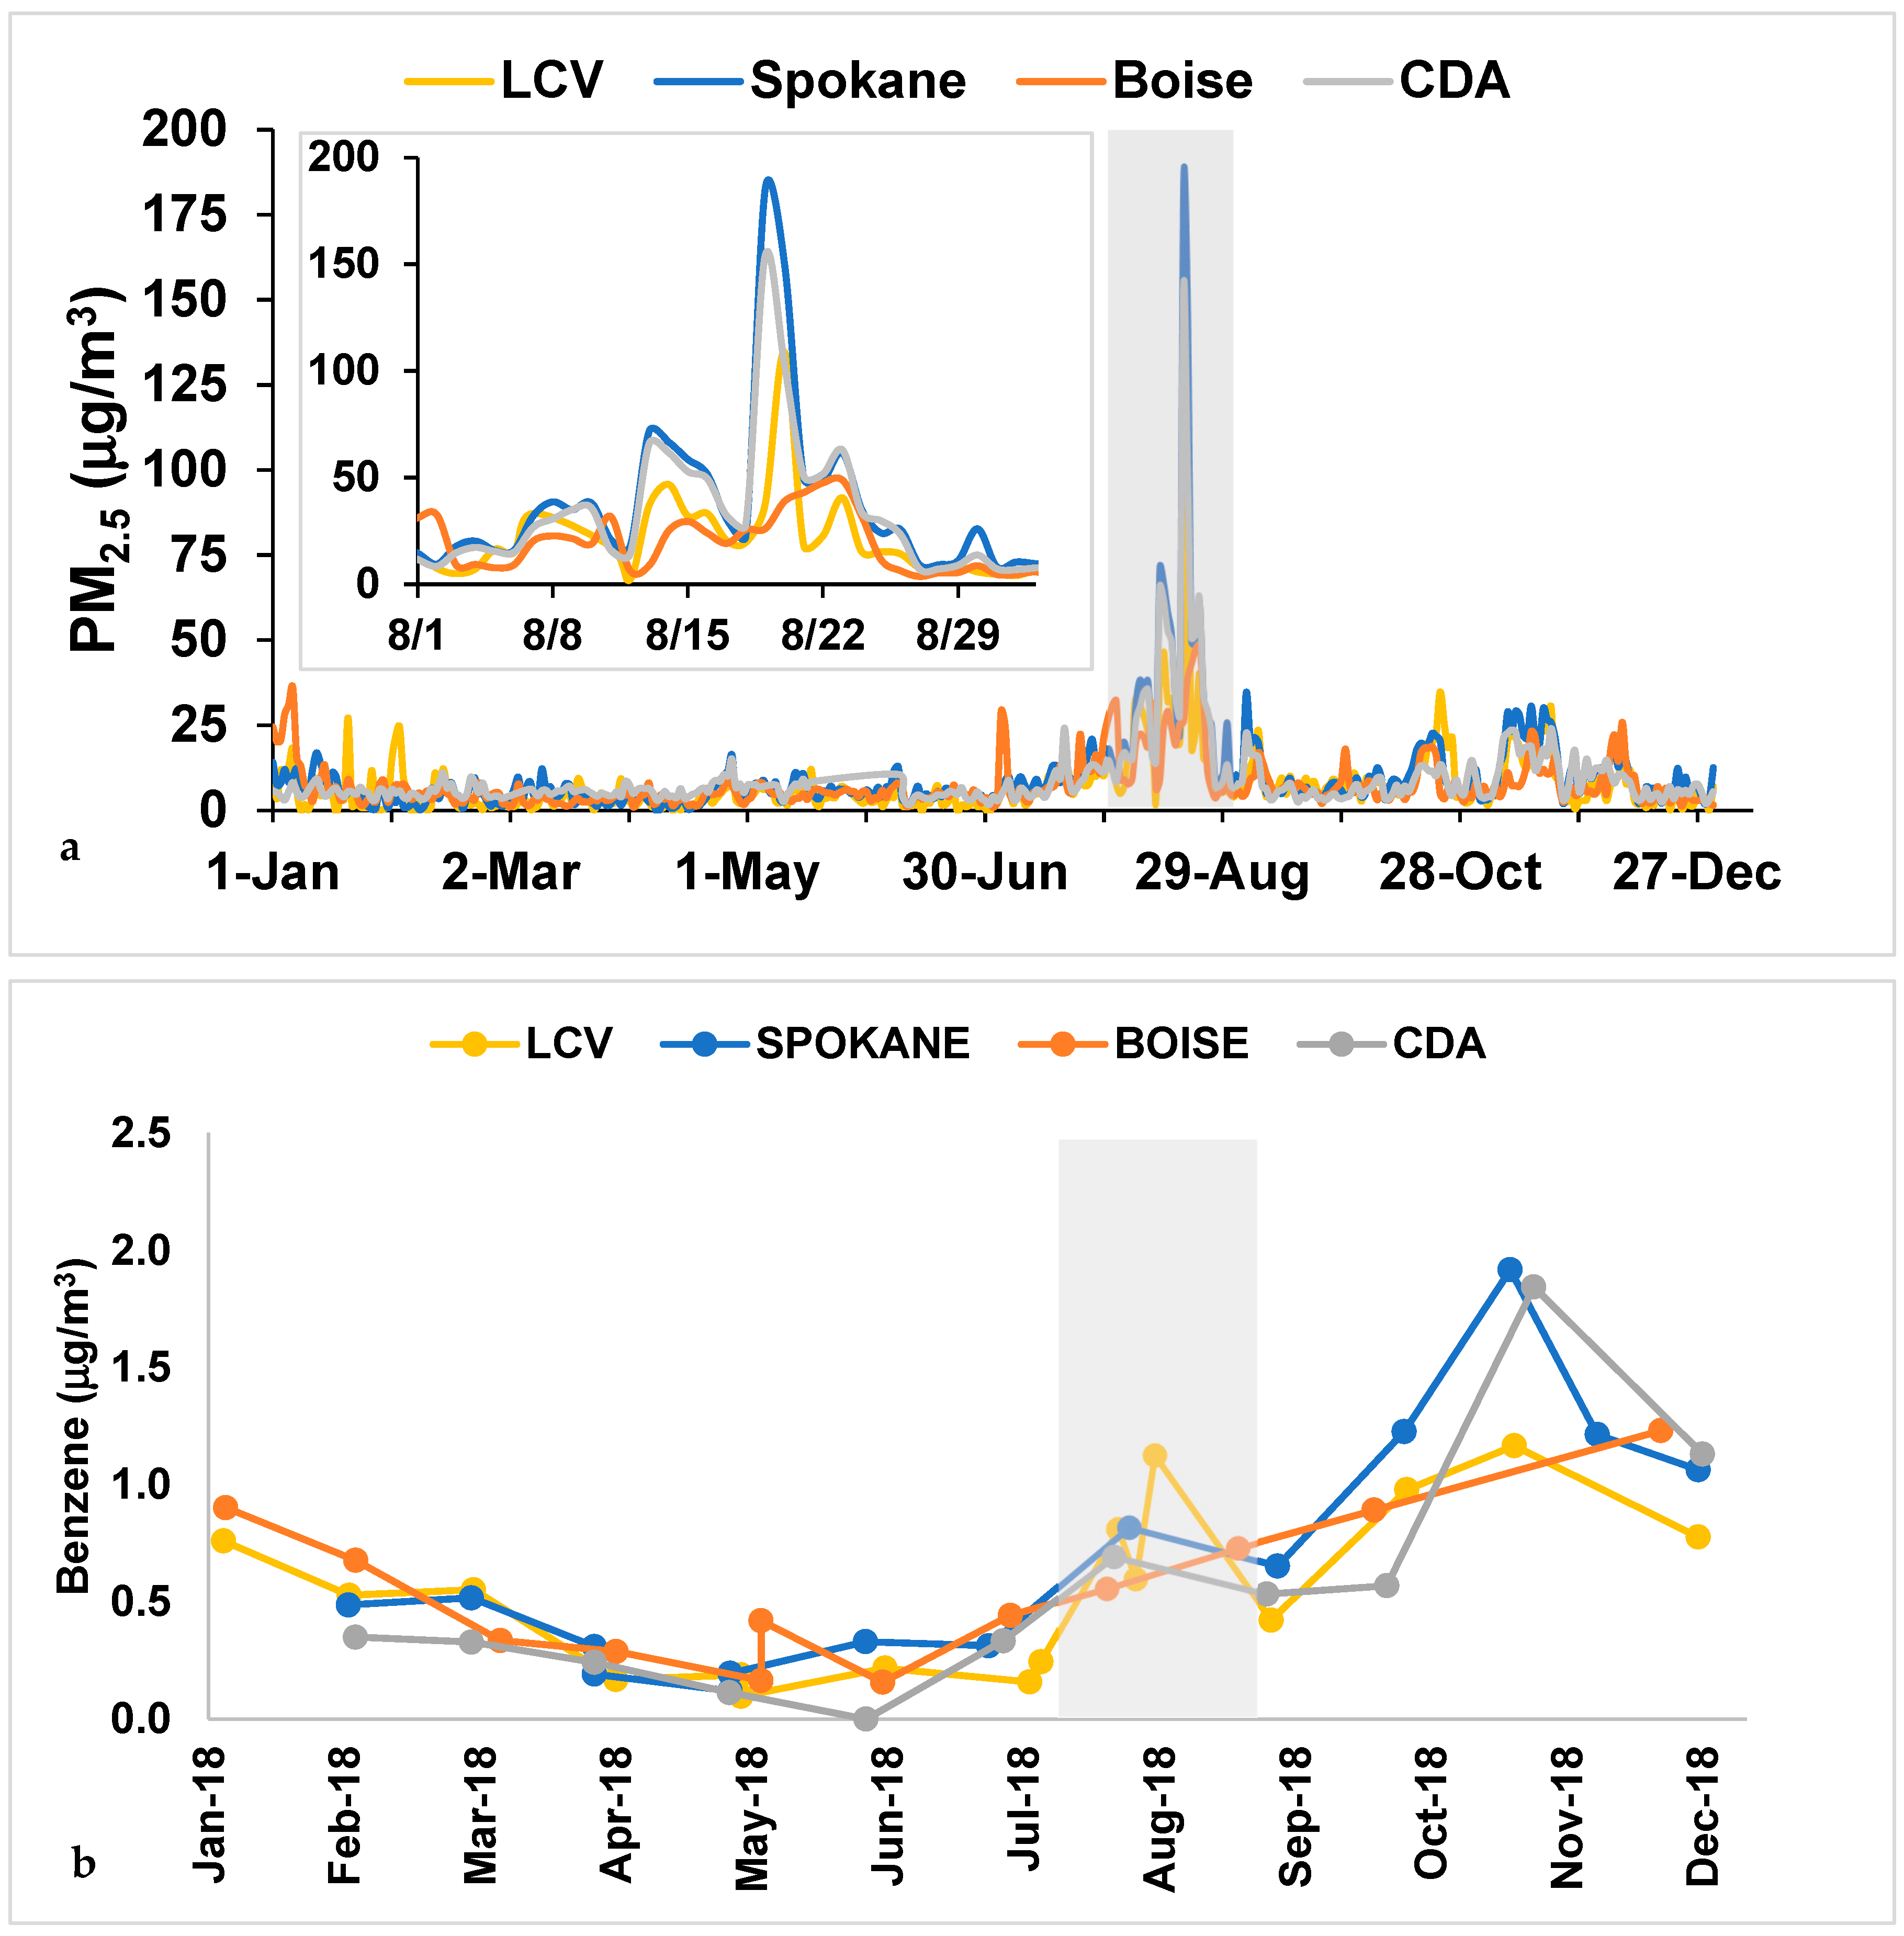
3.1. Observed Smoke Events and PM2.5 Trends

Both in the summers of 2017 and 2018, biomass burning events were observed in the LCV. Air quality was poor, and at times was at the very unhealthy-to-hazardous level in and nearby the LCV. One example is shown on 7 September 2017, in Figure 2, when a severe biomass burning event was taking place in the Northwest U.S. During the two summer seasons of 2017–2018, 245 background samples and 92 smoke samples were taken in the LCV. For longer-term trends outside of this time period, particulate matter was investigated. Figure 3 demonstrates PM2.5 changes over the past 23 years in the LCV [28]. The horizontal line is the 24-h average air-quality standard of 35 µg/m3 [36]. There is an increasing trend, with a slope of 0.10 µg m−3/yr during this time. This value is comparable to the 0.21 µg m−3/yr that McClure and Jaffe reported for the Northwest [17]. From 2012 to 2023, there were eight years that had summer spikes of PM2.5 > 35 µg/m3, compared to 2000–2011, where only 2006 had a small spike above this level.

3.2. Concentrations of VOCs and PM2.5 in Wildfire Smoke in LCV

The most concentrated and/or most detected VOCs of those measured during the June–October periods are shown in Table 1. Benzene, toluene, ethylbenzene and m,p-xylene (BTEX) were all elevated in smoke compared to the background samples, with 2017 means of 2.14, 2.98, 0.42, and 1.50 µg/m3 and 2018 means of 1.42, 1.51, 0.21, and 0.54 µg/m3, respectively (Table 1). Other elevated hydrocarbons included naphthalene, p-cymene, and phenol (Table 1).
Although halogenated air toxics were measured, these were not statistically increased in wildfire smoke and/or were not believed to come from wildfire sources, as they are anthropogenic. The 2017 means of VOCs in smoke samples were higher compared to 2018, and this was also seen in PM2.5 levels, indicating a more severe fire season in the LCV (Table 1, Figure 4). Benzene time-series are plotted with PM2.5 for each year, in Figure 4. Two large wildfire smoke events, as evidence by the maximum benzene and PM2.5 levels in Figure 4, peaked on 5 September 2017 (11.46 µg/m3 benzene, 211 µg/m3 PM2.5) and 20 August 2018 (4.22 µg/m3 benzene, 109 µg/m3 PM2.5).
Benzene and PM2.5 behaved very similarly to each other during the biomass-burning smoke episodes. This relationship supports the fact that the benzene increases were a result of the wildfire smoke. BTEX distributions for background and wildfire smoke or biomass burning samples are shown in Figure 5. All species were elevated in smoke samples, with 2017 showing higher means than 2018, and all the differences from background were statistically significant, except toluene in 2017. Local emissions of benzene (and BTEX) including automobiles and industry, were captured in background samples, but there was a five-fold increase in the 2017 mean values of benzene in smoke (biomass burning) vs. background samples (Table 1). Sources of other VOCs in the LCV, such as trichloromethane and dimethyl sulfide, were appointed to the paper mill, and still others to secondary formation, traffic and biogenic sources [29,30]. However, an in-depth analysis of sources other than biomass burning is not the focus here.
Several species were correlated with PM2.5 in the smoke samples versus the background (Table 2). Benzene and PM2.5 were correlated in smoke samples with R2 value of 0.69, as shown in Figure 6a and Table 2. In fact, the slope of benzene to PM2.5 was 0.024 µg/m3 benzene: µg/m3 PM2.5 or 7.5 ppb benzene: 1000 µg/m3 PM2.5. This was comparable to the ratios of benzene to PM1 of 9.2 ppb benzene : 1000 µg/m3 PM2.5 found in the WE-CAN airborne study [13]. The non-benzene BTEX compounds did not correlate as well to PM2.5, with R2 values of 0.39, 0.29, and 0.08, respectively, as they were elevated on both background and smoky days (Table 2). This suggests multiple sources, and correlations may be related to the particulate matter from industrial sources and traffic. In addition, naphthalene and p-cymene were moderately correlated to PM2.5 with R2 of 0.56 and 0.54 (Table 2). Naphthalene is a known combustion byproduct and p-cymene is a monoterpene of biogenic origin. Dimethyl disulfide (DMDS) was not observed in each sample, and its R2 with PM2.5 was low (0.04). Dimethyl sulfide (DMS) was observed at high levels in both background and smoke events, due to the location of a local paper mill in Lewiston [29]. DMS did not have a correlation with PM2.5 (0), even though it has been shown to be emitted from biomass burning [41]. It is likely that the wildfire smoke was aged and DMS and DMDS decayed in this smoke before it got to the region, since the lifetime of these compounds are a day or less.
BTEX species were also correlated to each other in smoke samples. Benzene and toluene correlation is shown in Figure 6b, with R2 of 0.76 for smoke samples, and R2 reduced to 0.31 for background samples. The slope was higher for biomass burning (BB) samples as well, showing benzene levels increasing in smoke rather than without. Smoke (BB) samples were expected to have a higher benzene/toluene (B/T) ratio compared to traffic emissions, and aged samples from either source should also have higher B/T ratios compared to samples closer to source, as toluene will react in the atmosphere more quickly with OH radicals, one of the main sinks [42]. The B/T (mole/mole) ratio was on average 1.18 +/−0.70 (range 0.12–3.27) in BB samples, and 0.94 ± 1.02 (range 0.02–11.04) in BG samples. These values are consistent with other studies reporting B/T ratios greater than one for smoke samples [43,44,45] and less than one for traffic [44].

3.3. Passive-Sampling Comparison between Cities

In order to better understand the long-term exposure of these compounds (versus a compilation of grab samples), passive samplers were used at four locations, with a sample taken for 2–4 weeks (Figure 1b). Only benzene, toluene and xylene were examined, as these compounds had available uptake rates on the Tenax®TA sorbent when previously published [29,35]. These results are shown in Figure 7b. Smoke influence was present in August 2018 at all locations, consistent with the grab-sampling results of LCV.
The whole region experienced this smoke event, with highest levels of PM2.5 in Spokane (185 µg/m3) and Coeur d’Alene (CDA) (154 µg/m3) on 19 August 2018. LCV peaked the next day at 109 µg/m3 and Boise did not have as much smoke, evidenced by PM2.5 of 43 µg/m3 (Figure 7a). Benzene levels also had a peak in August 2018, coinciding with the smoke event, but had a second and higher peak in November in the northern sites (LCV, Spokane and CDA) (Figure 7b). This could be from the use of wood burning stoves and/or cold weather inversions, as the PM2.5 also has a small increase during that time. In general, the Northwest region experienced similar values of PM2.5, and benzene levels ranged from 0.2–1.1 µg/m3, which were slightly lower than the active samples (Figure 7b). This was likely due to the passive monthly averaging vs. the short-term active sampling.

3.4. Health Risk Assessment

Of the compounds measured, benzene was the biggest contribution to health risk (due to its carcinogenicity) aside from PM2.5 in wildfire smoke. The inhalation unit risk (IUR) for benzene of 7.8 × 10⁻⁶ (µg/m3)−1 was used in this analysis to err on the side of protection [39]. This corresponds to the risk of cancer when exposed to 1 µg/m3 of benzene throughout a lifetime. This level of benzene (1 µg/m3) is representative in the U.S. of an associated health risk of 1–10 × 10−6, according to the air toxic inventory and ambient air monitoring [46]. The background mean in this study was 0.26 and 0.30 µg/m3 for 2017 and 2018, respectively. The biomass burning event grab-sampling means for LCV was 2.62 µg/m3 and 1.73 µg/m3 for 2017 and 2018, about ten and six times that of the background, respectively. The corresponding cancer risk factors were 3 × 10⁻⁶ and 7 × 10⁻⁶ for residential and lifetime scenarios for benzene alone, and 5 × 10⁻⁶ and 13 × 10−6 when including trichloromethane (Table 3). Trichloromethane (chloroform) is not associated with wildfires, but with the paper mill emissions in this region [29]. Non-cancer risk was calculated for the smoke and background exposures for all VOCs with an available chronic inhalation reference concentration (RfC) [39]. The resulting HQ values were under 1, with highest values for benzene and naphthalene of about 0.03 each, and HI of 0.08 (Table 3). This suggests there was a low probability of a non-cancer health event occurring. Each VOC has specific target organs, and the results may or may not be summative, as this is beyond the scope of our analysis.
When considering the monthly passive samples obtained, the benzene range of 0.22–0.56 µg/m3 translates to a cancer risk of 2 × 10⁻⁶ and 5 × 10⁻⁶ for residential and lifetime scenarios in the LCV (Table 4). This was slightly less than the analysis of the grab sampling, and the sampling size was smaller at n = 13 (monthly samples). The other cities sampled were about the same risk, with Spokane having 3 × 10⁻⁶ and 7 × 10⁻⁶ cancer risk (residential, lifetime), and Boise and Coeur d’Alene (CDA) both with 2 × 10⁻⁶ residential cancer risk and 6 × 10⁻⁶ and 7 × 10⁻⁶ lifetime cancer risk, respectively (Table 4). The HI was about the same for all of the areas, ranging from 0.02 to 0.03 for lifetime exposure to benzene.
The health implication found was that wildfire smoke events increase the lifetime cancer risk to the community by up to seven extra cancers per million in the LCV, and this is similar to surrounding areas in the Northwest.
Although the health risk due to PM2.5 is a bit more complex, a 2.8% increase in mortality for every 10 µg/m3 increase in PM2.5 was estimated for short-term exposures [24]. For the smoke events observed in this study, increases of up to 200 µg/m3 would imply a 56% increase in mortality associated with such events. While this seems large, it warrants epidemiological studies to further study the severity of such events.

3.5. Comparison with Previous Works

The co-authors’ earlier health risk assessment in the LCV (due to local pollution sources) showed cancer risk from VOCs to be in the range of 2–11 extra cancers per million [29]. The current analysis confirms that, with 2–13 extra cancers per million using the background and smoke criteria versus aggregating the VOCs without this distinction. Miller et al. [26] studied benzene and other VOCs in 2019 emissions in the LCV, as well as in Boise and Spokane, with a cancer risk of only one extra cancer per million due to benzene, since 2019 had much less smoke impact than in 2017–2018, studied here. Another study in the region was closer to the wildfires themselves, and this estimated cancer risk to be 1–19 extra cancers per million, due to benzene alone, which again, is comparable [45]. Few other studies have focused on VOCs in wildfire smoke and assessed cancer risk. O’Dell et al. [13] used ratios of benzene and other air toxics with PM2.5 at higher altitude, to estimate risk at ground levels, in the range of 2–10 extra cancers per million in Idaho/Eastern Washington during 2018. This was comparable to the present study. Navarro et al. [47] used the benzene-to-PM1 ratios observed by O’Dell et al. [13] to estimate exposure concentrations of fire fighters in the Western U.S. The ratio of Benzene to PM2.5 found in this study was 7.5 ppb:1000 µg/m3 compared to 9.2 ppb:1000 µg/m3 [13,47]. The benzene levels measured by Navarro et al. [47] on the front lines were much higher than in the communities, and these were closer to levels observed by Dickinson et al. [45], which were also close to the fires. Jin et al. [16] and Wang et al. [48] observed benzene to be about 1 µg/m3 in wildfire smoke. These results and others are summarized in Table 5. In addition to the levels of VOCs, PM2.5 trends over time in the LCV of 0.10 µg m−3/yr are in the range of McClure and Jaffe’s analysis of the Northwest U.S. increases of 0.21 ± 0.12 µg m−3/yr [17].

3.6. Limitations

The lifetime risk for increased benzene exposure due to wildfire smoke was elevated for LCV residents. However, acute and sub-chronic problems may occur as a result of wildfire smoke. This analysis did not consider the PM2.5 health effects, which can also contribute to illness. In addition, these were calculated risks of cancer and non-cancer events, due to increased air toxics during wildfire smoke episodes. There are many other potential causes of cancer, and this study only addressed the air toxics that were measured. Not all mass of smoke was accounted for in the sampling methods. Thus, this is likely an underestimate of the total health risk via all exposures and mechanisms.
Uncertainties were estimated at 10% for the original VOC measurements, as well as using the upper confidence limit (UCL) in the risk calculations for the exposure concentration calculations. The risk analysis used a value for IUR which was the upper limit (7.8 × 10⁻⁶ (µg/m3)−1, where the lower limit was reported as 2.2 × 10⁻⁶ (µg/m3)−1, about a third of the value used in this study [40].

4. Conclusions

This study focused on the impact of wildfire smoke on VOCs in a small metropolitan, intermountain valley in the Western U.S. and surrounding cities from 2017 to 2018. Wildfire smoke events occurred in the Lewis–Clark Valley (LCV) in September 2017 and August 2018, which elevated PM2.5 and VOCs well above the background levels.
The key findings were the following:
  • Wildfire smoke events lasted up to 30 days and PM2.5 daily exposures spiked up to 200 µg/m3.
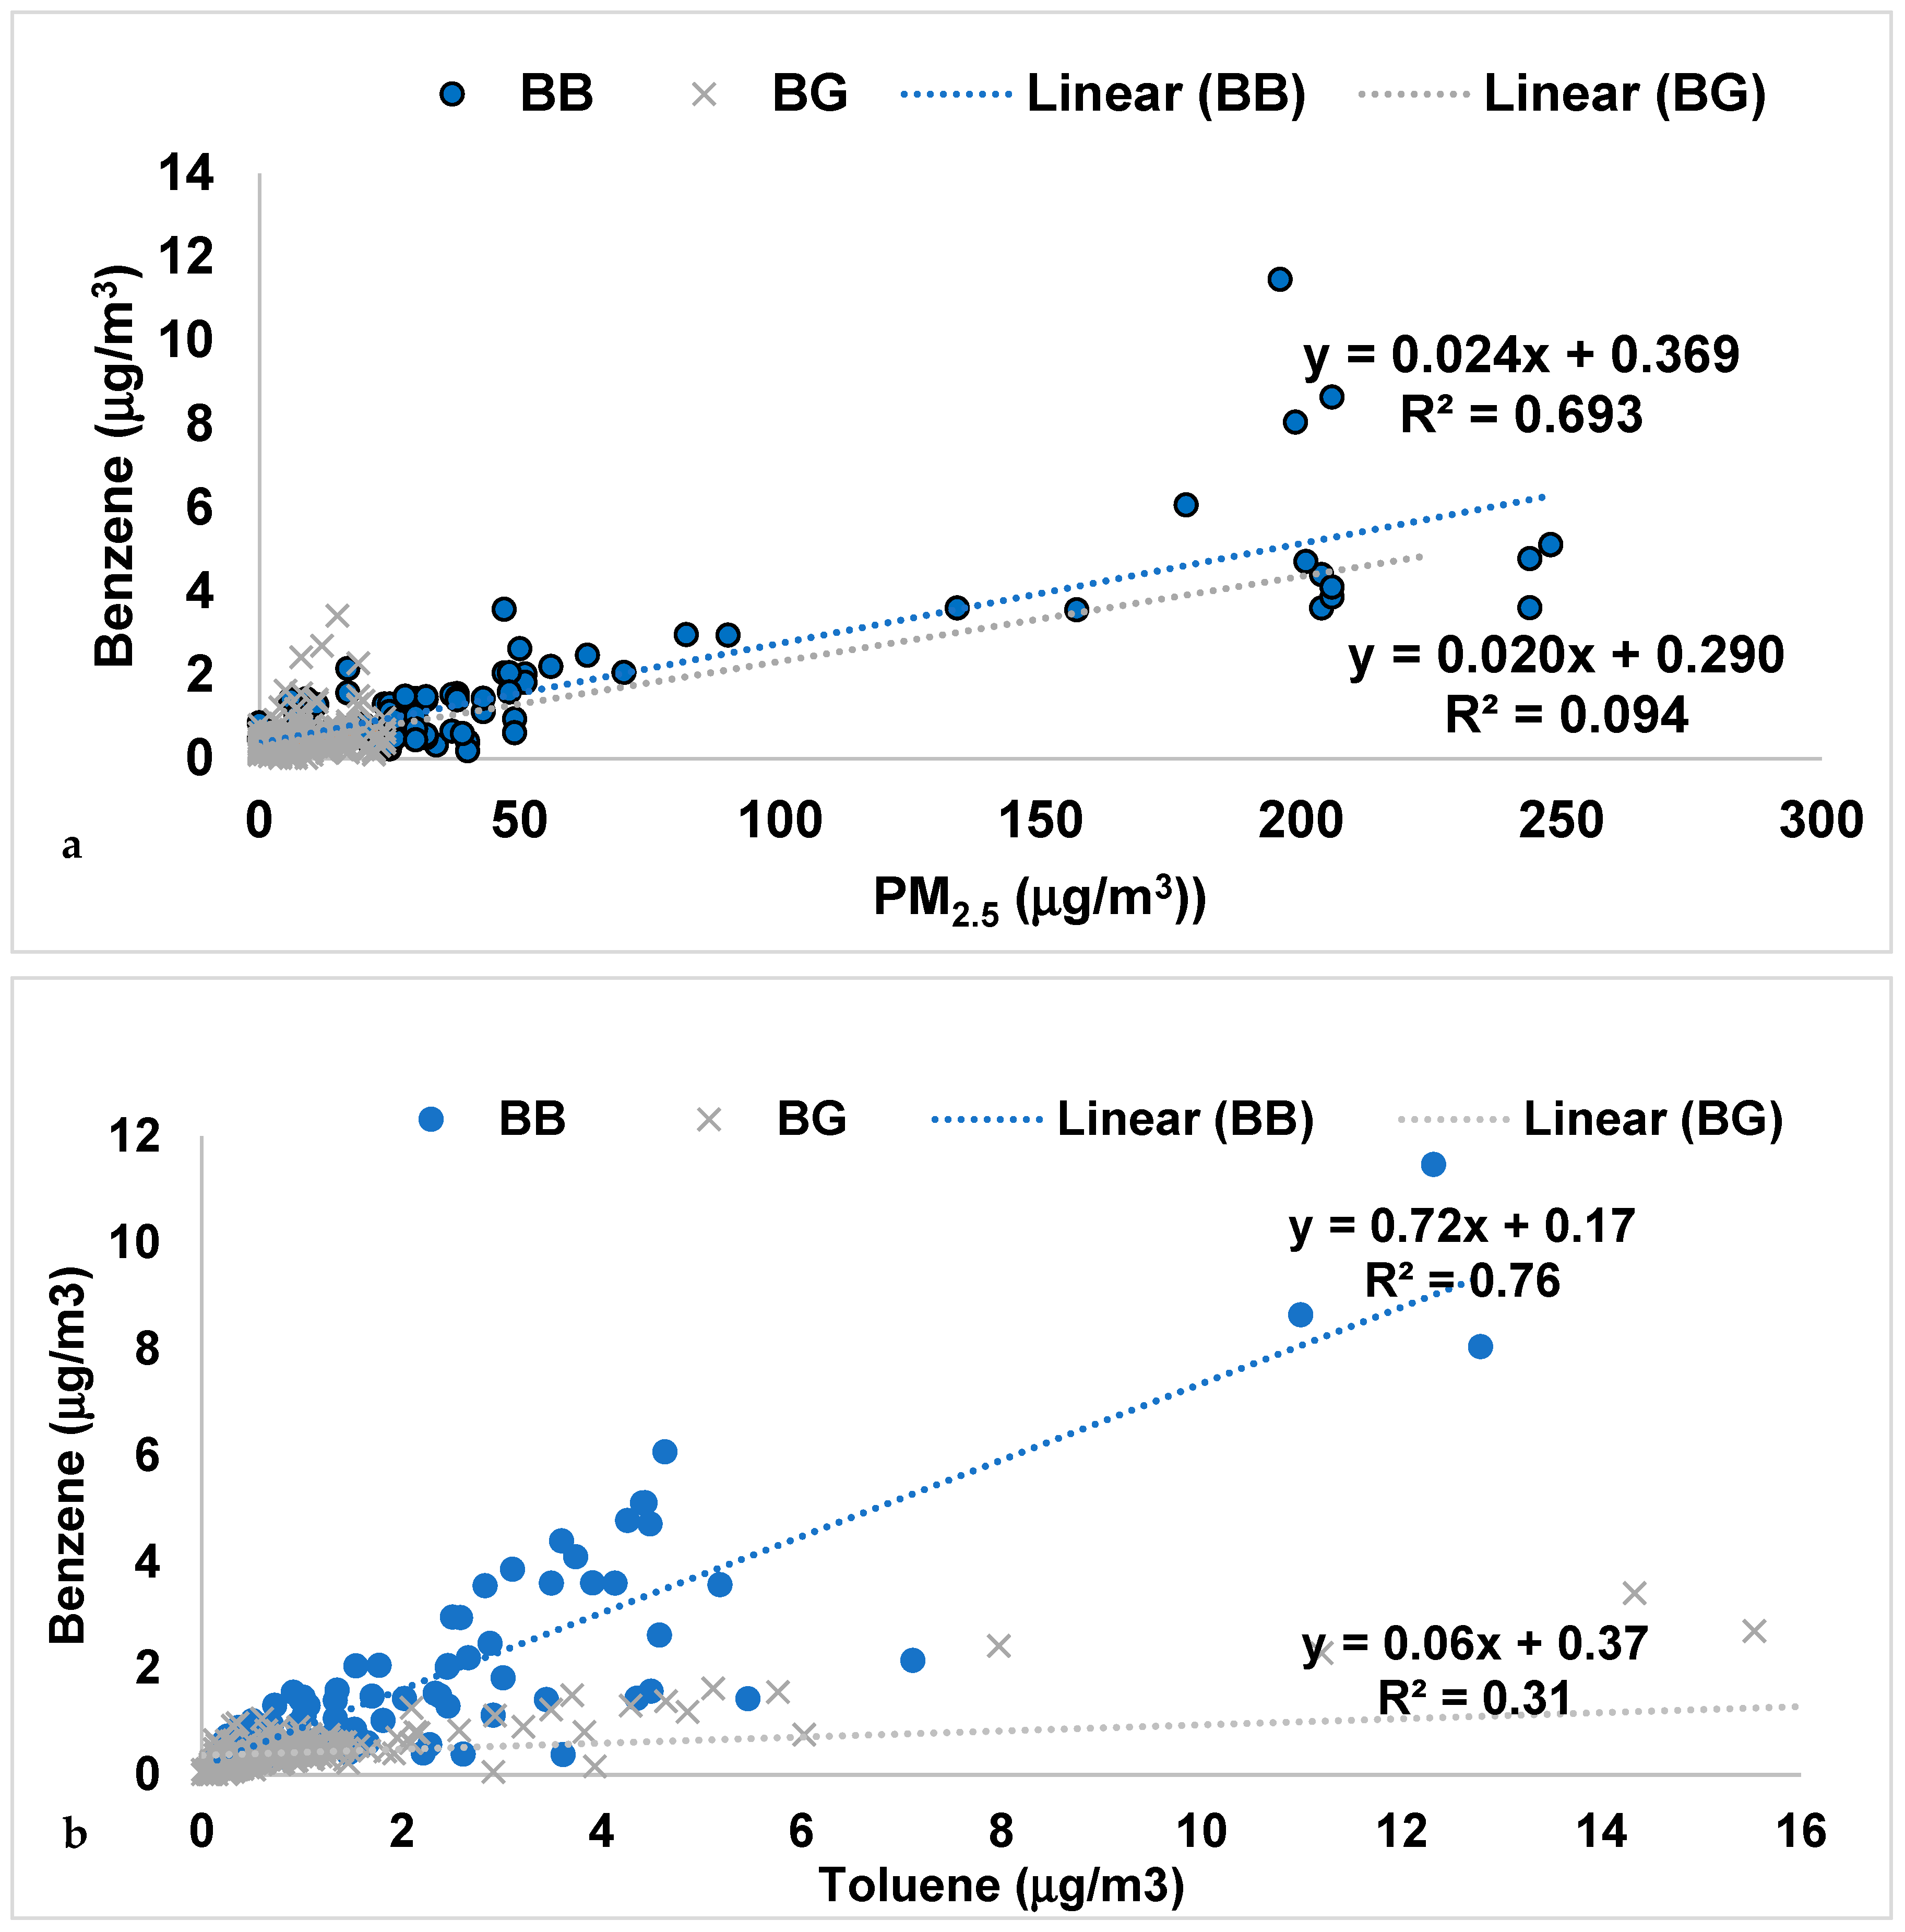
  • Several VOCs were elevated in 2017–2018 smoke events, including air toxics (means in µg/m3): benzene (1.78), toluene (2.25), ethylbenzene (0.32), xylenes (1.02), phenol (0.66), and p-cymene (0.87).
  • The lifetime hazard index of the LCV smoke exposures was below one, and considered low risk for non-cancer health events.
  • There was an associated risk of 6–7 extra cancers per million in the LCV and Boise, Coeur d’Alene and Spokane, due to lifetime benzene exposure from smoke.
  • Combined with other pollutants in the background air, the total cancer health risk of VOCs measured in the LCV was up to 13 extra cancers per million, which was consistent with an earlier study of the region [29].
  • PM2.5 have increased in the LCV by 0.10 µg/m3/yr over the past 23 years, showing the impact of wildfires on the region.
This work is important, as it assessed air toxic and PM2.5 exposure at the ground level, where communities were exposed, in the Northwest U.S. region, which has been plagued by wildfire smoke events in the past decade.

Author Contributions

D.T.K. (formal analysis, investigation, visualization, writing—original draft/review/editing); D.D.M. (formal analysis, investigation, visualization, writing—review/editing); D.R.K. (formal analysis, investigation, visualization); P.S.S. (formal analysis, investigation, writing—review/editing, visualization); J.P.A. (formal analysis, investigation); B.A.B. (formal analysis, investigation); B.K.G. (formal analysis, investigation); J.L. (formal analysis, investigation); M.A.Y.B. (formal analysis, investigation); L.A.N. (formal analysis, investigation); D.L.P. (formal analysis, investigation); R.P.U. (formal analysis, investigation); N.A.C.J. (conceptualization, methodology, validation, formal analysis, investigation, resources, data curation, writing—original draft/review/editing, visualization, supervision, project administration, funding acquisition). All authors have read and agreed to the published version of the manuscript.

Funding

The project described was supported by an Institutional Development Award (IDeA) from the National Institute of General Medical Sciences of the National Institutes of Health under Grant #P20GM103408, the NSF Idaho EPSCoR Program and by the National Science Foundation under award number IIA-1301792, the Idaho State Board of Education Higher Education Research Council, and Lewis–Clark State College.

Institutional Review Board Statement

Not applicable.

Informed Consent Statement

Not applicable.

Data Availability Statement

The dataset utilized for this study has been previously published [29]: Scott, P. S., Andrew, J. P., Bundy, B. A., Grimm, B. K., Hamann, M. A., Ketcherside, D. T., Li, J., Manangquil, M. Y., Nuñez, L. A., Pittman, D. L., Rivero-Zevallos, A., Uhlorn, R., and Johnston, N. A. C. (2020). Observations of volatile organic and sulfur compounds in ambient air and health risk assessment near a paper mill in rural Idaho, U. S. A. Atmospheric Pollution Research, 11(10), 1870–1881. https://doi.org/10.1016/j.apr.2020.07.014.

Acknowledgments

Special thanks to sampling partners: Ed Jolly of the Idaho Department of Environmental Quality, Sara Egbert of Walla Walla Community College, Melinda Tompkins of Lewis–Clark State College and the Teats family of Lewiston, ID. Thanks for general support of Lewis–Clark State College, including the members of the Johnston Air Research Laboratory, Bart Bramell, Loralee Ohrtman, Connie Hallen, Karen Schmidt, Jane Finan, Heather Moon, Heather Henson-Ramsey, Susan Steele, Eric Stoffregen, Matthew Johnston, Rachel Jameton, and Martin Gibbs.

Conflicts of Interest

The authors declare no conflicts of interest. The funders had no role in the design of the study; in the collection, analyses, or interpretation of data; in the writing of the manuscript; or in the decision to publish the results.

References

  1. Hanan, E.J.; Ren, J.; Tague, C.L.; Kolden, C.A.; Abatzoglou, J.T.; Bart, R.R.; Kennedy, M.C.; Liu, M.; Adam, J.C. How climate change and fire exclusion drive wildfire regimes at actionable scales. Environ. Res. Lett. 2021, 16, 024051. [Google Scholar] [CrossRef]
  2. Spracklen, D.V.; Mickley, L.J.; Logan, J.A.; Hudman, R.C.; Yevich, R.; Flannigan, M.D.; Westerling, A.L. Impacts of climate change from 2000 to 2050 on wildfire activity and carbonaceous aerosol concentrations in the Western United States. J. Geophys. Res. 2009, 114, 1–17. [Google Scholar] [CrossRef]
  3. Steel, Z.L.; Safford, H.D.; Viers, J.H. The fire frequency-severity relationship and the legacy of fire suppression in California forests. Ecosphere 2015, 6, 8. [Google Scholar] [CrossRef]
  4. Williams, A.P.; Abatzoglou, J.T.; Gershunov, A.; Guzman-Morales, J.; Bishop, D.A.; Balch, J.K.; Lettenmaier, D.P. Observed Impacts of Anthropogenic Climate Change on Wildfire in California. Earth’s Future 2019, 7, 892–910. [Google Scholar] [CrossRef]
  5. Dennison, P.E.; Brewer, S.C.; Arnold, J.D.; Moritz, M.A. Large wildfire trends in the western United States, 1984–2011. Geophys. Res. Let. 2014, 1, 2928–2933. [Google Scholar] [CrossRef]
  6. Weber, K.T.; Yadav, R. Spatiotemporal Trends in Wildfires across the Western United States (1950–2019). Remote Sens. 2020, 12, 2959. [Google Scholar] [CrossRef]
  7. McGinnis, S.; Kessenich, L.; Mearns, L.; Cullen, A.; Podschwit, H.; Bukovsky, M. Future regional increases in simultaneous large Western USA wildfires. Int. J. Wildland Fire 2023, 32, 1304–1314. [Google Scholar] [CrossRef]
  8. Holden, Z.A.; Swanson, A.; Luce, C.H.; Jolly, W.M.; Maneta, M.; Oyler, J.W.; Warren, D.A.; Parsons, R.; Affleck, D. Decreasing fire season precipitation increased recent western US forest wildfire activity. Proc. Natl. Acad. Sci. USA 2018, 115, E8349–E8357. [Google Scholar] [CrossRef] [PubMed]
  9. Abatzoglou, J.T.; Williams, A.P. Impact of anthropogenic climate change on wildfire across western US forests. Proc. Natl. Acad. Sci. USA 2016, 113, 11770–11775. [Google Scholar] [CrossRef]
  10. Akagi, S.K.; Yokelson, R.J.; Wiedinmyer, C.; Alvarado, M.J.; Reid, J.S.; Karl, T.; Crounse, J.D.; Wennberg, P.O. Emission factors for open and domestic biomass burning for use in atmospheric models. Atmos. Chem. Phys. 2011, 11, 4039–4072. [Google Scholar] [CrossRef]
  11. Jaffe, D.; Bertschi, I.; Jaeglé, L.; Novelli, P.; Reid, J.S.; Tanimoto, H.; Vingarzan, R.; Westphal, D.L. Long-range transport of Siberian biomass burning emissions and impact on surface ozone in western North America. Geophys. Res. Lett. 2004, 31, 6–9. [Google Scholar] [CrossRef]
  12. Friedli, H.R.; Atlas, E.; Stroud, V.R.; Giovanni, L.; Campos, T.; Radke, L.F. Volatile organic trace gases emitted from North American wildfires. Glob. Biogeochem. Cycles 2001, 15, 435–452. [Google Scholar] [CrossRef]
  13. O’Dell, K.; Hornbrook, R.S.; Permar, W.; Levin, E.J.T.; Garofalo, L.A.; Apel, E.C.; Blake, N.J.; Jarnot, A.; Pothier, M.A.; Farmer, D.K.; et al. Hazardous Air Pollutants in Fresh and Aged Western US Wildfire Smoke and Implications for Long-Term Exposure. Environ. Sci. Technol. 2020, 54, 11838–11847. [Google Scholar] [CrossRef]
  14. Urbanski, S.P.; Hao, W.M.; Baker, S. Chapter 4 Chemical Composition of Wildland Fire Emissions. Dev. Environ. Sci. 2008, 8, 79–107. [Google Scholar] [CrossRef]
  15. Liang, Y.; Weber, R.J.; Misztal, P.K.; Jen, C.N.; Goldstein, A.H. Aging of Volatile Organic Compounds in October 2017 Northern California Wildfire Plumes. Environ. Sci. Technol. 2022, 2022, 1557–1567. [Google Scholar] [CrossRef]
  16. Jin, L.; Permar, W.; Selimovic, V.; Ketcherside, D.; Yokelson, R.J.; Hornbrook, R.S.; Apel, E.C.; Ku, I.-T.; Collett, J.L., Jr.; Sullivan, A.P.; et al. Constraining emissions of volatile organic compounds from western US wildfires with WE-CAN and FIREX-AQ airborne observations. Atmos. Chem. Phys. 2023, 23, 5969–5991. [Google Scholar] [CrossRef]
  17. McClure, C.D.; Jaffe, D.A. US particulate matter air quality improves except in wildfire-prone areas. Proc. Natl. Acad. Sci. USA 2018, 115, 7901–7906. [Google Scholar] [CrossRef] [PubMed]
  18. Rana, S.V.S.; Verma, Y. Biochemical Toxicity of Benzene. J. Environ. Biol. 2005, 26, 157–168. Available online: http://www.ncbi.nlm.nih.gov/pubmed/16161967 (accessed on 1 May 2024).
  19. Smith, M.T. The mechanism of benzene-induced leukemia: A hypothesis and speculations on the causes of leukemia. Environ. Health Perspect. 1996, 104 (Suppl. S6), 1219–1225. [Google Scholar] [CrossRef]
  20. Lipner, E.M.; O’Dell, K.; Brey, S.J.; Ford, B.; Pierce, J.R.; Fischer, E.V.; Crooks, J.L. The Associations Between Clinical Respiratory Outcomes and Ambient Wildfire Smoke Exposure Among Pediatric Asthma Patients at National Jewish Health, 2012–2015. GeoHealth 2019, 3, 146–159. [Google Scholar] [CrossRef] [PubMed]
  21. Jin, W.; Su, S.; Wang, B.; Zhu, X.; Chen, Y.; Shen, G.; Liu, J.; Cheng, H.; Wang, X.; Wu, S.; et al. Properties and cellular effects of particulate matter from direct emissions and ambient sources. J. Environ. Sci. Health 2016, 51, 1075–1083. [Google Scholar] [CrossRef] [PubMed]
  22. Gharibvand, L.; Beeson, W.L.; Shavlik, D.; Knutsen, R.; Ghasmsary, S.S.; Knutsen, S.F. The association between ambient fine particulate matter and incident adenocarcinoma subtype of lung cancer. Environ. Health 2017, 16, 71. [Google Scholar] [CrossRef] [PubMed]
  23. Pope, C.A., III. Lung Cancer, Cardiopulmonary Mortality, and Long-term Exposure to Fine Particulate Air Pollution. JAMA 2002, 287, 1132. [Google Scholar] [CrossRef]
  24. Kloog, I.; Ridgway, B.; Koutrakis, P.; Coull, B.A.; Schwartz, J.D. Long-and Short-Term Exposure to PM 2.5 and Mortality: Using Novel Exposure Models. Epidemiology 2013, 24, 555–561. [Google Scholar] [CrossRef] [PubMed]
  25. Molnar, P.; Gustafson, P.; Johannesson, S.; Boman, J.; Barregard, L.; Sallsten, G. Domestic wood burning and PM trace elements: Personal exposures, indoor and outdoor levels. Atmos. Environ. 2005, 39, 2643–2653. [Google Scholar] [CrossRef]
  26. Miller, D.D.; Bajracharya, A.; Dickinson, G.N.; Durbin, T.A.; McGarry, J.K.P.; Moser, E.P.; Nuñez, L.A.; Pukkila, E.J.; Scott, P.S.; Sutton, P.J.; et al. Diffusive uptake rates for passive air sampling: Application to volatile organic compound exposure during FIREX-AQ campaign. Chemosphere 2022, 287, 131808. [Google Scholar] [CrossRef]
  27. Warneke, C.; Schwarz, J.P.; Dibb, J.; Kalashnikova, O.; Frost, G.; Al-Saad, J.; Brown, S.S.; Brewer, W.A.; Soja, A.; Seidel, F.C.; et al. Fire Influence on Regional to Global Environments and Air Quality (FIREX-AQ). J. Geophys. Res. Atmos. 2023, 128, 2169–2897. [Google Scholar] [CrossRef]
  28. U.S. EPA. Air Quality System. Available online: https://www.epa.gov/outdoor-air-quality-data (accessed on 31 October 2020).
  29. Scott, P.S.; Andrew, J.P.; Bundy, B.A.; Grimm, B.K.; Hamann, M.A.; Ketcherside, D.T.; Li, J.; Manangquil, M.Y.; Nuñez, L.A.; Pittman, D.L.; et al. Observations of volatile organic and sulfur compounds in ambient air and health risk assessment near a paper mill in rural Idaho, U.S.A. Atmos. Pollut. Res. 2020, 11, 1870–1881. [Google Scholar] [CrossRef] [PubMed]
  30. Li, R.; Jobson, B.T.; Wen, M.; Li, A.L.; Huangfu, Y.; Zhang, W.; Hardy, R.; O’Keeffe, P.; Simpson, J.; Fauci, M.; et al. Anthropogenic, biogenic, and photochemical influences on surface formaldehyde and its significant decadal (2006–2017) decrease in the Lewiston-Clarkston valley of the northwestern United States. Chemosphere 2024, 349, 140962. [Google Scholar] [CrossRef]
  31. Nez Perce Tribe. Characterization of Air Toxics Concentrations around a Kraft Pulp and Paper Mill Facility, Lewiston, Idaho; 2009. Available online: https://www.epa.gov/sites/default/files/2020-01/documents/nptatstudyfinalreport93009.pdf (accessed on 1 September 2024).
  32. U.S. EPA. Method 325A—Volatile Organic Compounds from Fugitive and Area Sources: Sampler Deployment and VOC Sample Collection; 2015. Available online: https://www.epa.gov/sites/production/files/2016-07/documents/m-325a.pdf (accessed on 30 May 2020).
  33. U.S. EPA. Compendium Method TO-17 Determination of Volatile Organic Compounds in Ambient Air Using Active Sampling Onto Sorbent Tubes; 1999. Available online: https://www.epa.gov/sites/default/files/2019-11/documents/to-17r.pdf (accessed on 30 May 2020).
  34. U.S. EPA. Method 325B—Volatile Organic Compounds from Fugitive and Area Sources: Sampler Preparation and Analysis; 2019. Available online: https://www.epa.gov/emc/method-325b-volatile-organic-compounds-fugitive-and-area-sources-sampler-preparation-and (accessed on 1 September 2024).
  35. Markes International. Application Note 001 Uptake Rates for Tube-Type Axial Diffusive Samplers; Markes International: Bridgend, UK, 2015. [Google Scholar]
  36. U.S. EPA. Criteria Air Pollutants; 2024. Available online: https://www.epa.gov/criteria-air-pollutants/naaqs-table (accessed on 3 May 2024).
  37. U.S. EPA. Risk Assessment Guidance for Superfund Volume I: Human Health Evaluation Manual (Part F, Supplemental Guidance for Inhalation Risk Assessment); Office of Superfund Remediation and Technology Innovation Environmental Protection Agency: Washington, DC, USA, 2009; pp. 1–68.
  38. U.S. EPA. OSWER Directive 9200.1-120; U.S. EPA: Washington, DC, USA, 2014.
  39. U.S. EPA. Integrated Risk Assessment System; 2024. Available online: https://www.epa.gov/iris (accessed on 1 October 2021).
  40. U.S. EPA. AirNow. Available online: https://gispub.epa.gov/airnow/index.html?tab=3 (accessed on 15 March 2019).
  41. Meinardi, S.; Simpson, I.J.; Blake, N.J.; Blake, D.R.; Rowland, F.S. Dimethyl disulfide (DMDS) and dimethyl sulfide (DMS) emissions from biomass burning in Australia. Geophys. Res. Lett. 2003, 30, 1454. [Google Scholar] [CrossRef]
  42. Gelencsér, A.; Siszler, K.; Hlavay, J. Toluene-benzene concentration ratio as a tool for characterizing the distance from vehicular emission sources. Environ. Sci. Technol. 1997, 31, 2869–2872. [Google Scholar] [CrossRef]
  43. Koss, A.R.; Sekimoto, K.; Gilman, J.B.; Selimovic, V.; Coggon, M.M.; Zarzana, K.J.; Yuan, B.; Lerner, B.M.; Brown, S.S.; Jimenez, J.L.; et al. Non-methane organic gas emissions from biomass burning: Identification, quantification, and emission factors from PTR-ToF during the FIREX 2016 laboratory experiment. Atmos. Chem. Phys. 2018, 18, 3299–3319. [Google Scholar] [CrossRef]
  44. Zhang, Z.; Zhang, Y.; Wang, X.; Lü, S.; Huang, Z.; Huang, X.; Yang, W.; Wang, Y.; Zhang, Q. Spatiotemporal patterns and source implications of aromatic hydrocarbons at six rural sites across China’s developed coastal regions. J. Geophys. Res. Atmos. 2016, 121, 6669–6687. [Google Scholar] [CrossRef]
  45. Dickinson, G.N.; Miller, D.D.; Bajracharya, A.; Bruchard, W.; Durbin, T.A.; McGarry, J.K.P.; Moser, E.P.; Nuñez, L.A.; Pukkila, E.P.; Scott, P.S.; et al. Health Risk Implications of Volatile Organic Compounds in Wildfire Smoke during the 2019 FIREX-AQ Campaign and Beyond. GeoHealth. 2022, 6, e2021GH000546. [Google Scholar] [CrossRef]
  46. McCarthy, M.C.; O’Brien, T.E.; Charrier, J.G.; Hafner, R.H. Characterization of the Chronic Risk and Hazard of Hazardous Air Pollutants in the United States Using Ambient Monitoring Data. Environ. Health Perspect. 2009, 117, 790–796. [Google Scholar] [CrossRef]
  47. Navarro, K.M.; West, M.R.; O’Dell, K.; Sen, P.; Chen, I.C.; Fischer, E.v.; Hornbrook, R.S.; Apel, E.C.; Hills, A.J.; Jarnot, A.; et al. Exposure to Particulate Matter and Estimation of Volatile Organic Compounds across Wildland Firefighter Job Tasks. Environ. Sci. Technol. 2021, 55, 11795–11804. [Google Scholar] [CrossRef]
  48. Wang, Z.M.; Wang, P.; Wagner, J.; Kumagai, K. Impacts on Urban VOCs and PM2.5 during a Wildfire Episode. Environments 2024, 11, 63. [Google Scholar] [CrossRef]
Figure 1. (a) Active sampling locations in the Lewis–Clark Valley (LCV) spanning Lewiston, Idaho and Clarkston, Washington. (b) Passive sampling comparison (biweekly–monthly) at four locations in Idaho (Coeur d’Alene, Lewis–Clark Valley, Boise) and Washington (Spokane).
Atmosphere 15 01172 g001
Figure 2. PM2.5 AQI in the Northwest U.S. during 7 September 2018 wildfire smoke event [40]. The legend shows the concentrations for various levels, where USG refers to a concentration unhealthy for sensitive groups. The LCV (Lewiston on map) and other sites sampled were in the unhealthy (red) to very unhealthy (purple) range on this day.
Atmosphere 15 01172 g002
Figure 3. PM2.5 (µg/m3) in the LCV (all monitors) from July 2000 through December 2023 [28]. The dashed horizontal line is the U.S. EPA 24 hr average air-quality standard for PM2.5, 35 µg/m3 [36]. The slope of PM2.5 versus number of days was +0.10 µg m−3/yr, showing a general increase with time.
Atmosphere 15 01172 g003
Figure 4. PM2.5 and benzene concentrations in LCV from June to October ((a) 2017, (b) 2018). PM2.5 daily mean is shown (blue line), while benzene was measured weekly and is shown with a gray marker [28]. Two major events occurred in early September 2017 and late August 2018, as shown with corresponding peaks.
Atmosphere 15 01172 g004aAtmosphere 15 01172 g004b
Figure 5. Box and whisker plots of Benzene, Toluene, Ethylbenzene and m,p-Xylene (BTEX) concentrations in LCV for background (BG) and biomass burning (BB) samples collected from June to October 2017–2018. All BTEX means were significantly different in BB compared to BG, except toluene in 2017.
Atmosphere 15 01172 g005
Figure 6. Correlation plots including both 2017–2018 samples in the LCV, including both background (BG) and biomass burning (BB) samples and trendlines. (a) Benzene and PM2.5 [28]. (b) Benzene and Toluene. All concentrations in units of µg/m3, and the equation of the best-fit line and coefficient of determination are displayed.
Atmosphere 15 01172 g006
Figure 7. (a) PM2.5 timeline for 2018 in LCV and three comparison cities, Spokane, Boise, and Coeur d’Alene (CDA), with insert zooming in on the smoke event (shaded gray) in August 2018 [28]. (b) Benzene averaged from passive sampling at four locations in 2018, with August smoke event shaded in gray. Both PM2.5 and benzene were elevated in the passive samples, similarly to the active samples in LCV.
Atmosphere 15 01172 g007
Table 1. 2017–2018 statistics divided by year, background (BG) and smoke or biomass burning (BB). Compounds with statistically significant increases from BG to BB are indicated (*). All concentrations are in µg/m3. % ND is the percent of non-detects, Min–Max is the range of observations, (S) is mean ± standard deviation, and UCL is upper confidence limit (95%).
2017Background Samples (n = 125)Biomass Burning Samples (n = 44)
Compound% NDMin–MaxMean ± SUCL% NDMin–MaxMean ± SUCL
Benzene *50.02–3.420.45 ± 0.540.6700.18–11.462.14 ± 2.302.89
Benzene, propyl- *750.02–0.610.05 ± 0.100.09390.02–0.560.10 ± 0.120.18
Dichlorodifluoromethane *02.51–17.876.31 ± 2.916.7505.49–12.908.71 ± 1.329.04
Ethylbenzene *320.01–2.550.20 ± 0.380.3450.01–1.780.42 ± 0.440.71
m,p-Xylene *100.02–12.310.88 ± 1.711.5520.02–6.251.50 ± 1.602.50
Naphthalene *790.01–0.890.05 ± 0.120.08590.01–0.890.12 ± 0.180.18
p-cymene *610.01–1.240.14 ± 0.250.1970.01–2.570.49 ± 0.490.65
Phenol *630.02–4.580.26 ± 0.620.3220.02–2.370.66 ± 0.430.79
Trichloromonofluoromethane *10.01–4.730.97 ± 0.621.0700.37–2.691.21 ± 0.561.35
Benzene, 1,2,4 trimethyl850.06–4.160.22 ± 0.570.34700.06–0.740.13 ± 0.140.17
Dimethyl sulfide500.02–40.551.99 ± 5.803.97410.02–54.993.28 ± 8.777.49
Disulfide, dimethyl780.01–25.570.56 ± 3.121.80680.01–5.640.27 ± 0.870.75
Mesitylene670.02–1.150.08 ± 0.170.15500.02–0.730.11 ± 0.150.16
Methylene chloride60.02–2.320.17 ± 0.210.1900.08–1.710.23 ± 0.240.29
Tetrachloroethylene740.01–1.850.07 ± 0.230.16450.01–0.620.10 ± 0.140.19
Toluene10.01–41.951.99 ± 5.574.1700.21–12.82.98 ± 2.923.75
Trichloromethane290.01–1.550.14 ± 0.220.23200.01–1.130.21 ± 0.230.29
2018Background Samples (n = 120)Biomass Burning Samples (n = 48)
Compound% NDMin–MaxMean ± SUCL% NDMin–MaxMean ± SUCL
Benzene *00.09–1.260.44 ± 0.230.4800.23–5.121.42 ± 1.532.38
Ethylbenzene *420.01–1.140.09 ± 0.140.14190.01–0.620.21 ± 0.200.27
m,p-Xylene *220.02–5.090.35 ± 0.580.55120.02–2.320.54 ± 0.470.69
Naphthalene *780.01–0.360.03 ± 0.050.04650.01–0.370.08 ± 0.120.11
p-cymene *400.01–0.800.14 ± 0.180.21210.01–2.160.38 ± 0.481.17
Toluene *10.01–3.930.65 ± 0.590.7500.15–4.491.51 ± 1.442.32
Benzene, propyl-840.02–0.310.03 ± 0.040.05650.02–0.140.04 ± 0.040.05
Carbon Tetrachloride470.03–0.500.22 ± 0.180.25790.03–0.460.10 ± 0.140.13
Dichlorodifluoromethane03.83–5.974.70 ± 0.384.7603.95–5.504.59 ± 0.404.69
Dimethyl sulfide150.02–16.001.75 ± 3.303.07120.02–13.882.45 ± 3.3710.33
Disulfide, dimethyl850.01–5.250.25 ± 0.910.10750.01–3.340.16 ± 0.530.43
Methylene chloride20.02–0.710.20 ± 0.080.2100.10–0.250.18 ± 0.030.19
Tetrachloroethylene720.01–0.470.05 ± 0.080.05710.01–0.340.03 ± 0.060.02
Trichloromethane80.01–3.330.25 ± 0.390.40170.01–1.070.23 ± 0.230.48
Trichloromonofluoromethane00.29–2.401.33 ± 0.401.3900.52–2.111.37 ± 0.351.46
Table 2. Coefficient of determination values for VOCs with PM2.5 in both background (BG) and biomass burning (BB) samples from 2017 to 2018. Values are significant at the 95% confidence level are indicated (*) and bolded values are strong correlations over 0.5. The strongest correlations are with PM2.5 and benzene, followed by naphthalene and p-cymene.
PM2.5 BGPM2.5 BB
Benzene0.09 *0.69 *
Benzene, 1,2,4 trimethyl0.000.03
Benzene, propyl-0.03 *0.25 *
Carbon Tetrachloride0.03 *0.03
Dichlorodifluoromethane0.01 *0.02
Dimethyl sulfide0.050.00
Disulfide, dimethyl0.00 *0.04 *
Ethylbenzene0.02 *0.29 *
m,p-Xylene0.02 *0.09 *
Mesitylene0.02 *0.04 *
Methylene chloride0.010.00
Naphthalene0.010.56 *
p-cymene0.11 *0.54 *
Phenol0.000.01
Tetrachloroethylene0.02 *0.01
Toluene0.02 *0.39 *
Trichloromethane0.13 *0.00
Trichloromonofluoromethane0.01 *0.01
Table 3. Cancer risk analysis of LCV, including smoke or biomass-burning exposures (BB) of 30 days and background (BG), repeated for 26 years (Residential) and 70 years (Lifetime). CA (measured concentration) is based on the upper confidence level of concentrations in µg/m3 obtained via active sampling. EC is the exposure concentration in µg/m3, calculated for both residential (Res) and lifetime (Life) scenarios. The inhalation unit risk (IUR) in (µg/m3)−1 and the Reference Concentration (RfC) in µg/m3 were used for the Cancer Risk and Hazard Quotient (HQ) calculations, respectively [40]. Cancer risks and HQ are unitless.
CompoundCA BGCA BBEC BG ResEC BB ResEC BG LifeEC BB LifeIURRfCCancer Risk ResCancer Risk LifeHQ
Benzene0.72.9410.230.090.640.247.80 × 10−6302 × 10−67 × 10−62.9 × 10−2
Trichloromethane0.230.520.070.020.210.042.30 × 10−5982 × 10−66 × 10−62.6 × 10−3
Methylene Chloride0.220.330.070.010.200.031.00 × 10−86008 × 10−102 × 10−93.8 × 10−4
Tetrachloroethylene0.050.180.020.010.040.012.60 × 10−7406 × 10−92 × 10−81.5 × 10−3
Benzene, 1,2,4 trimethyl 0.330.150.110.000.300.01NA60 5.2 × 10⁻³
Benzene, propyl0.070.230.020.010.060.02NA1000 7.9 × 10⁻⁵
Ethylbenzene 0.310.570.100.020.290.05NA1000 3.3 × 10⁻⁴
Mesitylene0.110.110.040.000.100.01NA60 1.9 × 10⁻³
Naphthalene0.070.190.020.010.060.02NA3 2.5 × 10⁻²
Toluene3.344.581.090.143.060.38NA5000 6.9 × 10⁻⁴
Xylene (m,p)1.462.610.470.081.340.21NA100 1.6 × 10⁻²
Cumulative 5 × 10−61.3 × 10−58.3 × 10⁻²
Table 4. Comparison of health risk during smoke events for LCV and three cities in 2018, using the upper confidence level of benzene concentrations in µg/m3 obtained via passive sampling (CA). BG represents background and BB represents smoke or biomass-burning samples. EC is the exposure concentration in µg/m3, calculated for both residential (Resident) and lifetime scenarios. The inhalation unit risk (IUR) of 7.8 × 10⁻⁶ (µg/m3)−1 and the Reference Concentration (RfC) of 30 µg/m3 were used for the Cancer Risk calculations, and Hazard Quotient (HQ), respectively [40]. Cancer risks and HQ are unitless.
SiteCA BGCA BBEC BG
Resident
EC BB
Resident
EC BG LifetimeEC BB
Lifetime
Cancer Risk ResidentCancer Risk LifetimeHQ
LCV0.691.150.230.040.610.092 × 10−65 × 10−60.02
Boise0.780.560.250.020.680.052 × 10−66 × 10−60.02
Coeur d’Alene0.910.690.300.020.800.062 × 10−67 × 10−60.03
Spokane0.970.820.320.030.850.073 × 10−67 × 10−60.03
Table 5. Summary of results from biomass-burning VOC measurements in the Western U.S. region, including the current study. Benzene levels were reported in both µg/m3 and ppb, for comparison across studies. Cancer risk is unitless.
Biomass-Burning StudyStudy AreaMain Pollutant(s)Benzene Levels MeasuredCancer Health Risk (Per Million)
Current studyNorthwest U.S., LCV
(ground level)
BTEX0.02–11 µg/m3
(0.06–3.6 ppb)
2–13
Dickinson et al., 2022 [45]Northwest
(ground level, near fires)
BTEX0.06–80 µg/m3
0.02–25 ppb
1–19
O’Dell et al., 2020 [13]Western U.S.
(airborne)
Benzene, Acrolein, Formaldehyde0.1–10 µg/m3
0.03–3 ppb)
2–10
Navarro et al., 2021 [47]Western U.S.
(ground-level estimates)
Benzene, Acrolein, Formaldehyde4.5–19 µg/m3
1.4–6 ppb
NA
Wang et al., 2024 [48]Northern California
(ground level)
BTEX1 ± 0.2 µg/m3
0.3 ± 0.06 ppb
NA
Jin et al., 2023 [16]Western U.S.
(airborne, ground level)
BTEX,
Formaldehyde,
Acetaldehyde
0.03–0.96 µg/m3
0.01–0.3 ppb
NA
Disclaimer/Publisher’s Note: The statements, opinions and data contained in all publications are solely those of the individual author(s) and contributor(s) and not of MDPI and/or the editor(s). MDPI and/or the editor(s) disclaim responsibility for any injury to people or property resulting from any ideas, methods, instructions or products referred to in the content.

