Article

Effects of Climate Change on the Future Attractiveness of Tourist Destinations in Greece

by
Ioannis Lemesios
*,
Konstantinos V. Varotsos
,
Elena Georgopoulou
,
Yannis Sarafidis
,
Dimitrios Kapetanakis
,
Sebastian Mirasgedis
,
Nikos Gakis
and
Christos Giannakopoulos
Institute for Environmental Research & Sustainable Development, National Observatory of Athens, I. Metaxa & Vas. Pavlou, GR-15236 Palea Penteli, Greece
*
Author to whom correspondence should be addressed.
Atmosphere 2024, 15(10), 1185; https://doi.org/10.3390/atmos15101185
Submission received: 28 August 2024 / Revised: 25 September 2024 / Accepted: 27 September 2024 / Published: 2 October 2024

Abstract

:
Climate change is a major challenge for the global tourism sector, affecting destinations worldwide. Greece, known for its scenery and abundant cultural history, is particularly vulnerable to these impacts. Tourism is a key driver of Greece’s economy, yet climate change threatens both natural environments and cultural sites. To evaluate the impacts of climate change on different types of Greek tourism (beach, sightseeing, winter tourism in mountainous areas), the widely used Holiday Climate Index (beach and urban versions) alongside three additional climatic indices customized for Greek climatic conditions, namely the Urban Climate Comfort Index, the Beach Utility Index, and the Mountainous Winter Climate Index were utilized for top tourist destinations of Greece. The results indicate that urban tourism may face challenges during peak summer months due to rising temperatures, but the shoulder seasons (April–May and September–October) will offer improved conditions, potentially extending the tourist season. For beach tourism, favorable conditions are expected to increase from April to October, with significant gains in June and September. Winter tourism in mountainous areas, especially snow-dependent activities like skiing, is at risk due to the declining snow availability. Overall, the study highlights both the challenges and opportunities posed by climate change for Greece’s tourism sector. It emphasizes the importance of adaptation strategies, including infrastructural improvements and promoting alternative activities, to minimize negative impacts and enhance the future attractiveness of Greek tourism.

1. Introduction

Climate change poses a challenge to the tourism sector and affects many destinations worldwide. The Intergovernmental Panel on Climate Change (IPCC) has highlighted the vulnerability of tourism to climate variability and change, emphasizing the complex relationship between climate factors and tourism behavior [1]. Greece, with its diverse landscape, rich historical heritage, and reliance on the tourism industry, is particularly vulnerable to these impacts.
Tourism plays an important role in the Greek economy, contributing significantly to the gross domestic product (GDP), about 13% by 2023, and is a major source of employment and income, accounting for approximately 16.4% of the total employment at the peak of 2023 [2]. However, climate change poses a risk to this economic sector and its associates [3]. Shifts in temperature and precipitation patterns as well as increases in extreme weather events are putting the country’s tourism sector at risk, impacting both natural and cultural attractions [4].
The existing literature shows that climate change impacts on Greek tourism are multilevel and extend across seasons. During the summer months, beach tourism, the main tourist product of the Greek tourism industry, faces numerous challenges [4]. Increasing temperatures and changes in precipitation patterns impact the overall experience of tourists [4,5], whereas sea level rise may affect coastal erosion and beach quality [6,7,8]. In addition, extreme heat waves, droughts, and heavy rainfall events can reduce the attractiveness of beach destinations, affecting tourist arrivals and revenues [9].
Conversely, climate change also impacts winter tourism in Greece, especially in mountainous areas [10]. Skiing destinations such as Mount Parnassos experience shorter ski seasons, unpredictable snowfall patterns, and diminishing snowpacks [11]. These changes not only impact the economic viability of ski resorts but also have an environmental and cultural impact on mountain landscapes [12]. In addition, sightseeing tourism, which includes visits to archaeological sites, museums, and historical landmarks, is another important component of Greek tourism. The escalation of temperatures and occurrences of extreme weather events may jeopardize the preservation of cultural treasures affecting also the visitor experience and accessibility of the sites [13].
The impact of climate on tourism is usually quantified using indices such as the Tourism Climate Index (TCI), which was developed by Mieczkowski (1985) [14] and is considered among the most popular [15,16,17,18,19]. However, in recent years, additional climate indices have been developed offering a more precise evaluation of climate suitability for tourism. For example, the Climate Index for Tourism (CIT), created by de Freitas et al. (2008) [20] has been extensively applied in various studies [21,22]. Moreover, specialized climate indicators tailored to specific tourism activities have been introduced. For beach tourism, indicators such as the Beach Climate Index [15,23], the Holiday Climate Index, beach version (HCI:beach) [24] and the Beach Utility Index (BUI), created for the assessment of the suitability of the Greek islands for summer tourism [5], have been employed. Similarly, for sightseeing tourism, indices such as the Holiday Climate Index, urban version (HCI:urban) [16,24], and the Urban Climate Comfort Index (UCCI) [13] have been used, while regarding the climatic suitability of mountainous areas for skiing tourism, the Skiing Utility Index (SUI) has been developed [10].
This study aims to comprehensively analyze the climatic suitability of Greece as a tourism destination under the influence of climate change, examining not only its suitability as a summer tourism destination but also for various other types such as sightseeing and skiing. To achieve this goal, this research utilizes two distinct versions of the Holiday Climate Index (HCI), the HCI:urban and the HCI:beach, tailored for urban and beach activities, respectively, as well as three indices customized for Greek climatic conditions, namely the UCCI, BUI and the Mountainous Winter Climate Index (MWCI). These indices were applied across a diverse selection of 10 urban, 7 beach, and 5 mountainous-ski popular tourism destinations within Greece. To our knowledge, this study stands out as one of the limited investigations that assess, in an integrated and detailed way, the future climatic suitability of Greece as a tourist destination providing essential knowledge for informed decision-making and adaptive strategies within the tourism sector.

2. Tourism Indicators and Methodology

As already mentioned, to evaluate Greece’s attractiveness as a tourist destination in light of climate change until the end of the century, the HCI:urban and the HCI:beach indices were used across the entire country. Additionally, three indices customized for Greek climatic conditions namely the UCCI, BUI and MWCI, were applied to a diverse range of popular urban, beach, and mountainous-ski tourist destinations in Greece. Figure 1 depicts the locations of the selected destinations according to their respective tourism types.
From the abovementioned indices, HCI:urban, HCI:beach, and UCCI are designed to incorporate the three facets of climate that are important to leisure tourism activities identified by de Freitas (2003) [25], that is the thermal, physical, and aesthetic facets. These facets reflect the relationship between the atmospheric environment and the enjoyable experience of outdoor recreational activities at a given destination. From a technical perspective, the thermal facet is related to thermal comfort which is calculated by temperature (°C) and mean relative humidity (%); the aesthetic facet is related to cloud cover (%); and the physical facet is a combination of precipitation (mm) and wind speed (km/h). The Beach Utility Index (BUI) incorporates the effects of temperature, precipitation, wind speed, and cloudiness on a location’s attractiveness for summer tourism. The empirical Mountainous Winter Climate Index (MWCI) for mountainous winter activities includes the same climatic parameters used for the calculation of the BUI, except for snow duration, which is used instead of precipitation. A detailed presentation of all indices utilized in the analysis is provided below.

2.1. Holiday Climate Index (HCI)

HCI was developed to assess the climatic suitability of destinations for leisure tourism in urban (HCI:urban) and beach (HCI:beach) environments. HCI:urban and HCI:beach utilize an additive approach whereby each of the sub-indices is weighted to represent the proportional impact of each climatic variable [17]. The weights are established by tourists’ stated climatic preferences, which constitutes a major improvement compared to relevant indices, such as the widely used Tourism Climate Index (TCI) [14], in which variable weights are based on expert judgment. The HCI is based on five climate variables that are used to calculate three facets that are important to leisure tourism activities according to de Freitas et al. (2003) [25]: thermal comfort (TC), which combines daily maximum temperature (°C) and mean relative humidity (%); aesthetic (A), which depends on cloud cover (%); and physical (P), which combines precipitation (mm) and wind speed (km/h). For more information on HCI:urban development, the reader may refer to Scott et al. (2016) [16]. The HCI:urban index is calculated using the following formula:
HCI:urban = 4(TC) + 2(A) + 3(Precipitation) + Wind
The key difference between the urban and beach versions of HCI regards the weights assigned to the aesthetic and thermal comfort facets, in accordance with tourists’ stated preferences. In particular, beach tourism receives the highest weight in its aesthetic facet (40%) and the thermal comfort facet is rated third (given a weight of 20%). These differences are reflected in the formula for the HCI:beach index, which is as follows:
HCI:beach = 2(TC) + 4(A) + 3(Precipitation) + Wind
For more information on the weights and rating schemes of the HCI:beach index as well as its main differences with HCI:urban, the reader may refer to Rutty et al. (2020) [17]. In both HCI urban and beach versions, each climate variable is rated on a scale from 0 to 10, with an overall index score ranging between 0 (potentially dangerous for tourists) and 100 (ideal for tourism). The classifications for the HCI:urban and HCI:beach indices are presented in Table 1.

2.2. Urban Climate Comfort Index (UCCI)

The UCCI [13] is based on the climate preferences of tourists for tourism and leisure activities in the urban environment of Greece and includes thermal (air temperature and relative humidity), physical (rainfall and wind speed), and aesthetic (cloud cover) factors.
The formula for the UCCI index is as follows:
U C C I n = 0.245 × U T n + 0.218 × U R n + 0.191 × U W n + 0.153 × U C n + 0.193   ×   U R H n
The utility functions for each climatic parameter are calculated for a specific climate profile n based on the following equations:
U T n = 263.0451 e γ c γ c 1   w i t h   γ = T n l o c σ
where Tn is the ambient air temperature (in °C), c = 4.0563, loc = 7.3907, and σ = 20.1169. The above equation is valid for temperature range 10 °C–41 °C,
U R n = 101.7434 42.4174 R n + 4.49 32 R n 2
where Rn is the rainfall duration (in hours/day),
U W n = 50.3631 + 26.49 33 W n 4.9778 W n 2 + 0.2917 W n 3 0.0057 W n 4
where Wn is the wind speed value (in m/s),
U C n = 97.6952 + 0.9156 C n 0.0494 C n 2 + 3 10 4 C n 3
where Cn is the cloud coverage (in %), and
U R H n = 46.1187 + 9.33395 R H n 0.1823 R H n 2 + 9 × 10 4 R H n 3
where RHn is the relative humidity (in %).

2.3. Beach Utility Index (BUI)

The BUI for a location on a Greek sea-side location under a specific climate profile can be expressed by the following equation [5], which incorporates the effect of temperature, precipitation, cloudiness, and wind speed on a location’s attractiveness:
B U I j = 0.279 U T J + 0.285 U P J + 0.229 U C J + 0.206 U W J
Utilities for each climatic parameter are estimated by the following equations:
U T j = 100 e x p T j 30 2 44.3935
where Tj is ambient air temperature (in °C),
U P j = 100 e x p P j 4
where Pj is the rainfall duration (in hours/day),
U W j = 52.93 W j + 1 0.82 e x p 0.04 W j + 1 1.82
where Wj is the wind speed value (in m/s), and
U C j = 123.21 C j + 100.93   for C j 80 %
U C j = 0   for C j > 80 %
where Cj the cloud coverage (in %).

2.4. Mountainous Winter Climate Index (MWCI)

The empirical MWCI derives the stated in situ climatic preferences of winter tourists in Greek mountainous areas where ski activities are also provided [10], and is calculated using the following formula:
W M C I m = 0.222 U T m + 0.279 U W m + 0.194 U C m + 0.303 U S m
The climatic parameters used for the calculation of the index are the same as those used in the BUI, with the exception of snow duration, which is used instead of precipitation. The utility functions for each climatic parameter are calculated under a specific climate profile m, based on the following equations:
U T m = 86.546 c e γ 1 / c γ 1 c 1   w i t h   γ = 1 c T m l o c σ
where Tm is the ambient air temperature (in °C). This formula gives the distribution of the utility score for −12 °C < T < 10 °C and with the given parameters of c = 0.34, loc = −1.45 and σ = 4.6,
U S m = 98.0472 + 6.3866 S m 9.0328 S m 2 + 0.8132 S m 3
where Sm is snow duration ≤ 5 h/day,
U W m = 104.3683 6.7807 W m 0.1931 W m 2 + 0.0136 W m 3
where Wm is wind speed (in m/s), and
U C m = 99.438 0.2373 C m 0.0233 C m 2 + 0.0001615 C m 3
where Cm is cloud cover (in %).
To assess the suitability of a geographical location for urban, beach, and mountainous winter tourism based on index values, the categorization described in Table 2 is used for all three indices. Additionally, all indicators were calculated from sub-daily or daily data derived from a large member ensemble of regional climate models from the Euro-CORDEX initiative—the European branch of the CORDEX program [26]. The horizontal resolution of the models is 0.11°, while the simulated data in this section cover three periods: 1971–2000, which is used as a reference period, and two future periods, 2021–2050 (near future) and 2071–2100 (end-of-the-century) under three RCP emission scenarios, namely RCP2.6, RCP4.5 and RCP8.5. The results are presented both spatially for the entire Greek domain and for selected urban, beach, island, and mountainous tourist destinations.

3. Results and Discussion
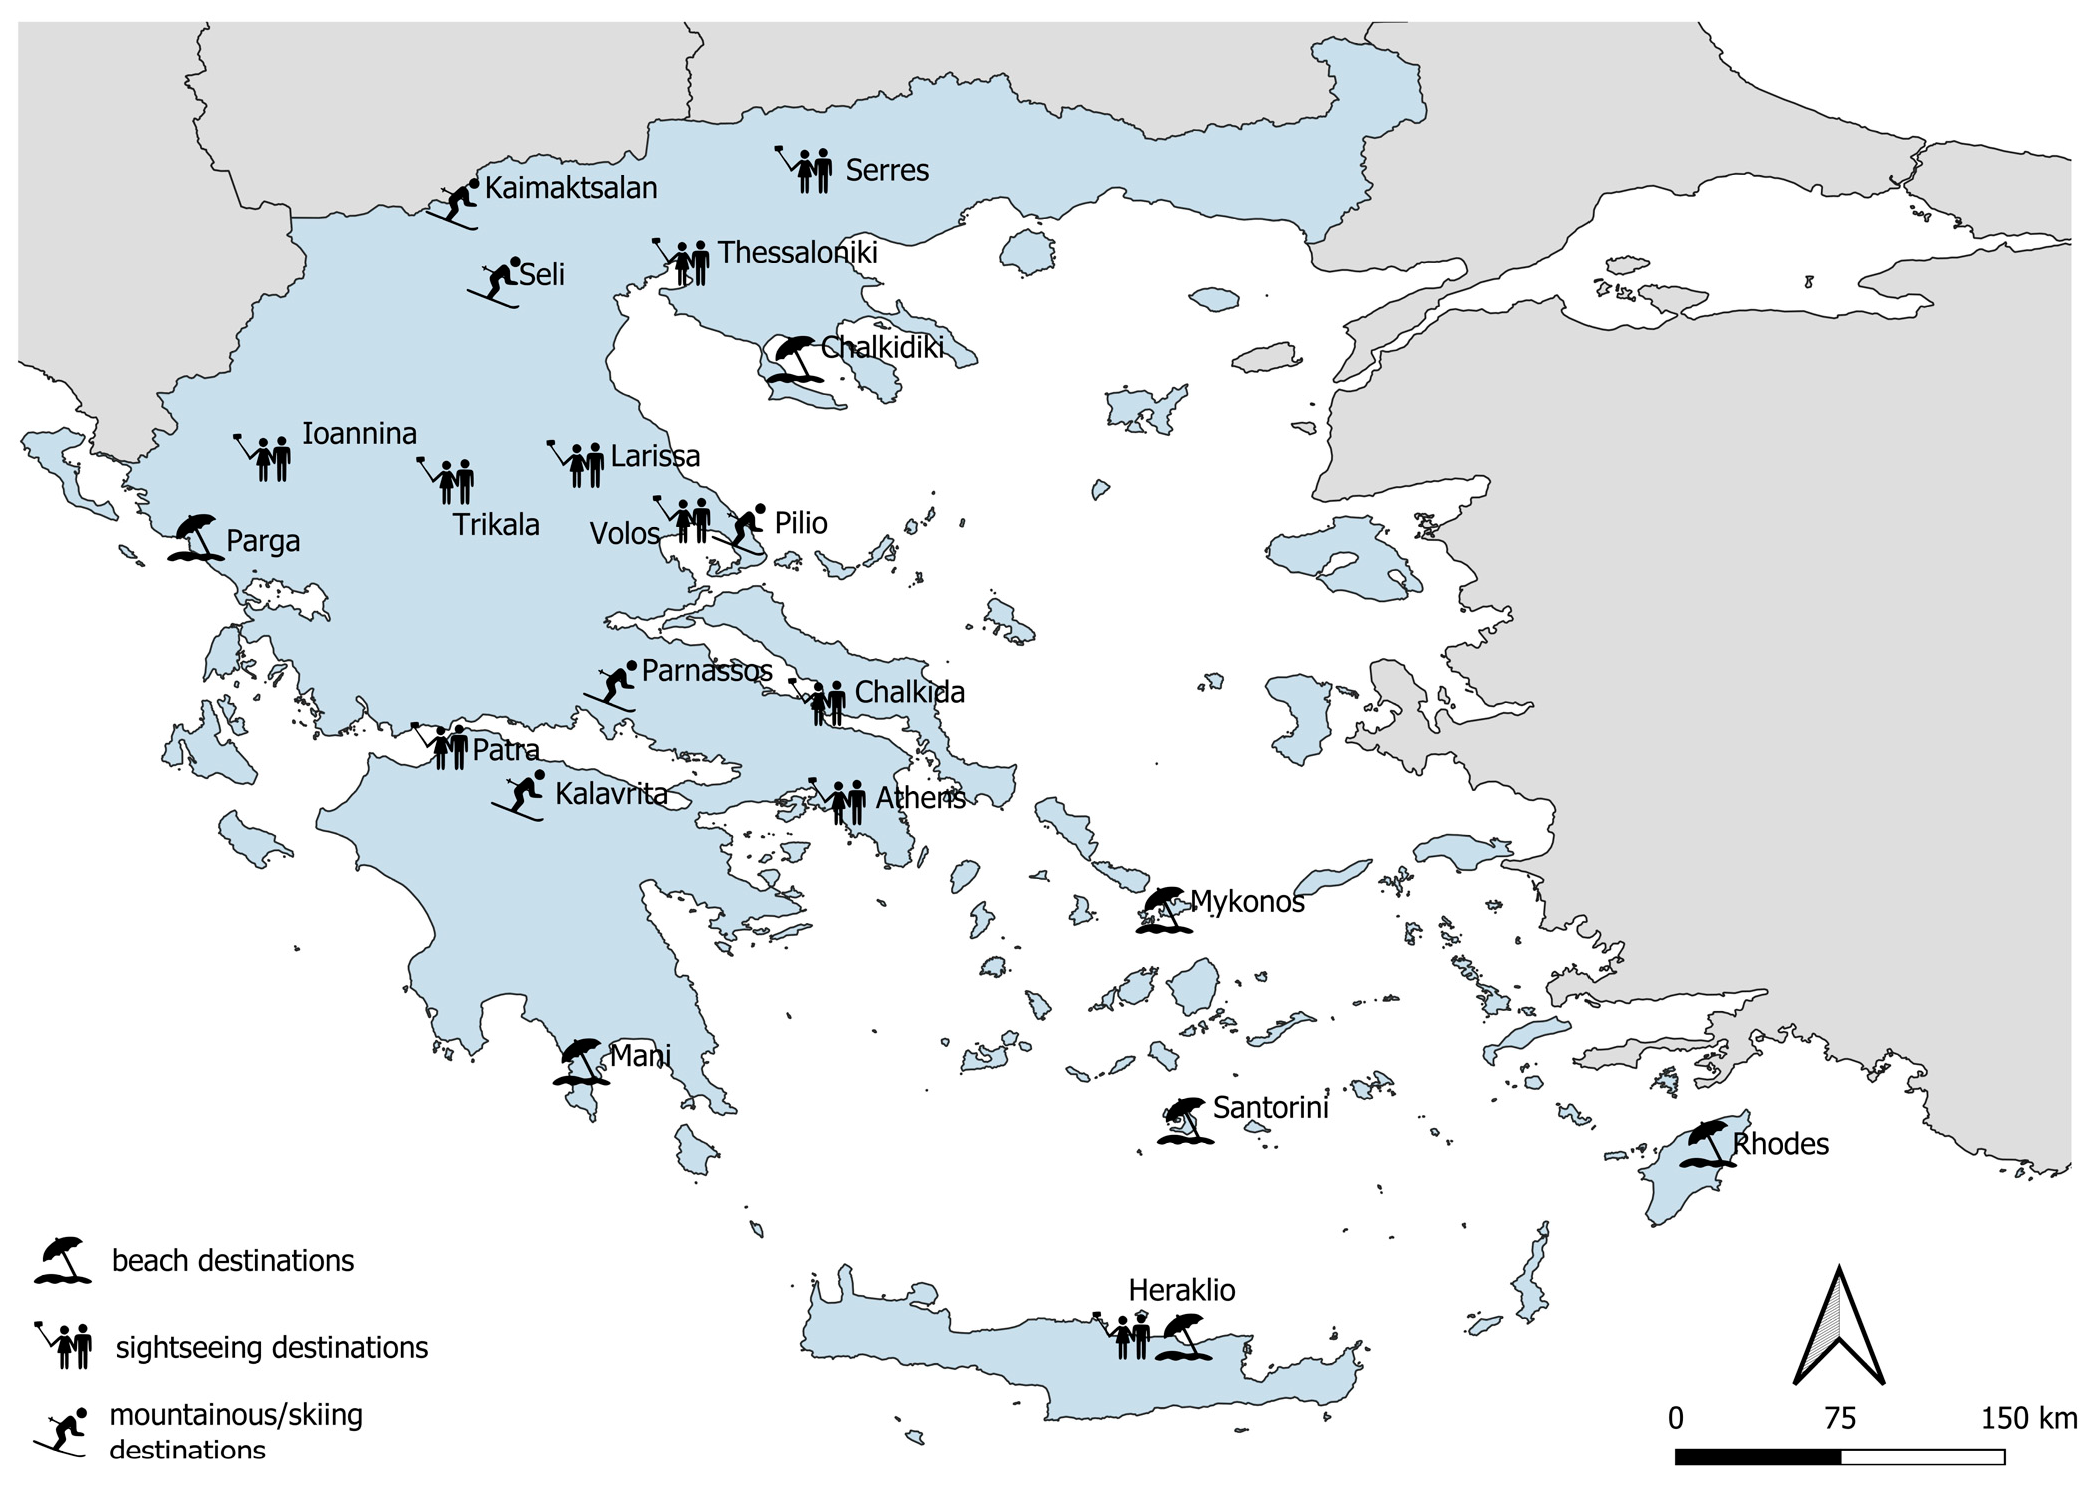
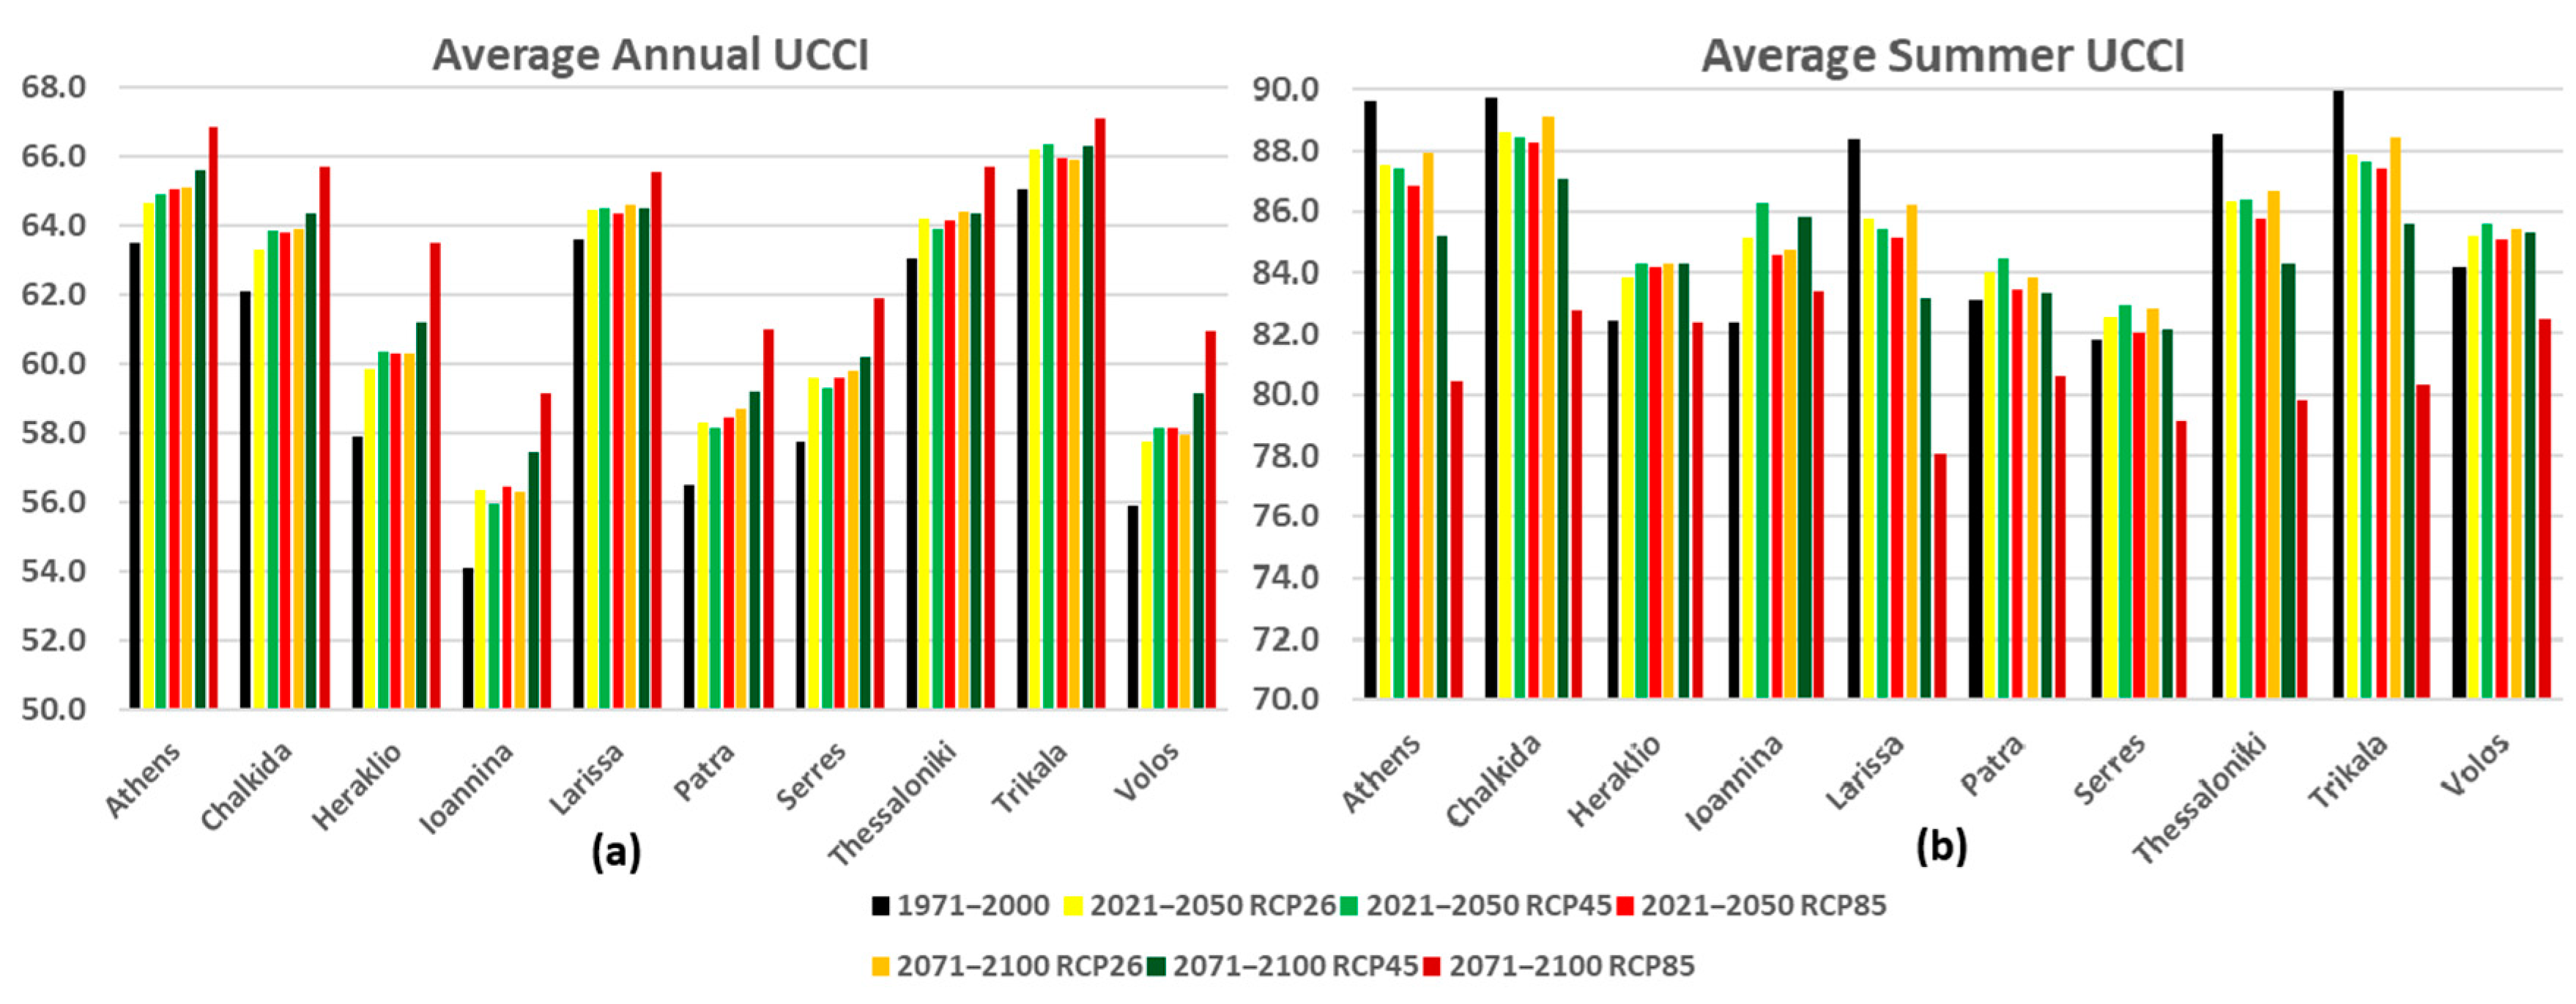
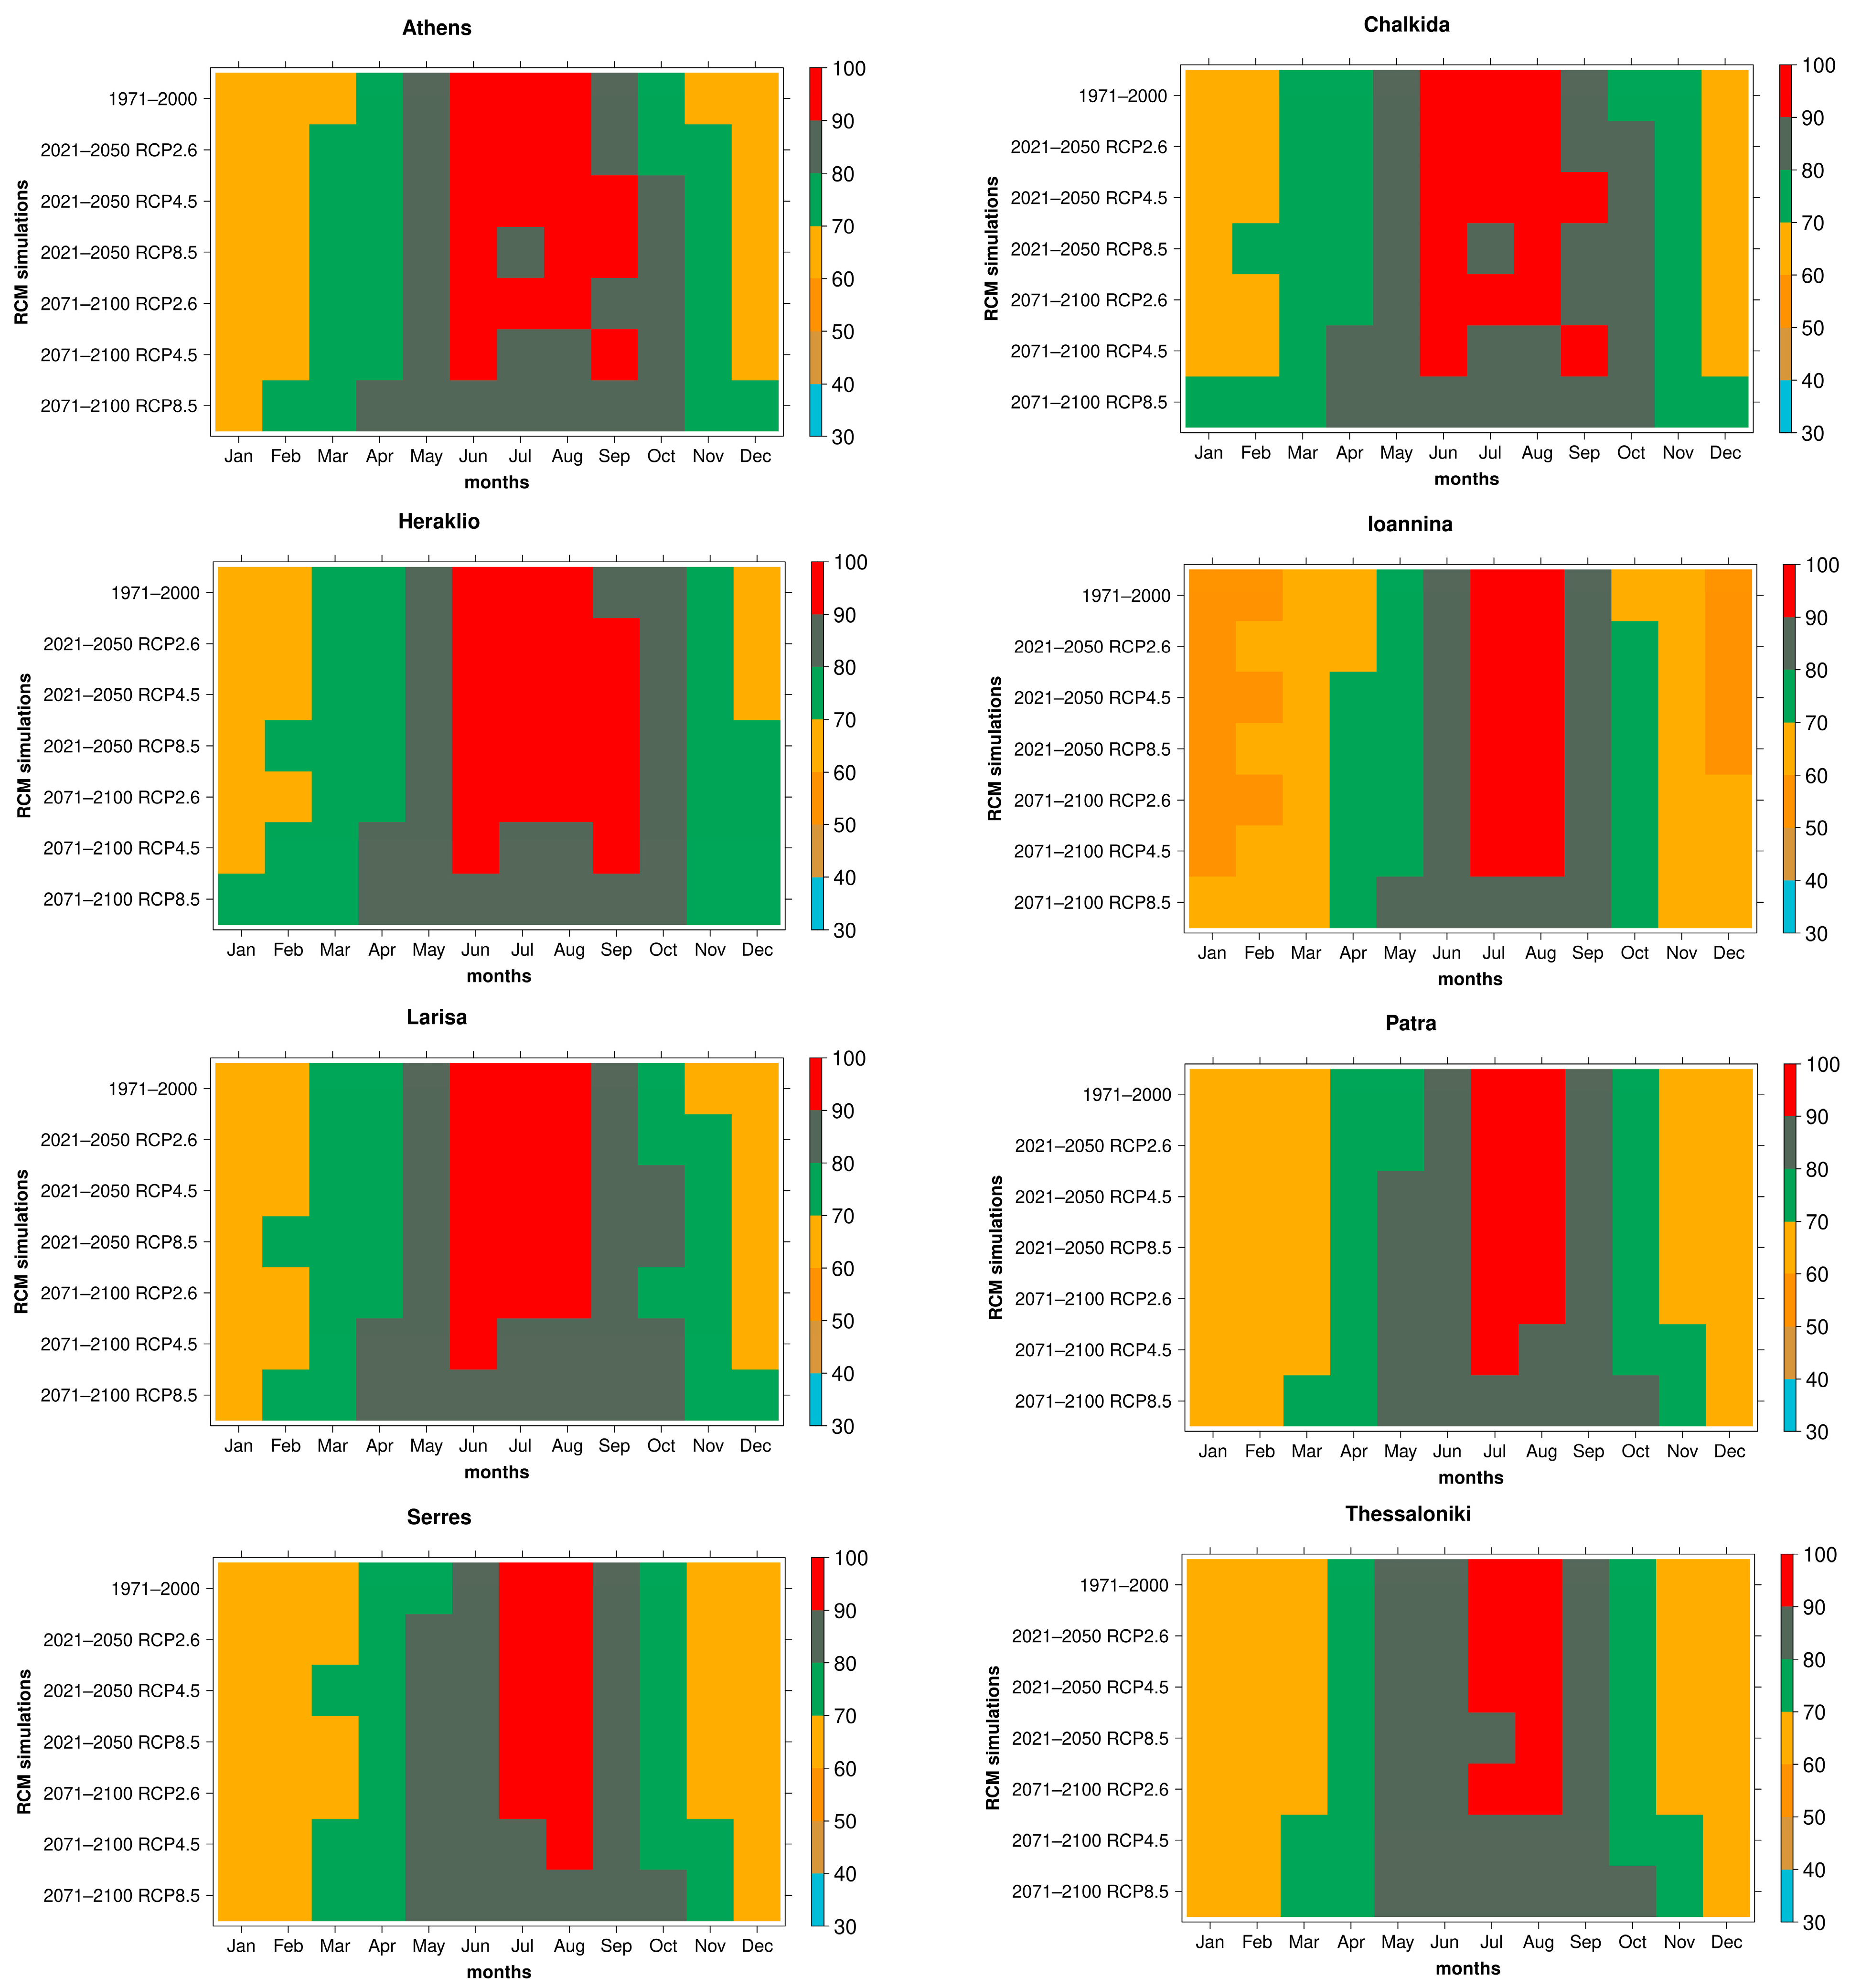
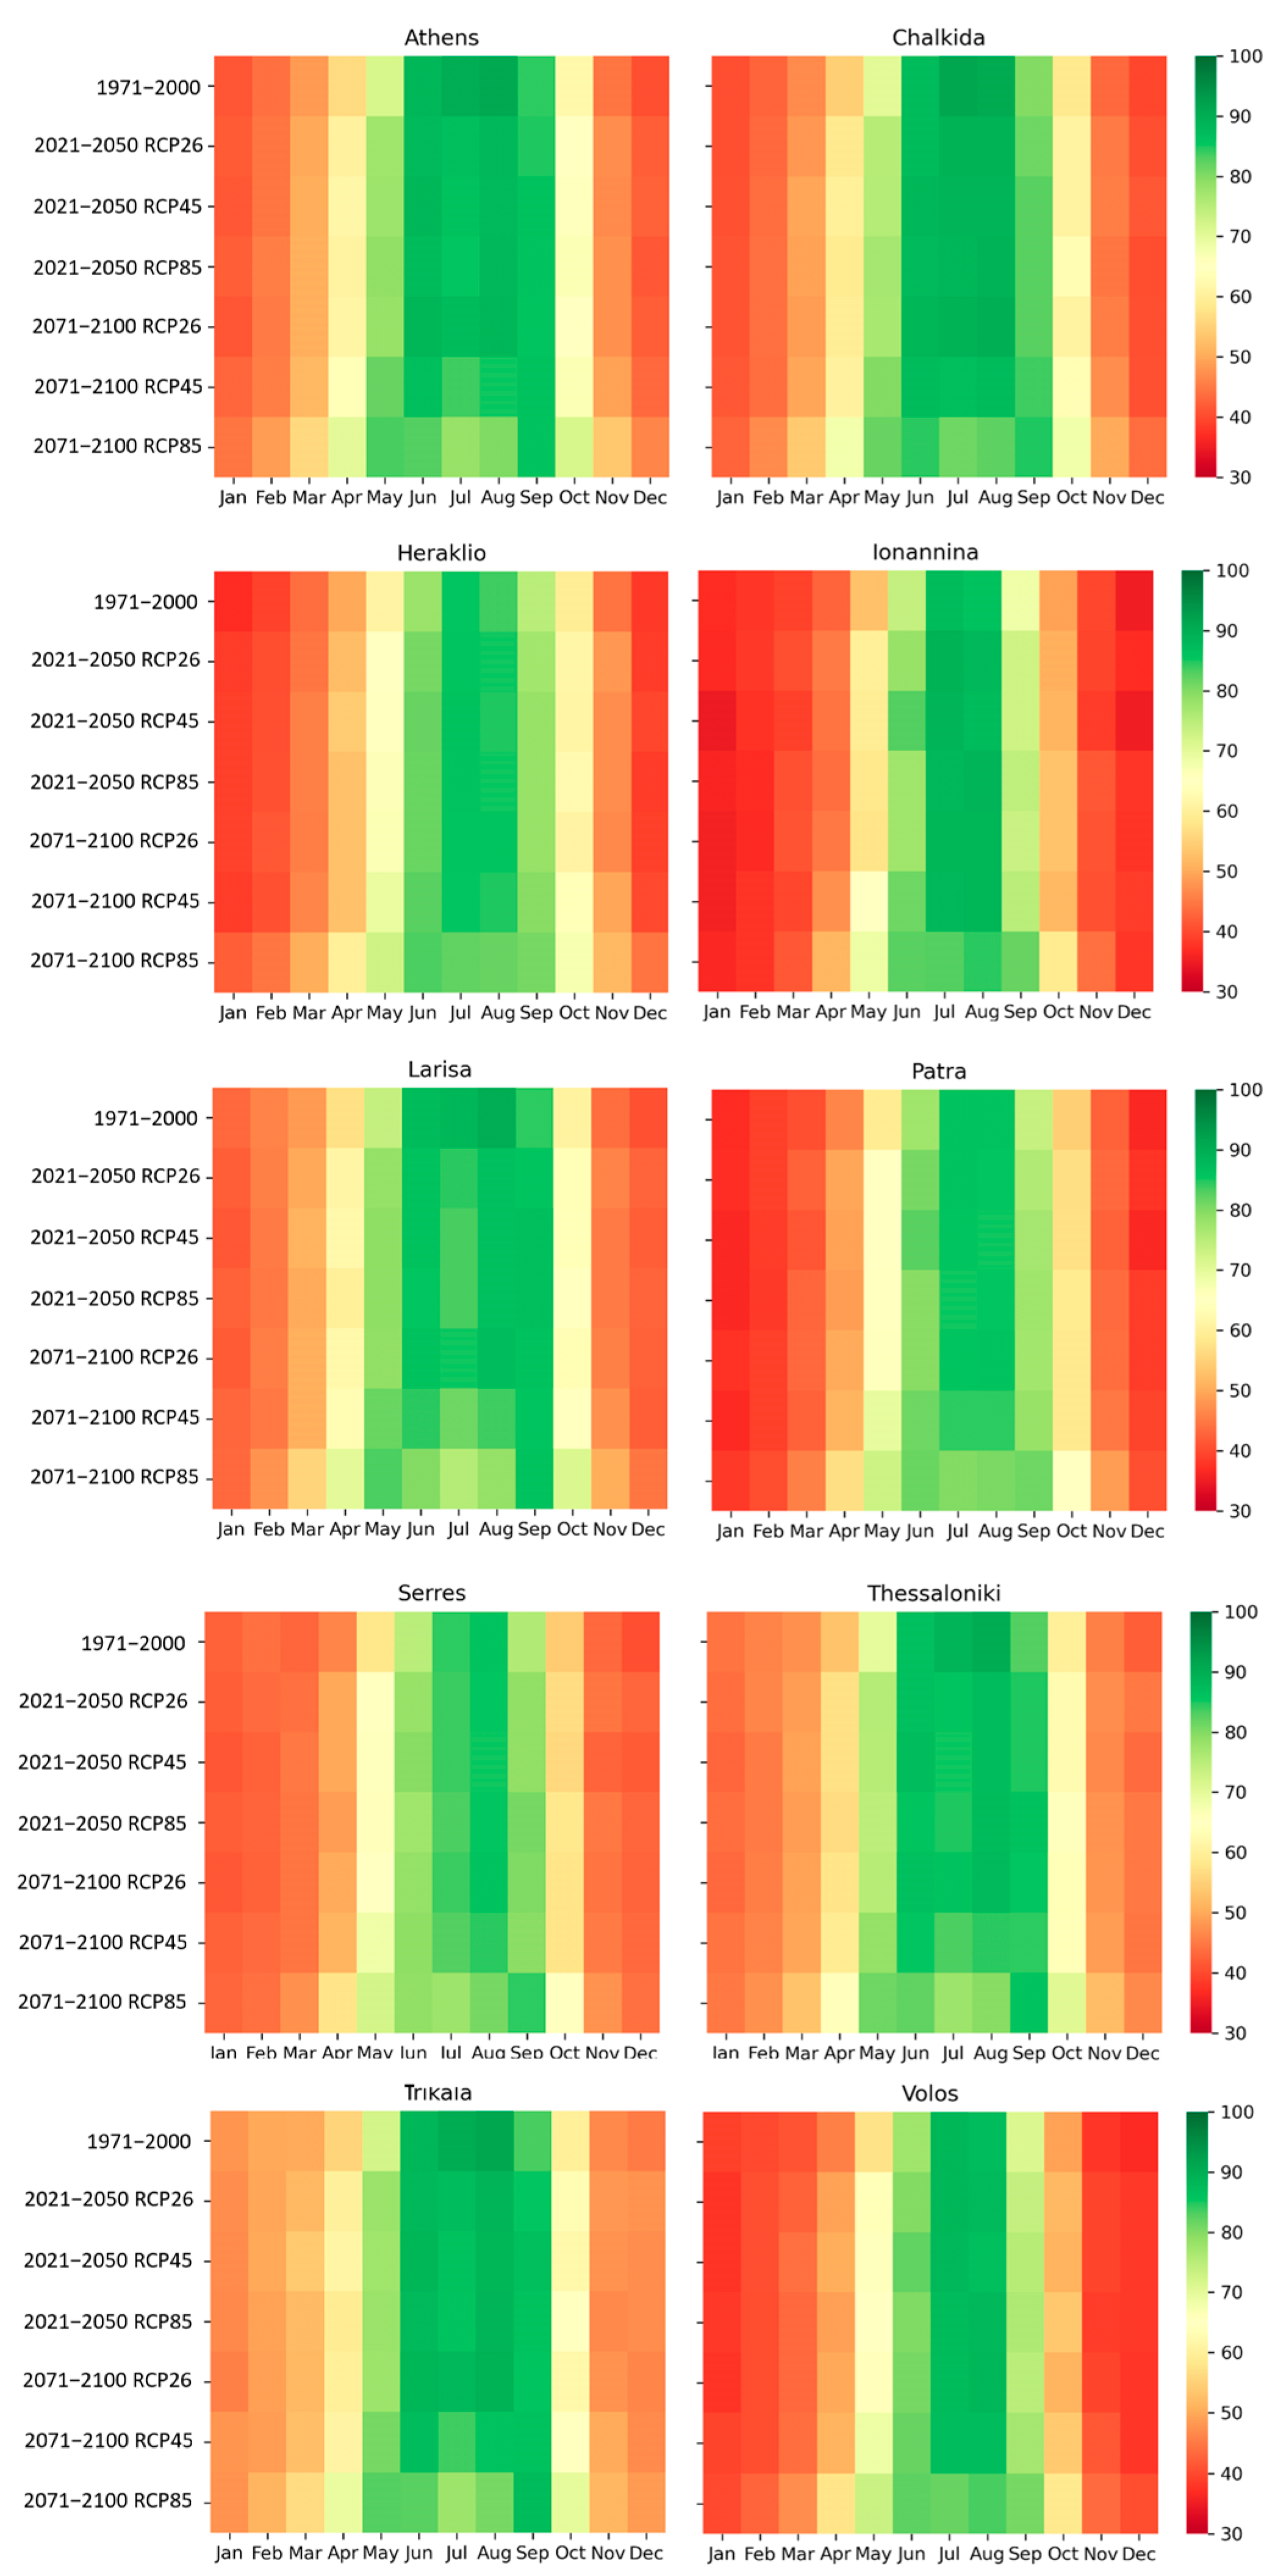
3.1. Urban Tourism

Figure 2 shows the results of the average annual HCI:urban index for the reference period for both the near-future and the end-of-the-century periods under the three RCPs. A statistically robust HCI:urban increase is found over the entire domain for both the examined periods under all RCPs. Nevertheless, the increase is, on average, very limited; thus, the HCI:urban projections are found within the very good condition category under all examined scenarios, similar to the reference period. Regarding the seasonal results (Supplementary Materials—Figure S1), in winter (DJF), the simulations indicate good conditions, averaged over the entire domain, under all periods and RCPs examined. In the spring (MAM) and autumn (SON) periods, the conditions lie within the very good category, while several areas by the end of the century and under RCP8.5 are found to change from very good to excellent conditions (e.g., Attica, low altitude areas in Peloponnese, Crete, Rhodes, etc.). In the summer (JJA) period, a drop in the conditions from ideal to excellent is shown, with the change being more apparent under RCP8.5 and by the end of the century. Nevertheless, the average conditions remain in the excellent conditions category for the entire study area.
Regarding the annual average value of UCCI, for the reference period, it varies from 54.1 to 65.0 and corresponds to acceptable and good conditions. An improvement in the annual average UCCI is expected under the future climate for all regions and scenarios, with the increase being higher at the end of the century, mainly due to the increase in temperature (Figure 3a). A worsening of the conditions for urban tourism during the summer months is estimated for most destinations under all RCP scenarios in both future periods (Figure 3b), as the increase in maximum temperatures during summer months has a negative effect on the UCCI index. However, all destinations are still characterized by excellent conditions during summer (UCCI values > 80) except for Larissa, Serres and Thessaloniki at the end-of-the-century period under the RCP8.5 scenario. A two-sample t-test was used to assess the significance of the changes. According to the results, all locations exhibit statistically significant changes (p-values < 0.05) under all RCP scenarios for both annual and summer UCCI values (Table S1 Supplementary material), with the exception of UCCI annual values for Larissa under RCP4.5 and RCP8.5 scenarios for the period 2021–2050.
In line with the average annual and seasonal HCI:urban and UCCI changes, an increase in the average number of days per year with good to ideal conditions with respect to the reference period is projected for all the examined periods and scenarios. For HCI:urban, the average increase is less than 10 days/yr for the near-future period under all RCPs increase as well for the distant-future period under RCP2.6, whereas the highest increase is shown by the end of the century under RCP8.5, reaching an average of approximately 20 extra days/year (Supplementary Materials—Figure S2). Regarding UCCI, an increase of 8–16 days/year was projected in all regions for the near-future period and under all emission scenarios (Supplementary Materials—Figure S3a). By 2100, the expected changes in the three scenarios will differ. The increase in good to ideal days is quite significant under the RCP8.5 scenario (15 to 30 additional days/year), modest under the intermediate scenario RCP4.5 (up to 11 additional days/year) and minimal under the RCP2.6 scenario. Opposite signs compared to HCI:urban are found in Larissa, Trikala, and Thessaloniki, where a reduction in the number of days with good to excellent conditions under RCP2.6 and RCP4.5 at the end of the century is projected. During the summer months, an increase in the number of days with good to excellent conditions (UCCI values > 60) is expected in the near future in all urban destinations (up to six days in Ioannina and up to three days in the other destinations) and under all RCPs. In contrast, in the period 2071–2100, a decrease in the number of days with UCCI values > 60 is expected for almost all destinations (1 to 6 days) except for Ioannina (Supplementary Materials—Figure S3b).
Figure 4 and Figure 5 depict the average annual cycle of the HCI:urban and the UCCI values, respectively, for the selected destinations. According to the results, climatic suitability for urban tourism in the examined destinations is expected to improve during most of the months of the year, except for the summer months, when the suitability for urban tourism decreases due to the increase in temperature in the majority of urban destinations. However, summer months are still characterized by good to excellent conditions. The period of good to excellent conditions for urban tourism is expected to extend to ‘shoulder’ seasons (i.e., April–May and September–October) for almost all examined destinations. Despite the improvement in conditions, winter months remain unfavorable for urban tourism. Moreover, days with unacceptable conditions are still evident in all simulations for the coldest months of the year and at all selected locations (Supplementary Materials—Figure S4). The percentage of days/month with unacceptable conditions is in the range of 5–10% per month in the majority of the locations, with the exception of Ioannina, where the percentage ranges from approximately 15 to 20% (/month) for the first two and last two months of the year, depending on the future period and scenario examined. Lower percentages (6–10%) are found for March, April and October.

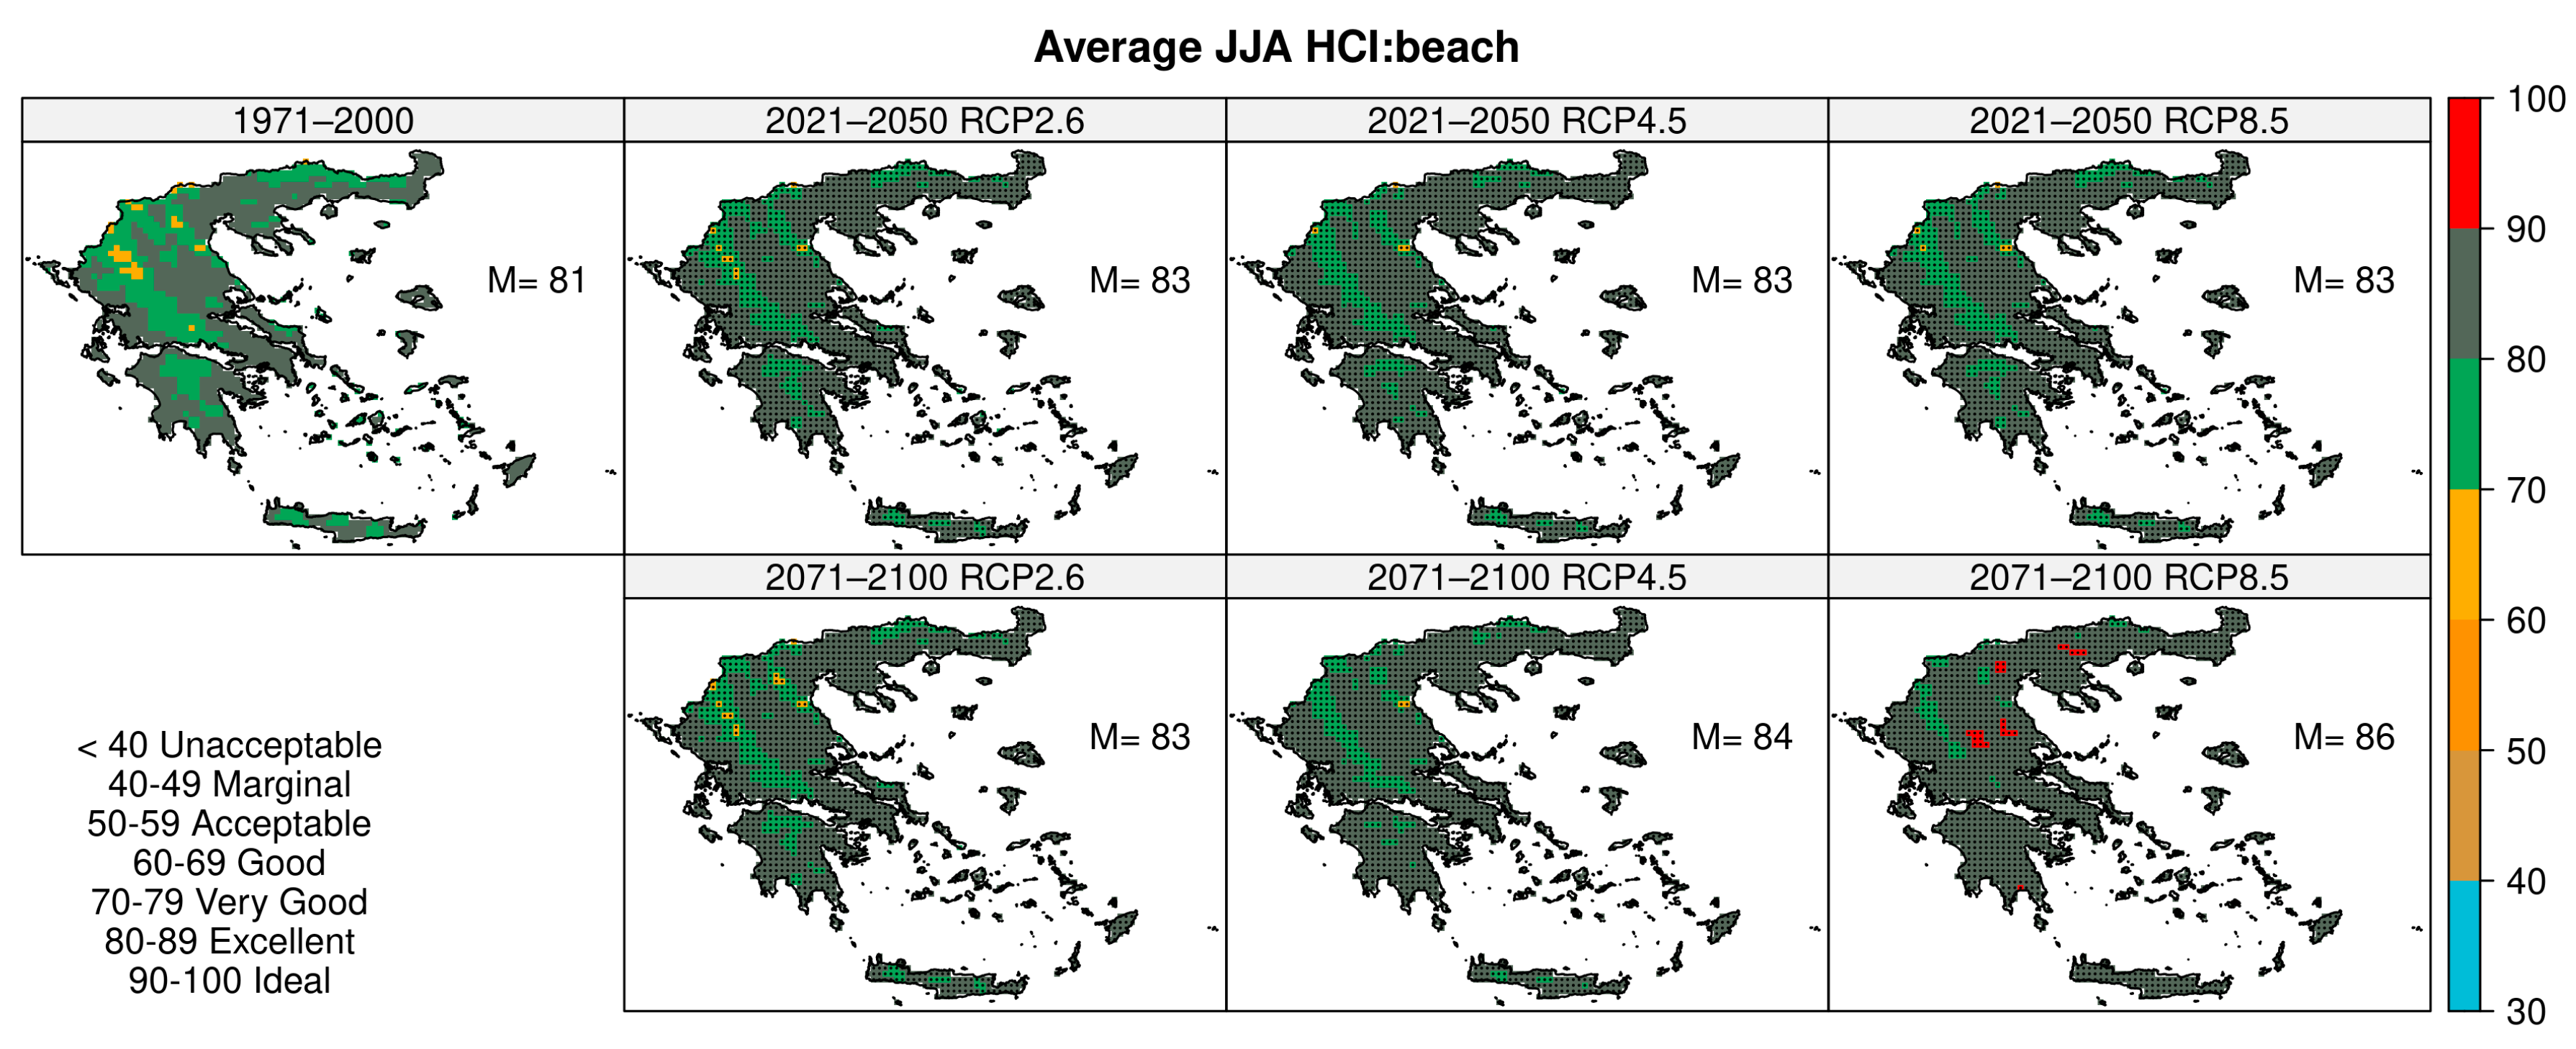
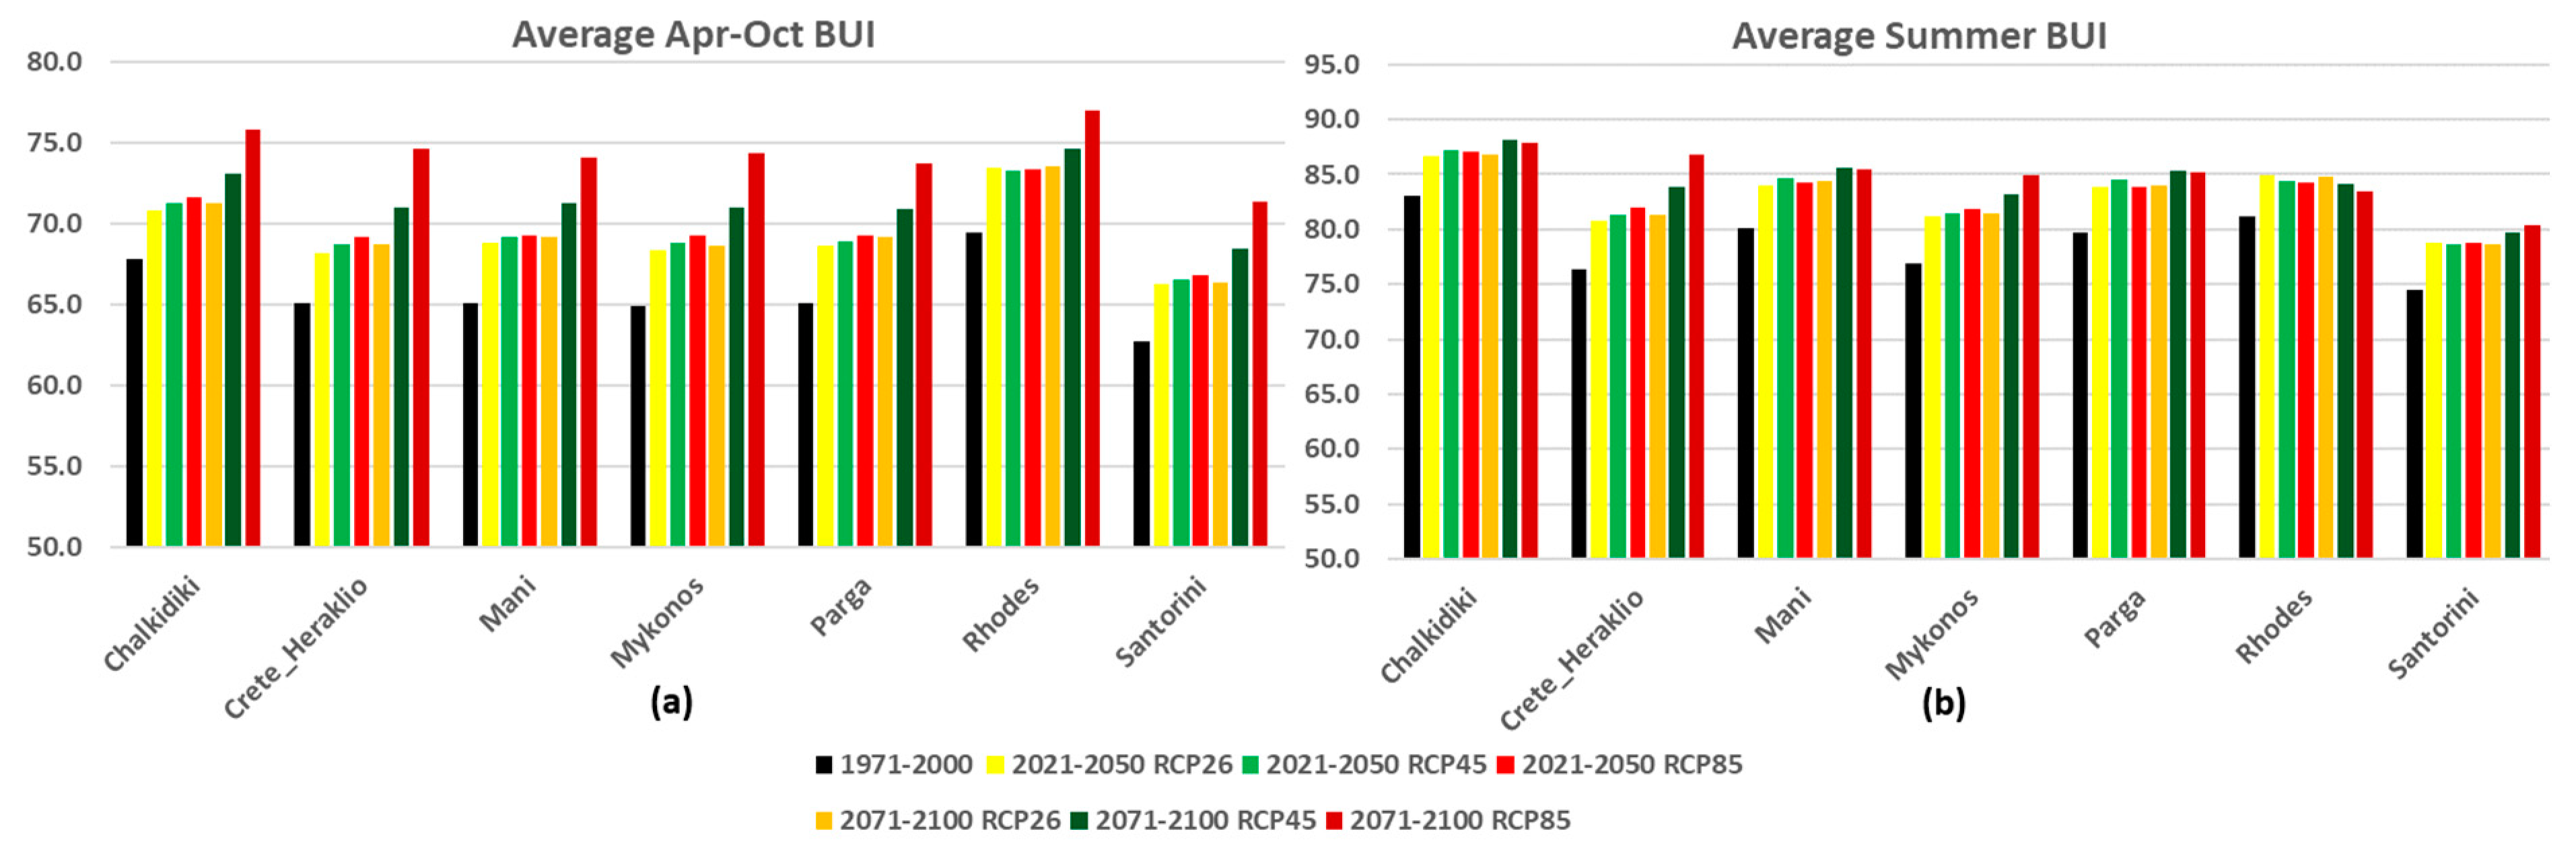
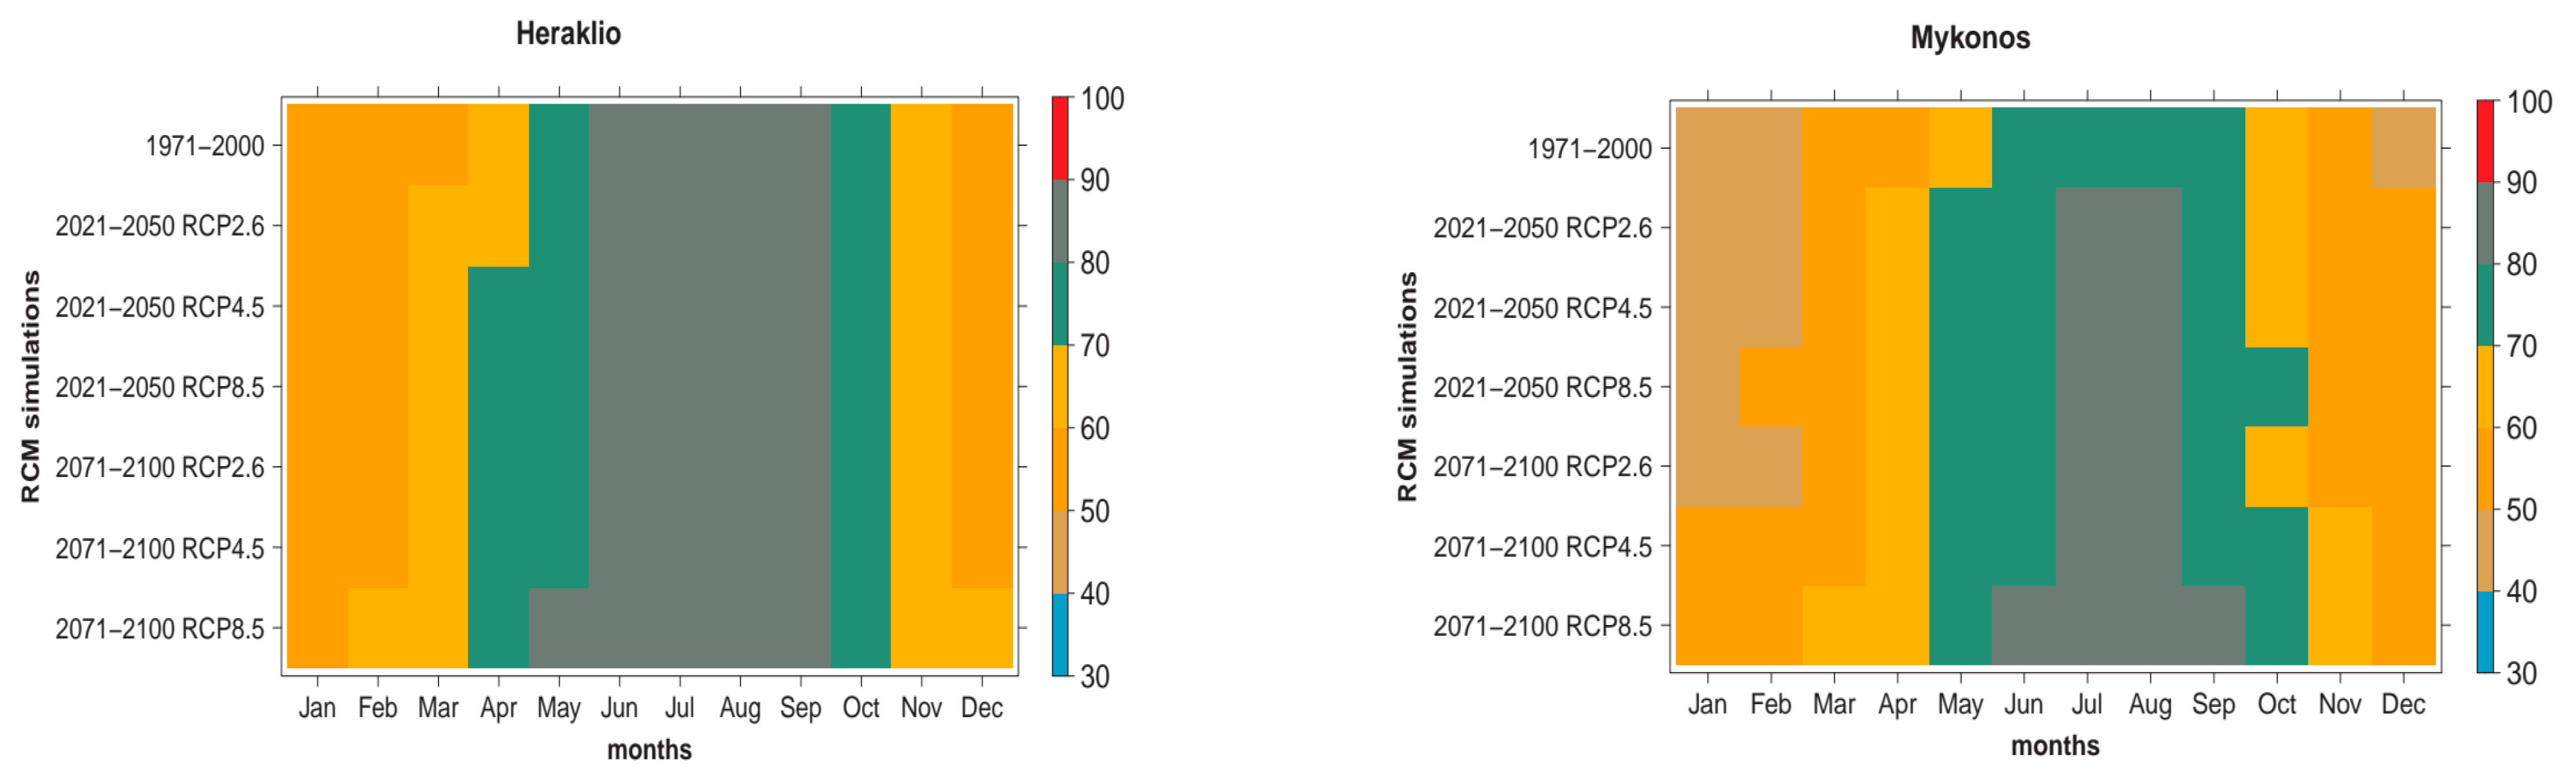
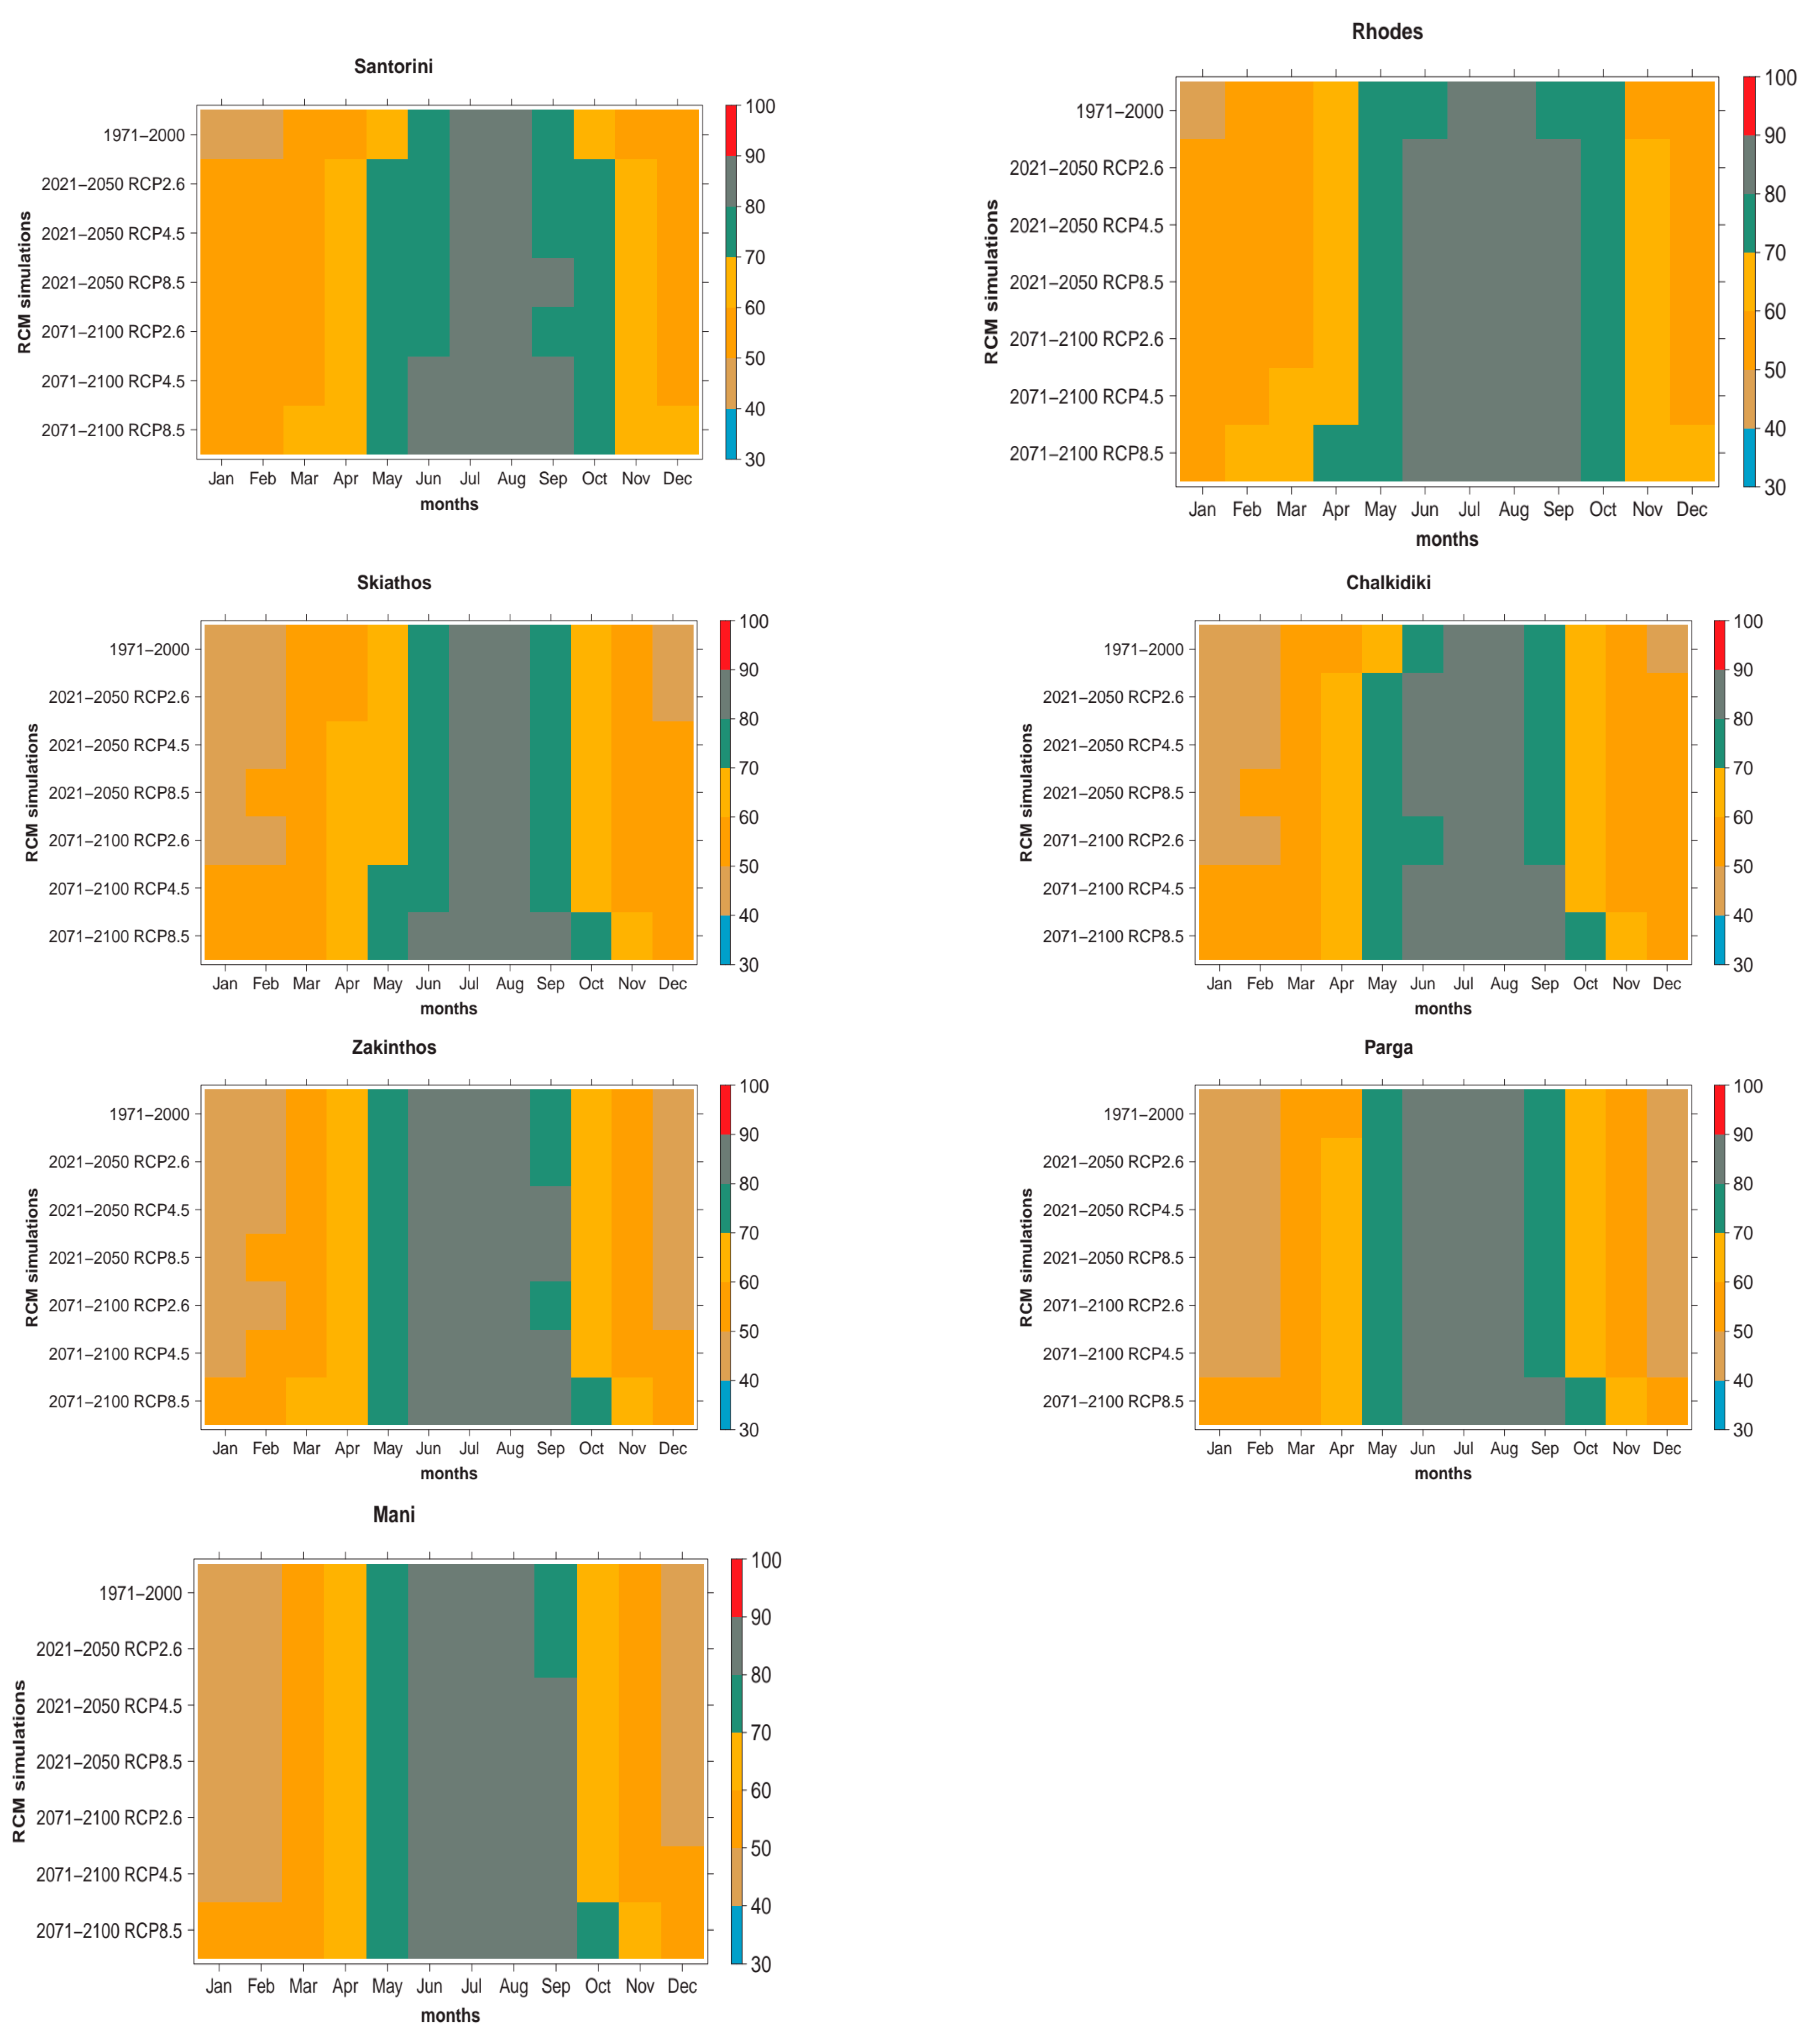
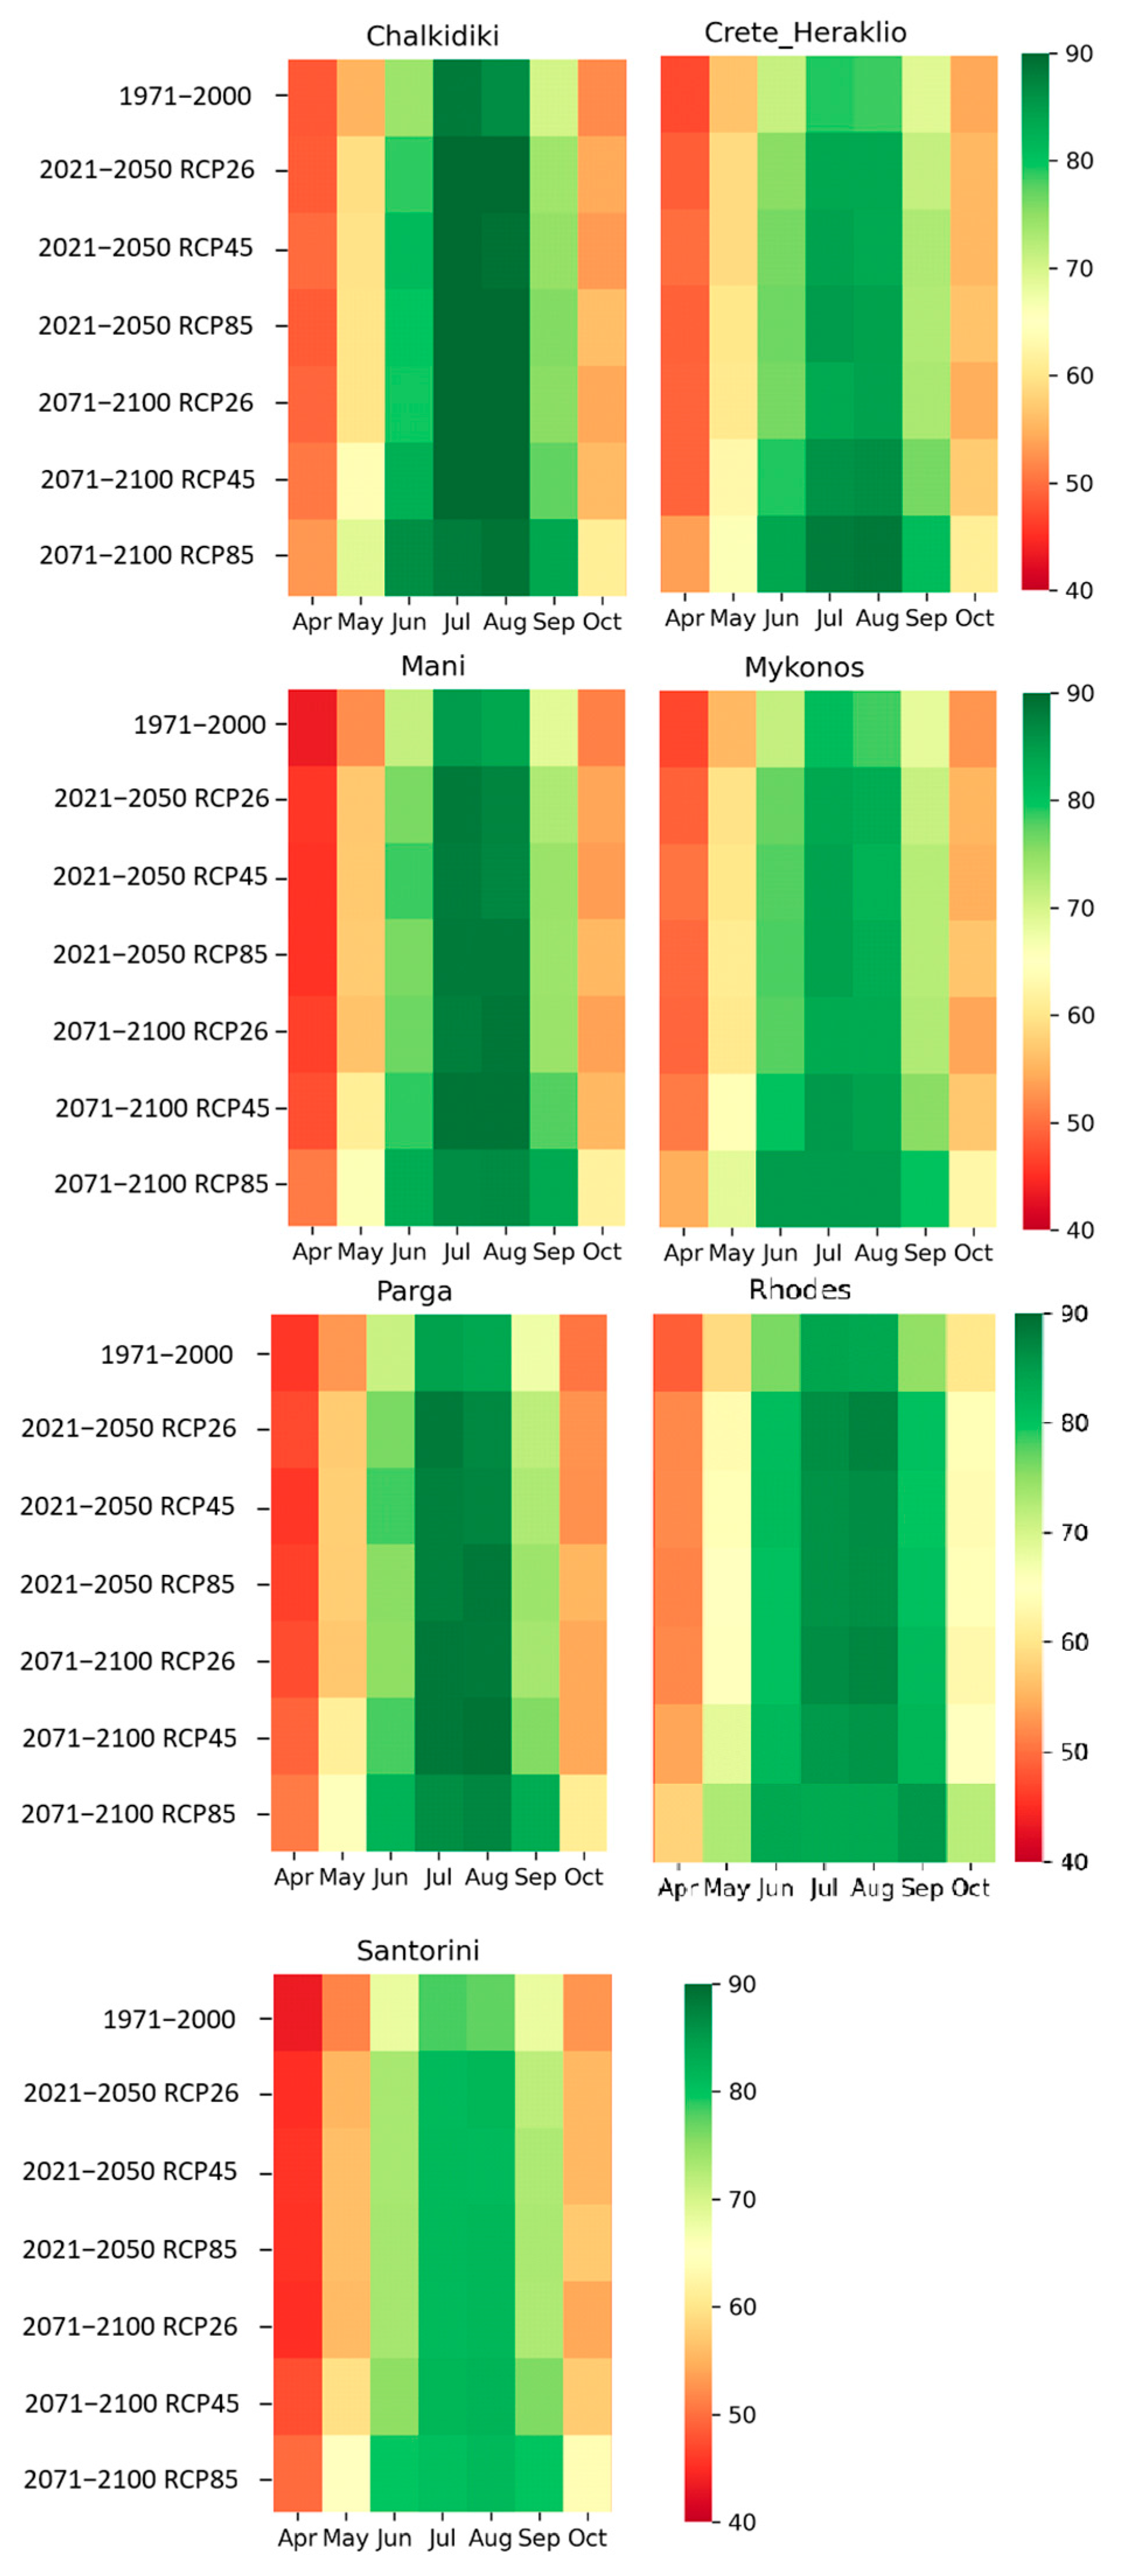
3.2. Beach and Island Tourism

The peak period for beach tourism in the Mediterranean is mainly summer months, while ‘shoulder’ periods include April–May and September–October. In Figure 6, the results of the average summer HCI:beach for the reference period as well as for the near-future and the end-of-the-century periods under the three RCPs are shown. From the figure, a statistically robust HCI:beach increase is evident over the whole domain for both the examined periods and under all examined RCPs. Nevertheless, the increase is, on average, lower than 10 HCI units; thus, the HCI:beach projections are found within the excellent conditions category under all examined RCPs, similar to the reference period. The average BUI values for the peak months during the reference period in seven popular summer destinations in Greece vary between 75 and 83 and correspond to very good and excellent conditions (Figure 7b). If the ‘shoulder’ periods are considered, then the estimated average values of BUI vary between 60 and 70 and correspond to good conditions (Figure 7a). In the future period, an increase in the BUI values is expected, mainly owing to temperature increases in all destinations and scenarios. The increase is significant for the period 2071–2100 under RCP8.5, with all destinations characterized by excellent (for the summer period) and very good (for the period from April to October) conditions.
Figure 8 shows the average annual cycle of the HCI:beach values for selected top summer tourist destinations and for all climate simulations. The results indicate a lengthening of one month in the period with excellent conditions, either at the beginning or the end of the respective period of the reference years. The timing of this change in each location depends on the scenario and the period examined. For instance, in Heraklio, the June to September excellent conditions period extends to include May by the end of the century and under RCP8.5, while for Rhodes, June and September are added to the July–August period in both future periods and under all RCPs. Similar results are found for BUI (Figure 9), where climatic suitability is expected to improve during all months of the period from April to October, with June and September being the two months with the highest improvement found for the indicator. At the end of the century and under the RCP8.5, the attractiveness of beach tourism during these two months is expected to improve, thus showing an extension of periods with ideal conditions for beach tourism. This improvement is statistically significant across all analyzed locations under all future climate scenarios (Table S1 in Supplementary Material).
For HCI:beach, the average April–October increase in the number of days with very good to ideal conditions (HCI:beach > 70) for all locations for the near-future period under all scenarios is about 10 days/season, with a minimum increase of about 4 days/season in Heraklio under RCP2.6 and a maximum increase of approximately 17 days/season in Mykonos under RCP8.5 (Supplementary Materials—Figure S5). For the distant future, the average increase over the examined locations reaches about 17 days/season with a minimum increase of approximately 6 days/season and a maximum increase of nearly 34 days/season in the above-mentioned destinations and under the same RCPs, respectively. Additionally, for BUI, an increase of 6–14 days per year (Supplementary Materials—Figure S6a) with good to ideal conditions in all regions for the near future under all RCPs is projected. By the end of the century, the increase is higher under the RCP8.5 (10 to 20 additional days per year), lower under the intermediate scenario RCP4.5 (2 to 9 additional days per year), and minimal under the RCP2.6 (−2 to +2 days per year). During peak summer months, 2 to 6 additional days per year with good to excellent conditions (BUI values > 60) are expected in the near future, while at the end of the century, a decrease of up to 4 days is expected under all RCPs (Supplementary Materials—Figure S6b).

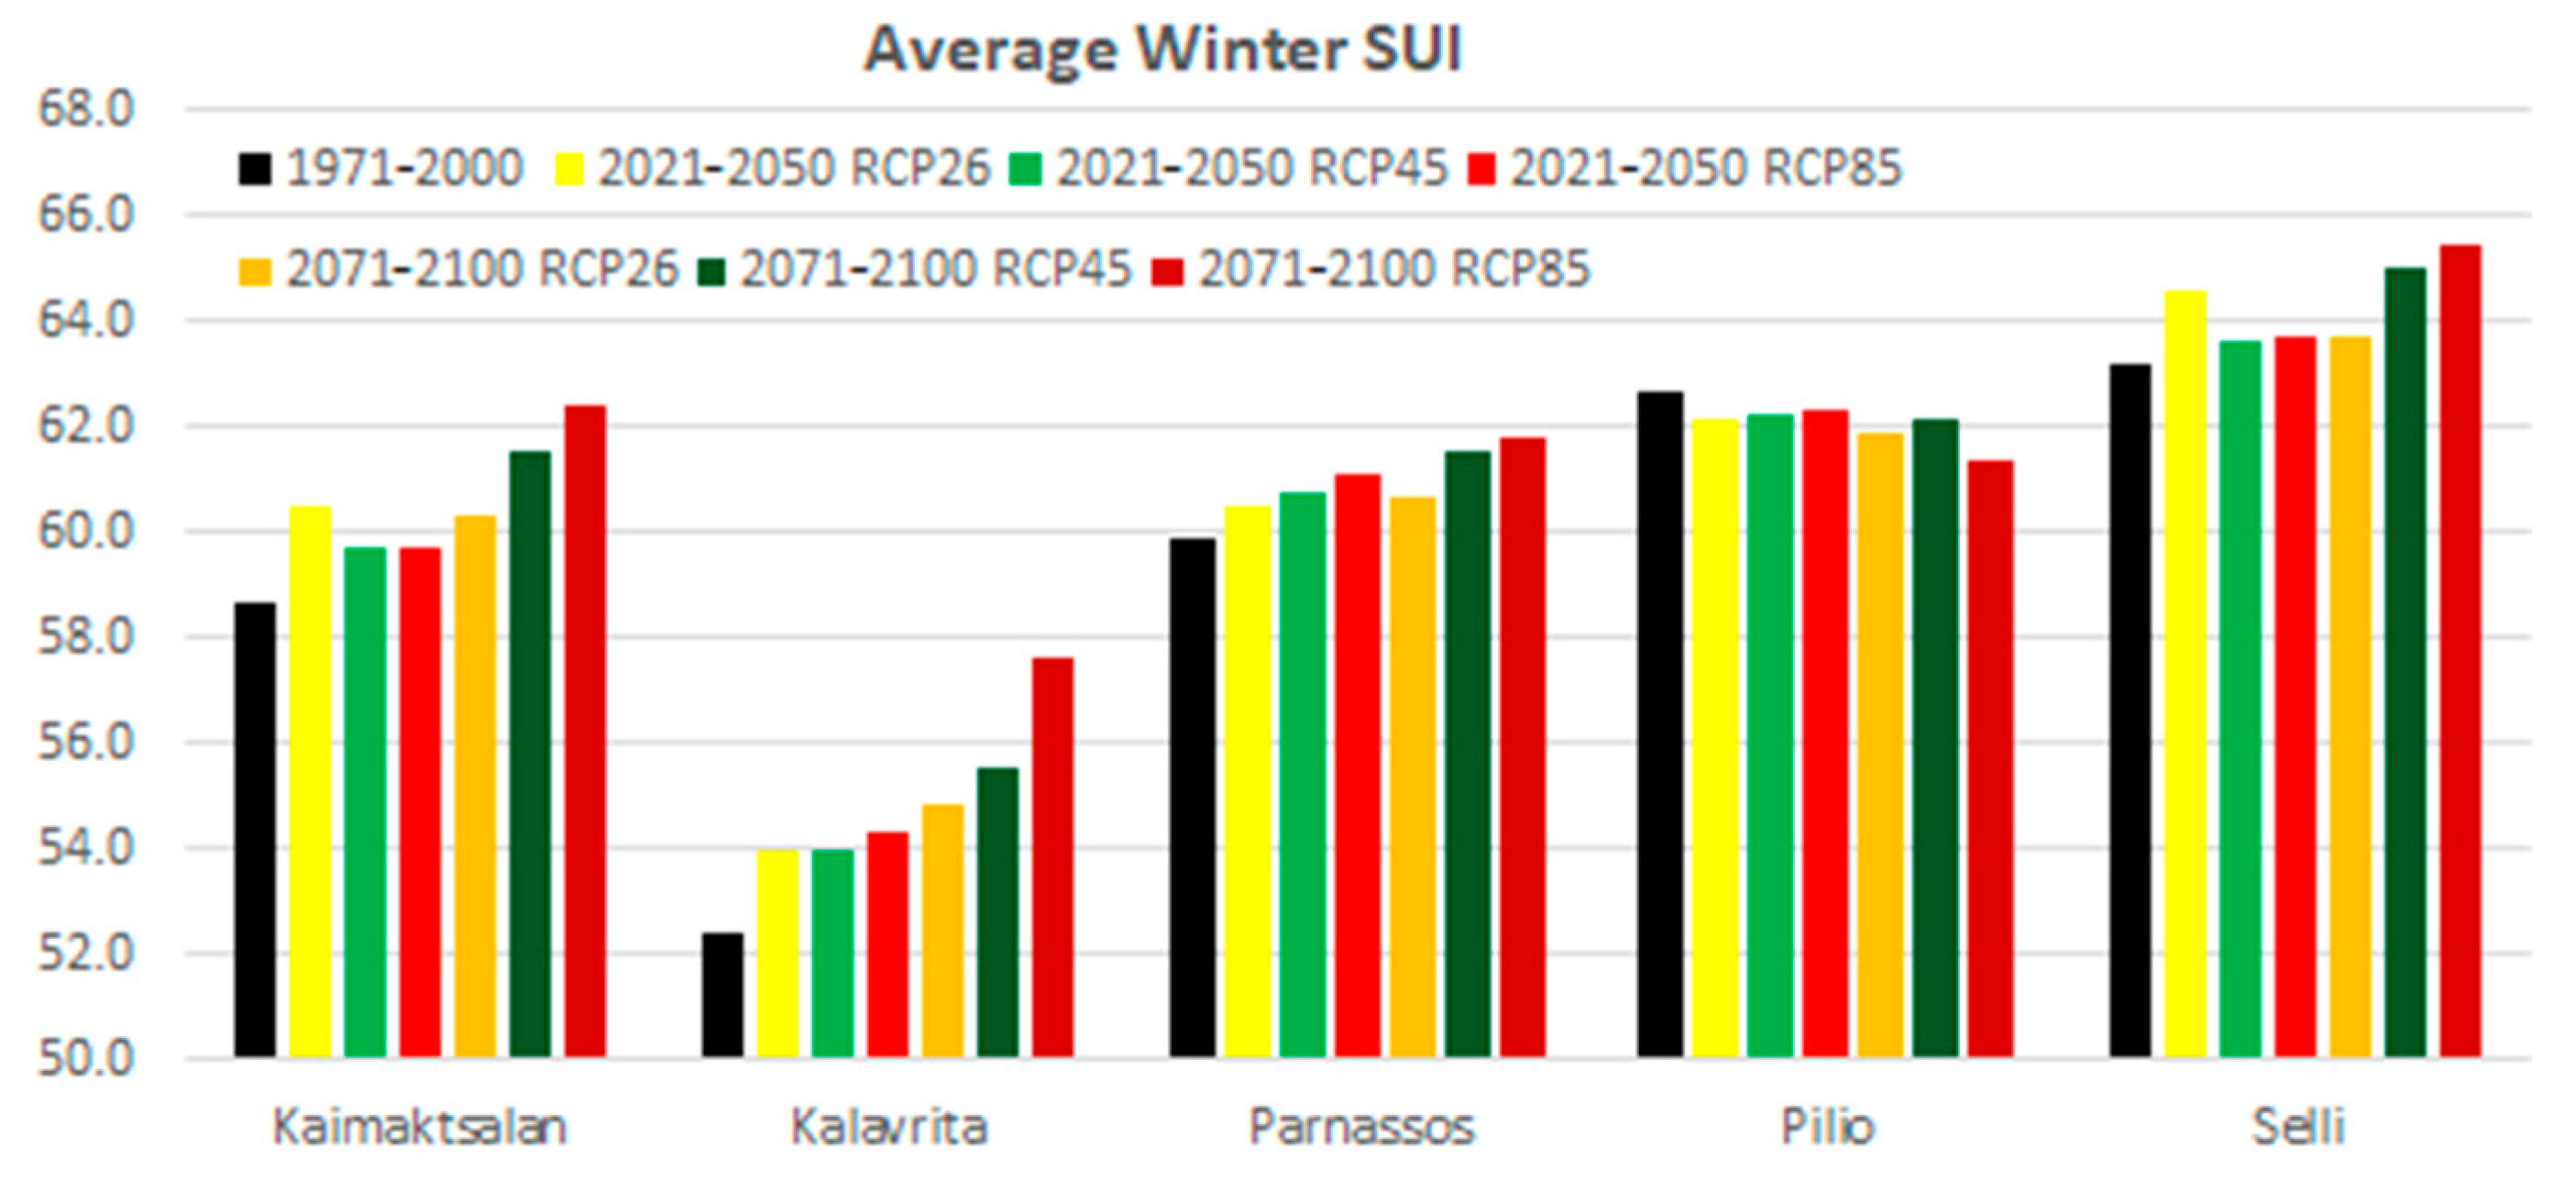
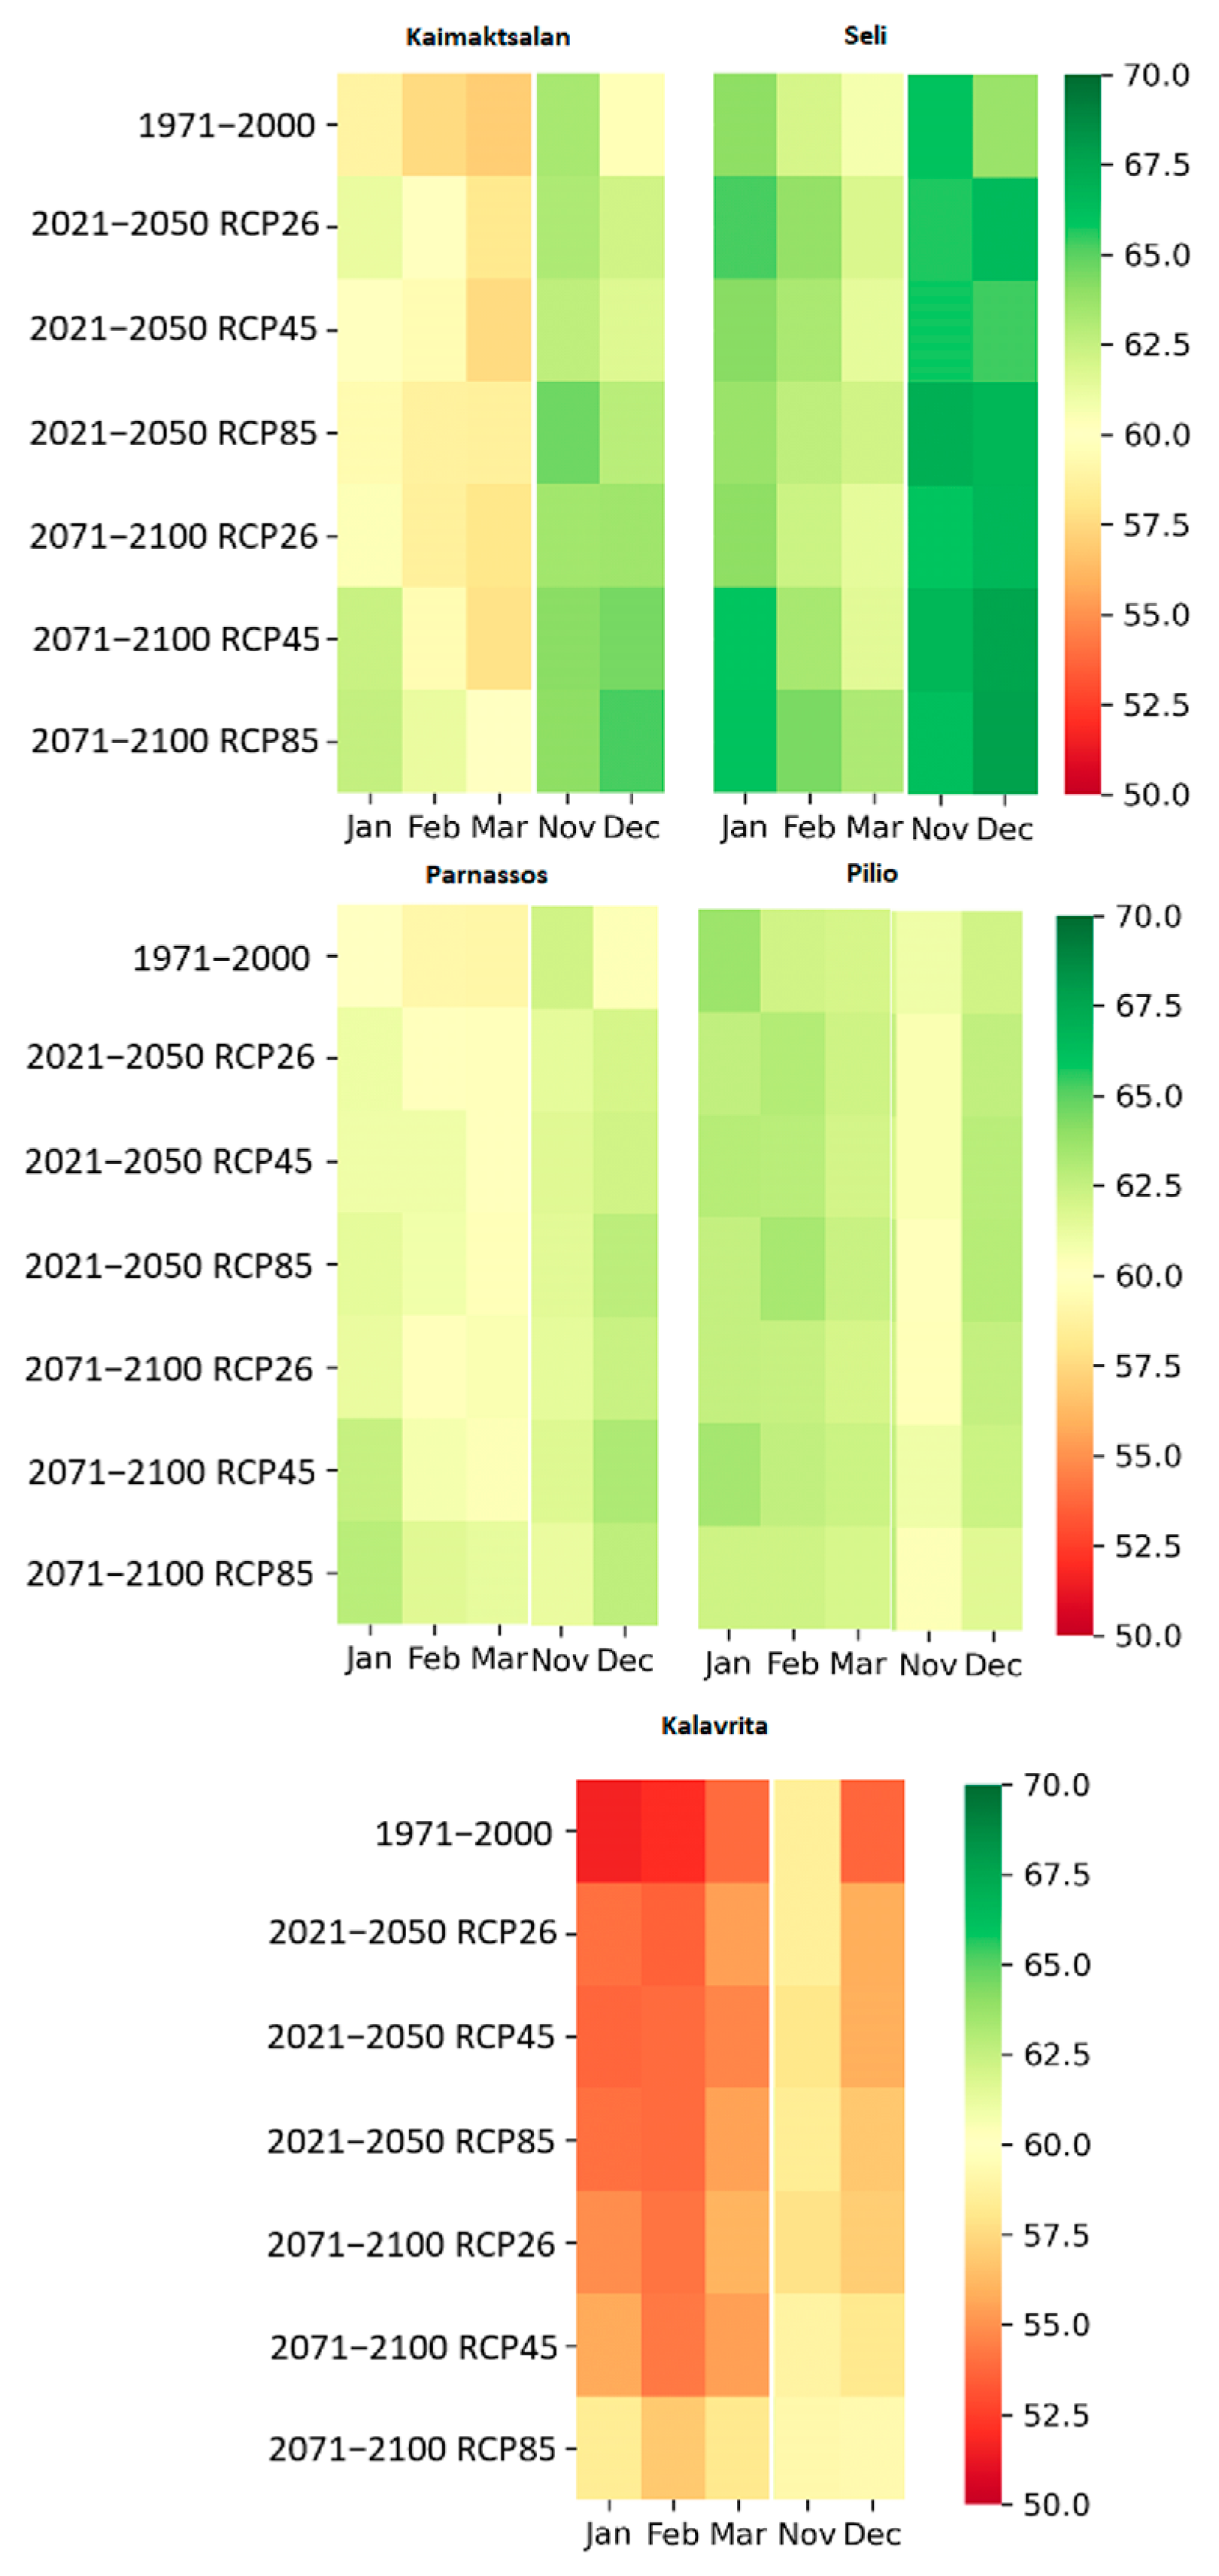
3.3. Mountainous Winter Tourism

Figure 10 shows the results of the average MWCI for the reference period and the two future periods under the three RCPs for five mountainous locations in Greece that attract a significant number of tourists during winter. It should be noted that in all these locations, there are ski resorts (operating without artificial snow). An increase in the index in both future periods under all scenarios is evident for all locations except for Pelion Mountain. The attractiveness of Parnassos and Kaimaktsalan, based on the average MWCI, increases from acceptable to good, while it remains stable for the other locations. On a monthly basis, there is an improvement in the average MWCI value during the peak months (DJF) for the four mountainous locations, except for Pelion during January (Figure 11).
The MWCI values during November are shown to decrease, whereas the March values increase in all locations. The changes in absolute terms are not significant (up to 4 MWCI units) and there is no change in the attractiveness classification of the five ski resorts for these two shoulder months. The observed changes are statistically significant in most mountainous resorts with the exception of Kaimaktsalan under RCP4.5 scenario for the period 2021–2050, Pilio and Seli under RCP4.5 and RCP8.5 scenarios for the period 2021–2050, Seli under RCP2.6 scenario for the period 2071–2100 and Pilio under RCP4.5 for the period 2071–2100 (Table S1 in Supplementary Material).
Regarding the number of days per year with good to excellent conditions (Supplementary Materials—Figure S7), an increase of 2–10 days per year is expected during the winter months for all destinations in the near future. More days with good to excellent conditions for mountainous winter tourism at the end of the century are expected for all locations, except Pelion Mountain. Although MWCI also covers snow-related winter activities that may be performed in a mountainous location, variables related to snow availability or reliability (i.e., snow cover or snow depth) are not included in the WMCI, as these data are difficult to obtain. Thus, the projected improvement in climatic conditions and the increase in WMCI values for most of the mountainous locations examined do not take into account snow availability and reliability, both of which are expected to be negatively impacted by rising temperatures and decreased snowfall.
The findings of our study are similar to those of other studies in the Mediterranean region. Beach tourism season in Greece will likely expand towards ‘shoulder’ seasons (i.e., April–May and September–October). Rising temperatures during these periods are expected to enhance the appeal of beach activities, allowing tourists to enjoy more favorable conditions while avoiding the extreme heat of the summer under future climates. Similar findings have been reported for the entire Mediterranean region [23,24,28] as well as for specific coastal destinations in Spain [29,30], Turkey [31], Egypt [18], Italy [32], and Tunisia [32]. As shoulder seasons are expected to become more attractive for beach tourism destinations, tourist operators should consider marketing strategies to promote tourism during off-peak periods. Additionally, coastal areas should invest in infrastructure for adaptation to heat and drought (e.g., shaded areas, sustainable space cooling, improved access to water, and more efficient water use) to ensure comfort during the hotter and drier summer months.
According to the results for the HCI:urban and UCCI indices, an overall increase in the climatic suitability for urban tourism is expected in Greece, especially during autumn and spring. However, extreme heat may negatively affect tourist comfort during the hottest months, particularly in July and August, as indicated by the decline in UCCI values under future climate conditions. A reduction in the future attractiveness of urban tourism in various Mediterranean countries during the hottest summer months has also been highlighted in recent studies [16,33,34,35]. These researchers found that tourists in urban locations in these countries are expected to experience high heat stress during summer; therefore, outdoor tourism activities are expected to become less attractive due to uncomfortable climatic conditions. On the other hand, other studies also focusing on Mediterranean countries [21,24,31] concluded that urban tourism may benefit from improved climatic conditions in the shoulder seasons under the future climate, as our study for Greece also indicates. This trend in the climatic attractiveness of tourism destinations may result in diverting tourism flows from peak summer months towards spring and autumn [36], making it imperative for cities to diversify their tourism offerings and target shoulder seasons. Investment in heat prevention and adaptation measures, such as green infrastructure and cooling areas, is also important for maintaining the thermal comfort of urban visitors.
The findings of our study indicate that mountainous regions in Greece, including ski resorts, can face better climatic conditions in terms of tourist comfort because of rising temperatures and decreased cloud cover. Although higher winter temperatures will severely challenge snow-related activities in those regions, they will also engage in outdoor activities such as bicycling, canoeing, rafting, and hiking much more appealing [37]. Future improved climatic conditions offer an opportunity for mountainous destinations to develop such new dependent activities, which will help them compensate, at least to some extent, for the potential losses from the reduction in demand for skiing and other snow-dependent activities [12,38,39] due to decreased snow availability and reliability [10,40,41].
Although this study provides a comprehensive analysis of the potential impacts of climate change on tourism in Greece, there are uncertainties and limitations that should be acknowledged.
Firstly, the climate data used in this analysis were derived from climatic simulations of regional climate models under the EURO-CORDEX initiative [42], with a spatial resolution of 0.11° x 0.11° (approximately 12.5 km). While this resolution is adequate for assessing broader climate trends, it has limitations in capturing local microclimatic variations, which may be important for specific tourism destinations. This limitation should be considered when interpreting the results. Additionally, to improve the reliability of future projections, results from multiple regional models and RCP scenarios were incorporated. This approach helps to provide a more robust assessment of potential climate change impacts.
Furthermore, the Holiday Climate Index (HCI) is a more general index that may vary across regions owing to various factors (e.g., the demographic characteristics of tourists visiting a country), whereas the Urban Climate Comfort Index (UCCI), Beach Utility Index (BUI), and Mountainous Winter Climate Index (MWCI) have been specifically developed for Greece and account for local climatic conditions. Using specific indices for each type of tourism is a valuable methodological approach to address uncertainties associated with the climate preferences of different tourism segments.
In addition, in our analysis, we also assumed that the visitors’ climatic preferences will remain unchanged over time and that no new adaptation measures —undertaken by tourists, travel agencies, or tourist destinations—will take place in the future. However, as both preferences and adaptation measures may change in response to changing climatic conditions, this introduces another source of uncertainty into our long-term projections.
Another limitation of our study is that the effects of extreme weather events were not specifically addressed under future climate change scenarios. However, the frequency and intensity of extreme events such as heatwaves, wildfires, and floods are projected to increase in the Mediterranean region due to climate change [36]. These acute events can have short-term impacts on tourism, such as infrastructure damage, transportation disruptions, and safety concerns, which could negatively affect a destination’s attractiveness. For example, wildfires on the island of Rhodes in July 2023 forced thousands of tourists to leave the island, resulting in significant income loss for businesses and workers in the local tourism industry.
An additional limitation of our study lies in the fact that the indices used are mainly metrics of the climatic suitability of a tourist destination. These can provide useful general insights into tourist behavior and preferences under different future climate scenarios. However, a detailed quantification of the impacts on the number of visitors, overnight stays, and occupancy rates requires further analytical work comprising the collection of detailed local historical data on tourist arrivals and overnight stays, development of statistical correlations between these and the local historical values of climatic indices, and quantification of the direct and indirect impacts on the Greek economy from future changes in tourist arrivals and stays. This process, which is very demanding in terms of resources, is beyond the scope of our present work and represents a major area for further research. Consequently, estimating how climate change will influence visitor behavior—specifically, the duration of their stays—and how it will directly affect the Greek economy (e.g., income, employment, etc.) would enhance understanding and should be pursued in future studies.

4. Conclusions

The findings of the study highlight the complex and varied effects of climate change on different types of tourism in Greece, with both positive and negative implications. Urban tourism is expected to experience challenges during the peak summer months due to rising temperatures, which may affect the comfort of tourists. However, there is considerable potential for growth during the “shoulder season” (April–May and September–October), with improved climatic conditions making urban destinations more attractive. This shift suggests opportunities for urban areas to extend their tourist season and adjust their tourism strategies to target these periods.
For beach and island tourism, the results suggest an overall improvement in climate suitability from April to October, with June and September showing the most significant gains. This extension of ideal conditions may increase the length of the beach tourism season, which presents an opportunity for coastal areas to promote travel during these months. However, adaptive measures, such as investments in infrastructure to cope with higher temperatures and droughts, will be crucial to maintaining comfort and sustainability during the hotter summer months.
As far as mountainous winter tourism is concerned, there is an improvement in general climatic conditions for outdoor activities like hiking and rafting; however, snow-dependent tourism, particularly skiing, is under threat due to the projected decrease in snow availability. Although some improvements in tourism conditions are expected for all mountainous locations except for Pelion Mountain, these changes are not statistically significant in all cases, and the overall reduction in snowfall poses a significant risk for ski resorts. This emphasizes the need for these destinations to diversify their tourism offerings to include non-snow-based activities in order to remain viable in the long term.
Ultimately, while climate change presents significant challenges, especially for summer urban tourism and snow-dependent activities, it also offers opportunities to extend the tourism season in many regions, particularly in coastal and urban areas during the shoulder seasons (spring and autumn). Policymakers, tourism operators, and local stakeholders must prioritize adaptation strategies, including infrastructural improvements and the promotion of off-peak travel, to adapt to the adverse impacts and capitalize on the potential gains. Future research should focus on quantifying the economic impacts of these changes and on the development of tailored adaptation measures to ensure the resilience of Greece’s tourism industry in the face of a changing climate.

Supplementary Materials

The following supporting information can be downloaded at: https://www.mdpi.com/article/10.3390/atmos15101185/s1, Figure S1: Average seasonal HCI:urban values; Figure S2: Average annual changes in the number of days with HCI:urban values higher than 60 between the two future periods and the reference period under all RCPs; Figure S3: Average annual changes and average changes during summer months in the number of days with UCCI values greater than 60 for 10 selected urban destinations in Greece between the reference period and the two future periods under all RCPs; Figure S4: Monthly percentage of days with HCI:urban values lower than 40 averaged for all 30-year simulations for 10 selected urban tourist destinations; Figure S5: Average difference in the number of days with very good to ideal conditions between the selected future periods and RCPs with respect to the reference period; Figure S6: Average changes during April–October and during summer months in the number of days with BUI values greater than 60 for 7 selected summer destinations in Greece between the reference period and two future periods and under all RCPs; Figure S7: Average changes during winter months in the number of days with WMCI values greater than 60 for 5 selected mountainous locations in Greece between the reference period and two future periods under all RCPs. Table S1: Summary statistics of the Urban Climate Comfort Index (UCCI), Beach Utility Index (BUI) and Mountainous Winter Climate Index (MWCI) for various locations in Greece under different climate scenarios (RCP2.6, RCP4.5, and RCP8.5) and historical periods (1971–2000). The table provides the mean, standard deviation, and p-values, highlighting statistically significant differences in indices values across the selected time frames and scenarios.

Author Contributions

Conceptualization, C.G. and E.G.; methodology, C.G., S.M., E.G. and Y.S.; data curation, K.V.V., I.L., D.K. and N.G.; writing—original draft preparation, I.L., K.V.V., N.G. and E.G.; writing—review and editing, I.L., S.M. and E.G.; supervision, C.G. and S.M.; funding acquisition, C.G. and S.M. All authors have read and agreed to the published version of the manuscript.

Funding

This research was funded by the project “Support for Enhancing the Operation of the National Network for Climate Change (CLIMPACT)”, National Development Program, General Secretariat of Research and Innovation, Greece (2023NA11900001—N. 5201588).

Institutional Review Board Statement

Not applicable.

Informed Consent Statement

Not applicable.

Data Availability Statement

Data Availability Statement: The EURO-CORDEX simulations used for the analysis are publicly available via https://esgf-node.ipsl.upmc.fr/search/cmip6-ipsl/ (accessed on 1 May 2024).

Conflicts of Interest

The authors declare no conflicts of interest.

References

  1. Intergovernmental Panel on Climate Change (IPCC). Climate Change 2022—Impacts, Adaptation and Vulnerability: Working Group II Contribution to the Sixth Assessment Report of the Intergovernmental Panel on Climate Change; Pörtner, H.-O., Roberts, D.C., Tignor, M., Poloczanska, E.S., Mintenbeck, K., Alegría, A., Craig, M., Langsdorf, S., Löschke, S., Möller, V., Eds.; Cambridge University Press: Cambridge, UK; New York, NY, USA, 2022. [Google Scholar] [CrossRef]
  2. INSETE Contribution of Tourism to the Greek Economy in 2023 Report 1st Estimate (Preliminary Data). 2024. Available online: https://insete.gr/wp-content/uploads/2024/04/23_04_Tourism_and_Greek_Economy_2019-2023.pdf (accessed on 1 July 2024).
  3. Bank of Greece, The Economics of Climate Change. 2018. Available online: https://www.bankofgreece.gr/Publications/Book%20The%20Economics%20of%20Climate%20Change_WebVersion.pdf (accessed on 1 July 2024).
  4. Zerefos, C.; Papatheodorou, A.; Sambetha, I. Chapter 1: Economic and environmental impact of climate change on Greek tourism. In Report “Greek Tourism and Climate Change: Adaptation Policies and a New Growth Strategy”; Climate Change Impacts Study Committee (CCISC), Bank of Greece: Athens, Greece, 2014; pp. 1–6. ISBN 978-960-7032-66-9. [Google Scholar]
  5. Georgopoulou, E.; Mirasgedis, S.; Sarafidis, Y.; Hontou, V.; Gakis, N.; Lalas, D.P. Climatic Preferences for Beach Tourism: An Empirical Study on Greek Islands. Theor. Appl. Clim. 2019, 137, 667–691. [Google Scholar] [CrossRef]
  6. Bax, V.; van de Lageweg, W.I.; de Groot, S.; Moerbeek, W. Beach User Perspectives on the Upscaling of Sand Nourishments in Response to Sea Level Rise—A Discrete Choice Experiment. Ocean Coast. Manag. 2024, 253, 107139. [Google Scholar] [CrossRef]
  7. Karditsa, A.; Niavis, S.; Paramana, T.; Monioudi, I.; Poulos, S.; Hatzaki, M. Is the Insular Coastal Tourism of Western Greece at Risk Due to Climate Induced Sea Level Rise? Ocean Coast. Manag. 2024, 251, 107088. [Google Scholar] [CrossRef]
  8. Thiéblemont, R.; le Cozannet, G.; Rohmer, J.; Privat, A.; Guidez, R.; Negulescu, C.; Philippenko, X.; Luijendijk, A.; Calkoen, F.; Nicholls, R.J. Sea-Level Rise Induced Change in Exposure of Low-Lying Coastal Land: Implications for Coastal Conservation Strategies. Anthr. Coasts 2024, 7, 1–17. [Google Scholar] [CrossRef]
  9. Bigano, A.; Goria, A.; Hamilton, J.M.; Tol, R.S.J. The Effect of Climate Change and Extreme Weather Events on Tourism; FEEM Working Paper No. 30.05, CMCC Research Paper No. 01; Fondazione Eni Enrico Mattei (FEEM): Milan, Italy, 2005; pp. 1–33. [Google Scholar] [CrossRef]
  10. Kapetanakis, D.; Georgopoulou, E.; Mirasgedis, S.; Sarafidis, Y. Weather Preferences for Ski Tourism: An Empirical Study on the Largest Ski Resort in Greece. Atmosphere 2022, 13, 1569. [Google Scholar] [CrossRef]
  11. Tsilogianni, D.; Cartalis, C.; Philippopoulos, K. Climate Change Impact Assessment on Ski Tourism in Greece: Case Study of the Parnassos Ski Resort. Climate 2023, 11, 140. [Google Scholar] [CrossRef]
  12. Steiger, R.; Knowles, N.; Pöll, K.; Rutty, M. Impacts of Climate Change on Mountain Tourism: A Review. J. Sustain. Tour. 2022, 32(9), 1984–2017. [Google Scholar] [CrossRef]
  13. Kapetanakis, D.; Georgopoulou, E.; Mirasgedis, S.; Sarafidis, Y. Weather Preferences for Urban Tourism: An Empirical Study in the Greek Capital of Athens, Greece. Atmosphere 2022, 13, 282. [Google Scholar] [CrossRef]
  14. Mieczkowski, Z. The Tourism Climatic Index: A Method of Evaluating World Climates for Tourism. Can. Geogr. Géographies Can. 1985, 29, 220–233. [Google Scholar] [CrossRef]
  15. Lemesios, G.; Giannakopoulos, C.; Papadaskalopoulou, C.; Karali, A.; Varotsos, K.V.; Moustakas, K.; Malamis, D.; Zachariou-Dodou, M.; Petrakis, M.; Loizidou, M. Future Heat-Related Climate Change Impacts on Tourism Industry in Cyprus. Reg. Environ. Chang. 2016, 16, 1915–1927. [Google Scholar] [CrossRef]
  16. Scott, D.; Rutty, M.; Amelung, B.; Tang, M. An Inter-Comparison of the Holiday Climate Index (HCI) and the Tourism Climate Index (TCI) in Europe. Atmosphere 2016, 7, 80. [Google Scholar] [CrossRef]
  17. Rutty, M.; Scott, D.; Matthews, L.; Burrowes, R.; Trotman, A.; Mahon, R.; Charles, A. An Inter-Comparison of the Holiday Climate Index (HCI:Beach) and the Tourism Climate Index (TCI) to Explain Canadian Tourism Arrivals to the Caribbean. Atmosphere 2020, 11, 412. [Google Scholar] [CrossRef]
  18. El-Masry, E.A.; El-Sayed, M.K.; Awad, M.A.; El-Sammak, A.A.; Sabarouti, M.A.E. Vulnerability of Tourism to Climate Change on the Mediterranean Coastal Area of El Hammam–EL Alamein, Egypt. Environ. Dev. Sustain. 2022, 24, 1145–1165. [Google Scholar] [CrossRef]
  19. Yu, D.; Li, S.; Chen, N.; Hall, M.; Guo, Z. High Temperatures and Tourism: Findings from China. Sustainability 2023, 15, 14138. [Google Scholar] [CrossRef]
  20. de Freitas, C.R.; Scott, D.; McBoyle, G. A Second Generation Climate Index for Tourism (CIT): Specification and Verification. Int. J. Biometeorol. 2008, 52, 399–407. [Google Scholar] [CrossRef] [PubMed]
  21. Bafaluy, D.; Amengual, A.; Romero, R.; Homar, V. Present and Future Climate Resources for Various Types of Tourism in the Bay of Palma, Spain. Reg. Environ. Chang. 2014, 14, 1995–2006. [Google Scholar] [CrossRef]
  22. Cardell, M.F.; Amengual, A.; Romero, R. Present and Future Climate Potentials for Several Outdoor Tourism Activities in Spain. J. Sustain. Tour. 2023, 31, 2219–2249. [Google Scholar] [CrossRef]
  23. Moreno, A.; Amelung, B. Climate Change and Tourist Comfort on Europe’s Beaches in Summer: A Reassessment. Coast. Manag. 2009, 37, 550–568. [Google Scholar] [CrossRef]
  24. Demiroglu, O.C.; Saygili-Araci, F.S.; Pacal, A.; Hall, C.M.; Kurnaz, M.L. Future Holiday Climate Index (HCI) Performance of Urban and Beach Destinations in the Mediterranean. Atmosphere 2020, 11, 911. [Google Scholar] [CrossRef]
  25. de Freitas, C.R. Tourism Climatology: Evaluating Environmental Information for Decision Making and Business Planning in the Recreation and Tourism Sector. Int. J. Biometeorol. 2003, 48, 45–54. [Google Scholar] [CrossRef]
  26. Georgoulias, A.K.; Akritidis, D.; Kalisoras, A.; Kapsomenakis, J.; Melas, D.; Zerefos, C.S.; Zanis, P. Climate Change Projections for Greece in the 21st Century from High-Resolution EURO-CORDEX RCM Simulations. Atmos. Res. 2022, 271, 106049. [Google Scholar] [CrossRef]
  27. Varotsos, K.V.; Karali, A.; Lemesios, G.; Kitsara, G.; Moriondo, M.; Dibari, C.; Leolini, L.; Giannakopoulos, C. Near Future Climate Change Projections with Implications for the Agricultural Sector of Three Major Mediterranean Islands. Reg. Environ. Chang. 2021, 21, 16. [Google Scholar] [CrossRef]
  28. Amengual, A.; Homar, V.; Romero, R.; Ramis, C.; Alonso, S. Projections for the 21st Century of the Climate Potential for Beach-Based Tourism in the Mediterranean. Int. J. Climatol. 2014, 34, 3481–3498. [Google Scholar] [CrossRef]
  29. Torres, C.; Jordà, G.; de Vílchez, P.; Vaquer-Sunyer, R.; Rita, J.; Canals, V.; Cladera, A.; Escalona, J.M.; Miranda, M.Á. Climate Change and Its Impacts in the Balearic Islands: A Guide for Policy Design in Mediterranean Regions. Reg. Environ. Chang. 2021, 21, 107. [Google Scholar] [CrossRef] [PubMed]
  30. Agulles, M.; Melo-Aguilar, C.; Jordà, G. Risk of Loss of Tourism Attractiveness in the Western Mediterranean under Climate Change. Front. Clim. 2022, 4, 1019892. [Google Scholar] [CrossRef]
  31. Bilgin, B.; Acar, S.; Demiralay, Z.; An, N.; Turp, M.T.; Kurnaz, M.L. A Synthetic Approach to the Holiday Climate Index for the Mediterranean Coast of Türkiye. Int. J. Biometeorol. 2024, 1–15. [Google Scholar] [CrossRef]
  32. Köberl, J.; Prettenthaler, F.; Bird, D.N. Modelling Climate Change Impacts on Tourism Demand: A Comparative Study from Sardinia (Italy) and Cap Bon (Tunisia). Sci. Total Environ. 2016, 543, 1039–1053. [Google Scholar] [CrossRef]
  33. Salata, F.; Golasi, I.; Proietti, R.; de Lieto Vollaro, A. Implications of Climate and Outdoor Thermal Comfort on Tourism: The Case of Italy. Int. J. Biometeorol. 2017, 61, 2229–2244. [Google Scholar] [CrossRef]
  34. Rodríguez-Algeciras, J.; Rodríguez-Algeciras, A.; Chaos-Yeras, M.; Matzarakis, A. Tourism-Related Climate Information for Adjusted and Responsible Planning in the Tourism Industry in Barcelona, Spain. Theor. Appl. Clim. 2020, 142, 1003–1014. [Google Scholar] [CrossRef]
  35. Mansuroğlu, S.; Dağ, V.; Kalaycı Önaç, A. Attitudes of People toward Climate Change Regarding the Bioclimatic Comfort Level in Tourism Cities; Evidence from Antalya, Turkey. Environ. Monit. Assess. 2021, 193, 420. [Google Scholar] [CrossRef]
  36. Ali, E. Cross-Chapter Paper 4: Mediterranean Region. Available online: https://www.ipcc.ch/report/ar6/wg2/chapter/ccp4/ (accessed on 17 September 2024).
  37. Pröbstl-Haider, U.; Hödl, C.; Ginner, K.; Borgwardt, F. Climate Change: Impacts on Outdoor Activities in the Summer and Shoulder Seasons. J. Outdoor Recreat. Tour. 2021, 34, 100344. [Google Scholar] [CrossRef]
  38. Campos Rodrigues, L.; Freire-González, J.; González Puig, A.; Puig-Ventosa, I. Climate Change Adaptation of Alpine Ski Tourism in Spain. Climate 2018, 6, 29. [Google Scholar] [CrossRef]
  39. Pede, E.C.; Barbato, G.; Buffa, A.; Ellena, M.; Mercogliano, P.; Ricciardi, G.; Staricco, L. Mountain Tourism Facing Climate Change. Assessing Risks and Opportunities in the Italian Alps. TeMA J. Land Use Mobil. Environ. 2022, 15, 25–47. [Google Scholar] [CrossRef]
  40. Pérez-Palazón, M.J.; Pimentel, R.; Polo, M.J. Climate Trends Impact on the Snowfall Regime in Mediterranean Mountain Areas: Future Scenario Assessment in Sierra Nevada (Spain). Water 2018, 10, 720. [Google Scholar] [CrossRef]
  41. Mitterwallner, V.; Steinbauer, M.; Mathes, G.; Walentowitz, A. Global Reduction of Snow Cover in Ski Areas under Climate Change. PLoS ONE 2024, 19, e0299735. [Google Scholar] [CrossRef]
  42. Jacob, D.; Petersen, J.; Eggert, B.; Alias, A.; Christensen, O.B.; Bouwer, L.M.; Braun, A.; Colette, A.; Déqué, M.; Georgievski, G.; et al. EURO-CORDEX: New High-Resolution Climate Change Projections for European Impact Research. Reg. Environ. Chang. 2014, 14, 563–578. [Google Scholar] [CrossRef]
Figure 1. Selected destinations according to their respective tourism types.
Atmosphere 15 01185 g001
Figure 2. Average annual HCI:urban values for all simulations. In each panel, M denotes the spatial average over all the grid points covering the area under study with the units being the same as in the colourbar. Black dots indicate a robust change (future period and scenario minus the reference period) at the grid point scale. The robustness of the results was assessed following Varotsos et al. 2021 [27].
Atmosphere 15 01185 g002
Figure 3. (a) Average annual value and (b) average summer value of UCCI for 10 selected urban destinations in Greece for the reference period (1971–2000) and two future periods (2021–2050 and 2071–2100) under three RCP scenarios.
Atmosphere 15 01185 g003
Figure 4. Mean monthly distribution of the HCI:urban values for all simulations for 10 selected urban tourist destinations.
Atmosphere 15 01185 g004aAtmosphere 15 01185 g004b
Figure 5. Mean monthly distribution of UCCI for 10 selected urban destinations in Greece.
Atmosphere 15 01185 g005
Figure 6. Average summer (JJA) HCI:beach values for all simulations. In each panel, M denotes the spatial average over all the grid points covering the area under study with the units being the same as in the colourbar. Black dots indicate a robust change (future period and scenario minus the reference period) at the grid point scale. Robustness of the results is assessed following Varotsos et al. 2021 [27].
Atmosphere 15 01185 g006
Figure 7. (a) Average value of BUI during April–October and (b) average summer value of BUI for 7 selected summer destinations in Greece for reference period (1971–2000) and two future periods (2021–2050 and 2071–2100) under three RCP scenarios.
Atmosphere 15 01185 g007
Figure 8. Mean monthly distribution of the HCI:beach values for all simulations for 9 selected beach tourist destinations.
Atmosphere 15 01185 g008aAtmosphere 15 01185 g008b
Figure 9. Mean monthly distribution of BUI for 7 selected summer destinations in Greece (period: April–October).
Atmosphere 15 01185 g009
Figure 10. Average winter value of MWCI for 5 selected mountainous locations in Greece for the reference period (1971–2000) and two future periods (2021–2050 and 2071–2100) under three RCP scenarios.
Atmosphere 15 01185 g010
Figure 11. Mean monthly distribution of WMCI for 5 selected mountainous locations in Greece (period: November–March).
Atmosphere 15 01185 g011
Table 1. HCI classification for both urban and beach versions.
Index ValueDescriptive Rating
90–100Ideal
80–89Excellent
70–79Very Good
60–69Good
50–59Acceptable
40–49Marginal
30–39Unacceptable
20–29
10–19
0–9Dangerous
Table 2. Classification of attractiveness for urban, beach and mountainous winter tourism based on UCCI, BUI and MWCI, respectively.
Index ValueDescriptive Rating
80–100Excellent
70–79Very good
60–69Good
40–59Acceptable
0–39Unfavorable
Disclaimer/Publisher’s Note: The statements, opinions and data contained in all publications are solely those of the individual author(s) and contributor(s) and not of MDPI and/or the editor(s). MDPI and/or the editor(s) disclaim responsibility for any injury to people or property resulting from any ideas, methods, instructions or products referred to in the content.

