Article

Modeling the Effect of Climate Change on Evapotranspiration in the Thrace Region

1
Vocational School of Technical Sciences, Tekirdağ Namık Kemal University, Tekirdağ 59100, Türkiye
2
Faculty of Agriculture, Tekirdağ Namık Kemal University, Tekirdağ 59100, Türkiye
*
Author to whom correspondence should be addressed.
Atmosphere 2024, 15(10), 1188; https://doi.org/10.3390/atmos15101188
Submission received: 6 August 2024 / Revised: 25 September 2024 / Accepted: 30 September 2024 / Published: 3 October 2024
(This article belongs to the Special Issue Regional Climate Predictions and Impacts)

Abstract

:
The aim of this study is to determine the effect of climate change on reference evapotranspiration (ETo) and sunflower and wheat evapotranspiration (ETs and ETw, respectively) in the Trakya Region of Türkiye. ETo Calculator (version 3.2) and CROPWAT 8.0 were used to compute ETo and ET in the reference period (1970–1990), short- (2016–2025), mid- (2046–2055), and long- (2076–2085) terms. Additionally, ETo was tested in 2012 and ETo was simulated for every 1 °C temperature increase up to 5 °C in the reference period. Calculated ETo and ET values for the future were compared with the reference period. For the future, climate data estimated by RegCM3 Regional Climate Model, A2 scenario were used. While the average ETo value of the reference period was 3.3 mm day−1, it was 3.0 mm day−1 in 2012. Compared to the reference period, ETo values change by −3% (3.2 mm day−1), 9% (3.6 mm day−1), and 21% (4.0 mm day−1) in the short-, mid-, and long-term, respectively. The 575 mm ET deficit calculated during the vegetation period of sunflower in the model reference period was forecasted to change by −11% (514 mm), +15% (660 mm), and +25% (721 mm) in the short-, mid-, and long-term, respectively. For wheat, while 59 mm of excess water was calculated in the reference period, it became 193 mm (+227%) in the short-term and a water deficit of 8 mm (−113%) and 6 mm (−110%) in the mid- and long-term, respectively. In addition, it is estimated that there will be an increase of 0.1 mm day−1 (4%) in ETo values for each 1 °C temperature increase compared to the reference period (1970–1990). It was concluded that climate change in the Trakya Region will not significantly affect wheat farming; however, it will cause a serious water deficit in sunflower production.

1. Introduction

Water has been a really vital characteristic asset for all civilizations for centuries, and all extraordinary civilizations were established near water. With the advancement of innovation and the increase in the types and rates of water utilization, the capacity to develop water assets for numerous purposes such as drinking, irrigation, and vitality generation has played a major part in the financial improvement of nations [1].
In recent years, the rapid population growth and industrialization and the decrease in natural resources have made it necessary to utilize water resources in the most economical and efficient way. Sustainable development of limited water resources and continuous, high-level of benefit from water can only be achieved by determining the amount of plant water consumption in accordance with the climatic conditions of the region where the plants grow and by establishing appropriate irrigation programs according to plant growth periods [2].
Evaporation is an important component of the hydrological cycle, and knowing the water losses resulting from evaporation within the scope of the hydrological cycle is an important issue in terms of water management and planning. Water management and planning is of great importance, especially in Türkiye, which has an agriculture-based economy and where 70–75% of the water demand is made up of the agricultural sector [3].
Climate change, which has been known and examined for a long time, has developed as the greatest danger currently. RegCM4.3 Regional Climate Model [4] solutions based on HadGEM2-ES [5,6], MPI-ESM-MR [7], and CNRM-CM5.1 [8] models for RCP4.5 and RCP8.5 scenarios in Türkiye were run for the period of 2015–2100. While an increase in average temperature is expected in all models and scenarios across Türkiye, increases and decreases in precipitation are predicted in precipitation projections depending on ground system models. In the RCP4.5 scenario, temperature increases over Türkiye between 2091–2100 were found to be 3.4 °C, 2.0 °C, and 2.5 °C for RegCM4.3 coupled with HadGEM2-ES, MPI-ESM-MR, and CNRM-CM5.1 models, respectively. In the higher emission scenario RCP8.5, these temperature increase values are 5.9 °C, 4.5 °C, and 4.3 °C, respectively. Although the temperature increases in Türkiye in the RCP8.5 scenario are slightly above the RCP4.5 scenario until the 2050s, the RCP8.5 scenario shows higher temperature increases after the 2050s. In general, ten-year seasonal precipitation averages during the projection period are projected to change between −50 mm and 40 mm for the RCP4.5 scenario and between −60 mm and 20 mm for the RCP8.5 scenario compared to the reference period covering the years 1970–2000 [9].
Hanedar, et al. [10] obtained climate simulations of HadGEM2-ES, MPI-ESMMR and CNRM-CM5.1 global models with a resolution of 10 × 10 km2 in Edirne, Kırklareli and Tekirdağ provinces in the Thrace Region for the reference period (1971–2000) and the future until 2100. The future simulations are climate simulations of the RegCM4.3 Regional Climate Model 2015–2100 based on RCP4.5 and RCP8.5 representative concentration routes corresponding to climate forcings of 4.5 W m−2 and 8.5 W m−2. As a result, all three models predicted temperature increases between 0.43 °C and 3.13 °C in Edirne in RCP4.5, between 0.46 °C and 3.10 °C in Tekirdağ, and between 0.41 °C and 3.14 °C in Kırklareli. According to the RCP8.5 scenario results, they predicted temperature increases between 0.43 °C and 5.31 °C in Edirne, 0.44 °C and 5.31 °C in Tekirdağ, and 0.45 °C and 5.38 °C in Kırklareli in the 100-year period. In the precipitation estimation, in the 100-year future projections, all three models predicted a change between −16.98 mm and 19.05 mm in Edirne, between −9.80 mm and 18.6 mm in Tekirdağ, and between −14.50 mm and 15.56 mm in Kırklareli in RCP4.5. In RCP8.5, they predicted a precipitation change between −16.99 mm and 8.8 mm in Edirne, −15.07 mm and 12.38 mm in Tekirdağ, and −20.32 mm and 10.51 mm in Kırklareli. Although there is a general upward trend in temperatures, it was predicted that there would be periodic increases and decreases in ten-year periods [10]. Therefore, according to the studies conducted, it is estimated that significant changes in temperature and precipitation ranges will be observed in climate change predictions in this region.
Global warming is sure to have significant impacts on water supply, and increased rainfall variability will pose significant problems for the agricultural sector. A warmer climate will accelerate the hydrological cycle, increasing the global amounts of precipitation and evapotranspiration (ET) [11]. Water loss occurs through transpiration and evaporation from the plant surface and direct evaporation from the soil surface. Effective irrigation and proper water management are very important in semi-arid and arid regions. Irrigation project planners often require crop water requirements and/or total evaporation data for use in planning studies of dams, ponds, and cropping patterns. On the other hand, water conservation is becoming increasingly important due to climate change, increasing water demand and water scarcity. Farm irrigation scheduling is one of the most important methods for optimizing production resulting from proper irrigation, which will help to improve water use efficiency, water conservation, environmental protection, and sustainable production in arid and semi-arid regions [12].
The main products cultivated in Thrace are wheat (Triticum aestivum L.), sunflower (Helianthus annus L.), and paddy (Oryza sativa L.) [13]. Wheat and sunflower rotation is widely applied in the region, and canola production has also taken its place in this rotation in recent years [14]. The sunflower oil cultivation area in Türkiye was 0.81 million hectares in 2021, while sunflower oil production reached 2.22 million tons in the same year. The provinces where sunflower production is intensive in Türkiye are; Tekirdağ, Konya, Edirne, Kırklareli, and Adana, respectively. These provinces meet 65% of the total production [15]. Although Thrace constitutes 5% of Türkiye’s wheat cultivated areas of 0.63 million hectares, it provides 15% of the country’s production with 2.5 million tons per year [13]. Therefore, the Thrace Region is an important region in terms of wheat and sunflower cultivation, as both are strategic crops.
There are several studies on the calculation of the impact of possible climate change on reference evapotranspiration (ETo) around the world [16,17,18,19,20,21,22,23]. In a study conducted in Iran, monthly and annual ETo time series calculated using Penman–Monteith were analyzed for trend using Mann–Kendall method. They determined that ETo has an increasing trend in most stations [17]. Temporal trends of climate variables and their effects on ETo in China (1956–2015) were evaluated. They found that although ETo generally showed a decreasing trend from 1956 to 2015, there was a significantly increasing trend from 1985 to 2015 across China, except for the subtropical monsoon region, especially during the dry seasons (spring and winter) [18]. Trends and magnitudes of change in meteorological variables over a period of 116 years (1893–2008) in the Platte River Basin were analyzed. They observed that ETo (potential) responds to changes in meteorological variables to a higher degree than (potential) evapotranspiration (ETr) [19]. In actual ET (ETa) data derived from remote sensing, total ETa was found to show a marginally increasing trend between 2000 and 2010 [21]. Temporal and spatial changes in ETo (1981–2017) in the Hengduan Mountains of China were investigated, and the response of ETo to climate change in a mountainous area was determined [22]. The impact of climate on crop evapotranspiration (ETc) in the Pannonian Basin was evaluated and annual crop evaporation was predicted to increase in the central and southern parts of the Pannonian Basin in the future [23].
There are studies on a wide range of topics in Türkiye [2,3,24,25,26,27,28,29,30,31]. An android-based application was developed to be used in reference evapotranspiration calculation [27]. ETo values calculated by using Geographic Information Systems (GIS) in Gediz Basin were mapped by using geostatistics [31]. The irrigation water requirements of corn against climate change in Adana were modeled [29,30]. The effect of climate change was analyzed by calculating the reference plant water consumption between 2009 and 2012 using the Penman–Monteith equation in Trabzon province [2]. Selçuk [25] determined the effect of climate change on temperature and ETo in Malatya province. Some studies have been carried out in the Thrace Region. The possible effects of climate change on evaporation [3] and ETo [24] in Thrace Region and the effect of climate change on ETo in Tekirdağ were determined [28]. In addition, the spatial and temporal variation of reference plant water consumption in the Marmara Region was investigated [26].
In the Thrace Region, the effects of climate change on water resources [32], crop yield [32,33,34,35,36], and soil moisture [37,38] have been modeled. However, there are very few studies modeling the effect of climate change on ET. Even if the region modeled in the studies is the same, there is a need to diversify the studies because the research areas, the climate models and scenario results used, and the periods evaluated are different, and there are various calculation methods. In addition, no (or very few, if any) modeling studies are available for the future regarding irrigation water needs and plant water consumption for sunflower and wheat plants cultivated in the Thrace Region, although the data are available for current period. Therefore, this study will significantly contribute to future farm planning and practices.
The aim of this study is to model the effect of possible climate change on ET in the Çorlu Pınarbaşı Sub-basin, which is selected as a pilot region representing the Thrace Region. In order to achieve this objective, firstly, the impact of climate change on ETo was modeled by calculating ETo values with ETo Calculator for short (2016–2025), medium (2046–2055), and long (2076–2085) periods with the results of A2 scenario outputs of RegCM3 Regional Climate Model for the reference (1970–1990) period. Then, using the same climate data, plant water consumption for sunflower and wheat crops were calculated with CROPWAT 8.0 model and irrigation water requirements were evaluated. Finally, since temperatures are predicted to increase in Türkiye, ETo was calculated and evaluated by increasing the temperatures by 1, 2, 3, 4, and 5 °C in the reference period so that practitioners and decision-makers can easily understand what each degree of temperature increase corresponds to in terms of ETo. This study will aid managers, planners, and practitioners in making sustainable, effective, and efficient water use decisions for water resources planning.

2. Materials and Methods

2.1. Research Area

The study area is Çorlu Pınarbaşı Sub-Basin, which is located in the Meriç-Ergene Main Basin in the Thrace Region. The reason why this basin was preferred as a pilot representative area was because it is geographically located in the central part of the Thrace Region, and soil, plant, and hydrological data are available from our previous studies. The basin area is 119.61 km2. The basin, which is between 85–268 m above sea level, is located at 41°30′40.63″ North Latitude and 27°45′39.96″ East Longitude. The basin includes four sub-basins of different sizes. These are Topçu, Çövenli, Sofular, and Akıncılar sub-basins. The elevation increases from south to north in the basin and consists of flat, nearly flat, and gently sloping areas. The areas with 0–1% slope are 22.43 km2, areas with 1–2% slope are 47.85 km2, and areas with 2–4% slope are 42.52 km2. The remaining 6.68 km2 areas have slope degrees of 4–6%, 6–8%, 8–10%, and 10–12%. The basin faces south, southwest, and southeast. When the major soil groups are classified, it is seen that it generally consists of vertisol soil (41%), brown forest soil without lime (34%), and brown soil without lime (25%). It has been observed that 93% of the basin may be exposed to no or very little water erosion and light wind erosion, and 7% may be exposed to moderate water and wind erosion. Within the basin, Class I land covers 12.72 km2 (11%), Class II land covers 96.35 km2 (82%), and Class III land covers 8.62 km2 (7%) [39]. The location and other features of the research area are given in Figure 1. According to the land use of Çorlu Pınarbaşı Sub-Basin, agricultural areas constitute 84.53 km2 (70.56), forest areas constitute 22.58 km2 (18.85%), pasture areas constitute 3.91 km2 (3.26%), orchards constitute 1.36 km2 (1.14%), water bodies constitute 0.01 km2 (0.01%), semi-natural areas constitute 5.44 km2 (4.54), residential areas constitute 1.70 km2 (1.42%), and other artificial areas constitute 0.27 km2 (0.22%).

2.2. Climate of the Research Area

The research area is under the influence of the Black Sea–Mediterranean climate along the coastline of the Marmara Sea and a continental climate in the interior. Winters are cool and rainy; summers are dry and hot. These data obtained from the Turkish State Meteorological Service are long-term average (1940–2023) values for Tekirdağ Province. These are shown in Table 1 [40]. Looking at the long-term average in Table 1, the average annual temperature is 14.1 °C. In terms of monthly temperature averages, the coldest month is January with 4.9 °C and the hottest month is August with 23.9 °C. The total annual rainfall is 580.4 mm. Most of the precipitation occurs between October and June [40].

2.3. Soil Properties of the Research Area

One profile pit each was opened in Akıncılar, Sofular, and Çövenli on 19 June 2012. Disturbed and undisturbed soil samples were taken from 0–30 cm, 30–60 cm, and 60–90 cm layers and sent to the Atatürk Soil Water and Agricultural Meteorology Research Institute to determine their properties. The results of the analysis performed are shown in Table 2.

2.4. Plant Data

Plant characteristics of sunflower and wheat used in the study are given in Table 3.

2.5. Climate Change Data

The climate data used were obtained from Istanbul Technical University Eurasia Earth Sciences Institute. These results obtained by Dalfes et al. [42] are the outputs of the “Climate Change Scenarios for Türkiye” project, which they carried out with the support of STRCT (Scientific and Technological Research Council of Türkiye) and using the RegCM3 Regional Climate Model. These are daily climate data obtained by downscaling the outputs of the ECHAM5 General Circulation Model [43] using the RegCM3 Regional Climate Model. ECHAM5 is the fifth-generation atmospheric general circulation model developed at the Max Planck Institute for Meteorology (MPIM), while the RegCM Version 3.1 Regional Climate Model was developed by the American National Center for Atmospheric Research (NCAR). These data cover the reference (1961–1990) and future (2000–2099) A2 SRES scenario outputs. These daily data are minimum temperature (°K), maximum temperature (°K), wind speed (m s−1), precipitation (mm), average relative humidity (%), and global solar radiation (W cm−2) values.

2.6. ETo Calculator

In this research, ETo Calculator (Version 3.2) was used to calculate ETo. ETo Calculator is a software developed by the Land and Water Division of Food and Agriculture Organization (FAO) [44]. The obtained climate data are entered into the program and ETo is calculated. It is also possible to calculate ETo by estimating specific climatic conditions or temperature data according to the methodology described by Allen et al. [45] for missing climate data. The daily total sunshine duration (h), minimum temperature (°C), maximum temperature (°C), daily average relative humidity (%), and wind speed (m s−1) data are input to ETo Calculator. In addition, these data, the name of the meteorological station, the location of the meteorological station, its position, latitude, longitude, and height above sea level are entered. ETo (mm) values are calculated and given as output. The program calculates ETo with the Penman–Monteith method [46].

2.7. CROPWAT Model

In this study, CROPWAT (Version 8) was used to calculate crop water consumption for sunflower and wheat [47]. The model is designed to help agricultural meteorologists, agronomists, and irrigation engineers to calculate reference crop water use and crop water consumption [48]. The model can also provide recommendations for improving irrigation methods, planning irrigation schedules under different irrigation conditions, and assessing the effects of rainwater conditions or adequate irrigation conditions on crop yields. The model can analyze the reference plant water consumption, plant water consumption, irrigation water requirement of the plant, irrigation system development, evaluation of the effect of rainfall or insufficient irrigation on yield, and daily water budget analysis [49]. Climate, plant, and soil data are entered as input to the model. In this study, monthly average ETo data (mm day−1), monthly total precipitation (mm) data, soil data of the research area, and plant data related to sunflower and wheat were entered as the input [50]. The required plant data for sunflower and wheat plants plant coefficients (Kc), sowing–planting dates, and growth period lengths were obtained from [41]. In this study, plant water consumption (mm day−1) (ETc) for sunflower and wheat plants were calculated and evaluated as model output.

2.8. Methods

Within the scope of determining the impact of possible climate change on ET in the Çorlu Pınarbaşı Sub-Basin, firstly the data of Çorlu Meteorology Station in 2012 were obtained from Tekirdağ Meteorology Directorate. The year 2012 was the year in which observations and measurements regarding soil and plants were made in the field throughout the season for the purpose of testing. The World Meteorological Organization (WMO) suggested that the length of the reference period should be 30 years [51]. Accordingly, the reference period of the RegCM3 climate model covers 30 years between 1961 and 1990. However, in our case, the reference period is 21 years (1970–1990) since the measurements were started at Çorlu Meteorological Station, the closest one to the study area, in 1970. Therefore, the reference period of 21 years (1970–1990) instead of 30 was assumed in this study. The option of extending the 21-year reference period to 30 years between 1970–2000 was also considered. However, in this case, this period would not be covered by the period defined in the RegCM3 climate model, which would not be compatible. Therefore, due to lack of data, the ideal period of defined 30 years by WMO is taken as 21 years here. In order to determine whether this situation would have a significant negative impact on the research results, the average climate data for the 21-year period (1970–1990) and the average climate data for the 30-year period (1970–2000) of the region were compared statistically, and no significant difference was found between the average climate data of these periods. Then, RegCM3 Regional Climate Model reference climate data (1970–1990) were obtained from the results of Dalfes et al.’s [42] “Climate Change Scenarios for Türkiye” project. It was determined by evaluating whether the values obtained by Deveci and Konukcu [32] for the region were statistically consistent with the measured values. Accordingly, it was determined that the use of RegCM3 Regional Climate Model climate data and results for the Çorlu Pınarbaşı Sub-Basin was appropriate, and the model showed good performance. With ETo Calculator, first the ETo values for the year 2012 and the model reference period (1970–1990) were calculated. Then, using the RegCM3 Regional Climate Model, A2 scenario outputs, the ETo values for the future short (2016–2025), medium (2046–2055), and long (2076–2085) periods were calculated. These values calculated for future years were evaluated by comparing them with 2012 and the model reference period (1970–1990). In addition, the climate data of Çorlu Meteorology Station between the years 2016–2024, which is the period we are living in, was obtained from Tekirdağ Meteorology Directorate, and ETo was recalculated and verified with the modeled ETo values. Then, plant water consumption of sunflower and wheat crops was calculated with the CROPWAT 8.0 model, and the results were evaluated in terms of irrigation water requirement by comparing the reference and future short, medium, and long periods. While making these evaluations, the sunflower vegetation period (145 days) and the wheat vegetation period (252 days), the beginning and end of the development period for sunflower (30 days), which is determined as the second period, were assumed for wheat (146 days) [41]. The water deficit for sunflower and wheat in the future has been estimated. Finally, the ETo (1970–1990) reference period was calculated by taking the data from Çorlu Meteorological Station from Tekirdağ Meteorology Directorate. Then, it was determined how ETo would change if the temperature increased by 1, 2, 3, 4, and 5 °C.

3. Results and Discussion

3.1. Comparison of ETo Values in 2012 and Reference Period (1970–1990) with Future Short (2016–2025), Medium (2046–2055), and Long (2076–2085) Periods

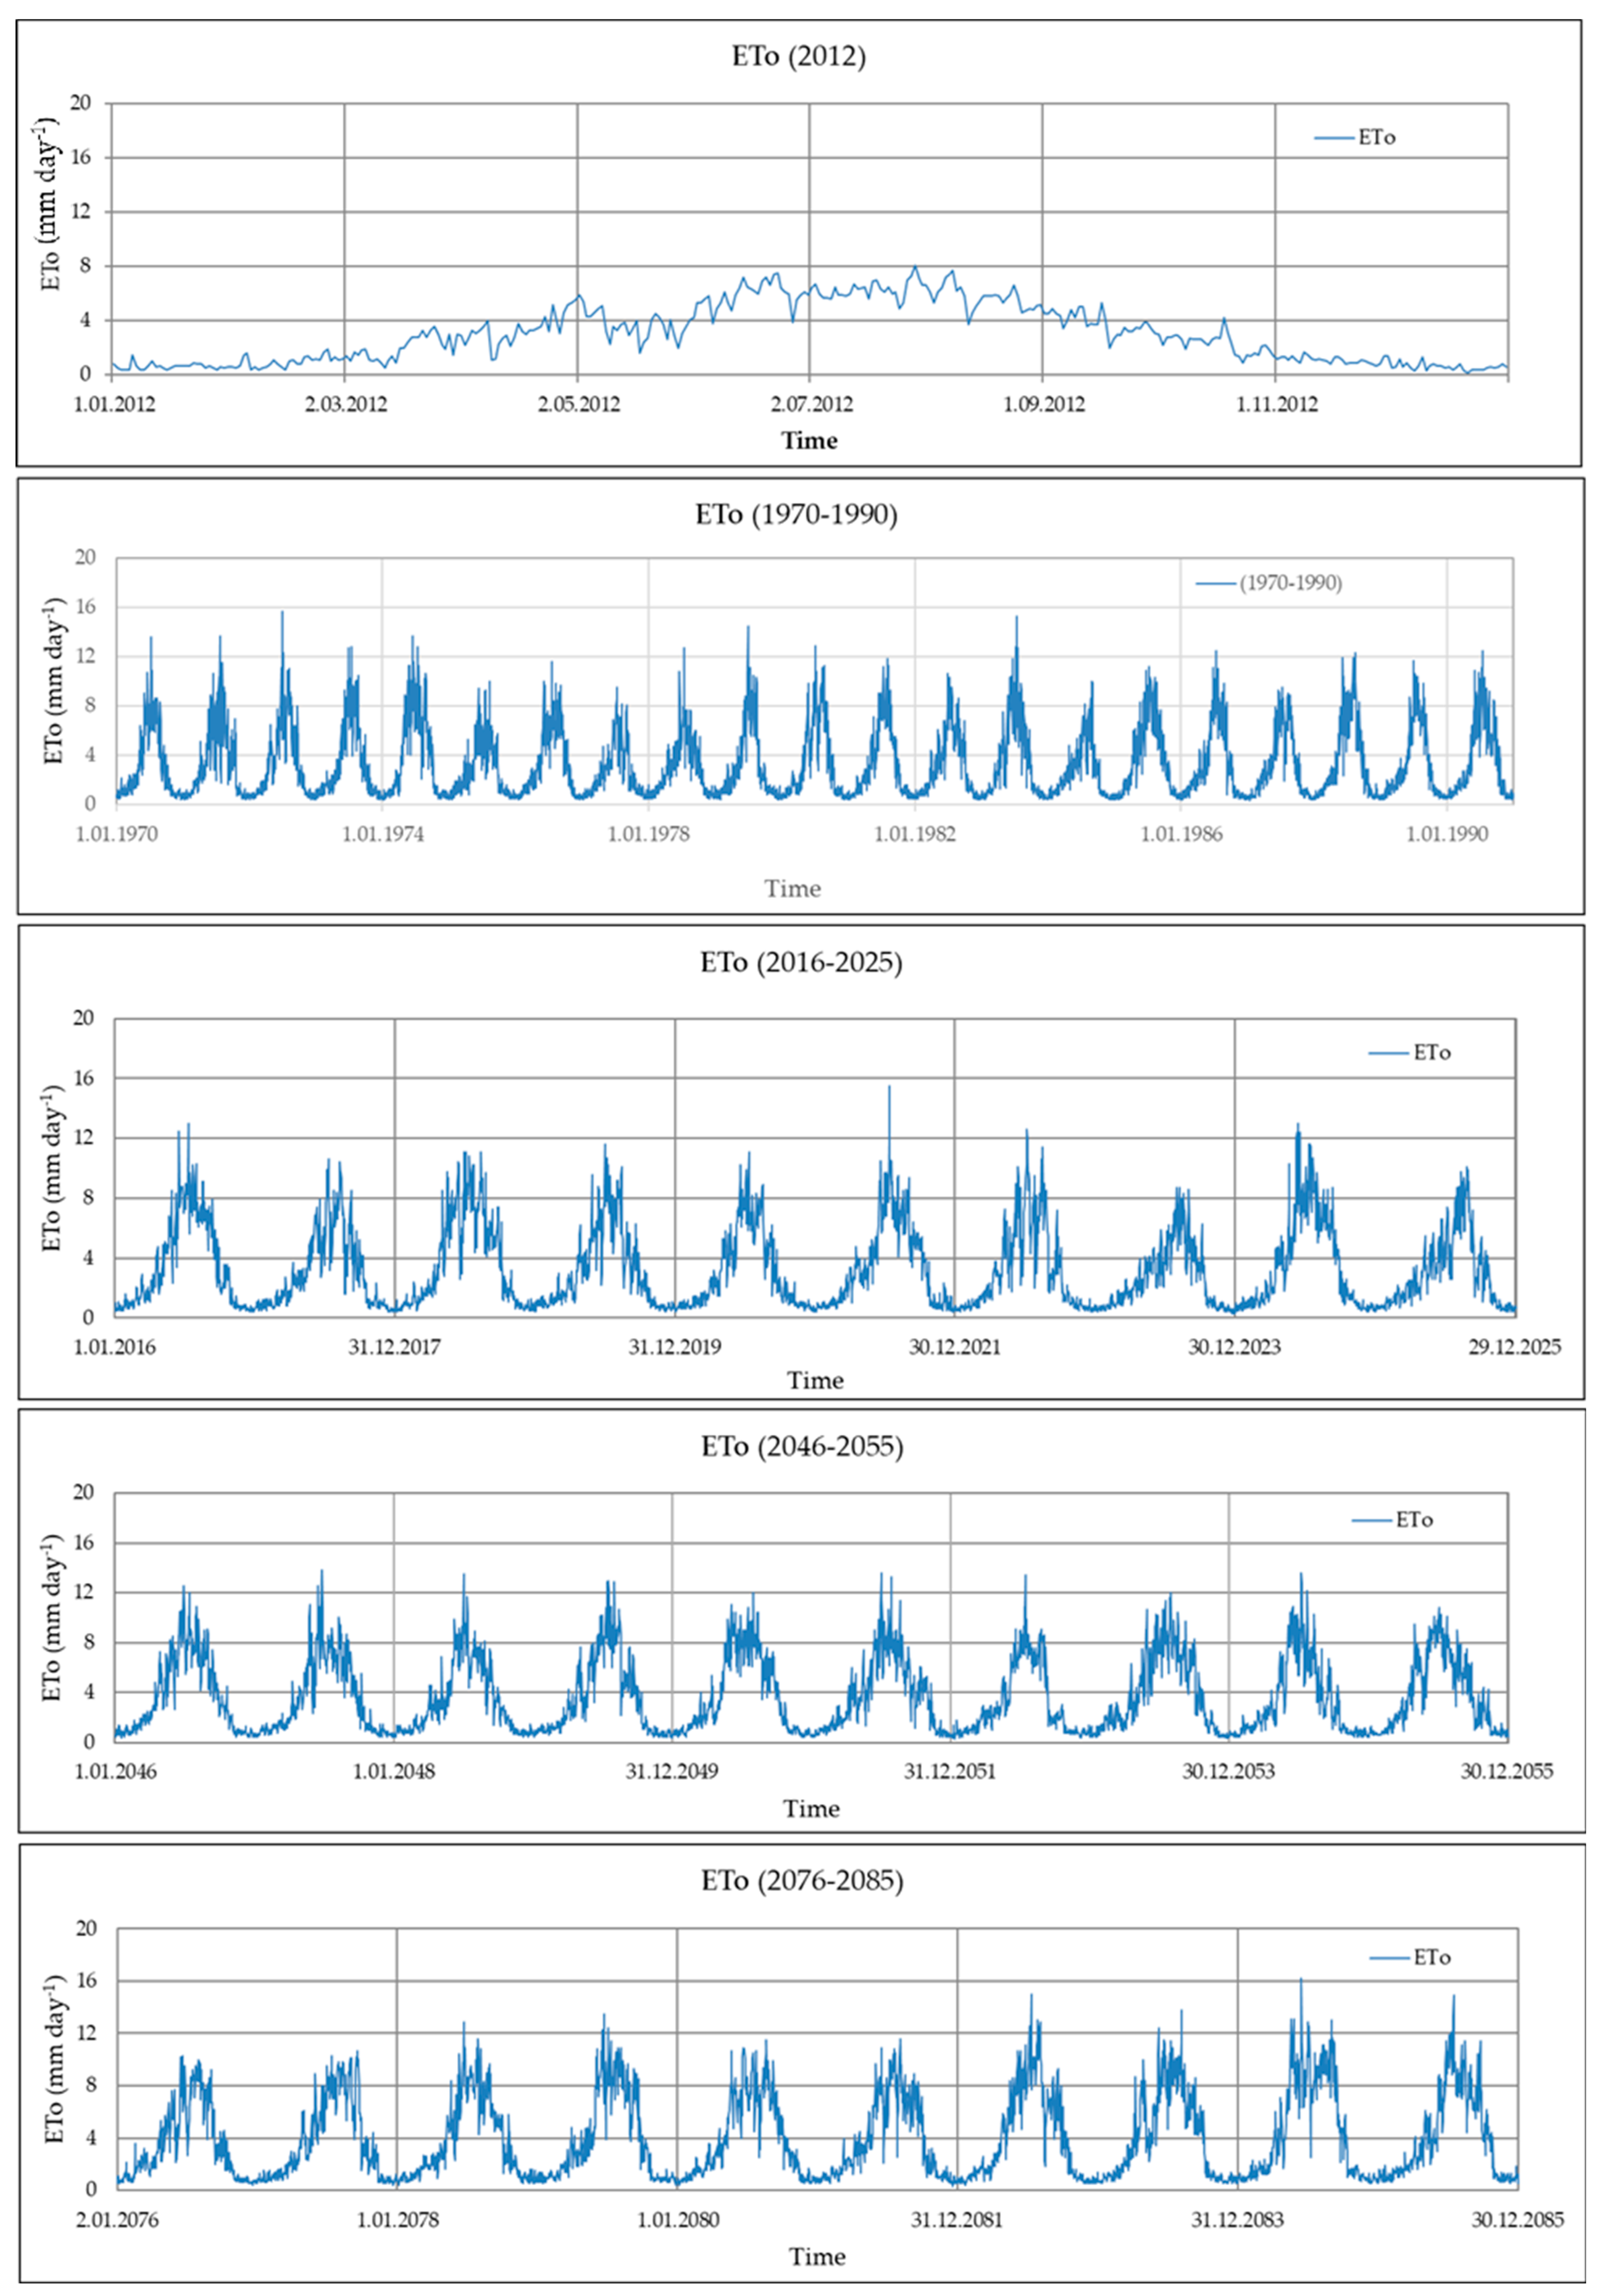
ETo values in Çorlu Pınarbaşı Sub-Basin were calculated for the year 2012, using the RegCM3 Regional Climate Model reference and A2 scenario outputs for the future short, medium, and long terms. These values are shown in Table 4 and Figure 2. Accordingly, the average ETo value for 2012 was 3.0 mm day−1. In 2012, ETo varies between 0.2 mm day−1 and 8.1 mm day−1. The average ETo value for the model reference period is 3.3 mm day−1. In this period, ETo varies between 0.3 mm day−1 and 15.7 mm day−1. The minimum ETo values in 2016–2025, 2046–2055, and 2076–2085 are estimated to be 0.3 mm day−1 in all three periods. From short term to long term, the maximum ETo values are 15.5 mm day−1, 13.8 mm day−1, and 16.2 mm day−1 from short term to long term, respectively.
In a study conducted in the research area, it is estimated that there will be an average temperature increase of 0.12 °C between 2016–2025, 1.43 °C between 2046–2055, and 3.05 °C between 2076–2085 compared to the model reference years (1970–1990). It is also predicted that total precipitation will increase by 60 mm between 2016–2025 (9%), decrease by 91 mm between 2046–2055 (−14%), and decrease by 78 mm between 2076–2085 (−12%) [32]. In another study conducted in the region, it was predicted that temperatures would increase, and precipitation would increase and decrease periodically according to the results of climate change predictions in the region [10]. According to these two studies conducted in the region, it is predicted that temperatures will increase in the coming periods compared to previous years and precipitation will change. Meanwhile, in 2012, the average ETo values were 3.0 mm day−1; this is estimated to increase to 3.2 mm day−1 (+7%) in 2016–2025, 3.6 mm day−1 (+20%) in 2046–2055, and 4.0 mm day−1 (+33%) in 2076–2085 compared to 2012. While the average ETo value for the model reference period (1970–1990) was 3.3 mm day−1, it was predicted to decrease to 3.2 mm day−1 (−3%) between 2016–2025, 3.6 mm day−1 (+9%) between 2046–2055, and 4.0 mm day−1 (+21%) between 2076–2085. Since the years 2016–2025 are in the near future and only a 0.12 °C temperature increase is predicted, a 3% decrease is considered normal.
Since the near-future forecasts for the period 2016–2025 are currently being experienced, there was a need for verification between these dates (1 January 2016–9 September 2024). Climate data between these dates were obtained from Tekirdağ Meteorology Directorate. ETo values were calculated with these climate data and compared with the ETo values calculated from the output results of the short-term (2016–2024) RegCM3 Regional Climate Model A2 scenario. During the comparison, a matched-pairs test was performed in JMP Pro 17.0 program. No statistical difference was found in the average ETo value calculated from the measured and predicted climate data in the matched-pairs test performed in JMP Pro 17.0 [52]. The correlation between the averages was calculated as 0.78. As seen in Table 4, the minimum ETo values are the same, but there is a 3% difference in the average ETo values. The maximum ETo using climate change data is 15.5 mm day−1, whereas it was 9.3 mm day−1 using measured climate data in the 2016–2025 period.
Özkul et al. [53] estimated that plant water requirements (potential evapotranspiration) will increase by approximately 10%, 15%, and 30% for the years 2030, 2050, and 2100, respectively, in Gediz and Büyük Menderes basins. Similarly, Şen et al. [54] predicted a decrease in effective precipitation and thus in water resources in the Seyhan Basin, but an increase in plant water requirements. Azlak [3] showed that evaporation in Kırklareli, Edirne, and Tekirdağ will increase by 10–15% in the future period (2015–2040) compared to the past period (1975–2010) within the framework of climate change. Azlak and Şaylan [24] determined the impact of climate change on ETo in three cities of the Thrace Region (Edirne, Kırklareli, Tekirdağ). Using the model outputs obtained from the ECHAM-5 model under the A1B scenario, they estimated that ETo will increase by 9–14% in the 2015–2040 period compared to the 1975–2010 period within the framework of climate change. These studies conducted in the same region support each other in terms of the increase in ETo. When the reference period is 2012 and 1970–1990, it is thought that the ETo change between 2016–2025 is below these studies because it is in the near future and is the period when the temperature increase is the lowest. Compared to the 2015–2040 period, the 2046–2055 period is a more advanced period and is also a period in which temperature increase is more likely to be experienced. It is thought that the scenario differences do not affect the ETo values in these two periods very much because, according to IPCC [55], after approximately 2060, CO2 concentrations in the A2 and A1B scenarios increase more in the A2 scenario than in the A1B scenario until 2100. Since the 2076–2085 period is the most distant period and is expected to be the period in which the temperature increase and precipitation changes will be the highest, the A2 scenario used in this study is a more pessimistic scenario compared to the A1B scenario used in the other study. The ETo estimate is 20% and 9% compared to 2012 and the model reference period (1970–1990). Therefore, although the estimated period is different, a close estimate has been realized. It is estimated that there will be an increase of 33% and 21% in the 2076–2085 compared to the 2012 and 1970–1990 periods, respectively. These rates are well above the compared rates. This is considered normal because the A2 scenario is a more pessimistic scenario and the largest precipitation and temperature changes are estimated to occur in this period. As a result, it is estimated that ETo values will increase as we move towards the distant periods. Arabi and Candoğan [26] calculated ETo values with the data between 1990–2020 in their study in the Marmara Region and determined statistically significant increasing trends in ETo values in three provinces in the Thrace Region (Edirne, Kırklareli, and Tekirdağ). Selçuk [25] found that increasing temperature values were also effective on Malatya province and that ETo amounts also increased with changing climate parameters. Bayramoğlu [2] determined that the amount of ETo increased with increasing temperature in Trabzon. Although the areas where these two studies were conducted are different, they are studies showing that ETo increases with increasing temperature and support the results obtained.

3.2. Evaluation of ETo and ET (Sunflower) Values in Terms of Sunflower Cultivation in the Reference Period (1970–1990) and Future Short (2016–2025), Medium (2046–2055), and Long (2076–2085) Periods

In Çorlu Pınarbaşı Sub-Basin, using ETo values in the model reference period and future periods, sunflower plant water consumption (ETs) was calculated and is shown in Figure 3.
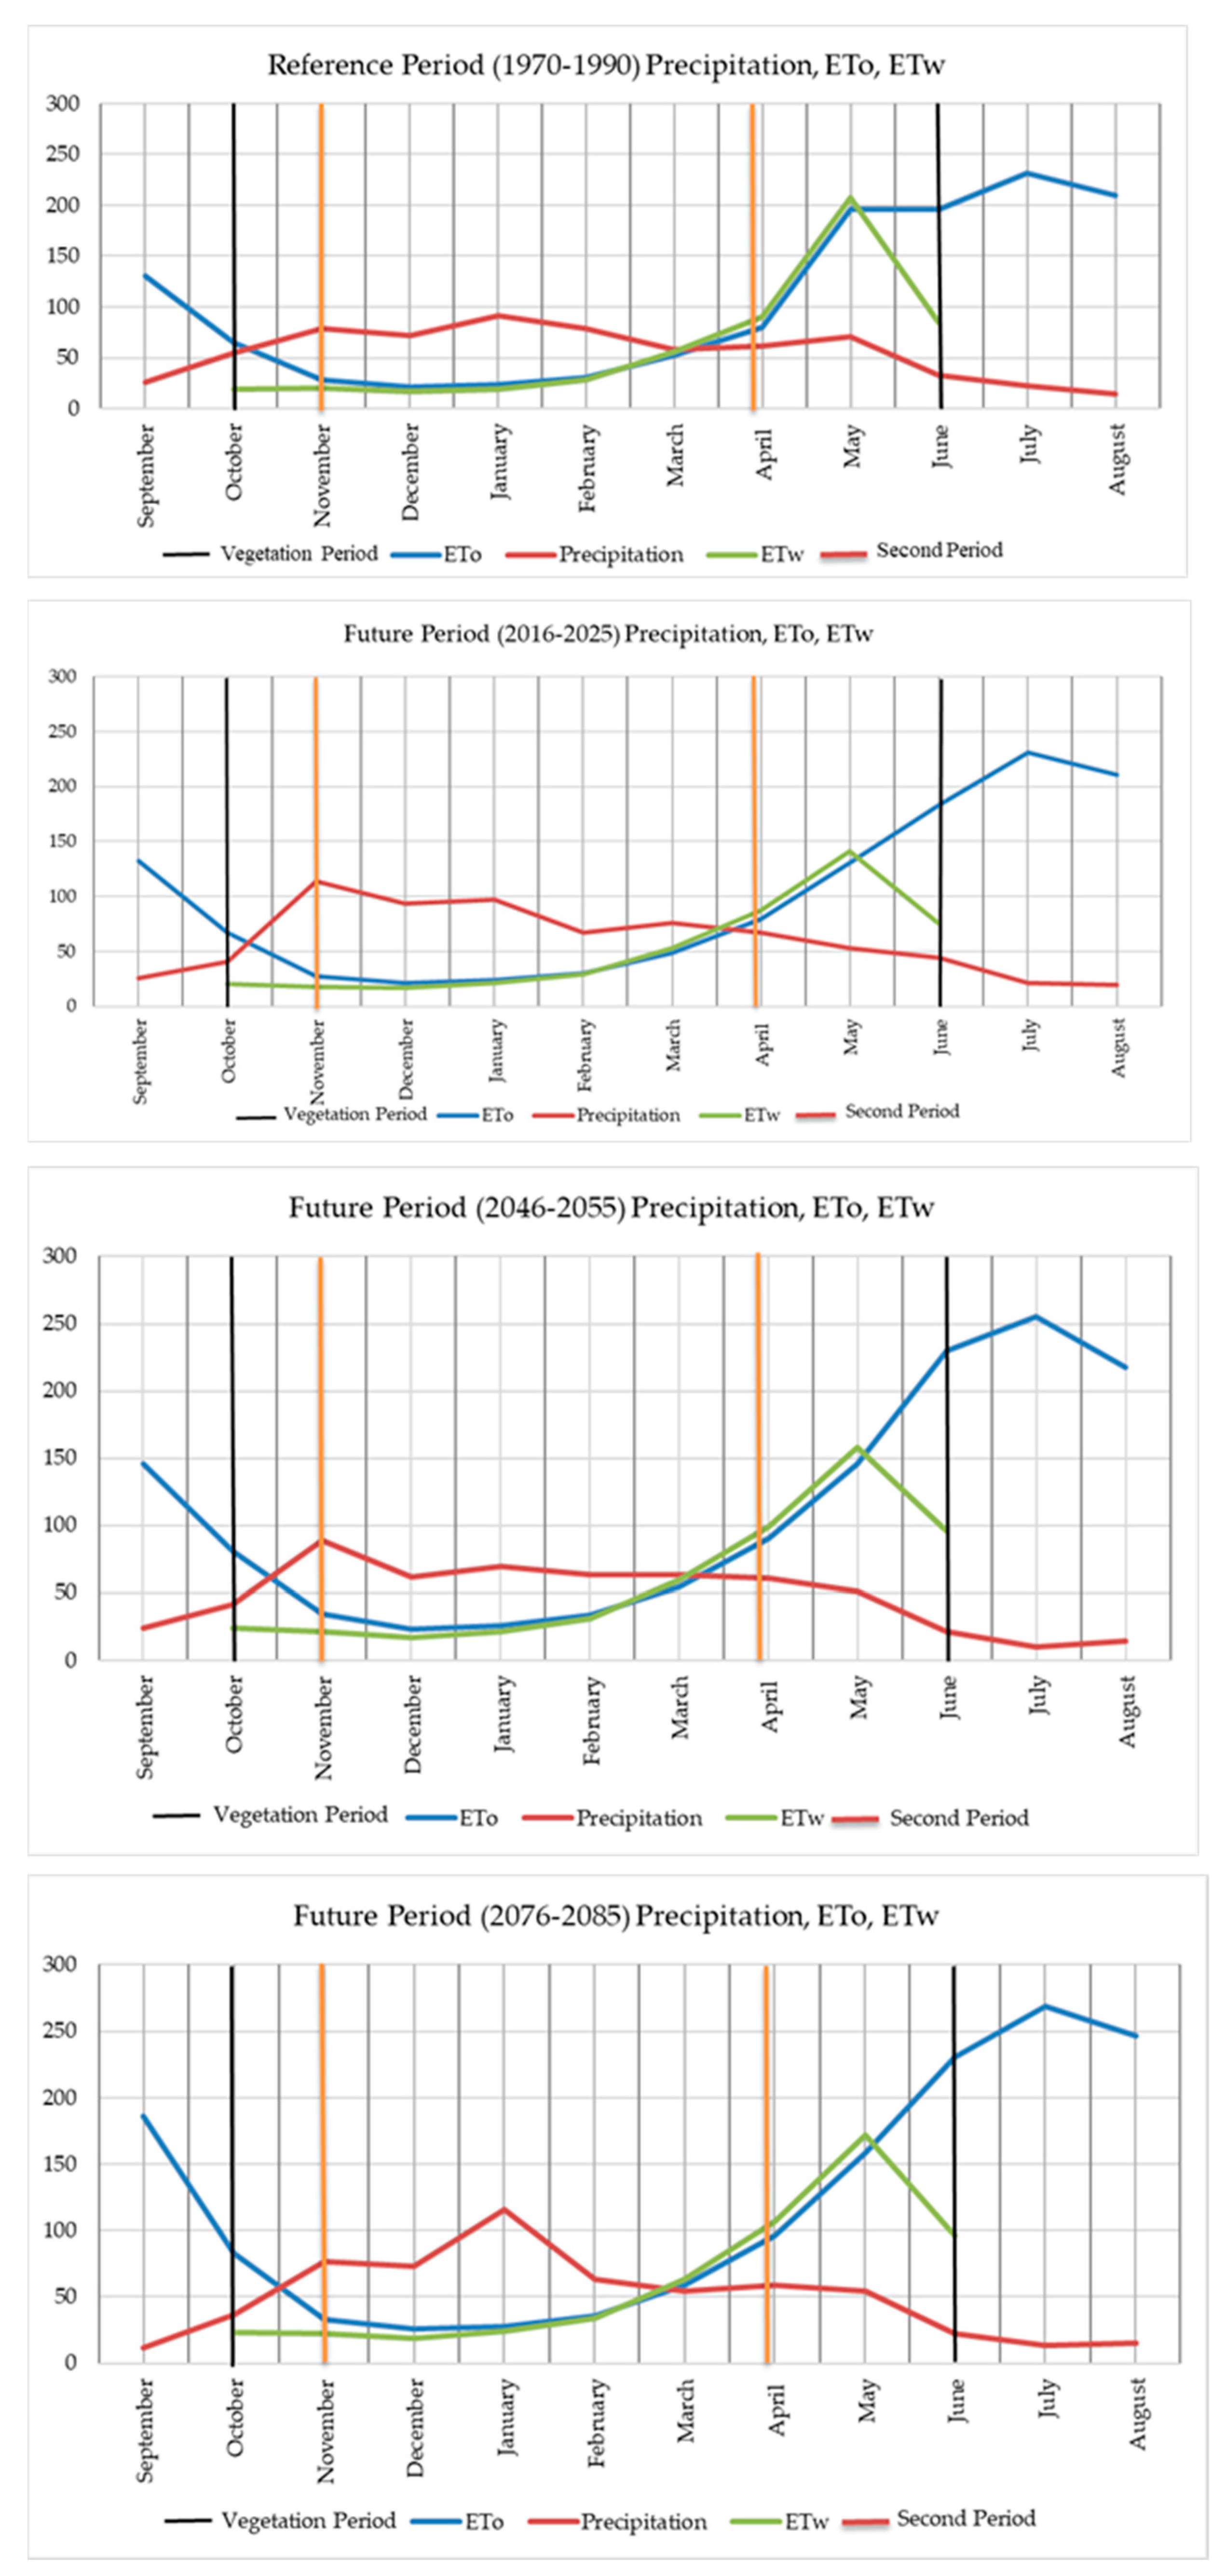
The vegetation period for sunflower in the research area was taken between April and September on average [41]. The beginning and end of the vegetation period is indicated by the black line in figures. Plant water deficit or plant water stress has been defined as being when plant water status is reduced sufficiently to affect normal plant functioning (e.g., plant growth, stomatal conductance, rate of photosynthesis) [56]. According to ETo values, during the growing period of sunflower, a water deficit occurred in the reference period (1970–1990) and in the following short, medium, and long periods. ETo reached the highest value in July. The period indicated by the orange line in Figure 3 is the beginning and end of the development period for sunflower, which is determined as the second period. This period starts with the end of the initial period and covers the period when the green parts of the plants develop rapidly. When this development slows down or stops, the growth period is over. It is assumed that the Kc coefficient increases every day during this period. According to the research area, it lasts 30 days in sunflower [41].
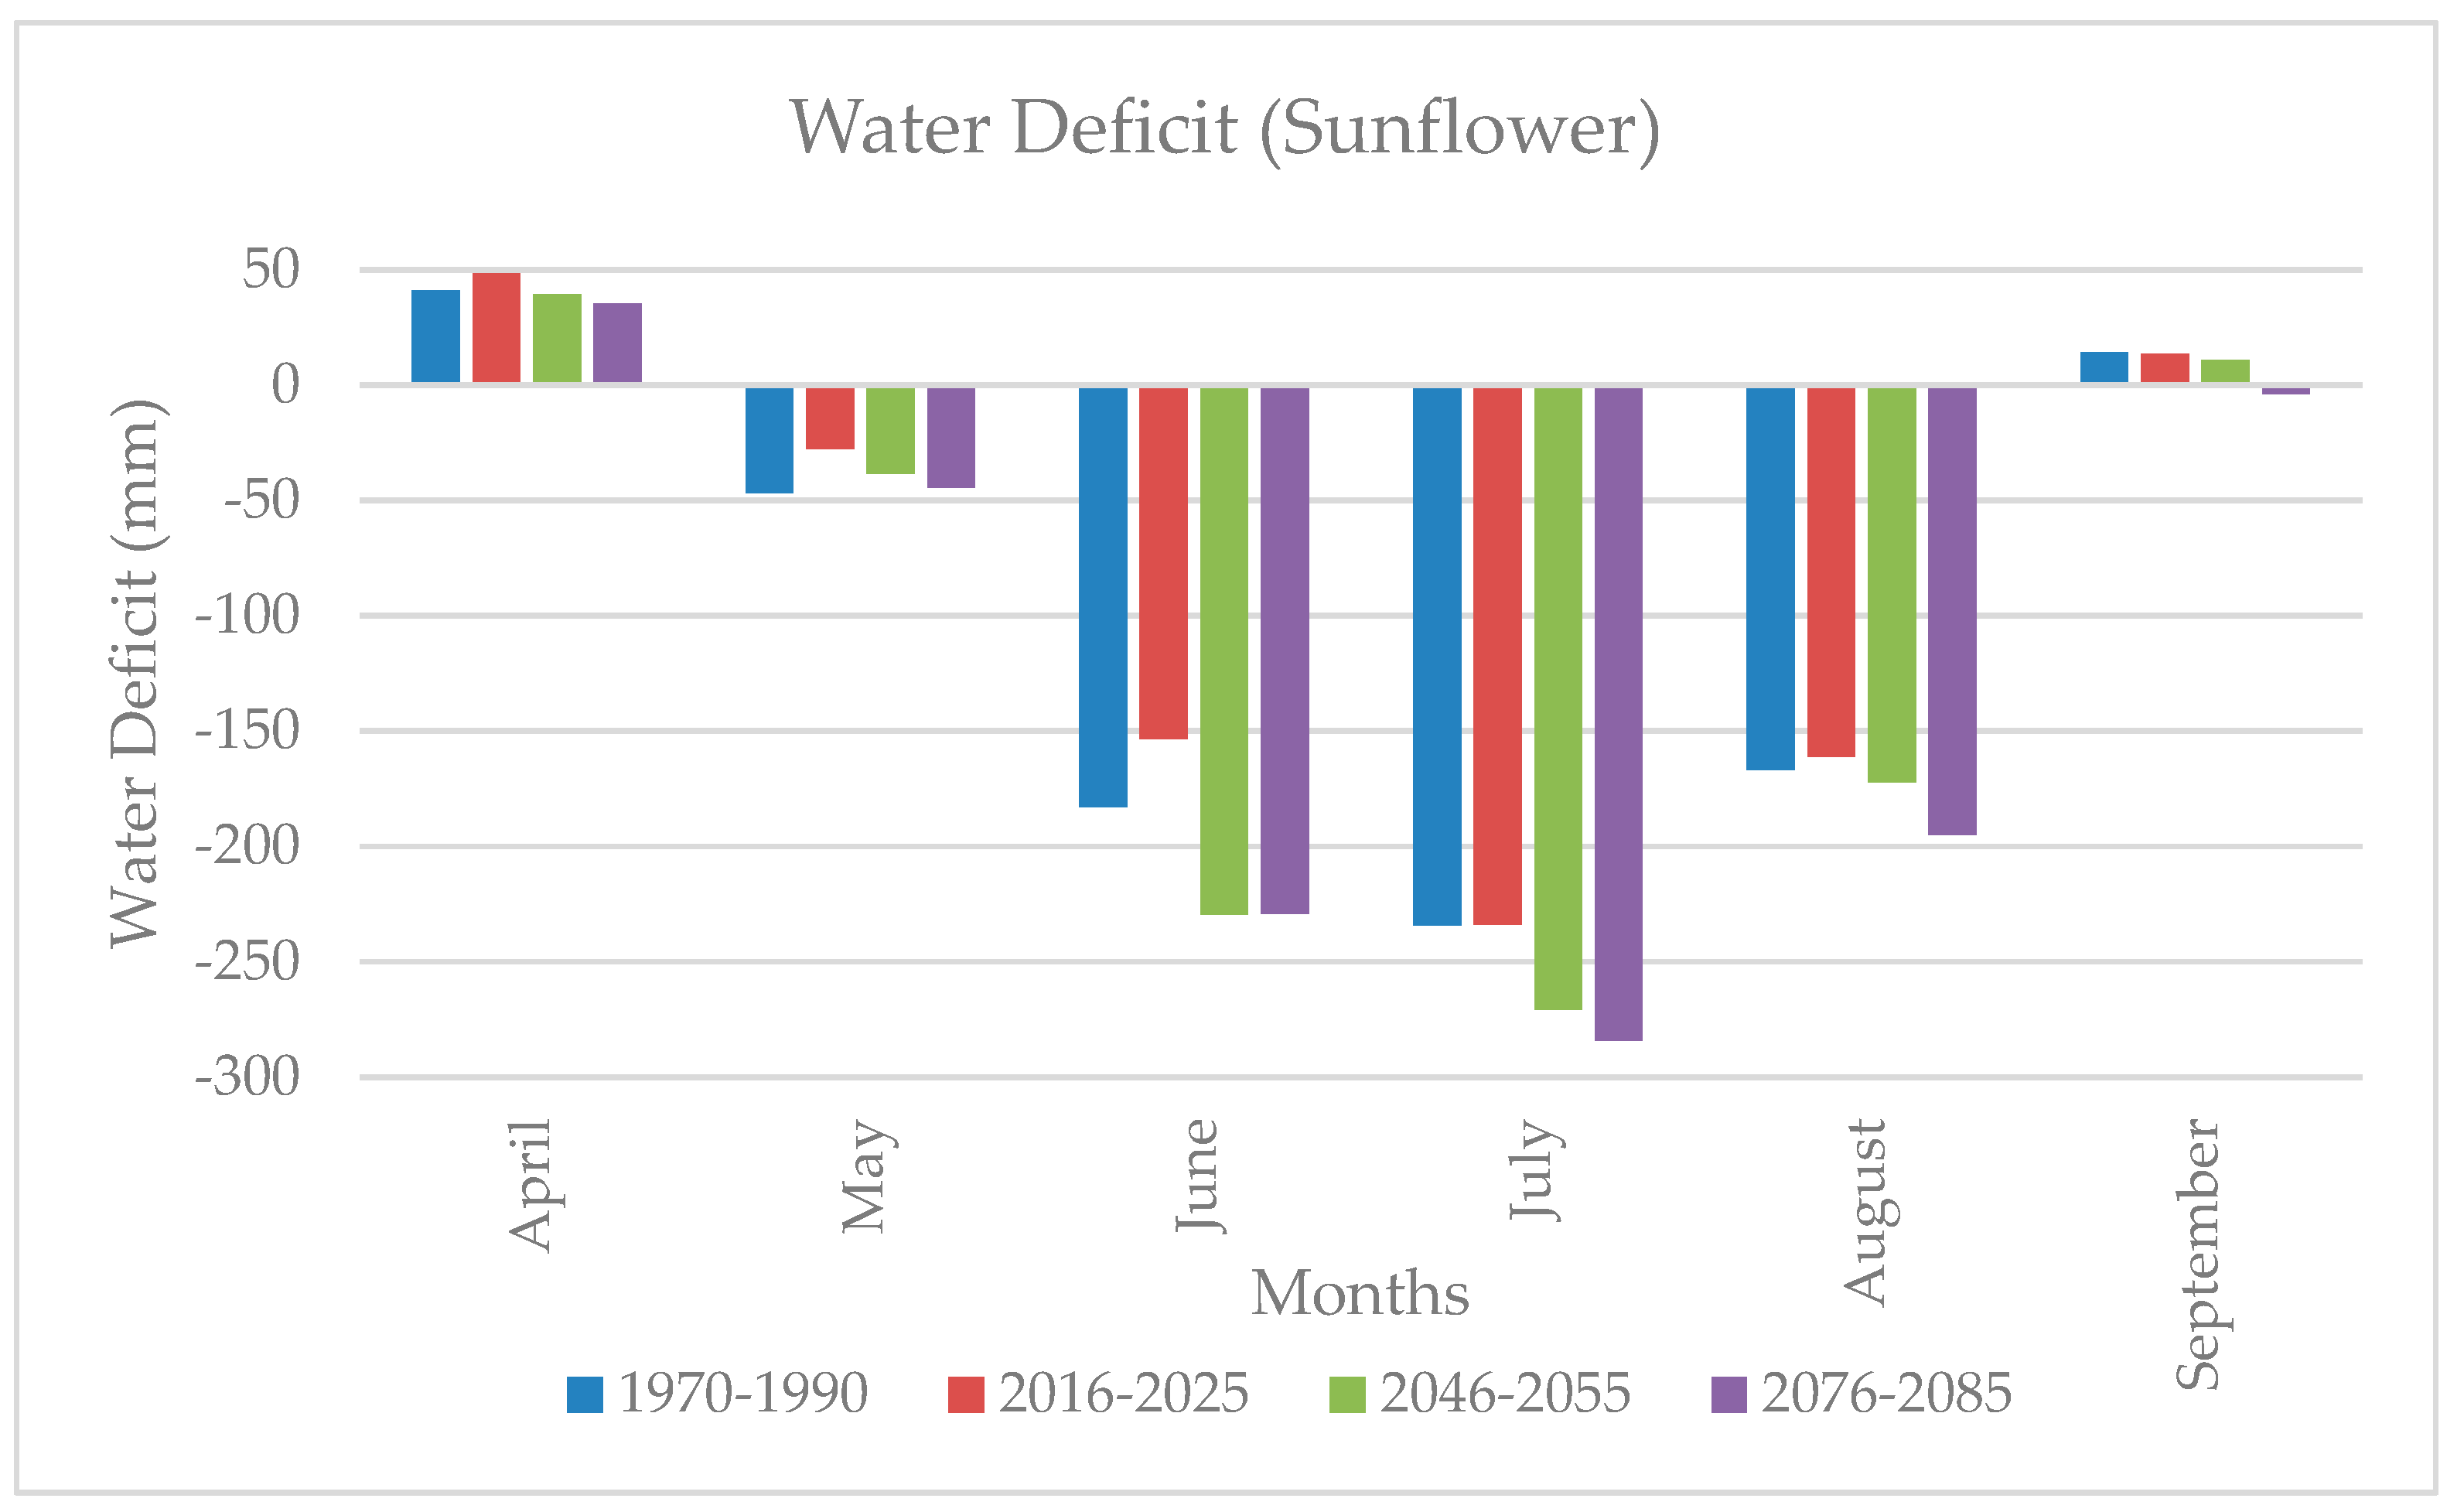
The water deficits between ETs values and precipitation values for the reference period and RegCM3 Regional Climate Model, the A2 scenario outputs and future short, medium, and long periods are shown in Figure 4. During the growing period of sunflower, according to the ETs values in the reference period and future periods in Figure 4, a water deficit occurred in May, June, July, and August in every period, and even in September in addition to these months in the 2076–2085. The largest water deficit is estimated to occur in July in the reference and future periods.
While a water deficit of 575 mm occurred in the reference period (1970–1990) during the vegetation period for sunflower, it was estimated that a water deficit of 514 mm (−11%) would occur in the 2016–2025, 660 mm (+15%) in the 2046–2055 period, and 721 mm (+25%) in the 2076–2085 period. This is because temperatures will increase by 0.12 °C, 1.43 °C, and 3.05 °C more from the near period to the far period, respectively [32]. The reason for remaining below the reference period in the 2016–2025 period can be explained as follows. The temperature will increase by 0.12 °C less than the other periods. In addition, precipitation increased in the 2016–2025 period (9%) and decreased in the other periods [32]. For sunflower, it is estimated that the water deficit will decrease in the period 2016–2025 and increase in the periods 2046–2055 and 2076–2085 compared to the reference years (1970–1990) during the vegetation period.
While a water deficit of 230 mm occurred in May and June during the sunflower second period in the reference period (1970–1990), it is estimated that a water deficit of 181 mm (−21%) will occur in the 2016–2025 period, 268 mm (+17%) in the 2046–2055 period, and 274 mm (+19%) in the 2076–2085 period. Therefore, compared to the reference period, the water deficit in the plant development period, i.e., in the second period, will decrease in the 2016–2025 period and increase in the future periods 2046–2055 and 2076–2085.
It can be considered that the soils of the Thrace Region are generally medium and heavy textured, deep, and have high water holding capacity in as shown in Table 2. In addition, considering that the excessive rainfall in January, February, March, and April, as shown in Figure 3, is retained in the soil and dew is formed, although yields close to the potential can be obtained in the near future and even in the current period (2016–2025) without the need for irrigation, it is estimated that the water deficit will increase in the future periods when the years 2046–2055 and 2076–2085 are compared. Considering that the critical period for sunflower cultivation cannot be overcome, it can be predicted that supplementary irrigation may be needed.

3.3. Evaluation of ETo and ET (Wheat) Values in Terms of Wheat Cultivation in the Reference Period (1970–1990) and Future Short (2016–2025), Medium (2046–2055), and Long (2076–2085) Periods

In Çorlu Pınarbaşı Sub-Basin, using ETo values for the model reference period and future periods, wheat plant water consumption (ETw) was calculated and shown in Figure 5. The vegetation period for wheat in the research area was taken between October and June on average [41]. The beginning and end of the vegetation period is indicated by the black line in the figures. During the growing period of wheat, it was observed that rainfall was sufficient from October to March in the reference period and in the future periods. According to ETo values, water deficit was predicted to occur in April, May, and June. ETo reached the highest value in May. The period shown with an orange line in Figure 5 is the beginning and end of the development period for wheat, which is determined as the second period. According to the research area, it lasts 146 days for wheat [41].
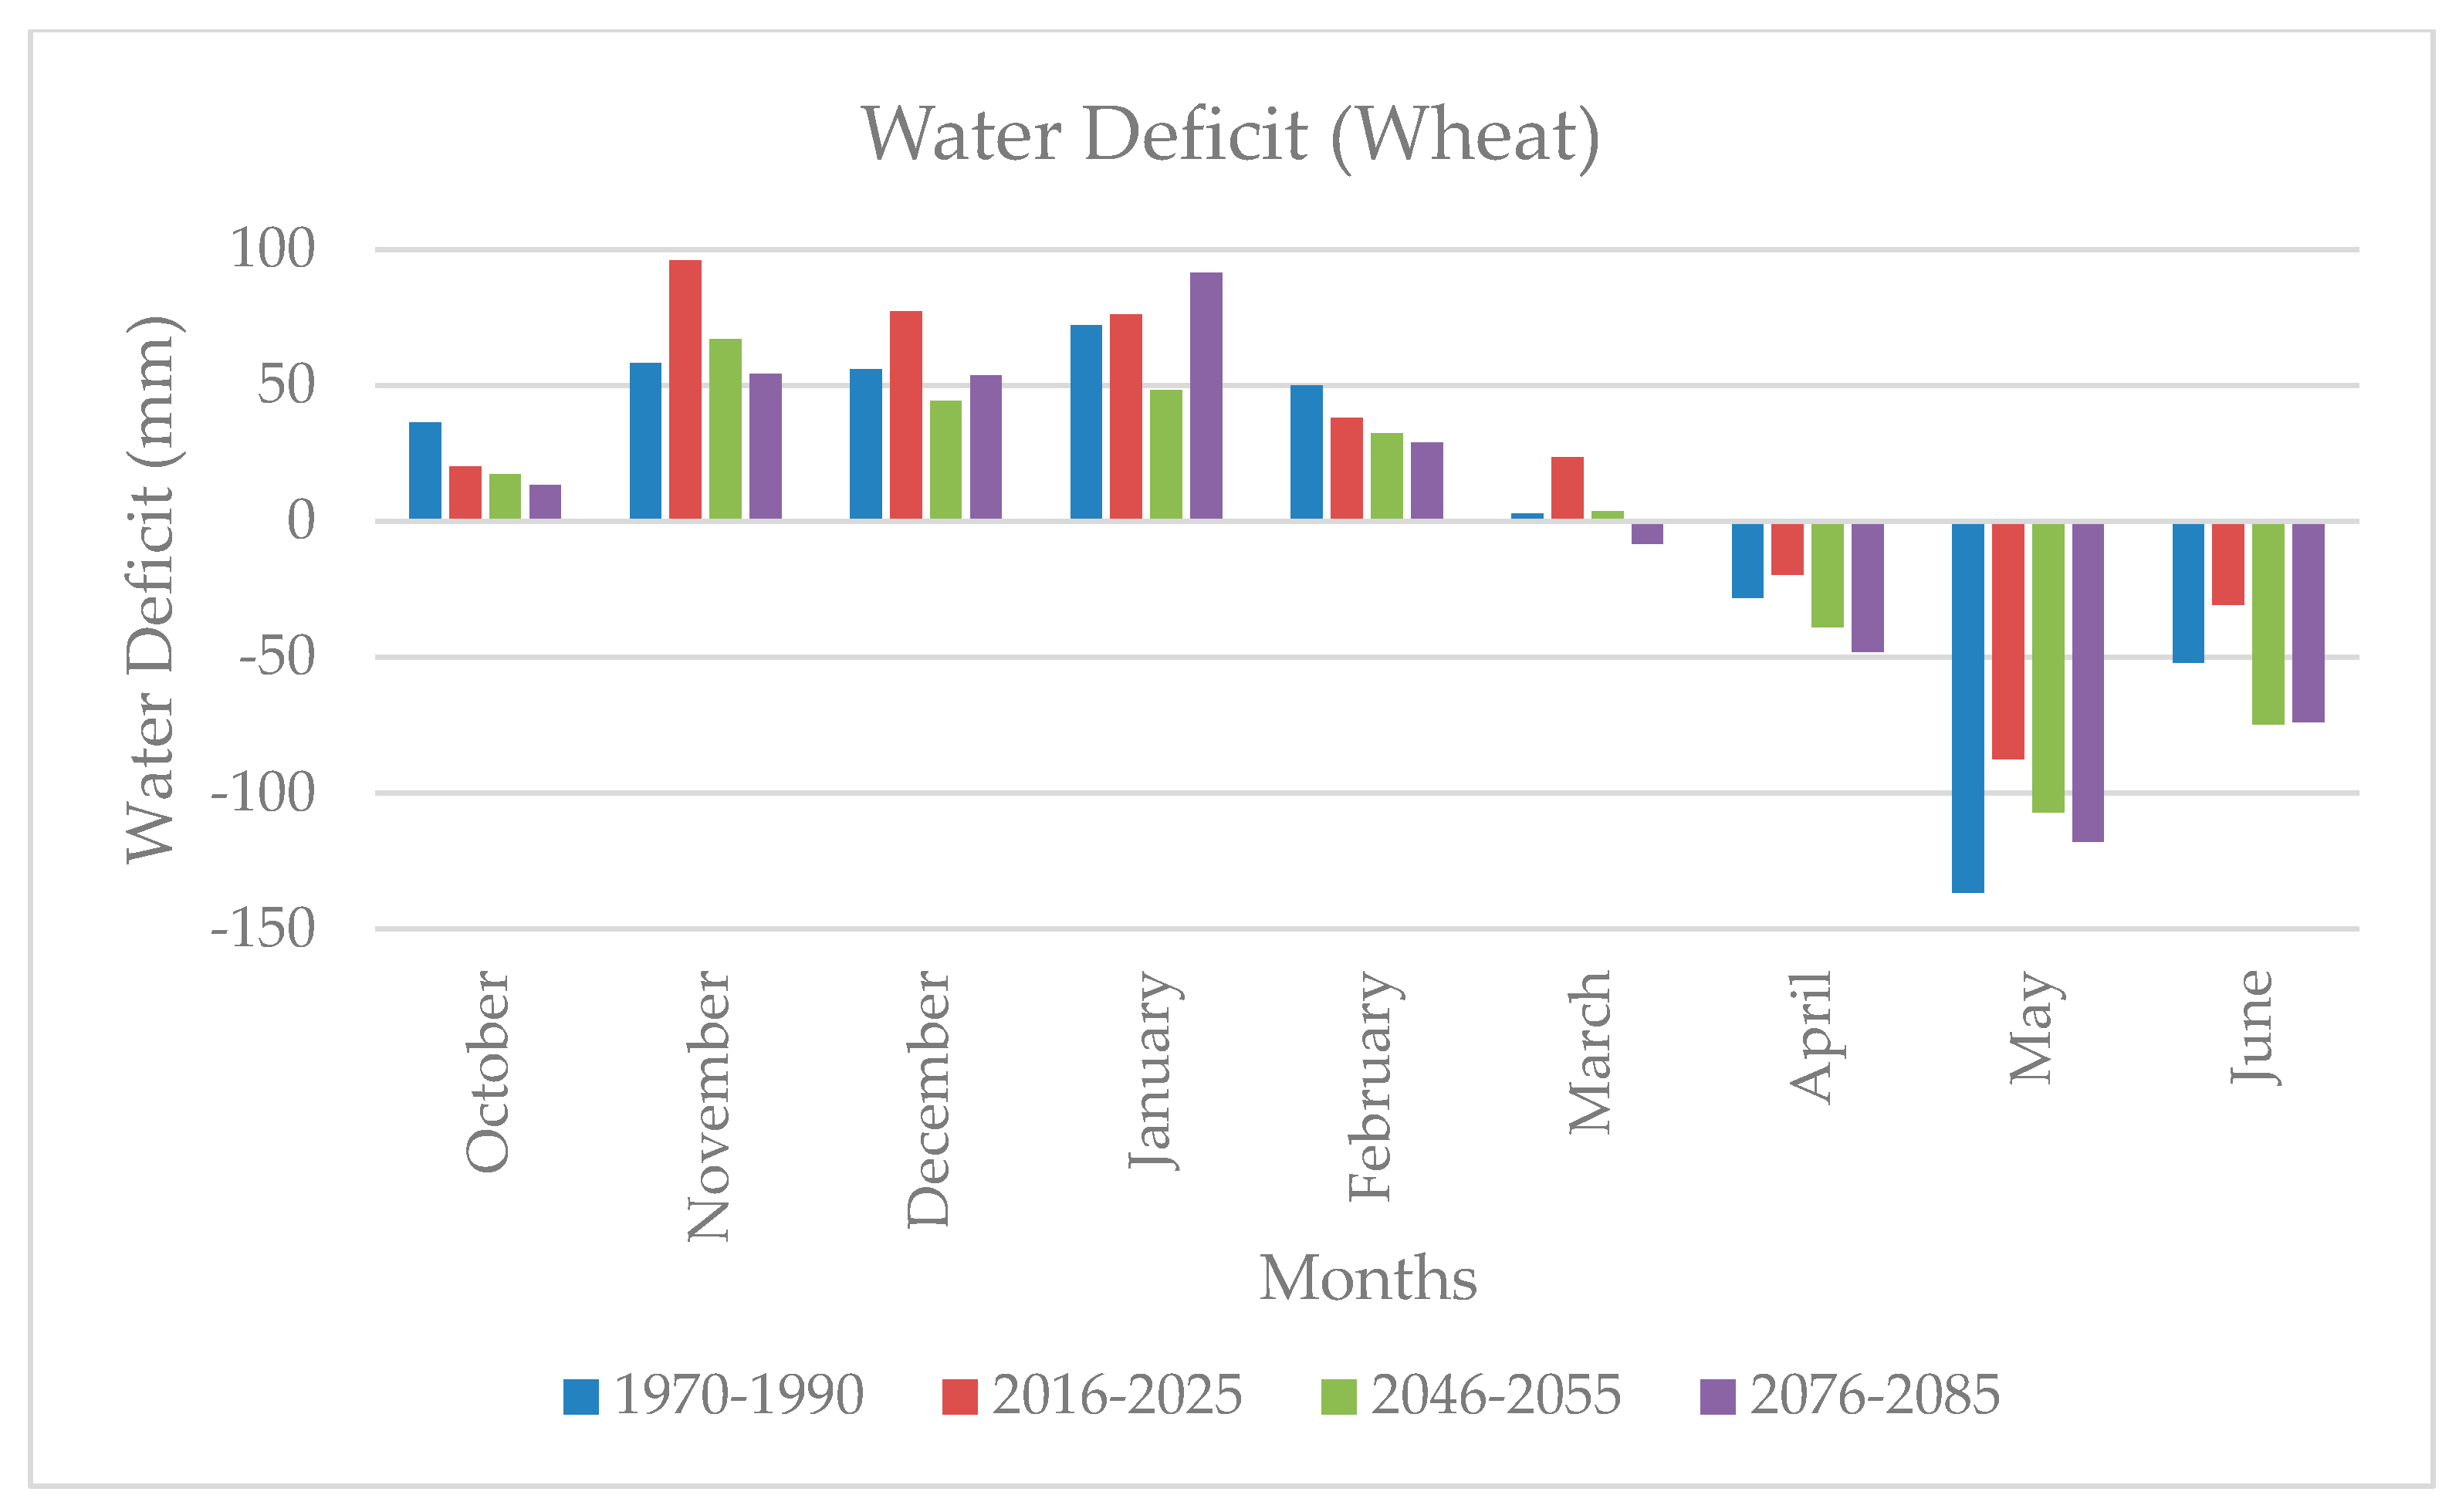
The water deficits between ETw values and precipitation values for the reference period (1970–1990) and future periods with the results of RegCM3 Regional Climate Model, A2 scenario outputs are shown in Figure 6. During the growing period of wheat, according to ETw values in the reference period and future periods in Figure 6, water deficit occurred in April, May, and June in every period and even in March in addition to these months in 2076–2085. The largest water deficit is predicted to occur in May in the reference and future periods.
During the vegetation period for wheat, a water surplus of 59 mm in the reference years (1970–1990), a water surplus of 193 mm (+227%) in the 2016–2025 period, a water deficit of 8 mm (−113%) in the 2046–2055 period, and a water deficit of 6 mm (−110%) in the 2076–2085 were estimated. Wheat has a long vegetation period. In addition, temperatures are predicted to increase by 0.12 °C, 1.43 °C, and 3.05 °C from the near to the far period, respectively [32]. The reason why the 2016–2025 period is above the reference period can be explained as follows. The period in which the temperature is likely to increase by the least amount of 0.12 °C compared to other periods and precipitation increased in the 2016–2025 period (9%) and decreased in the other periods [32]. Therefore, the occurrence of such a situation is considered normal. It is also predicted that total precipitation will increase by 60 mm between 2016–2025 (9%), decrease by 91 mm between 2046–2055 (−14%) and decrease by 78 mm between 2076–2085 (−12%). So, the water deficit is considered likely to increase gradually.
During the wheat second period, a water surplus of 239 mm occurred between November and April in the reference period (1970–1990), while a water deficit of 311 mm (+30%) was estimated to occur in the 2016–2025 period, 196 mm (−18%) in the 2046–2055 period and 220 mm (−8%) in the 2076–2085 period. Therefore, it is estimated that a water surplus will occur in the 2016–2025 period in the plant development period, i.e., in the second period, and a water deficit will occur in the next 2046–2055 and 2076–2085 periods compared to the reference period.
As explained about, the soil in the research area is sandy clay loam and sandy clay and its water holding capacity is high (Table 2). It can also be taken into consideration that the period when the excess precipitation (Figure 5) in October, November, December, January, February, and March is retained in the soil and the water deficit begins to occur coincides with the end of the second period for wheat. Considering that the water retained in the soil can be used by the plant in the period close to harvest, since the critical period for wheat is overcome in the future 2046–2055 and 2076–2085 periods compared to the reference period, it seems possible to say that the possible water deficit will not be at a level that will affect the yield in terms of wheat cultivation. In fact, in other yield estimation studies conducted in the region, wheat yield is expected to increase, so these studies support this situation [32,33,35,36].

3.4. Evaluation of ETo Values in Case of 1, 2, 3, 4 and 5 °C Increase in Temperature during the Reference Period (1970–1990)

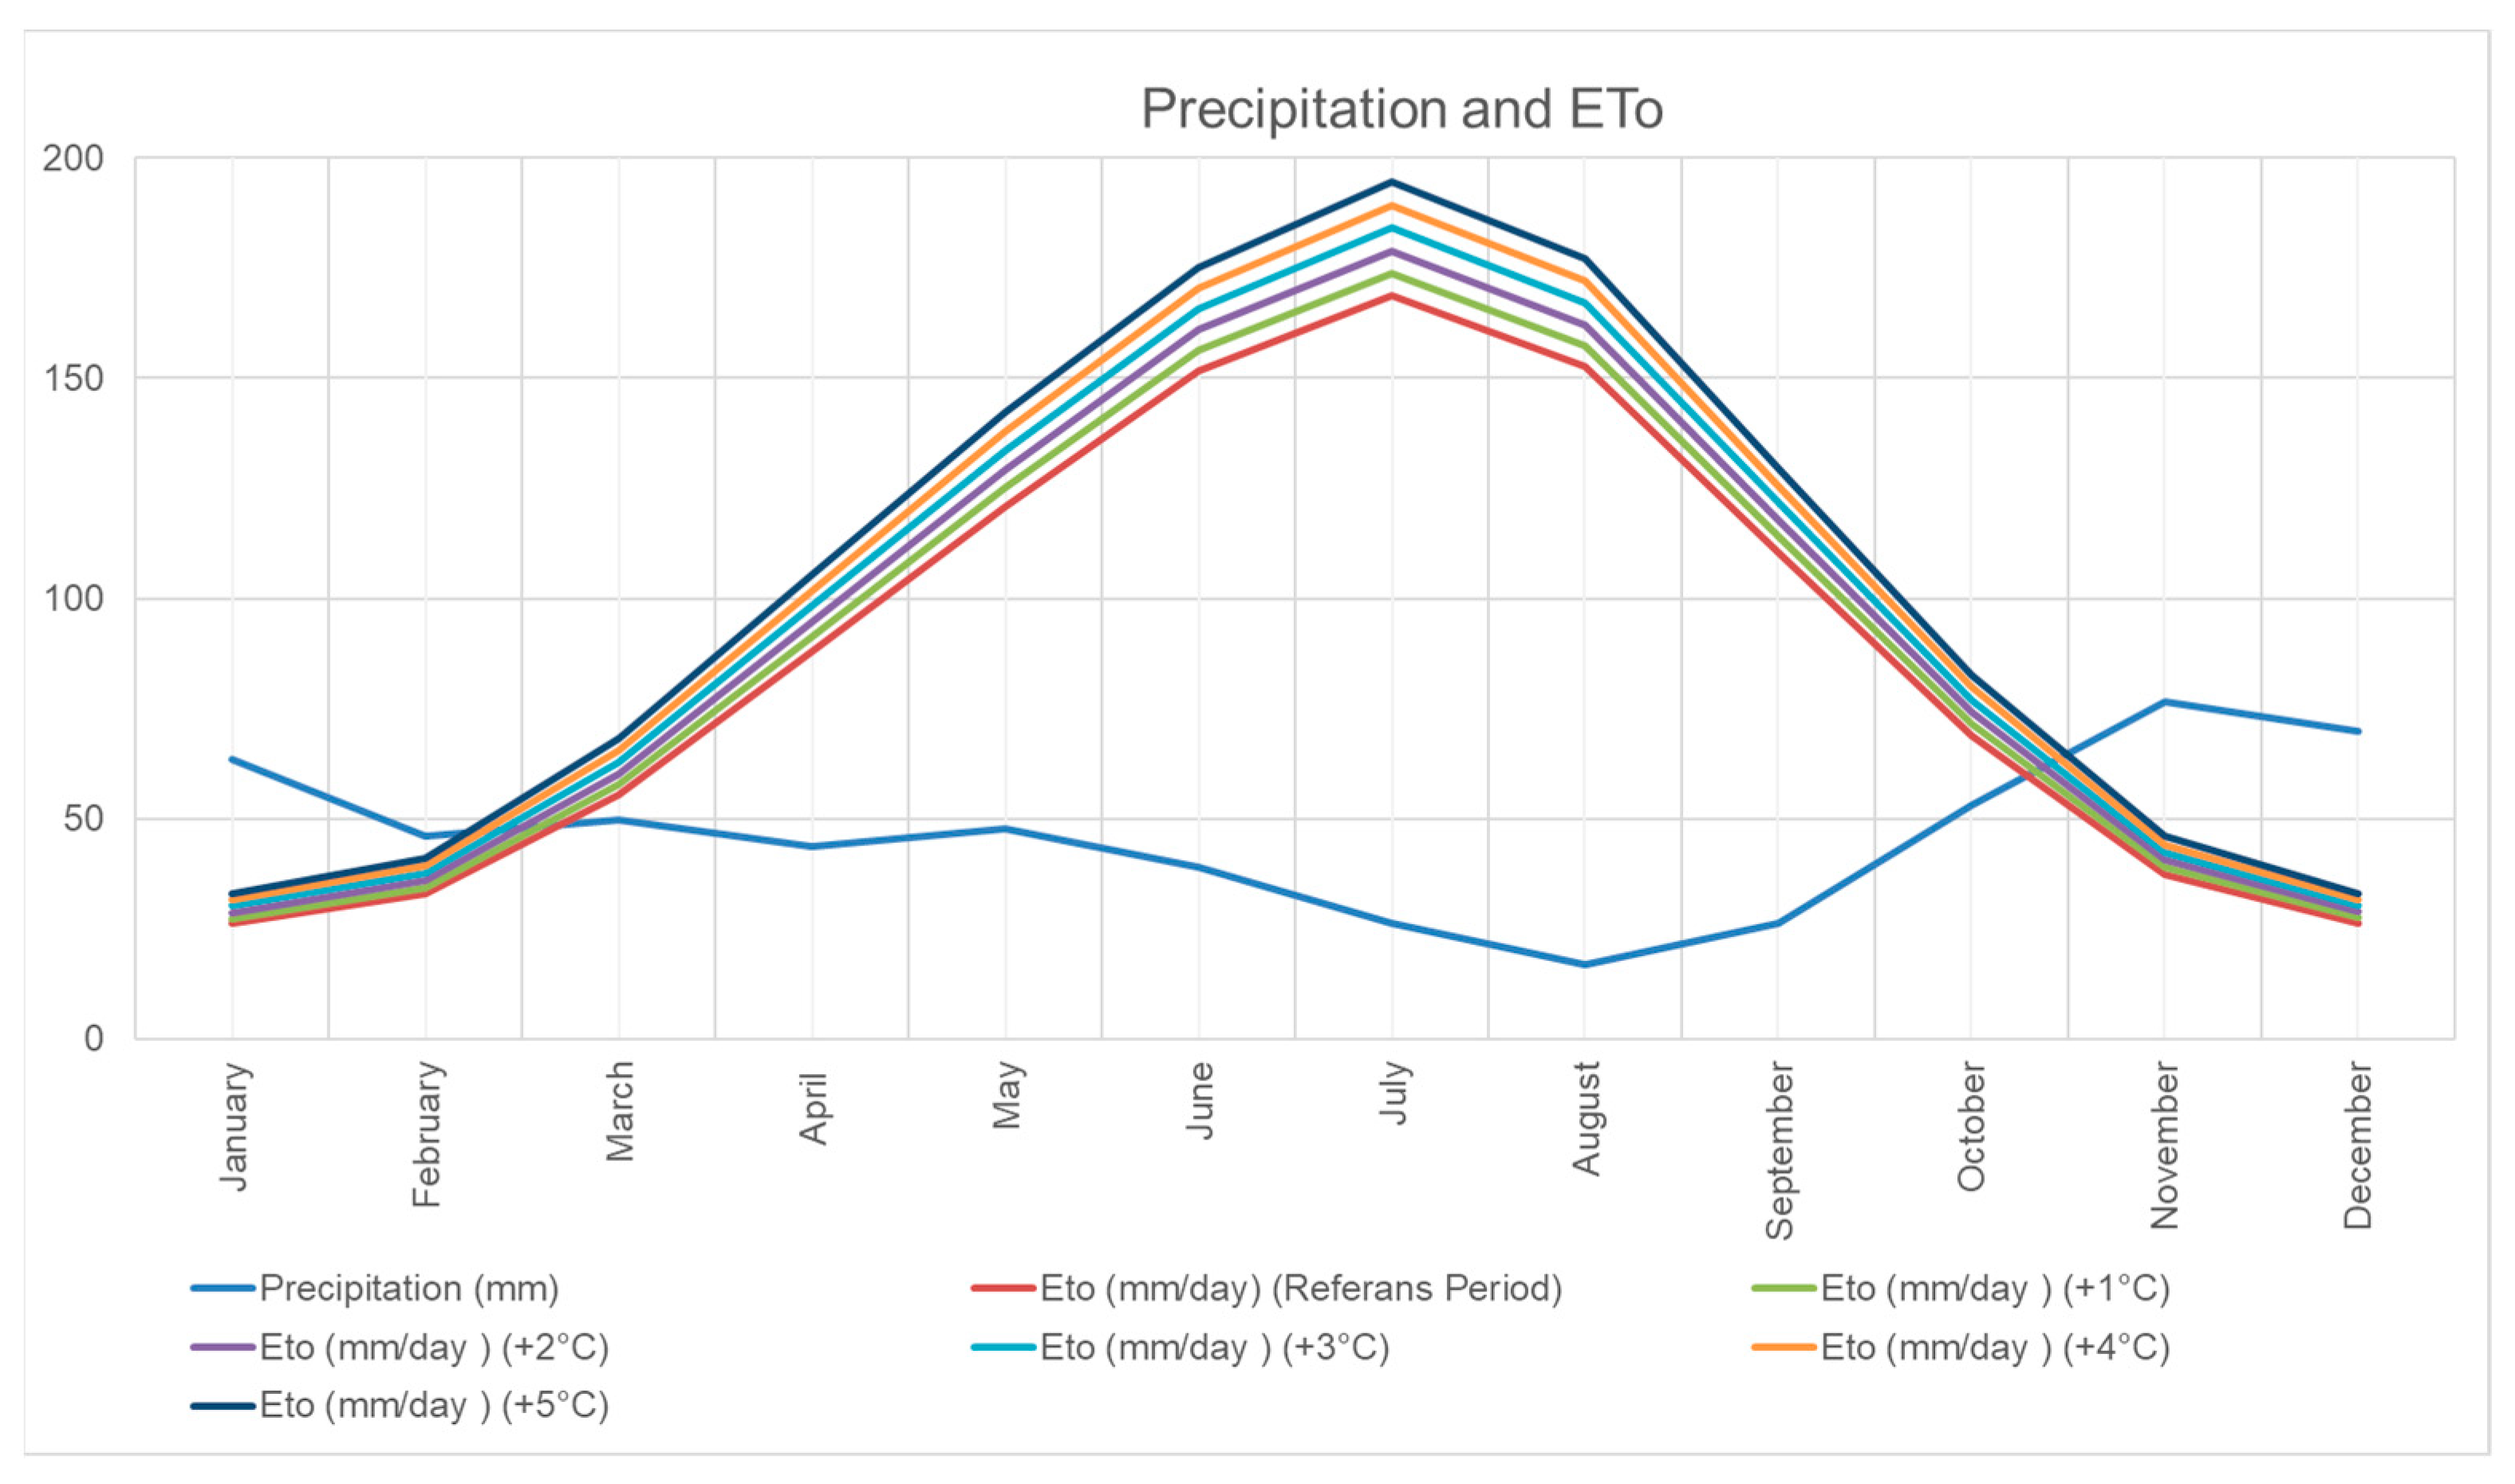
ETo values were calculated for the reference period (1970–1990) and for temperature increases of 1, 2, 3, 4, and 5 °C in the Çorlu Pınarbaşı Sub-Basin and are shown together with precipitation values in Figure 7. The 1970–1990 climate data are climate data measured at the Çorlu Meteorological Station. While the ETo value was 2.8 mm day−1 in the reference period (1970–1990), ETo values were estimated to be 2.9 mm day−1 (3.6%), 3.0 mm day−1 (7.1%), 3.2 mm day−1 (10.8%), 3.3 mm day−1 (14.5%), and 3.4 mm day−1 (18.2%) in case of 1, 2, 3, 4, and 5 °C increases in temperature compared to the reference period, respectively. Comparetrd to the reference period (1970–1990), it was observed that each 1 °C increase in temperature would cause an increase of 0.1 mm day−1 (4%) in ETo values. It is also clear from Figure 7 that ETo increases with temperature increases. These results are in line with the studies of Arabi and Candoğan [26], Özkul et al. [53], Şen et al. [54], Azlak [3], Azlak and Şaylan [24], Selçuk [25], and Bayramoğlu [2]. It is concluded that water deficit will occur especially from March until October, reaching the highest value in July.

4. Conclusions

In this study, by using the RegCM3 Regional Climate Model, the effect of possible climate change on ET in Çorlu Pınarbaşı Sub-Basin, which is in the Meriç-Ergene Main Basin in the Thrace Region, was modeled for the short (2015–2025), medium (2045–2055), and long (2075–2085) periods. It was predicted that ETo values will increase in the future periods (2045–2055 and 2075–2085) when the reference period is 2012 and the reference period is 1970–1990. In addition, it is estimated that there will be an increase of 0.1 mm day−1 (4%) in ETo values for each 1 °C temperature increase compared to the reference period (1970–1990).
For sunflower, it is estimated that water deficit will decrease in the 2016–2025 period and increase in the 2046–2055 and 2076–2085 periods compared to the reference years (1970–1990) during the vegetation period and the beginning and end of the development period for sunflower (second period). In the near future, and even in the period we are living in (2016–2025), it is possible to obtain yields close to the potential without the need for irrigation. It has been estimated that in the future periods of 2046–2055 and 2076–2085, the water deficit will increase both during the vegetation period and in the months of May and June, which are critical periods for sunflower cultivation, compared to the reference period. Since it is thought that the critical period for sunflower cultivation cannot be overcome, it seems possible to say that support irrigation may be needed. With changing climatic conditions and meteorological factors, it is very important to plan and manage water resources well, to calculate plant water consumption correctly, and to plan irrigation well.
For wheat, it is estimated that during the vegetation period and the beginning and end of the development period for wheat (second period), a water surplus will occur in the 2016–2025 period, while a water deficit will occur in the 2046–2055 and 2076–2085 periods compared to the reference period (1970–1990). Considering that the period when the excess precipitation in October, November, December, January, February, and March is retained in the soil and the water deficit starts to occur coincides with the end of the second period for wheat, it is possible to say that the possible water deficit will not be at a level that will affect the yield in terms of wheat cultivation, considering that the water retained in the soil can be used by the plant in the period close to harvest, since the critical period for wheat has been overcome both during the vegetation period and in the future 2046–2055 and 2076–2085 periods compared to the reference period.
Since the ET value is important in determining the impact of climate change on water resources and agricultural production, it is recommended that this situation should be taken into consideration and necessary studies should be carried out to ensure that water resources are used in a more planned, efficient, and sustainable manner.

Author Contributions

Conceptualization: F.K. and H.D.; Data curation: H.D.; Formal analysis: H.D.; Investigation: H.D.; Methodology: F.K. and H.D.; Resources: H.D.; Software: H.D.; Supervision: F.K.; Visualization: H.D.; Writing—original draft: H.D.; Writing—review and editing: F.K. and H.D. All authors have read and agreed to the published version of the manuscript.

Funding

This study supported by the Tekirdağ Namık Kemal University Scientific Research Projects (Project No: NKUBAP.00.24.AR.12.02), Türkiye.

Institutional Review Board Statement

Not applicable.

Informed Consent Statement

Not applicable.

Data Availability Statement

Data will be made available on request.

Acknowledgments

This study was produced from the Huzur Deveci’s Ph.D. thesis.

Conflicts of Interest

The authors declare no conflicts of interest.

References

  1. Akkaya, C.; Efeoğlu, A.; Yeşil, N. European Union Water Framework Directive and Its Applicability in Türkiye. In Proceedings of the TMMOB Water Policy Congress, Ankara, Türkiye, 21–23 March 2006; pp. 195–204. [Google Scholar]
  2. Elif, B. Evapotranspiration seasonal effects of climate change in Trabzon: The Penman-Monteith Method. Kastamonu Univ. J. For. Fac. 2013, 13, 300–306. [Google Scholar]
  3. Azlak, M. Possible Effects of Climate Change on Evaporation. Master’s Thesis, İstanbul Technical University, İstanbul, Turkey, 2015. [Google Scholar]
  4. Elguindi, N.; Bi, X.; Giorgi, F.; Nagarajan, B.; Pal, J.; Solmon, F.; Rauscher, S.; Zakey, A. RegCM version 3.1 user’s guide. RegCM Version 3.1 User’s Guide; ICTP: Trieste, Italy, 2007. [Google Scholar]
  5. Collins, W.J.; Bellouin, N.; Doutriaux-Boucher, M.; Gedney, N.; Halloran, P.; Hinton, T.; Hughes, J.; Jones, C.D.; Joshi, M.; Liddicoat, S.; et al. Development and evaluation of an Earth-System model—HadGEM2. Geosci. Model Dev. 2011, 4, 1051–1075. [Google Scholar] [CrossRef]
  6. Martin, G.M.; Bellouin, N.; Collins, W.J.; Culverwell, I.D.; Halloran, P.R.; Hardiman, S.C.; Hinton, T.J.; Jones, C.D.; McDonald, R.E.; McLaren, A.J.; et al. The HadGEM2 family of Met Office Unified Model climate configurations. Geosci. Model Dev. 2011, 4, 723–757. [Google Scholar] [CrossRef]
  7. Giorgetta, M.A.; Jungclaus, J.; Reick, C.H.; Legutke, S.; Bader, J.; Böttinger, M.; Brovkin, V.; Crueger, T.; Esch, M.; Fieg, K.; et al. Climate and carbon cycle changes from 1850 to 2100 in MPI-ESM simulations for the Coupled Model Intercomparison Project phase 5. J. Adv. Model. Earth Syst. 2013, 5, 572–597. [Google Scholar] [CrossRef]
  8. Voldoire, A.; Sanchez-Gomez, E.; Salas y Mélia, D.; Decharme, B.; Cassou, C.; Sénési, S.; Valcke, S.; Beau, I.; Alias, A.; Chevallier, M.; et al. The CNRM-CM5.1 global climate model: Description and basic evaluation. Clim. Dyn. 2013, 40, 2091–2121. [Google Scholar] [CrossRef]
  9. Republic of Türkiye Ministry of Agriculture and Forestry General Directorate of Water Management. Climate Change and Adaptation (RTMAFGDWM). Available online: https://www.tarimorman.gov.tr/SYGM/Belgeler/iklim%20de%C4%9Fi%C5%9Fikli%C4%9Finin%20su%20kaynaklar%C4%B1na%20etkisi/iklimkitap2020.pdf (accessed on 11 November 2023).
  10. Hanedar, A.; Ferat, Ç.; Erdem, G.; Konukcu, F.; Altürk, B.; Albut, S. TR21 Region Climate Assessment: Current Situation and Projectionsr. In Effects of Climate Change and Adaptation Strategies in TR21 Thrace Region, 1st ed.; Konukcu, F., Albut, S., Altürk, B., Eds.; Tekirdağ Namık Kemal University: Tekirdağ, Turkey, 2019; pp. 1–22. [Google Scholar]
  11. Kanber, R.; Baştuğ, R.; Büyüktaş, D.; Ünlü, M.; Kapur, B. Effects of Global Climate Change on Water Resources and Agricultural Irrigation. In Proceedings of the Agricultural Engineering VII, Technical Congress, Ankara, Türkiye, 11–15 January 2010; pp. 83–118. [Google Scholar]
  12. Turkish State Meteorological Service (TSMS). Available online: https://www.mgm.gov.tr/tarim/referans-toplam-buharlasma.aspx?s=a#sfB (accessed on 17 October 2023).
  13. Süzer, S. Available online: https://arastirma.tarimorman.gov.tr/ttae/Sayfalar/Detay.aspx?SayfaId=86 (accessed on 5 September 2024).
  14. Hurma, H. Current Status of the Agricultural Structure of the Thrace Region. In Effects of Climate Change and Adaptation Strategies in TR21 Thrace Region, 1st ed.; Konukcu, F., Albut, S., Altürk, B., Eds.; Tekirdağ Namık Kemal University: Tekirdağ, Turkey, 2019; pp. 46–60. [Google Scholar]
  15. Republic of Türkiye Ministry of Agriculture and Forestry (RTMAF). Available online: https://www.tarimorman.gov.tr/BUGEM/Belgeler/B%C3%BCltenler/MAYIS%202022/Ay%C3%A7i%C3%A7e%C4%9Fi%20May%C4%B1s%20%20B%C3%BClteni.pdf (accessed on 6 September 2024).
  16. Chaouche, K.; Neppel, L.; Dieulin, C.; Pujol, N.; Ladouche, B.; Martin, E.; Salas, D.; Caballero, Y. Analyses of precipitation, temperature and evapotranspiration in a French Mediterranean region in the context of climate change. Comptes Rendus. Géosci. 2010, 342, 234–243. [Google Scholar] [CrossRef]
  17. Dinpashoh, Y.; Jahanbakhsh-Asl, S.; Rasouli, A.; Foroughi, M.; Singh, V. Impact of climate change on potential evapotranspiration (case study: West and NW of Iran). Theor. Appl. Climatol. 2019, 136, 185–201. [Google Scholar] [CrossRef]
  18. Fan, J.; Wu, L.; Zhang, F.; Xiang, Y.; Zheng, J. Climate change effects on reference crop evapotranspiration across different climatic zones of China during 1956–2015. J. Hydrol. 2016, 542, 923–937. [Google Scholar] [CrossRef]
  19. Irmak, S.; Kabenge, I.; Skaggs, K.E.; Mutiibwa, D. Trend and magnitude of changes in climate variables and reference evapotranspiration over 116-yr period in the Platte River Basin, central Nebraska—USA. J. Hydrol. 2012, 420, 228–244. [Google Scholar] [CrossRef]
  20. Li, Y.; Qin, Y.; Rong, P. Evolution of potential evapotranspiration and its sensitivity to climate change based on the Thornthwaite, Hargreaves, and Penman–Monteith equation in environmental sensitive areas of China. Atmos. Res. 2022, 273, 106178. [Google Scholar] [CrossRef]
  21. Ma, Z.; Yan, N.; Wu, B.; Stein, A.; Zhu, W.; Zeng, H. Variation in actual evapotranspiration following changes in climate and vegetation cover during an ecological restoration period (2000–2015) in the Loess Plateau, China. Sci. Total Environ. 2019, 689, 534–545. [Google Scholar] [CrossRef] [PubMed]
  22. Sun, J.; Wang, G.; Sun, X.; Lin, S.; Hu, Z.; Huang, K. Elevation-dependent changes in reference evapotranspiration due to climate change. Hydrol. Process. 2020, 34, 5580–5594. [Google Scholar] [CrossRef]
  23. Nistor, M.M.; Cheval, S.; Gualtieri, A.F.; Dumitrescu, A.; Boţan, V.E.; Berni, A.; Hognogi, G.; Irimuş, I.A.; Porumb-Ghiurco, C.G. Crop evapotranspiration assessment under climate change in the Pannonian basin during 1991–2050. Meteorol. Appl. 2017, 24, 84–91. [Google Scholar] [CrossRef]
  24. Azlak, M.; Şaylan, L. Estimating the climate change impact on reference evapotranspiration in the Thrace Region of Turkey. Soil Water J. 2019, 8, 77–85. [Google Scholar] [CrossRef]
  25. Selçuk, E.B. Evaluation of the Impact of Global Warming and Climate Change on Temperature and Reference Evapotranspiration: The Case of Malatya Province. Master’s Thesis, İnönü University, Battalgazi, Türkiye, 2021. [Google Scholar]
  26. Arabi, C.; Candoğan, B.N. Spatial and temporal change of reference crop evapotranspiration in Marmara Region. Int. J. Agric. Wildl. Sci. 2022, 8, 268–281. [Google Scholar] [CrossRef]
  27. Bircan, N.; Kızıl, Ü. Development of an android-based application to be used in the calculation of reference evapotranspiration. COMU J. Agric. Fac. 2021, 9, 247–257. [Google Scholar] [CrossRef]
  28. Yıldırım, E.A.; Erdem, T. Investigation of the effect of climate change on reference evapotranspiration in Tekirdağ, Türkiye. Rev. Climatol. 2023, 23, 35–45. [Google Scholar] [CrossRef]
  29. Şen, B. Determining the changing irrigation demands of maize production in the cukurova plain under climate change scenarios with the CROPWAT model. Water 2023, 15, 4215. [Google Scholar] [CrossRef]
  30. Yetik, A.K.; Şen, B. Evaluation of the impacts of climate change on irrigation requirements of maize by CROPWAT Model. Gesunde Pflanz. 2023, 75, 1297–1305. [Google Scholar] [CrossRef]
  31. Yıldırım, Y.E.; İsmail, T.; Özaydın, K.A. Determination of spatial variation of reference evapotranspiration case study of Gediz Basin. Soil Water J. 2019, 8, 153–161. [Google Scholar] [CrossRef]
  32. Deveci, H.; Konukcu, F. Prediction of climate change and its impact on water resources and crop yileds in Ergene River Basin. In Integrated Land-Use Management Modelling of Black Sea Estuaries (ILMM-BSE) Project: Ergene River Basin, 1st ed.; Konukcu, F., Ed.; Soil Offset: Tekirdağ, Turkey, 2016; pp. 269–290. [Google Scholar]
  33. Coşkun, A.; Deveci, H.; Konukcu, F. Prediction of the effect of climate change on wheat yield in Thrace region. Turk. J. Agric. Food Sci. Technol. 2023, 11, 933–945. [Google Scholar] [CrossRef]
  34. Deveci, H. Estimation of Wheat Yield under Combinations of Different Climate Parameters with the LINTUL Model in the Thrace Region. In Proceedings of the 8th International Black Sea Coastline Countries Scientific Research Conference, Sofia, Bulgaria, 29–30 August 2022. [Google Scholar]
  35. Konukcu, F.; Deveci, H.; Altürk, B. Modelling of the effect of climate change on wheat yield in Thrace region with AquaCrop and WOFOST models. J. Tekirdag Agric. Fac. 2020, 17, 77–96. [Google Scholar] [CrossRef]
  36. Altürk, B.; Bakanoğulları, F.; Konukcu, F.; Albut, S. Modeling the impact of climate change on sunflower and wheat yield in the TR21 Thrace Region. In Effects of Climate Change and Adaptation Strategies in TR21 Thrace Region, 1st ed.; Konukcu, F., Albut, S., Altürk, A., Eds.; Namık Kemal University Publications: Tekirdağ, Türkiye, 2019; pp. 104–117. [Google Scholar]
  37. Deveci, H.; Konukcu, F. Modeling the Effect of Climate Change on Soil Moisture in the Thrace Region. In Current Research and Assesments for Agricultural Sciences, 1st ed.; Kunter, B., Keskin, N., Eds.; Ivpe: Cetinje, Montenegro, 2019; pp. 221–235. [Google Scholar]
  38. Deveci, H.; Konukcu, F.; Altürk, B. Effect of climate change on wheat grown soil moisture profile in Thrace District. J. Tekirdag Agric. Fac. 2019, 16, 202–218. [Google Scholar] [CrossRef]
  39. Deveci, H.; Konukcu, F. Determination of Some Watershed Characteristics and Soil Properties of the Çorlu Pınarbaşı Sub-Basin with the Assistance of Geographical Information System (GIS). In Proceedings of the HASAT International Agriculture and Forest Congress, Ankara, Türkiye, 21–23 June 2019; pp. 1099–1117. [Google Scholar]
  40. Turkish State Meteorological Service (TSMS). Available online: https://www.mgm.gov.tr/veridegerlendirme/il-ve-ilceler-istatistik.aspx?m=TEKIRDAG (accessed on 9 September 2021).
  41. Republic of Türkiye Ministry of Agriculture and Forestry General Directorate of Agricultural Research and Policies (RTMAFGDARP). Available online: https://www.tarimorman.gov.tr/TAGEM/Belgeler/yayin/Tu%CC%88rkiyede%20Sulanan%20Bitkilerin%20Bitki%20Su%20Tu%CC%88ketimleri.pdf (accessed on 22 December 2023).
  42. Dalfes, N.; Karaca, M.; Şen, Ö.L.; Kindap, T.; Önol, B.; Turunçoğlu, U.; Bozkurt, D.; Fer, I.; Akın, H.S.; Çankur, R.; et al. Climate Scenarios for Türkiye; Proje No:105G015; TÜBİTAK: Ankara, Türkiye, 2008. [Google Scholar]
  43. Roeckner, E.; Bäuml, G.; Bonaventura, L.; Brokopf, R.; Esch, M.; Giorgetta, M.; Hagemann, S.; Kirchner, I.; Kornblueh, L.; Manzini, E. The Atmospheric General Circulation Model ECHAM 5. PART I: Model Description. 2003. Available online: https://pure.mpg.de/rest/items/item_995269_2/component/file_995268/content (accessed on 15 September 2024).
  44. Food and Agriculture Organization of the United Nations (FAO). Available online: https://www.fao.org/land-water/databases-and-software/eto-calculator/en/ (accessed on 2 August 2024).
  45. Allen, R.G.; Pereira, L.S.; Raes, D.; Smith, M. Crop Evapotranspiration—Guidelines for Computing Crop Water Requirements; FAO Irrigation and drainage paper 56; FAO: Rome, Italy, 1998; Volume 300, p. D05109. [Google Scholar]
  46. Raes, D.; Munoz, G. The ETo Calculator. In Reference Manual Version; FAO: Roma, Italy, 2009; Volume 3, p. 4. [Google Scholar]
  47. Food and Agriculture Organization of the United Nations (FAO). Available online: https://www.fao.org/land-water/databases-and-software/cropwat/en/ (accessed on 9 November 2023).
  48. Smith, M. CROPWAT, a Computer Program for Irrigation Planning and Management; FAO Irrigation and Drainage Paper No. 46; FAO: Rome, Italy, 1992. [Google Scholar]
  49. Kartal, S.; Çolak, Y.B.; Gönen, E.; Özfidaner, M. Using CROPWAT Program for irrigation scheduling of eggplant in Tarsus Region. Turk. J. Agric. Nat. Sci. 2019, 6, 332–342. [Google Scholar] [CrossRef]
  50. Clarke, D.; Smith, M.; El-Askari, K. CropWat for Windows: User guide; IHE: Oak Brook, IL, USA, 2001. [Google Scholar]
  51. The Irish Meteorological Service (IMS). 30 Year Averages. Available online: https://www.met.ie/climate/30-year-averages#:~:text=The%20World%20Meteorological%20Organization%20(WMO,used%20for%20two%20principal%20purposes (accessed on 14 September 2024).
  52. JMP. JMP Statistical Software. JMP Pro 17.0. Available online: https://www.jmp.com/en_us/home.html (accessed on 13 September 2024).
  53. Özkul, S.; Fıstıkoğlu, O.; Harmancıoğlu, N. Assessment of the Impact of Climate Change on Water Resources on the Büyük Menderes and Gediz Basins. In Proceedings of the TMMOB 2nd Water Policy Congress, Ankara, Türkiye, 20–22 March 2008; pp. 309–322. [Google Scholar]
  54. Şen, B.; Topcu, S.; Giorgi, F.; Xunqiang, B.; Kanıt, E.; Dalkılıç, T. Climate Change and Agricultural Water in Seyhan Basin Effects on Use. In Proceedings of the TMMOB 2nd Water Policy Congress, Ankara, Türkiye, 20–22 March 2008; pp. 71–82. [Google Scholar]
  55. Adopted, I. Climate Change 2014 Synthesis Report; IPCC: Geneva, Switzerland, 2014; pp. 1059–1072. [Google Scholar]
  56. Giménez, C.; Gallardo, M.; Thompson, R. Reference Module in Earth Systems and Environmental Sciences. In Plant–Water Relations; Elsevier: Amsterdam, The Netherlands, 2013. [Google Scholar] [CrossRef]
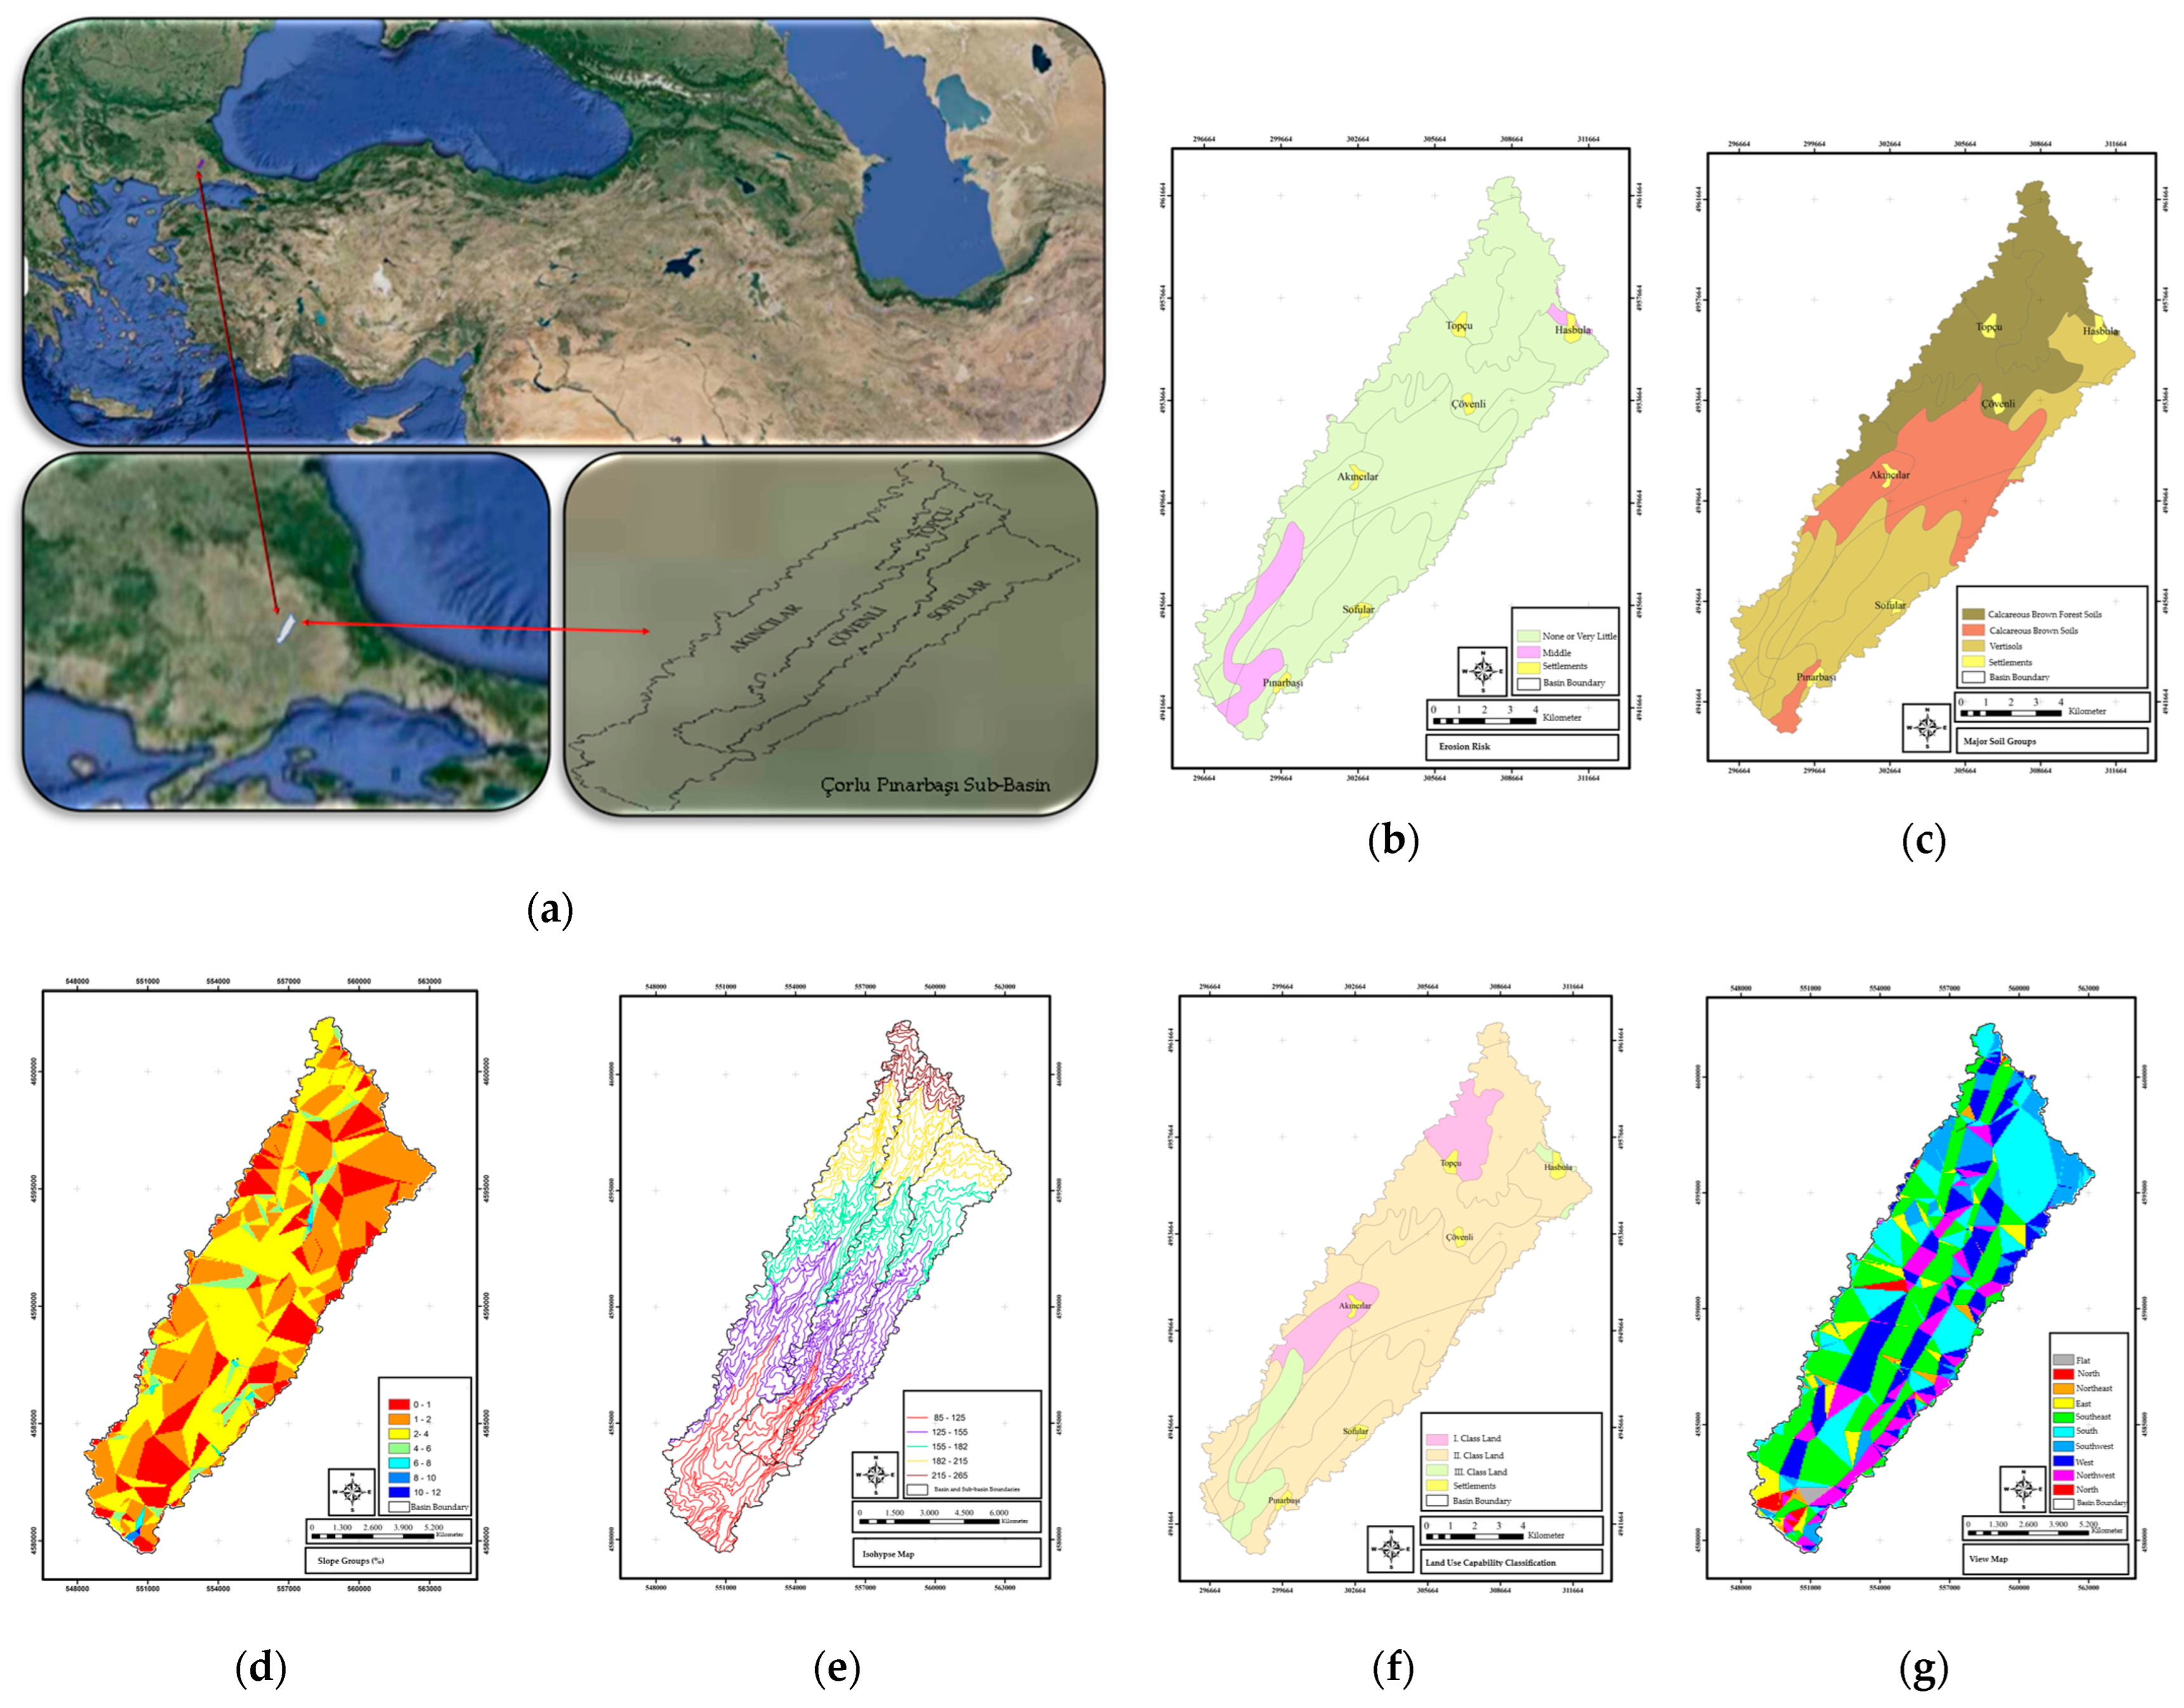
Figure 1. (a) Location of Çorlu Pınarbaşı Sub-Basin; (b) erosion risk map; (c) major soil groups map; (d) slope groups map; (e) isohypse map; (f) land use capability classification map; (g) view map [39].
Atmosphere 15 01188 g001
Figure 2. ETo values (mm day−1) (2012, 1970–1990, 2016–2025, 2046,2055, 2076–2085).
Atmosphere 15 01188 g002
Figure 3. Precipitation (mm), ETo (mm day−1), and ETs (mm day−1) values for the sunflower vegetation period (1970–1990, 2016–2025, 2046, 2055, 2076–2085).
Atmosphere 15 01188 g003
Figure 4. Water deficit values for sunflower vegetation period (1970–1990; 2016–2025, 2046–2055, 2076–2085).
Atmosphere 15 01188 g004
Figure 5. Precipitation (mm), ETo (mm day−1), and ETw (mm day−1) values for the sunflower vegetation period (1970–1990, 2016–2025, 2046,2055, 2076–2085).
Atmosphere 15 01188 g005
Figure 6. Water deficit values for wheat vegetation period (1970–1990, 2016–2025, 2046–2055, 2076–2085).
Atmosphere 15 01188 g006
Figure 7. Monthly total precipitation and monthly total ETo (mm day−1) values in case of 1, 2, 3, 4, and 5 °C increase in temperature.
Atmosphere 15 01188 g007
Table 1. Long-term averages of climate values of the research area (1940–2023) [40].
MonthsAverage Temperature (°C)Average Highest Temperature (°C)Average Lowest Temperature (°C)Average Radiation Time (Hour)Average Rainy Days NumberAverage Monthly Total Rainfall Amount
(mm)
January4.98.12.02.812.3068.0
February5.59.02.53.410.5154.5
March7.311.04.14.210.7153.4
April11.715.78.16.09.5042.1
May16.720.612.77.48.2937.2
June21.125.316.78.57.3138.3
July23.728.119.19.43.5623.8
August23.928.319.48.42.4415.5
September20.324.516.26.84.5632.7
October15.719.512.14.97.4960.2
November11.314.88.23.29.4674.3
December7.310.54.42.511.9980.0
Annual/Total14.118.010.55.698.10580.0
Table 2. Some important properties of soils in the research area.
Location of SampleDepth (cm)TextureTexture ClassBulk Density
(g cm−3)
Clay (%)Silt (%)Sand (%)
Akıncılar0–3027.0816.6756.25Sandy Clay Loam1.57
30–6029.1710.4260.42Sandy Clay Loam1.72
60–9029.1710.4260.42Sandy Clay Loam1.71
Sofular0–3033.3312.5054.17Sandy Clay Loam1.53
30–6029.1714.5856.25Sandy Clay Loam1.53
60–9037.5012.5050.00Sandy Clay1.46
Çövenli0–3025.0020.8354.17Sandy Clay Loam1.35
30–6041.6714.5843.75Clay1.38
60–9039.5814.5845.89Sandy Clay Loam1.37
Table 3. The crop characteristics of sunflower and wheat [41].
Crop ParametersSunflowerWheat
Crop Development Period (days)Initial2530
Developement30146
Mid-Season6047
Late-Season3030
Crop Cofficient (Kc)Initial0.400.62
Mid-Season1.111.09
Late-Season1.310.20
Vegetation Duration (days)145252
Table 4. Minimum, maximum, and average ETo values for 2012, reference (1970–1990) period, and future periods.
PeriodETo Values (mm Day−1)
MinimumMaximumAverage
20120.28.13.0
1970–19900.315.73.3
2016–20240.39.33.3
2016–20250.315.53.2
2046–20550.313.83.6
2076–20850.316.24.0
Disclaimer/Publisher’s Note: The statements, opinions and data contained in all publications are solely those of the individual author(s) and contributor(s) and not of MDPI and/or the editor(s). MDPI and/or the editor(s) disclaim responsibility for any injury to people or property resulting from any ideas, methods, instructions or products referred to in the content.