Review

Bibliometric Analysis of Aerosol-Radiation Research from 1999 to 2023

1
Southern Marine Science and Engineering Guangdong Laboratory (Zhuhai), School of Atmospheric Sciences, Sun Yat-sen University, Zhuhai 519082, China
2
Guangdong Province Key Laboratory for Climate Change and Natural Disaster Studies, Zhuhai 519082, China
*
Author to whom correspondence should be addressed.
Atmosphere 2024, 15(10), 1189; https://doi.org/10.3390/atmos15101189
Submission received: 31 July 2024 / Revised: 19 September 2024 / Accepted: 1 October 2024 / Published: 4 October 2024
(This article belongs to the Section Aerosols)

Abstract

:
Aerosol and aerosol-cloud radiation interactions significantly influence Earth’s radiative balance, hydrological cycle, global monsoons, atmospheric circulation, and climate, attracting substantial scientific attention. This study employs bibliometric and quantitative trend analyses to evaluate the development, knowledge structure, and research trends in aerosol and aerosol-cloud radiation interactions from 1999 to 2023 using Web of Science Core Collection data. Results reveal a consistent increase in publications and citations, indicating sustained attention in this field. The USA and China are identified as the most prolific countries, with significant contributions from institutions like the National Aeronautics and Space Administration and the Chinese Academy of Sciences. However, while the USA shows a recent decline in growth, China has demonstrated a significant upward trend in research contributions. Productive journals include Atmospheric Chemistry and Physics and the Journal of Geophysical Research-Atmospheres, with prolific authors such as Babu S. Suresh and Li Zhanqing. A co-occurrence analysis of keywords identifies research topics focused on aerosol optical properties, aerosol types, aerosol radiation interactions, and aerosol-cloud interactions. Emerging trends emphasize advanced methodologies such as remote sensing, model simulation, and artificial intelligence, with growing attention to regions like the Southern Ocean and the Arctic. This comprehensive analysis provides valuable insights for researchers, identifying knowledge gaps and guiding future research directions in aerosol and aerosol-cloud radiation interactions, which are crucial for understanding their climatic and atmospheric impacts.

1. Introduction

Aerosols are a critical component of Earth’s atmosphere, playing a significant role in modulating atmospheric physics and chemistry. They interact with solar and terrestrial radiation, influencing Earth’s energy balance and, consequently, the climate [1,2]. These interactions occur through two mechanisms: aerosol-radiation interactions (ARI), where aerosols directly scatter and absorb radiation [3,4], and aerosol-cloud interactions (ACI), where aerosols act as cloud condensation nuclei (CCN) or ice-nucleating particles (INPs), altering cloud albedo and lifetime [5,6,7]. These interactions encompass highly complex physical and chemical processes [8], which can be assessed through various methods, including observational analyses and modeling simulations.
Numerous publications have reviewed ARI and ACI research from multiple perspectives, leveraging the intellectual contributions of researchers. For instance, Liu et al. [9] concluded the current progress of the optical properties and radiative effects. Li et al. [10] reviewed observations of scattering and absorbing aerosol and their radiative and climate effects. Gao et al. [8] concluded the application of two-way coupled meteorology and air-quality models to examine the impact of ARI and ACI on meteorology and air quality. Satheesh et al. [11] reviewed the radiative effects of natural aerosols, especially in the tropics. However, these reviews primarily focus on specific aspects of ARI and ACI by selectively analyzing structured and homogeneous literature, which limits their scope by not providing a comprehensive quantitative assessment of all published research in this field.
Bibliometric analysis is widely recognized as a well-established research method that avoids researchers’ limitations and evaluates the knowledge structure, development, and trends within a topic quantitatively and qualitatively, providing a more comprehensive understanding of the overall research dynamics [12,13,14]. In recent years, bibliometric analysis has been conducted in many fields, such as ecology [15,16], tourism [17], agriculture [18], soil [19,20], air pollution [21], and so on. Generally, bibliometric analysis in a specific research field consists of two primary components: performance analysis and science mapping [22,23]. Performance analysis examines research contributions based on countries, institutions, journals, authors, and keywords, while science mapping identifies connections among them, revealing the knowledge structure and development process. This methodology empowers scholars to obtain a comprehensive overview, identify knowledge gaps, generate new research ideas, and strategically position their contributions within the field [24]. Applying bibliometric analysis can help us to quantitatively and qualitatively evaluate the knowledge structure, development, and trends in ARI and ACI research, significantly enhance our understanding of this field, and drive future advancements.
There have been no bibliometric analyses of ARI and ACI in recent years. To comprehensively understand the research in this area, we conducted a quantitative review using bibliometric methods. The main research content is divided into three main aspects: (1) identifying the contributions of references, countries, institutions, journals, and authors, (2) uncovering the thematic network and knowledge framework of studies during the research period, (3) illustrating the research trends and hotspots in ARI and ACI research.

2. Materials and Methods

2.1. Data Collection

The Web of Science Core Collection (WoSCC) database is renowned as the world’s trusted, publisher-independent global citation resource with a focus on high-impact journals [25], and it served as the source for our data. Based on the records available in the WoSCC database, all full publication records from 1 January 1999, to 31 December 2023, were retrieved on 23 August 2024. Figure 1 displays the filtration process and results utilized in the research. The search terms were initially structured as follows: (TS) = (“aerosol* radia*” OR “aerosol* *direct* radia*”) OR (“aerosol* cloud radia*” OR “aerosol* cloud interact*” OR “aerosol* indirect* radia*”), and the time frame was from 1999 to 2023 to obtain precise records. A total of 3352 published documents were initially received and categorized into 10 types, with articles being the majority (89.33%), followed by proceeding papers (6.84%), review articles (2.31%), and others (1.52%). Among these, 3173 articles representing original scientific development were exported in plain text files containing titles, abstracts, authors, keywords, institutions, journals, and cited references for subsequent analysis.

2.2. Data Analysis Methods

2.2.1. Bibliometric Analysis

Bibliometric analysis techniques rely on quantitative methods, including performance analysis and science mapping, to identify, describe, and assess published research [26]. Performance analysis evaluates the study and publication performance of individuals and institutions, using detailed bibliometric indicators such as quantity, which measures productivity by the number of publications, and quality, which measures impact by the number of citations [27]. Science mapping examines relationships among interacting units (e.g., countries, authors) and reveals the structure and dynamics of scientific fields [28]. Before conducting these analyses, the data exported from the WoSCC database underwent a series of preprocessing steps to ensure consistency and accuracy. Initially, VOSviewer software (version 1.6.18) [29] was employed to extract all countries, organizations, sources, and author keywords, setting the minimum frequency threshold to 0. Subsequently, a manual curation process was implemented to consolidate abbreviations, unify singular and plural forms, and standardize synonyms; for instance, “peoples r china” and “Taiwan” were categorized under “China”. With the preprocessed data, the contributions of different countries, institutions, journals, and scholars were revealed by counting the annual number of published articles and their citations based on the above two analyses using VOSviewer software. Additionally, co-occurrence, defined as the number of times two keywords emerged in the same paper, and the average emerging time of a keyword, defined as the mean publication time of documents containing it [30], were also analyzed using VOSviewer to create a bibliometric map of frequently used keywords and highlight shifts in research emphasis in ARI and ACI research.

2.2.2. Trend Analysis

Analyzing trends in key indicators, such as countries, institutions, authors, and journals, is essential for researchers to remain abreast of the latest information in this field. The number of documents related to these specific indicators varies annually based on publications. A normalized indicator cumulative frequency (NIFC) is calculated to ensure accurate comparisons across research periods, representing the number of documents for these indicators per 1000 publications per year. The average growth rate (AGR) for various indicators during the analysis period is determined using the slope of the least squares method. A positive AGR indicates an upward trend for a specific indicator, while a negative AGR suggests a downward trend. The significance of the AGR is then tested using the p-value significance testing method. The NICF and AGR are calculated using Equations (1) and (2).
N I C F i Y j = f i Y j P Y j × 1000 ,
A G R = ( Y e Y s + 1 ) Y s Y e N I C F i Y j × Y j Y s Y e Y j Y s Y e N I C F i Y j ( Y e Y s + 1 ) Y s Y e Y j 2 Σ Y s Y e Y j 2 × 100 ,
where NICFiYj represents the NICF of different indicators in year Yj, fi represents the documents of indicators, and PYj is the number of publications in the year j. AGR represents the average growth rate, and Ys and Ye are separately the start year and end year of the study period.
Author keywords highlight an article’s primary content and themes, providing insight into the knowledge structures within a specific field [12,22], the trend analysis of which can aid researchers in revealing the temporal evolution of ARI and ACI research. To track the evolution of research topics in recent years, publications from the past 6 years have been categorized into two groups (2018–2020 and 2021–2023) for further analysis. This study’s trend analysis of selected author keywords is based on the normalized cumulative keyword frequency and trend factor to visualize their evolution and assess their potential for further development in popularity [30,31]. The normalized cumulative keyword frequency (NKCF) is a metric that determines the average occurrences of a keyword per 1000 publications over a specific period according to Yu et al. [30]. The trend factor is calculated using the logarithm value of the ratio of the NKCF during 2018–2020 and 2021–2023 [30,31], indicating the popularity of a topic in ARI and ACI research. The NKCF and trend factor calculation is based on Equations (3)–(5).
N K C F n Y j = K n P Y j × 1000 ,
N K C F n Y e Y s = j = Y s Y e K n j = Y s Y e P Y j × 1000 ,
t r e n d   f a c t o r = log N K C F n 2021 2023 N K C F n 2018 2020 ,
where Kn represents the occurrences of the author keywords, NKCFnYj represents the NKCFn of year Yj, and NKCFn(Ye−Ys) represents the NKCF between year Ys and Ye.

3. Results

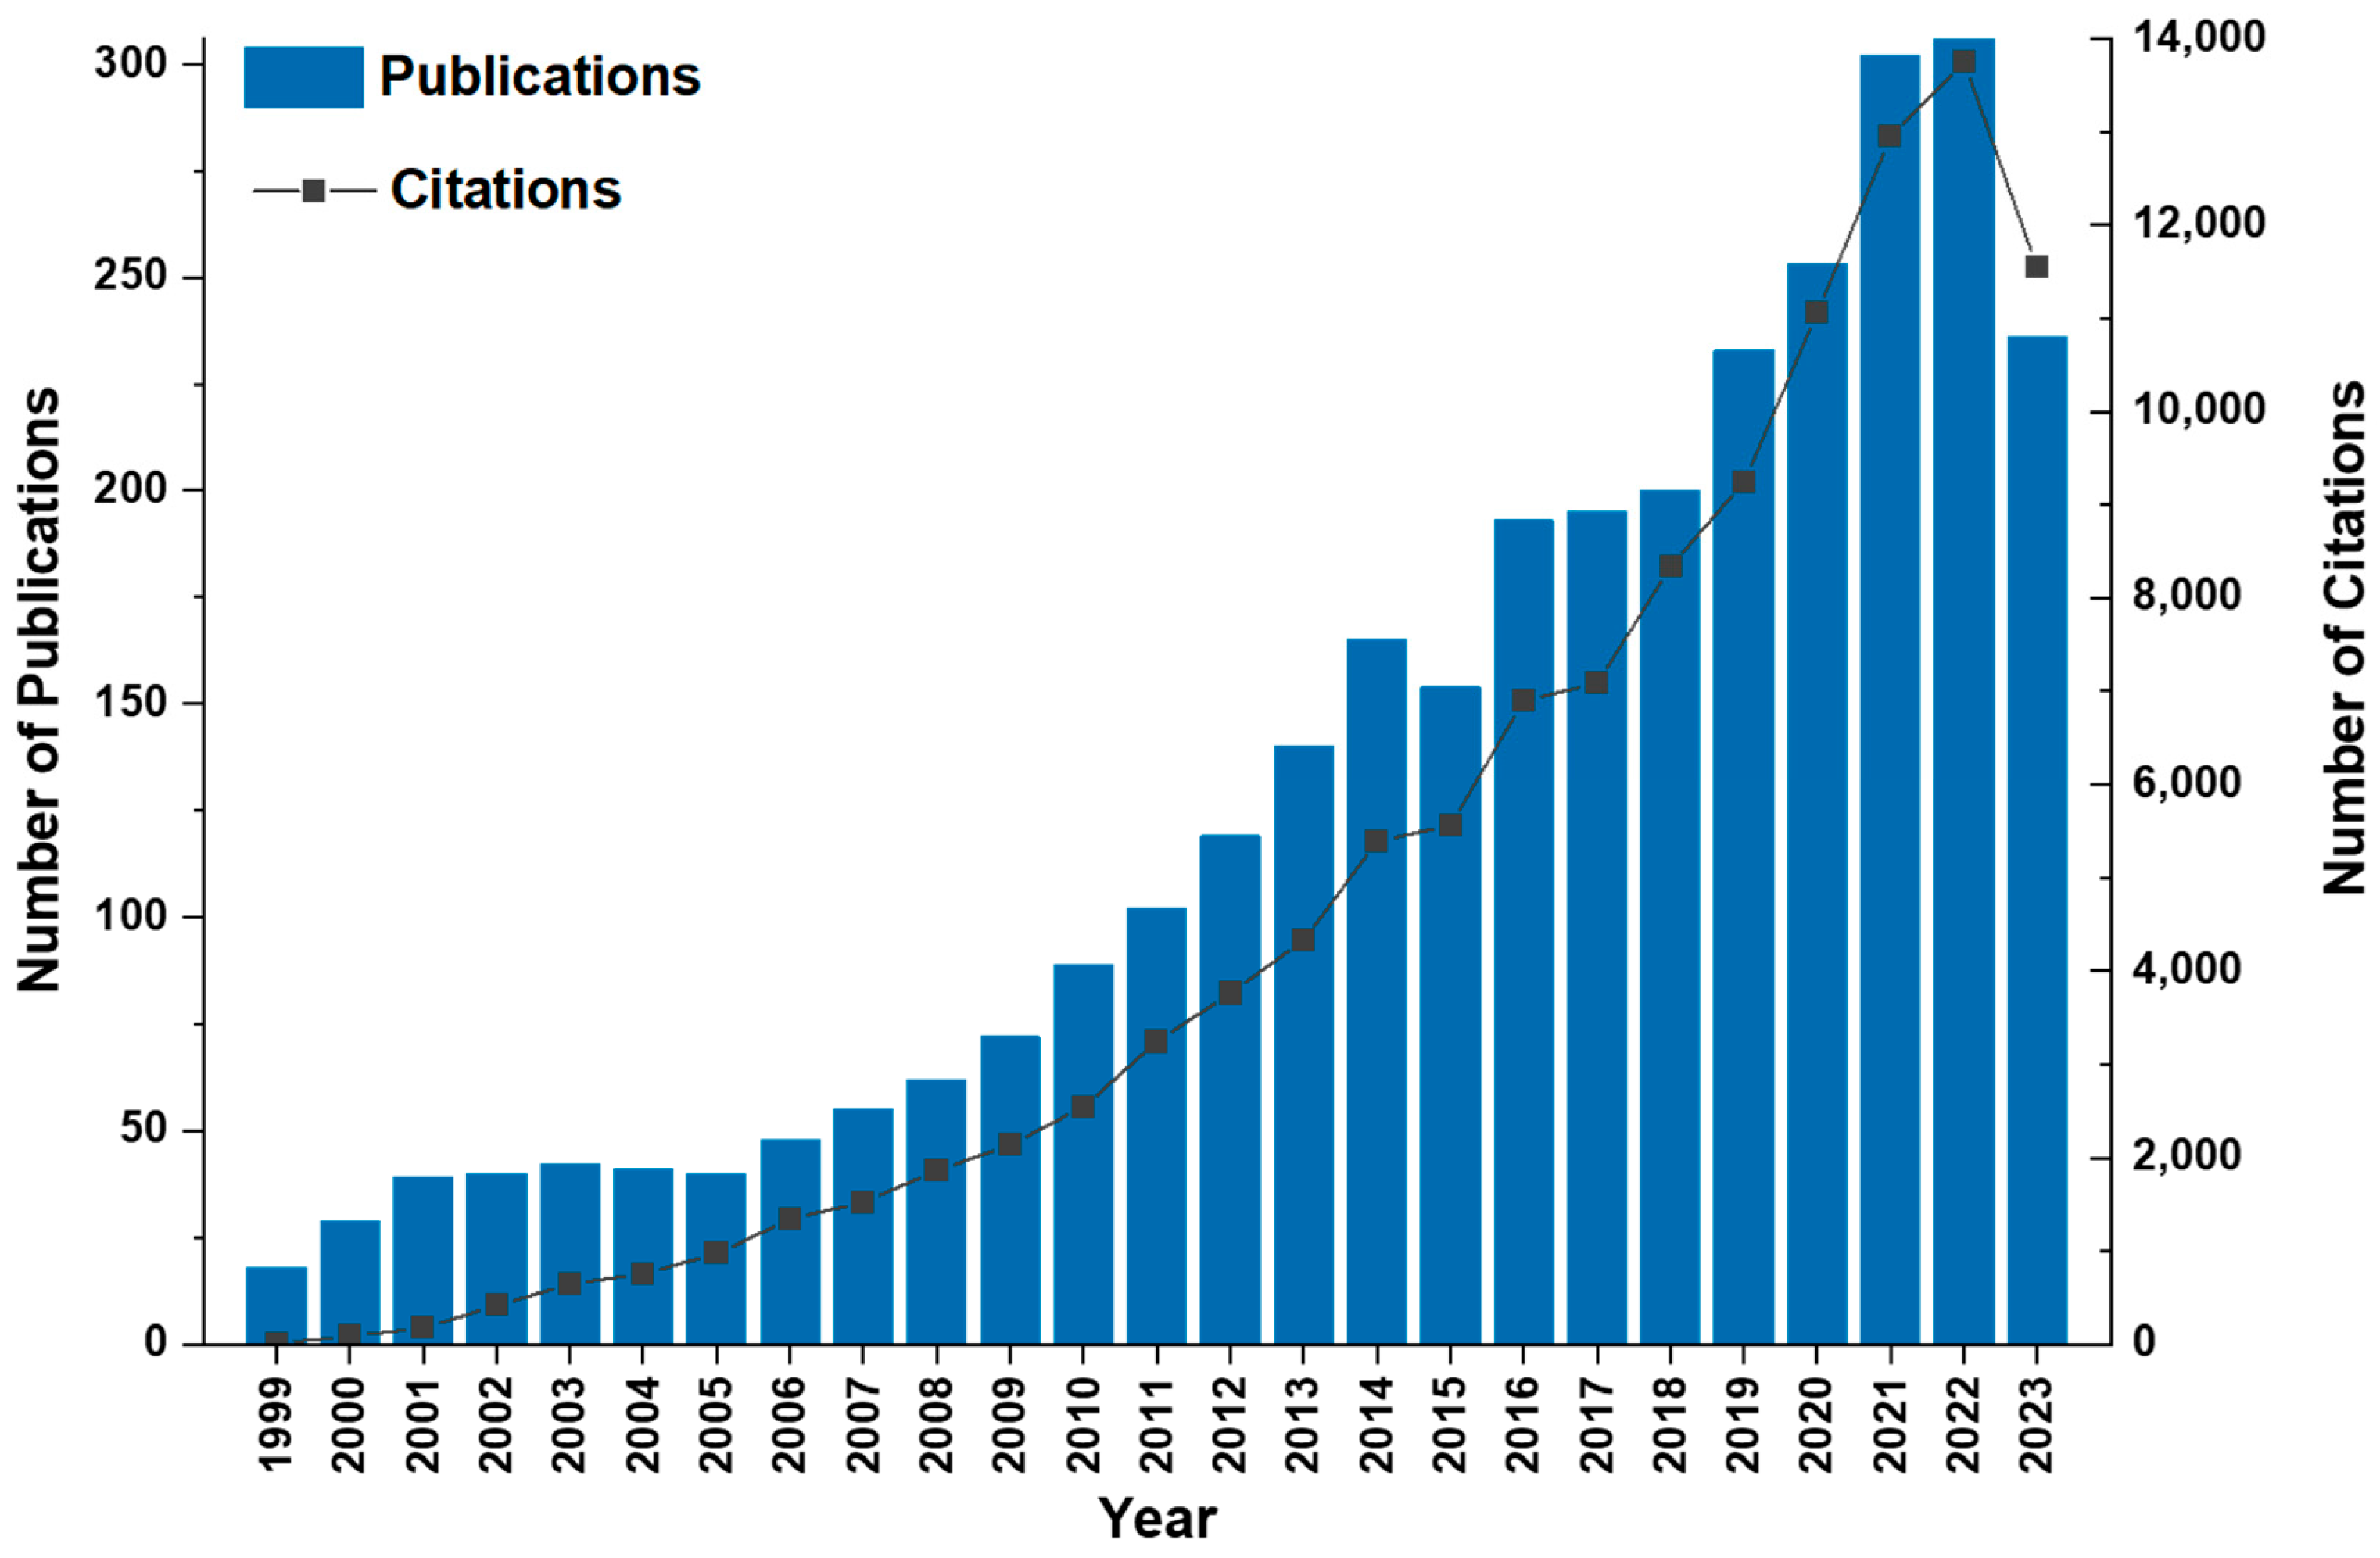
3.1. Variation of the Number of Publications

The number of publications reflects research activity and scholarly engagement, while citation counts are crucial for gauging academic success and the influence of that research on subsequent studies [32,33]. The annual number of published articles and total citations related to ARI and ACI research are shown in Figure 2. Both publications and citations demonstrate a clear upward trend from 1999 to 2023. Specifically, the number of publications increased from 18 to 89 between 1999 and 2010. This growth accelerated between 2011 and 2018, with the number of publications rising sharply to 200, nearly doubling during this period. This upward trajectory continued in subsequent years. Citations followed a similar pattern, highlighting the growing attention of ARI and ACI research. The consistent rise in both publications and citations underscores that this field remains a focal point of considerable interest in scientific discourse.

3.2. Influential References

References in publications provide profound insights into the evolution of a particular field over time [34]. They reveal the progression, consistency, and transfer of scientific knowledge, as well as the interconnectedness and cross-disciplinary influences between different fields [34]. The frequency of citations received by references in publications is also an indicator of their academic influence [35,36]. In this study, co-citation analysis is used to identify influential references, highlighting high-frequency co-cited documents. These frequently co-cited references offer researchers a quick understanding of the foundational knowledge and research background in the field, making it easier to identify key studies and establish future research directions. The 10 most cited references are shown in Table 1, all published before 2005, and highlight fundamental research on ARI and ACI. For instance, Twomey [37], Twomey [7], and Albrecht [5] elucidate aerosol-cloud interactions. Holben et al. [38] and Remer et al. [39] depict the AERONET and MODIS datasets, respectively, which are frequently used in the ARI and ACI research. Hess et al. [40] and Ricchiazzi et al. [41] provide essential software for aerosol and cloud optical properties (OPAC) and radiative transfer simulations (SBDART). Dubovik et al. [42] reveal the optical properties of key aerosol types in worldwide locations. Charlson et al. [3] discuss the impact of sulfate aerosol radiation on climate, and Ramanathan et al. [43] investigate the radiative impacts of aerosols on climate and the hydrological cycle. These influential references are particularly valuable for junior researchers who need to quickly grasp the theories, methodologies, models, and datasets in the field of ARI and ACI research.

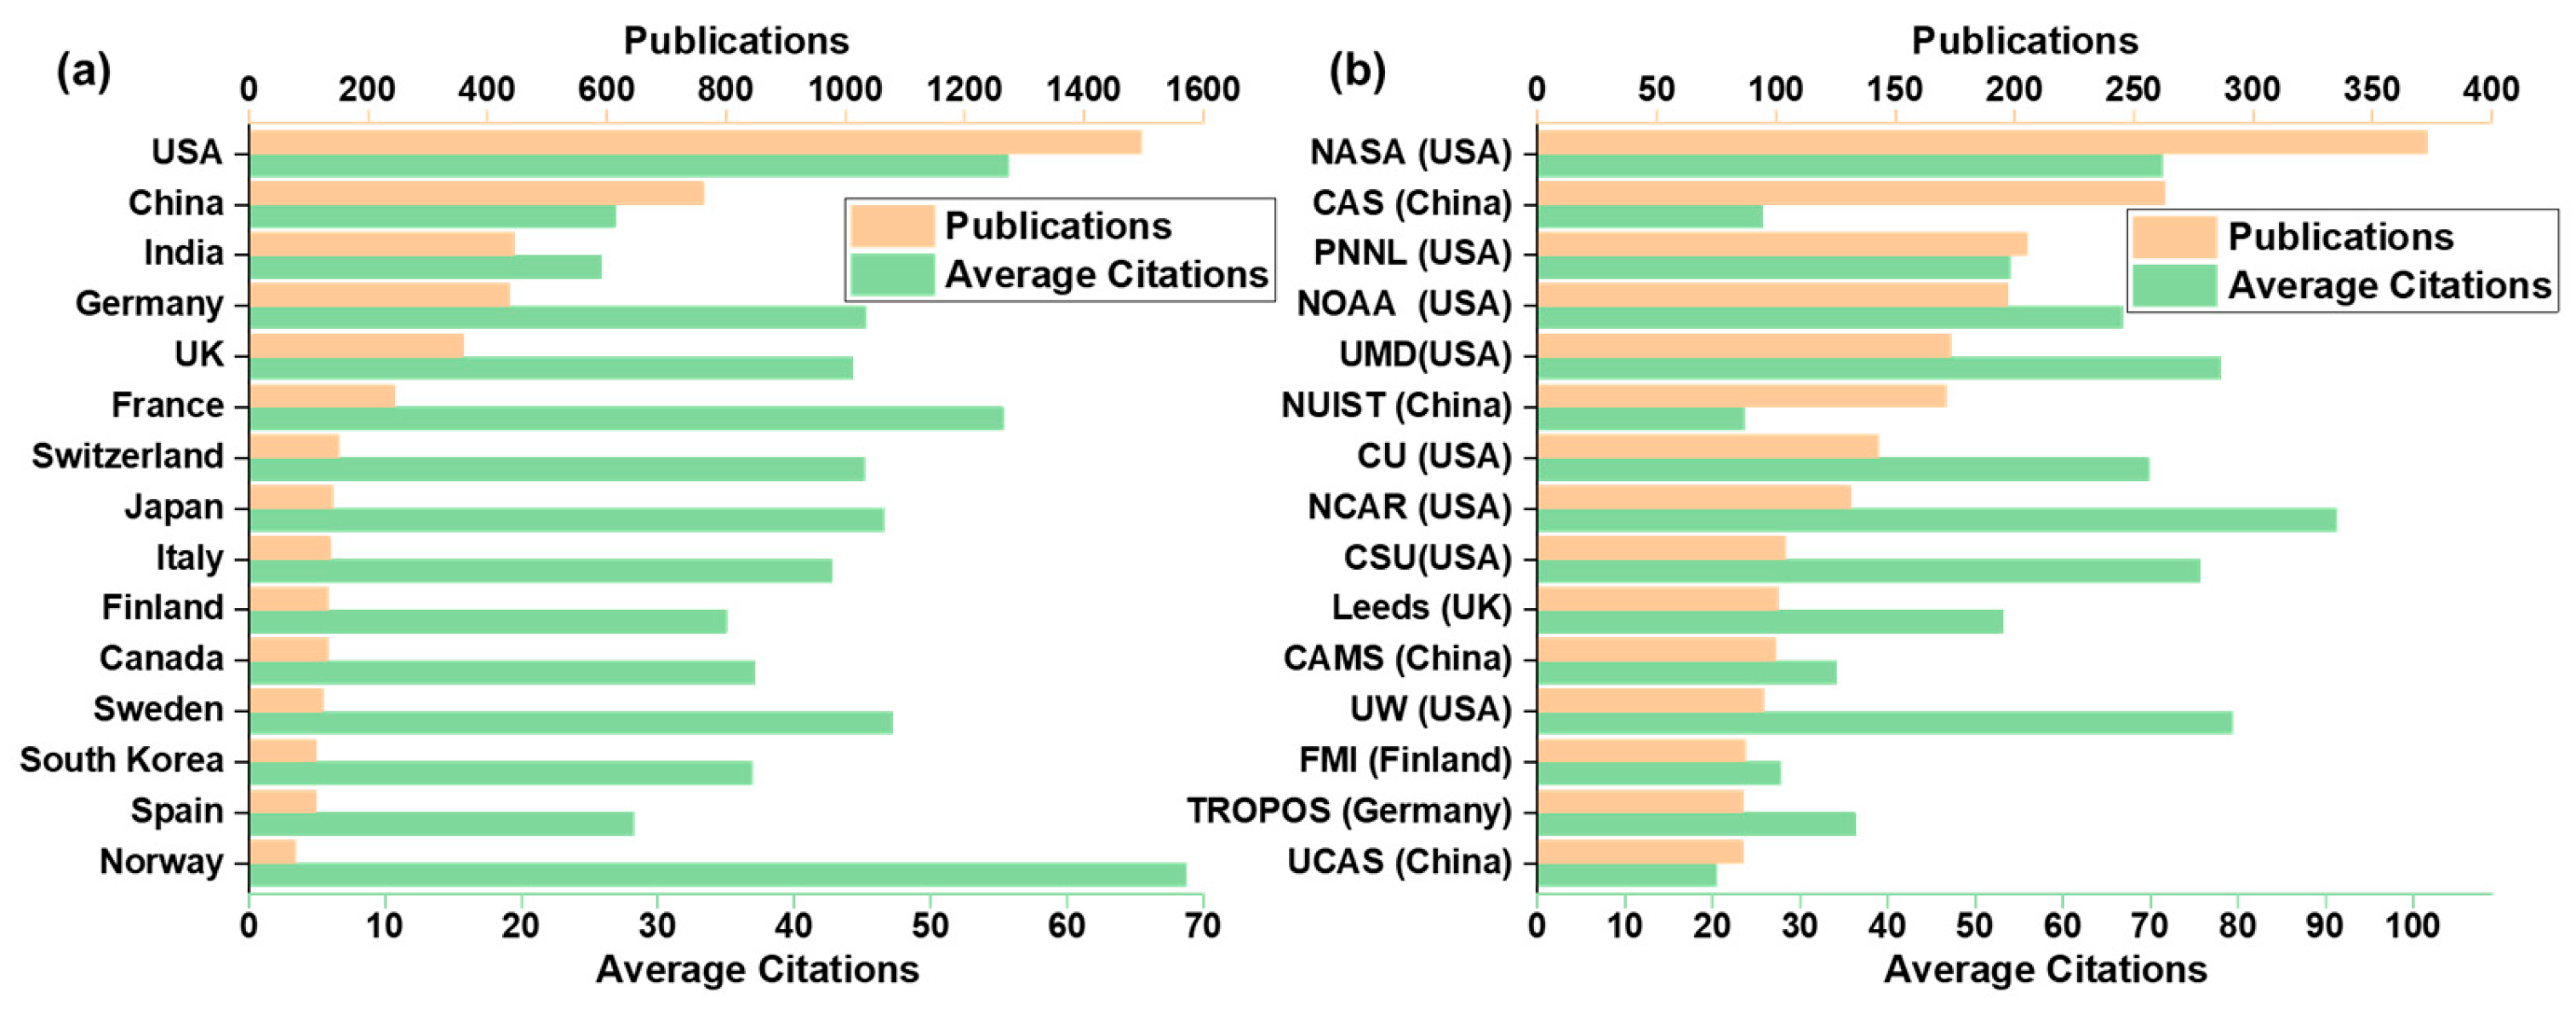
3.3. Productive Countries and Institutions

The contributions of countries and institutions are assessed by publication numbers, as well as their international influence and collaboration in the field of ARI and ACI. A total of 81 countries and 1984 institutions are included in this assessment. The top 15 countries and institutions with the most numerous publications are shown in Figure 3. The USA and China are the most productive countries in ARI and ACI research with 1497 and 762 publications, respectively, followed by India (444 publications), Germany (437 publications), and the UK (359 publications) (Figure 3a). In terms of the average citation per publication, Norway and France rank first and second, respectively, indicating that they also have great influence in this field. Moreover, the co-authorship network indicates that the USA and China hold a key position in ARI and ACI research and have strong collaborations with other countries (Figure 4).
Similarly, the top 15 productive institutions are further analyzed (Figure 3b). The National Aeronautics and Space Administration (NASA) ranks first in terms of total publications (373 publications), followed by the Chinese Academy of Sciences (CAS, 263 publications) and the Pacific Northwest National Laboratory (PNNL, 205 publications). Interestingly, the National Center for Atmospheric Research (NCAR) holds the eighth position in total publications but takes the first place in terms of average citations (91.31), suggesting its significant influence in ARI and ACI research. Notably, 53% of the top 15 institutions are from the USA and 20% are from China, which further emphasizes the USA’s and China’s key role in this field. Although the USA is very influential in this field, its AGR has been negative from 1999 to 2023 (−1.22, p < 0.05), indicating a downward trend. Conversely, China has an AGR of 1.80 (p < 0.05), indicating an upward trend. The AGR of the top 15 institutions also shows a similar contrast in research trends. For example, the AGR of NASA (−0.99, p < 0.05), National Oceanic and Atmospheric Administration (NOAA, −0.34, p < 0.05), University of Maryland (UMD, −0.40, p < 0.05), University of Washington (UW, −0.36), and University of California, San Diego (UCSD, −0.40, p < 0.05) are all negative. Meanwhile, the AGR of CAS (0.44, p < 0.05), Nanjing University of Information Science and Technology (NUIST, 0.55, p < 0.05), Chinese Academy of Meteorological Sciences (CAMS, 0.21, p < 0.05) and University of the Chinese Academy of Sciences (UCSD, 0.32, p < 0.05) are positive.
Overall, these analyses underscore the dominant roles of the USA and China in ARI and ACI research. The USA shows a recent decline in growth, whereas China exhibits a marked increase. This divergence underscores the dynamic nature of global research productivity and influence.

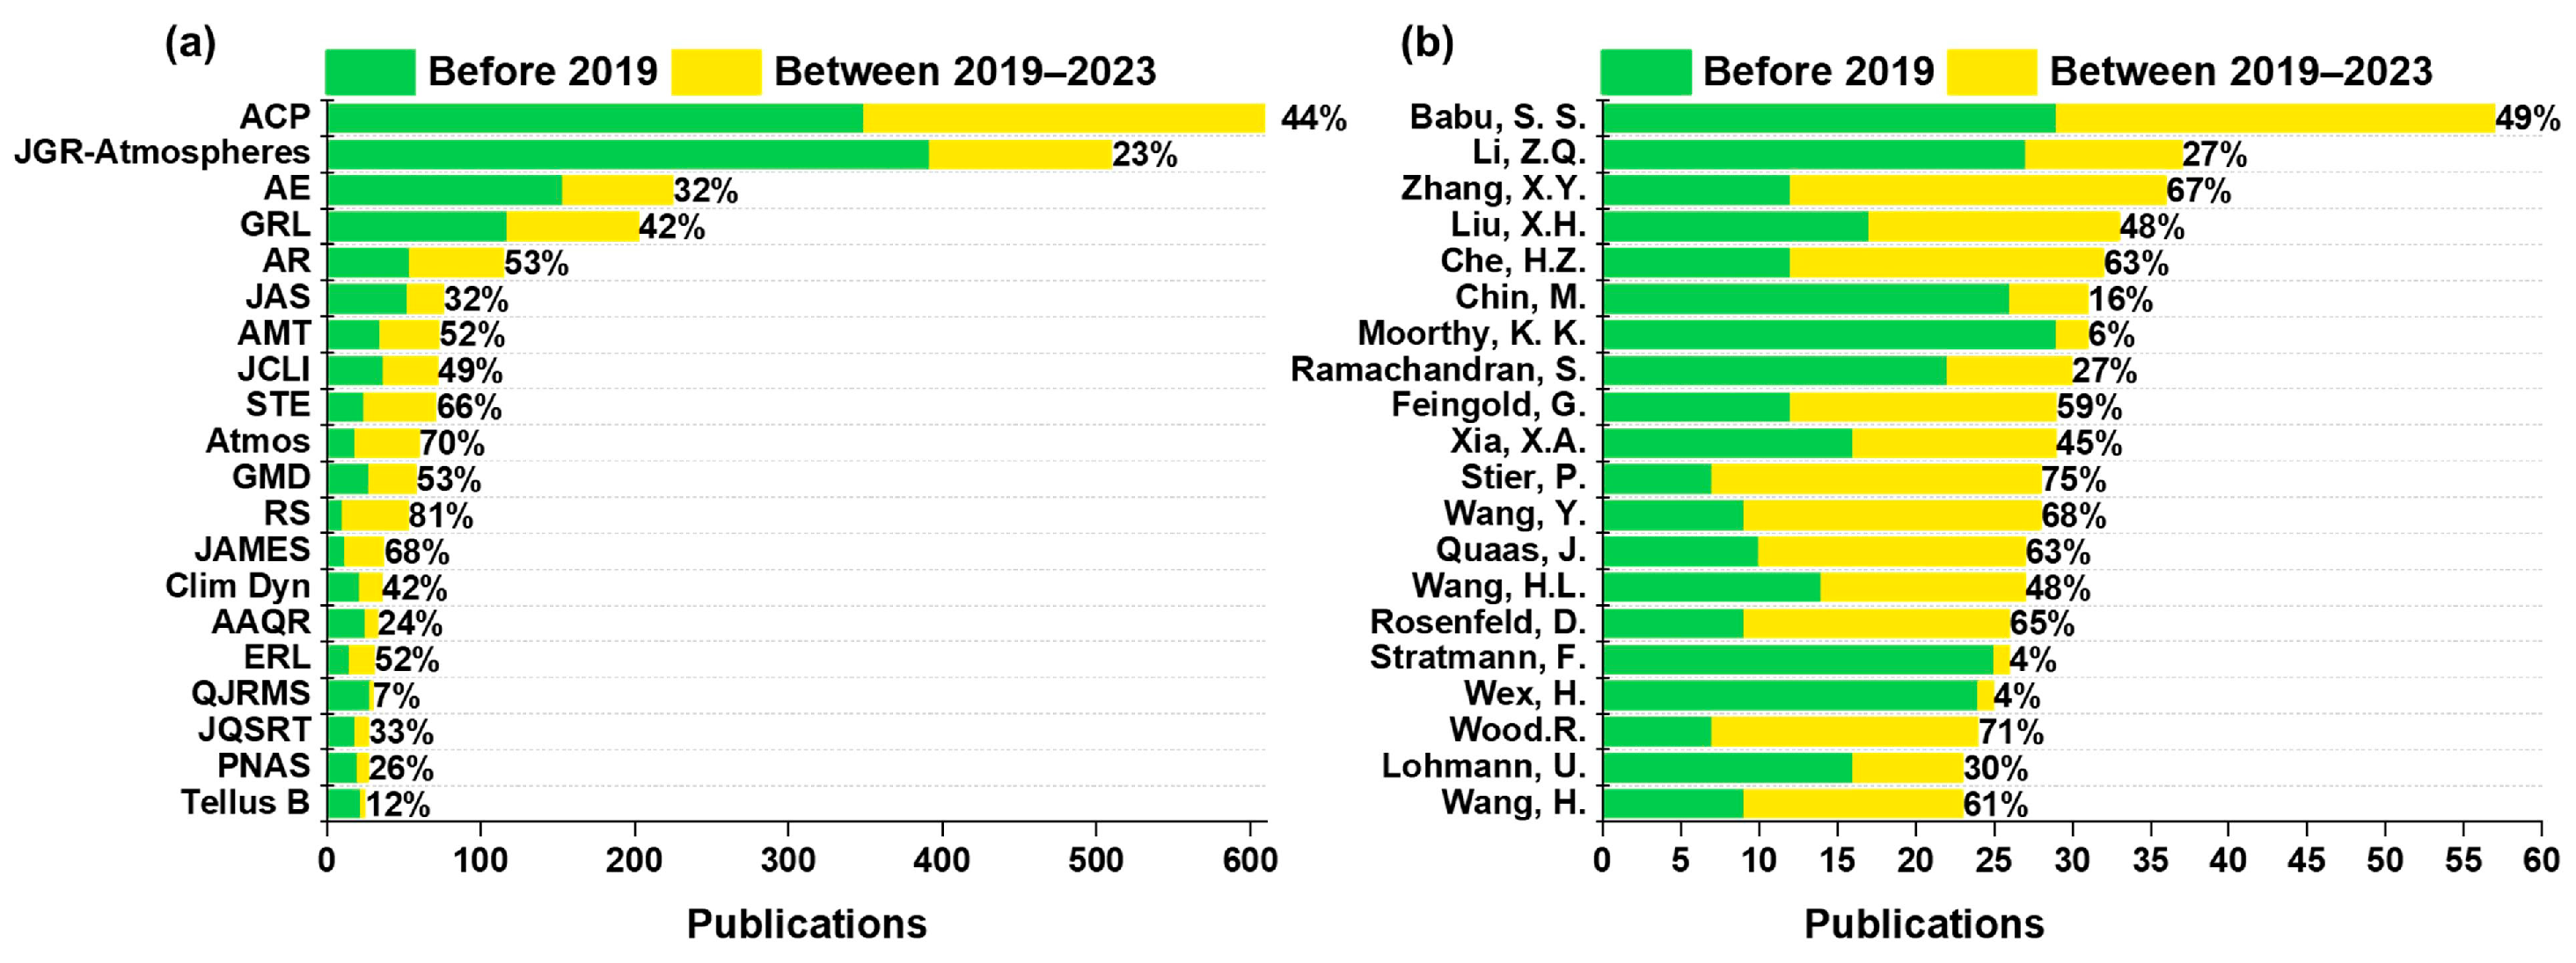
3.4. Prolific Journals and Authors

Journals are important in facilitating academic exchange and communication within specific research areas and topics. The publication analysis reveals that 212 journals were involved in ARI and ACI research during this study period and the top 20 journals are shown in Figure 5a. Atmospheric Chemistry and Physics (ACP) and Journal of Geophysical Research-Atmospheres (JGR-Atmospheres) show the greatest interest in this field with 620 and 510 publications, respectively, followed by Atmospheric Environment (AE, 225 publications), Geophysical Research Letters (GRL, 203 publications), and Atmospheric Research (AR, 115 publications). Note that the past 5 years (2019–2023) are an important period for ARI and ACI research with increasing attention. For instance, among the top 20 journals with the most publications, 8 journals published more than 50% of the total publications between 2019 and 2023. Among them, Remote Sensing (RS) (81.13%), Atmosphere (Atmos) (70%), Journal of Advances in Modeling Earth Systems (JAMES) (68%), and Science of the Total Environment (STE) (66%) show high publication percentages of documents between 2019 and 2023, focusing mainly on remote-sensing techniques, atmospheric composition, air quality, climate change, and climate models. This trend indicates a shift towards more interdisciplinary and technologically advanced approaches in ARI and ACI research. The high percentages of recent publications in these journals suggest a rapid evolution of the field, driven by advancements in remote-sensing technology and an increased understanding of atmospheric processes. Furthermore, these trends can help detect and identify research hotspots and priorities, which are further supported by the author-keyword analysis in Section 3.5.
Tracking productive authors and/or groups in articles is crucial for gaining a quick understanding of the latest advancements in the field. The most productive researchers and their collaboration networks are further analyzed in this study. Figure 5b shows the top 20 productive authors in ARI and ACI research, including Babu, S. Suresh with 57 publications from Vikram Sarabhai Space Center (VSSC, India), Li Zhanqing with 37 publications from UMD (USA), and Zhang Xiaoye with 36 publications from CMAS (China). Sixty percent of the top 20 influential authors are from the USA and China. Furthermore, 75% of the Chinese authors among them have published more in the last 5 years. This is consistent with the research trend of ARI and ACI research from these two countries, as mentioned in Section 3.3. The collaborative relationships between authors sharing more than 10 publications are determined by co-authorship analysis using VOSviewer (Figure 6). The top 20 productive authors are involved in this collaboration analysis, and they have strong connections with each other. The multidisciplinary backgrounds of these authors and collaborations among them will further promote the development of studies on ARI and ACI, bringing unexpected changes to the field worldwide.

3.5. Typical Research Focuses on ARI and ACI

The author keywords highlight the article’s primary content and themes, offering valuable insights into the research topic [22]. To ensure a comprehensive and accurate representation of the research themes, we first amalgamated synonymous keywords, including singular and plural forms and abbreviations (Table S4). This process resulted in the identification of 97 keywords with more than 10 occurrences, which were then selected for further analysis and used as the foundation for constructing the co-occurrence network using VOSviewer. In Figure 7a, the nodes represent the occurrence of author keywords, with their size indicating frequency or importance. The color of the nodes corresponds to different clusters classified based on co-occurrence analysis, while the thickness and length of the links between nodes represent the strength of connection and relevance. The average emergence time is depicted in Figure 7b, where darker blue signifies earlier emergence and lighter red nodes indicate more recent emergence.
VOSviewer employs a clustering algorithm based on modularity optimization, utilizing a weighted and parameterized modularity function to distinguish clusters in the co-occurrence network of author keywords [44]. By maximizing modularity, the algorithm groups keywords into clusters where those within the same cluster have stronger association strengths and frequently co-occur, while connections between different clusters are minimized [44]. This method effectively organizes keywords into distinct thematic clusters, facilitating the identification of key focus areas in ARI and ACI research and elucidating the interrelationships among keywords. In this study, the extracted keywords were grouped into seven distinct clusters, each displayed in a different color—Cluster 1 (blue), Cluster 2 (yellow), Cluster 3 (light blue), Cluster 4 (green), Cluster 5 (purple), Cluster 6 (orange), and Cluster 7 (red)—representing various research focuses from 1999 to 2023.
The central keywords in each cluster not only hold prominent positions within their respective clusters but also have strong connections to other clusters. Figure 8 highlights these core terms and their network across the bibliometric map, including key terms like “aerosol optical depth”, “black carbon”, “aerosol”, “cloud condensation nuclei”, and “aerosol-cloud-radiation interactions”. Based on these major keywords, the clusters are grouped as follows: Cluster 1 is grouped into Aerosol Optical Properties, with “aerosol optical depth” as the central term, connecting various key terms related to aerosol characteristics in ARI and ACI research. Clusters 2 and 3 are grouped into Aerosol Types (yellow and green), focusing on different types such as “black carbon” and “organic aerosols”. Cluster 4, categorized under Aerosol Radiation Interactions (green), centers on “aerosol” and includes keywords such as “direct radiative forcing” and “aerosol-radiation interaction”, reflecting the key themes of ARI. Cluster 7 focuses on Aerosol-Cloud radiation interactions (red), with “aerosol-cloud radiation interactions” as its core term, highlighting the complex relationships between aerosols, clouds, and radiation in climate processes. Clusters 5 and 6, grouped under Cloud Condensation Nuclei (purple and orange), are linked to both ARI and ACI, with “cloud condensation nuclei” as the main keyword, serving as a bridge between the two areas. This grouping of keyword clusters helps readers quickly grasp the key research areas in this field. In the following sections, we will provide a more detailed analysis of the connections between these keywords and the research topics they address within ARI and ACI studies.

3.5.1. Cluster 1: Aerosol Optical Properties

Aerosol optical properties play a crucial role in the study of ARI and ACI [9]. The author keywords in Cluster 1 (blue) from co-occurrence analysis reveal some typical aspects of it. Notably, “aerosol optical depth” (AOD), “single scattering albedo” (SSA), and “angstrom exponent” reflect important optical parameters including the vertical concentration, scattering and absorption properties, and size of aerosol particles [43]. The keywords “AERONET” and “MODIS” represent the most typical in situ and satellite monitoring systems for aerosol optical properties, enabling spatial and temporal analysis of these properties [9].
The keyword “SBDART” refers to a radiative transfer model that solves the plane-parallel radiative transfer problem under both clear and cloudy sky conditions by incorporating aerosol optical properties and other pertinent factors [41]. Other author keywords include “heating rate”, “aerosol type”, “dust storm”, “Indo-Gangetic plain”, and “water vapor” which are closely linked to “aerosol optical depth” in Cluster 1 in Figure 8a. These connections reveal diverse research topics in ARI and ACI, where variations in aerosol optical properties, along with the integration of these keywords, play a crucial role in advancing research. For example, Zhu et al. [45] investigate how column water vapor influences aerosol properties and their radiative effects in China, revealing significant spatial variations and a weakening of aerosol radiative impact in high water vapor conditions. Chen et al. [46] classified aerosols into four types based on fine mode fraction and SSA, exploring how solar zenith angle, surface albedo, and SSA influence their radiative forcing efficiency.
Most research topics in this cluster, based on their average publication year, appeared primarily before 2017, indicating the foundational importance of aerosol optical properties in ARI and ACI research. Additionally, “aerosol type”, “SBDART”, “AERONET”, “water vapor”, and “heating rate” continue to be prominent research topics in recent years, underscoring the ongoing need to refine our understanding of aerosol behavior under varying atmospheric conditions and a shift from fundamental studies of aerosol properties to more complex analyses.

3.5.2. Cluster 2 and 3: Aerosol Types

To perform an in-depth analysis of research topics related to ARI and ACI research, the author keywords in Clusters 2 and 3 (highlighted in yellow and light blue) establish a connection between aerosol optical properties and the aerosol radiation interactions group (Figure 8b). The keywords in Cluster 2 (yellow) reflect different aerosol types, which have been previously mentioned in Section 3.5.1 and are essential to advancing ARI and ACI research. Based on their structural and compositional characteristics, aerosols can be classified as scattering or absorptive aerosols [10]. In this cluster, “black carbon” and “organic carbon” are absorbing aerosols, while “brown carbon” exhibits both scattering and absorptive properties [10]. Scattering aerosols reflect a significant portion of solar radiation, resulting in a cooling effect, whereas absorbing aerosols absorb substantial solar radiation, contributing to atmospheric warming. In addition, black carbon, a major byproduct of biomass burning, is closely linked to studies on aerosols and air pollution due to its significant impact on climate change and air quality.
The keyword “CALIPSO” (Cloud-Aerosol Lidar and Infrared Pathfinder Satellite Observation) in Cluster 3 (light blue) refers to active satellite remote sensing [47]. CALIPSO utilizes a two-wavelength polarization lidar and two passive imagers, enabling the discrimination of cloud ice/water phases and different aerosol types [47]. Providing vertical profiles of aerosols, CALIPSO is essential for diagnosing aerosol types and estimating their radiative effects [48]. The coexistence of different aerosol types in the atmosphere results in complex and uncertain combined radiative effects, a topic that has been extensively discussed, as shown by the average publication year analysis (Figure 7b). Among them, “brown carbon”, “biomass burning”, “black carbon”, and “CALIPSO” remain popular research focuses in recent years. This trend aligns with the growing emphasis on using advanced satellite and in situ data to study these aerosols in detail.

3.5.3. Cluster 4: Aerosol Radiation Interactions

In Cluster 4 (green), the typical words are “aerosol”, “WRF-Chem”, “dust”, “anthropogenic aerosol”, “aerosol-radiation interaction”, and “climate”. The co-occurrence network in this cluster reveals additional aspects of ARI research, building on the topics from the previous clusters (Figure 8c). Keywords such as “sulfate” and “dust” are also typical aerosol types in studying ARI, which can be classified as anthropogenic or natural aerosols based on their sources [10]. Sulfate aerosols scatter a significant portion of solar radiation, resulting in a cooling effect [3]. Dust aerosols influence the climate through their interactions with solar shortwave and terrestrial longwave radiation, but whether they result in overall warming or cooling remains a subject of debate [49].
Additionally, sulfate, black carbon, and organic aerosols are important constituents of air pollution, affecting air quality and human health [50]. Understanding aerosols and ARI is essential for climate mitigation and improving regional air quality [51]. Many researchers have focused on these topics, combining them with previous research on aerosol optical properties, aerosol types, and data methods (Figure 8c) [52,53,54]. However, understanding ARI in the real world is challenging, which can be addressed through control experiments in model simulations where aerosol populations are perturbed in a controlled manner within the same environment [55].
In this cluster, “WRF” and “WRF-Chem” reflect popular numerical simulations used to study ARI [56,57]. For example, Tao et al. [58] discussed the microphysical and radiative effects of dust and other aerosols on the Saharan air layer structure and environment using NUWRF (NASA Unified Weather Research and Forecasting). Wang et al. [59] using WRF-Chem (WRF coupled with a chemistry module) estimated fine particulate matter (PM2.5) and ozone (O3) levels, considering the feedback of aerosols on meteorology over the Sichuan Basin. Considering the average publication year of author keywords in this cluster, the research popularity of WRF-Chem, indicated by the light red item bubble, is high in ARI and ACI research. This aligns with the popularity of “numerical simulation” in Cluster 2 (Figure 7b). These reflect a broader trend in atmospheric science toward understanding the complex interactions between aerosols, radiation, and meteorology. These tools are increasingly critical for simulating real-world conditions and predicting the impacts of aerosols on climate and air quality, highlighting a shift from purely observational studies to integrated modeling approaches. Additionally, “COVID−19”, “PM2.5”, “air pollution”, “ozone”, and “China” are other noticeable research topics in this field.

3.5.4. Cluster 5 and 6: Cloud Condensation Nuclei

In Clusters 5 and 6 (purple and orange), “cloud condensation nuclei” have the highest frequency, closely relating to keywords in Clusters 7 (red) and 4 (green) (Figure 8d). The co-occurrence analysis of author keywords in these clusters connects Cluster 7 (ACI) and Cluster 4 (ARI). Aerosols can act as condensation nuclei for cloud droplets or ice nuclei for ice particles, thereby regulating the Earth’s radiation budget by influencing clouds [9]. For example, dust aerosols can modify cloud properties by seeding cloud droplets and ice crystals, resulting in indirect radiative effects on clouds [60,61].
Studying the influence of aerosols on clouds is complex, with many researchers dedicated to this area. Keywords in Cluster 6 (orange) indicate additional research focuses, such as “hygroscopicity”, “mixing state”, “size distribution”, “cloud optical depth”, and “activate”. Cluster 5 keywords highlight typical data methods and research objects, including “artificial intelligence” and “CMIP”, “snow albedo”, and “Tibetan Plateau”. The presence of fewer light blue and many red bubbles in Figure 7b suggests these topics are crucial for ARI and ACI research, particularly “artificial intelligence”, “Tibetan Plateau”, “snow albedo”, “hygroscopicity”, and “mixing state”. The rising interest in topics like “cloud condensation nuclei” and “aerosol indirect effects” reflects an evolving understanding of how aerosols influence cloud formation and, consequently, climate.

3.5.5. Cluster 7: Aerosol-Cloud Radiation Interactions

Keywords within Cluster 7 (red circles in Figure 7a) indicate a strong inclination towards aerosol-cloud radiation interactions (ACI) and their influence on climate. This is evidenced by the prominence of “aerosol-cloud interaction”, “cloud”, “cloud microphysics”, “remote sensing”, and “climate change” as the most popular words (Figure 8e).
ACI significantly affects Earth’s radiation budget, subsequently influencing other atmosphere-related variables, including temperature, relative humidity (RH), and the thermodynamics of the planetary boundary layer (PBL), further impacting meteorology [62,63,64]. ACI is also crucial for investigating monsoons, which encompass broader seasonal fluctuations in various meteorological factors, particularly precipitation [65,66,67,68]. Additionally, meteorological changes caused by ACI notably affect the concentrations of particulate pollutants, thereby influencing air quality and climate change [62,69,70].
Extensive research utilizing diverse approaches, such as in situ observations [71,72], satellite data [73,74,75], aircraft measurements [76,77], and model simulations [78,79], contribute to understanding ACI. Figure 7b illustrates the prominence of keywords in this cluster in ARI and ACI research. The Southern Ocean and the Arctic are focal areas for researching ACI, along with cloud radiative effects, rainfall, cloud-resolving models, and precipitation being typical research topics.
The co-occurrence analysis results in Figure 8e reveal strong connections between ACI in this cluster and keywords associated with ARI in Cluster 4, suggesting that ARI and ACI are often studied together. For instance, the simulation model WRF-Chem from Cluster 4 is commonly utilized to study both ARI and ACI [80,81]. The increasing focus on aerosol-cloud interactions in Cluster 7 reflects a broader trend in atmospheric science toward understanding the complex feedback mechanisms between aerosols, clouds, and climate. This trend is closely tied to the development and application of sophisticated models and observational techniques, which are essential for capturing the intricate dynamics of ACI and its impacts on global and regional climates.
This study uses co-occurrence analysis of author keywords to comprehensively showcase the multiple themes and their interrelationships in ARI and ACI research. Examining the connections among these keywords reveals the field’s complexity, involving various aerosol and cloud properties and their impacts on climate and the environment. This network-based keyword analysis helps researchers track progress and identify future directions in ARI and ACI studies, providing valuable insights for understanding and exploring research content in these areas.

4. Discussion

The co-occurrence analysis of author keywords and the detailed exploration of different groups, this bibliometric analysis has identified the main research themes and trends in ARI and ACI studies. These key themes, forming the core subjects of ARI and ACI research, are classified into four primary categories: properties, types, methods, and impacts. To investigate the evolution of these research topics further, we calculated the NKCF and trend factors for recent years based on [30,31]. The top 20 author keywords NKCF and their trend factors are presented in Figure S1 and Figure 9.
Interestingly, keywords with infrequent NKCF often show significant trends. The investigation of AOD (−0.01), SSA (−0.09), and AOP (−0.14) with high NKCF in property groups (Figure 9a) shows a minor decrease. Meanwhile, “cloud fraction” (0.61), “cloud effective radius” (0.61), and “aerosol size distribution” (0.51) with lower NKFC exhibit a significantly increasing trend. Additionally, “cloud condensation nuclei” (0.63) shows a prominent growing tendency, consistent with the results of the emerging time in Section 3.5.4. Similarly, “cumulus clouds” (−0.39), “convective clouds” (−0.09), and “cirrus clouds” (−0.57) with low NKFC in the types group (Figure 9b) have notable negative trends, while “black carbon” (0.14), “cloud” (0.11), and “dust” (0.09) with high NKFC present a slight positive trend. Studies on different aerosol types in ARI and ACI show a growing tendency, especially organic carbon and biomass burning among the top 20 keywords in the types group. Although studies on different cloud types present negative trends, “stratocumulus” (0.56) exhibits the highest growing trend factors of all keywords in this group. The trend factors in these two groups reveal that ARI and ACI research trends are shifting from focusing on single aerosol or cloud properties or types to diverse interactions between aerosols and clouds.
Various methods are used in ARI and ACI research, including in situ observations, satellites, and models, as mentioned in Section 3.4. The trend indicators for the top 20 method keywords in the field (Figure 9c) indicate that sophisticated models show a significantly higher positive trend factor (e.g., “artificial intelligence” (0.56), “global climate model” (0.61)), displaying a strong upward trend. Conversely, keywords related to observational data and some simple models have negative trend factors (e.g., “MODIS” (−0.74), “SBDART” (−0.46), and “aircraft measurements” (−0.27)). These methods are strongly interconnected with other properties of aerosols or cloud types (Section 3.5). This suggests that models are becoming more popular, and their development will likely be integrated with satellite and in situ measurements to advance the study of ARI and ACI in diverse aspects.
Additionally, ARI and ACI have diverse impacts on Earth’s radiation budget, the hydrological cycle [43,82], monsoons [83,84,85], atmospheric circulation [86,87], and, thus, for the climate. Notable events (e.g., “meteorology” (0.81), “COVID-19” (0.69), “rainfall” (0.39), “ozone” (0.21)) and areas (“Southern Ocean” (0.95), “Indo-Gangetic Plain” (0.31), “Himalaya” (0.15), “Arctic” (0.29)) exhibit higher positive trends, indicating a strong upward tendency (Figure 9d).
This bibliometric analysis highlights a shift in ARI and ACI research trends from focusing on individual aerosol or cloud properties to exploring their interactions, with sophisticated models showing strong positive trends and increasingly diverse impacts being studied. To gain deeper insights into the methods and research areas, we used VOSviewer to map the average emergence time of author keywords from 2018–2023 (Figure S2). The map, which employs a color gradient from blue to red to represent the timeline of research focus, illustrates how certain studies have evolved. For example, the clustering of keywords around regions like the “Southern Ocean”, “Arctic”, and “China” indicates a strong emphasis on global and regional studies, while connections to keywords such as “WRF-Chem”, “artificial intelligence”, and “AERONET” integration of modeling and techniques with observational data. This visualization demonstrates how various tools and measurements have been combined to enhance our understanding of ARI and ACI. Overall, ARI and ACI research continues to attract significant interest from researchers, with future advancements likely driven by the ongoing integration of sophisticated models and observational data.

5. Conclusions

Aerosol affects Earth’s radiative balance and climate change through ARI and ACI, drawing considerable attention from researchers. This study conducted a comprehensive bibliometric analysis of ARI and ACI research from 1999 to 2023 using the Web of Science Core Collection (WoSCC) database and VOSviewer. Key findings include:
(1)
Evolution of Publications and Citations: The annual number of publications and citations related to ARI and ACI has shown a consistent upward trend, reflecting the sustained attention this field receives from researchers.
(2)
Influential References: Co-citation analysis identifies seminal works that have shaped ARI and ACI research. These references provide critical insights into aerosol optical properties, sulfate aerosol impacts on climate, and aerosol radiative effects on the hydrological cycle. They are particularly valuable for junior researchers to understand foundational theories, methodologies, and datasets in ARI and ACI research.
(3)
Productive Countries and Institutions: The USA and China are the most productive countries, with significant contributions from institutions like NASA, the CAS, and PNNL. While the USA shows a recent decline in growth, China’s research activity is on the rise, highlighting shifting dynamics in global research contributions.
(4)
Prolific Journals and Authors: Productive journals include Atmospheric Chemistry and Physics (ACP) and Journal of Geophysical Research-Atmospheres (JGR-Atmospheres). Prominent authors, such as Babu S. Suresh, Li Zhanqing, and Zhang Xiaoye, are recognized for their contributions to this field.
(5)
Research Focuses and Trends: Co-occurrence analysis of author keywords reveals distinct research groups, including aerosol optical properties, aerosol types, aerosol radiation interactions, and aerosol-cloud radiation interactions. Recent trends indicate a growing focus on advanced methodologies, such as remote sensing, artificial intelligence, and numerical simulations, underscoring the field’s evolution towards more interdisciplinary and technologically sophisticated approaches.
Overall, ARI and ACI research continues to attract researchers’ interest. Studying typical mechanisms and properties of ARI and ACI research using diverse methods, including models and observational data, is poised for further advancements. The bibliometric analysis conducted in this study has provided valuable insights into current research trends and focal areas. Moving forward, employing more diverse bibliometric analyses or advanced techniques such as artificial intelligence and machine learning can enhance our understanding of research progress and identify emerging areas of focus in this field.

Supplementary Materials

The following supporting information can be downloaded at: https://www.mdpi.com/article/10.3390/atmos15101189/s1, Table S1: Full descriptions of the top 15 countries and institutions in terms of ARI and ACI research publications; Table S2: Full name of the top 20 journals with impact factor and JCR in terms of ARI and ACI research publications; Table S3: Full name of the top 20 authors and their H-Index and average citations in terms of ARI and ACI research publications; Table S4: The merged process of author keywords with occurrences more than 50; Figure S1: Normalized cumulative frequency for top 20 keywords in four research groups of ARI and ACI; Figure S2: Average emergence time of the co-occurrence network map of author keywords related to methods and research areas from 2018 to 2023.

Author Contributions

Conceptualization, S.W. and B.Y.; methodology, S.W.; software, S.W.; validation, S.W. and B.Y; formal analysis, S.W.; investigation, S.W.; resources, B.Y.; data curation, S.W. and B.Y.; writing—original draft preparation, S.W.; writing—review and editing, B.Y.; visualization, S.W.; supervision, B.Y.; project administration, B.Y.; funding acquisition, B.Y. All authors have read and agreed to the published version of the manuscript.

Funding

This work is partially supported by the Science and Technology Planning Project of Guangdong Province (2023B1212060019), the Zhujiang Talent Program of the Department of Science and Technology of Guangdong Province (2017GC010619), and the Guangdong Basic and Applied Basic Research Foundation (2019A1515011230).

Data Availability Statement

The raw data from the Web of Science Core Collection (WoSCC) database can be downloaded at Author Search—Web of Science Core Collection (clarivate.cn), accessed on 23 August 2024; VOSviewer software (version 1.6.18) can be download at VOSviewer—Visualizing scientific landscapes, assessed on 5 March 2023.

Conflicts of Interest

The authors declare no conflict of interest. The funders had no role in the design of the study; in the collection, analyses, or interpretation of data; in the writing of the manuscript; or in the decision to publish the results.

References

  1. IPCC. Climate Change 2021: The Physical Science Basis; Contribution of Working Group I to the Sixth Assessment Report of the Intergovernmental Panel on Climate Change; Cambridge University Press: Cambridge, UK, 2021; pp. 923–1054. [Google Scholar] [CrossRef]
  2. Li, Z.; Guo, J.; Ding, A.; Liao, H.; Liu, J.; Sun, Y.; Wang, T.; Xue, H.; Zhang, H.; Zhu, B. Aerosol and Boundary-Layer Interactions and Impact on Air Quality. Natl. Sci. Rev. 2017, 4, 810–833. [Google Scholar] [CrossRef]
  3. Charlson, R.J.; Schwartz, S.E.; Hales, J.M.; Cess, R.D.; Coakley, J.A.; Hansen, J.E.; Hofmann, D.J. Climate Forcing by Anthropogenic Aerosols. Science 1992, 255, 423–430. [Google Scholar] [CrossRef] [PubMed]
  4. Satheesh, S.K.; Ramanathan, V. Large Differences in Tropical Aerosol Forcing at the Top of the Atmosphere and Earth’s Surface. Nature 2000, 405, 60–63. [Google Scholar] [CrossRef] [PubMed]
  5. Albrecht, B.A. Aerosols, Cloud Microphysics, and Fractional Cloudiness. Science 1989, 245, 1227–1230. [Google Scholar] [CrossRef]
  6. Ramaswamy, V.; Boucher, O.; Haigh, J.; Hauglustaine, D.; Haywood, J.; Myhre, G.; Nakajima, T.; Shi, G.Y.; Solomon, S.; Betts, R.; et al. Radiative Forcing of Climate Change; Cambridge University Press: Cambridge, UK, 2001; pp. 349–416. Available online: https://www.ipcc.ch/site/assets/uploads/2018/03/TAR-06.pdf (accessed on 24 January 2024).
  7. Twomey, S. The Influence of Pollution on the Shortwave Albedo of Clouds. J. Atmos. Sci. 1977, 34, 1149–1152. [Google Scholar] [CrossRef]
  8. Gao, C.; Xiu, A.; Zhang, X.; Tong, Q.; Zhao, H.; Zhang, S.; Yang, G.; Zhang, M. Two-Way Coupled Meteorology and Air Quality Models in Asia: A Systematic Review and Meta-Analysis of Impacts of Aerosol Feedbacks on Meteorology and Air Quality. Atmos. Chem. Phys. 2022, 22, 5265–5329. [Google Scholar] [CrossRef]
  9. Liu, Y.; Jia, R.; Dai, T.; Xie, Y.; Shi, G. A Review of Aerosol Optical Properties and Radiative Effects. J. Meteorol. Res. 2014, 28, 1003–1028. [Google Scholar] [CrossRef]
  10. Li, J.; Carlson, B.E.; Yung, Y.L.; Lv, D.; Hansen, J.; Penner, J.E.; Liao, H.; Ramaswamy, V.; Kahn, R.A.; Zhang, P.; et al. Scattering and Absorbing Aerosols in the Climate System. Nat. Rev. Earth Environ. 2022, 3, 363–379. [Google Scholar] [CrossRef]
  11. Satheesh, S.K.; Moorthy, K.K. Radiative Effects of Natural Aerosols: A Review. Atmos. Environ. 2005, 39, 2089–2110. [Google Scholar] [CrossRef]
  12. Deng, Z.; Wang, H.; Chen, Z.; Wang, T. Bibliometric Analysis of Dendritic Epidermal T Cell (DETC) Research From 1983 to 2019. Front. Immunol. 2020, 11, 259. [Google Scholar] [CrossRef]
  13. Fernandes, S.; Jit, M.; Bozzani, F.; Griffiths, U.K.; Scott, J.A.G.; Burchett, H.E.D. A Bibliometric Analysis of Systematic Reviews on Vaccines and Immunisation. Vaccine 2018, 36, 2254–2261. [Google Scholar] [CrossRef] [PubMed]
  14. Ramírez-Malule, H.; Quiñones-Murillo, D.H.; Manotas-Duque, D. Emerging Contaminants as Global Environmental Hazards. A Bibliometric Analysis. Emerg. Contam. 2020, 6, 179–193. [Google Scholar] [CrossRef]
  15. Su, Y.; Yu, Y.; Zhang, N. Carbon Emissions and Environmental Management Based on Big Data and Streaming Data: A Bibliometric Analysis. Sci. Total Environ. 2020, 733, 138984. [Google Scholar] [CrossRef] [PubMed]
  16. Wang, Y.; Zhang, B.; Zhang, R.; Wei, Y.; Wang, Y.; Zhu, R. Microplastic Pollution Research Based on the VOS Viewer Software: Research Trends, Ecological Effects, and Testing Methods. Atmosphere 2023, 14, 838. [Google Scholar] [CrossRef]
  17. Şengel, Ü.; Koç, A. Bibliometric Review of Studies on Sustainable Tourism and Climate Change in 2019. Tur. Soc. 2022, 31, 161–176. [Google Scholar] [CrossRef]
  18. Lin, W.; De, K.; Wei, X.; Wang, W.; Zhang, L.; Xiang, X.; Li, F. Visual Analysis of Alpine Meadow Research Trends and Hotspots Based on VOS Viewer. Front. Environ. Sci. 2023, 11, 1095299. [Google Scholar] [CrossRef]
  19. Leal Filho, W.; Nagy, G.J.; Setti, A.F.F.; Sharifi, A.; Donkor, F.K.; Batista, K.; Djekic, I. Handling the Impacts of Climate Change on Soil Biodiversity. Sci. Total Environ. 2023, 869, 161671. [Google Scholar] [CrossRef]
  20. Tang, L.; Wu, A.; Li, S.; Tuerdimaimaiti, M.; Zhang, G. Impacts of Climate Change on Rice Grain: A Literature Review on What Is Happening, and How Should We Proceed? Foods 2023, 12, 536. [Google Scholar] [CrossRef]
  21. Cao, Y.; Wu, X.; Han, W.; An, J. Visual Analysis of Global Air Pollution Impact Research: A Bibliometric Review (1996–2022). Environ. Sci. Pollut. Res. 2023, 31, 40383–40418. [Google Scholar] [CrossRef]
  22. Ji, L.; Liu, C.; Huang, L.; Huang, G. The Evolution of Resources Conservation and Recycling over the Past 30 Years: A Bibliometric Overview. Resour. Conserv. Recycl. 2018, 134, 34–43. [Google Scholar] [CrossRef]
  23. Marcal, J.; Bishop, T.; Hofman, J.; Shen, J. From Pollutant Removal to Resource Recovery: A Bibliometric Analysis of Municipal Wastewater Research in Europe. Chemosphere 2021, 284, 131267. [Google Scholar] [CrossRef] [PubMed]
  24. Donthu, N.; Kumar, S.; Mukherjee, D.; Pandey, N.; Lim, W.M. How to Conduct a Bibliometric Analysis: An Overview and Guidelines. J. Bus. Res. 2021, 133, 285–296. [Google Scholar] [CrossRef]
  25. Xu, G.; Li, X.; Liu, X.; Han, J.; Shao, K.; Yang, H.; Fan, F.; Zhang, X.; Dou, J. Bibliometric Insights into the Evolution of Uranium Contamination Reduction Research Topics: Focus on Microbial Reduction of Uranium. Sci. Total Environ. 2024, 917, 170397. [Google Scholar] [CrossRef] [PubMed]
  26. Dzikowski, P. A Bibliometric Analysis of Born Global Firms. J. Bus. Res. 2018, 85, 281–294. [Google Scholar] [CrossRef]
  27. Van Leeuwen, T.N.; Visser, M.S.; Moed, H.F.; Nederhof, T.J.; Van Raan, A.F.J. The Holy Grail of Science Policy: Exploring and Combining Bibliometric Tools in Search of Scientific Excellence. Scientometrics 2003, 57, 257–280. [Google Scholar] [CrossRef]
  28. Taddeo, R.; Simboli, A.; Di Vincenzo, F.; Ioppolo, G. A Bibliometric and Network Analysis of Lean and Clean(er) Production Research (1990/2017). Sci. Total Environ. 2019, 653, 765–775. [Google Scholar] [CrossRef]
  29. Van Eck, N.J.; Waltman, L. Software Survey: VOSviewer, a Computer Program for Bibliometric Mapping. Scientometrics 2010, 84, 523–538. [Google Scholar] [CrossRef]
  30. Yu, Y.; Wang, S.; Yu, P.; Wang, D.; Hu, B.; Zheng, P.; Zhang, M. A Bibliometric Analysis of Emerging Contaminants (ECs) (2001−2021): Evolution of Hotspots and Research Trends. Sci. Total Environ. 2024, 907, 168116. [Google Scholar] [CrossRef]
  31. Zhu, J.-J.; Dressel, W.; Pacion, K.; Ren, Z.J. ES&T in the 21st Century: A Data-Driven Analysis of Research Topics, Interconnections, And Trends in the Past 20 Years. Environ. Sci. Technol. 2021, 55, 3453–3464. [Google Scholar] [CrossRef]
  32. Huang, Z.; Sun, R.; Wang, H.; Wu, X. Trends and Innovations in Surface Water Monitoring via Satellite Altimetry: A 34-Year Bibliometric Review. Remote Sens. 2024, 16, 2886. [Google Scholar] [CrossRef]
  33. Chen, J.; Chen, Q.; Hu, L.; Yang, T.; Yi, C.; Zhou, Y. Unveiling Trends and Hotspots in Air Pollution Control: A Bibliometric Analysis. Atmosphere 2024, 15, 630. [Google Scholar] [CrossRef]
  34. Shao, Z.; Tan, B.; Guo, Y.; Li, T.; Li, X.; Fang, X.; Wang, F.; Zhang, Q.; Wang, H. Visualization and Analysis of Mapping Knowledge Domains for Coal Pores Studies. Fuel 2022, 320, 123761. [Google Scholar] [CrossRef]
  35. Li, Y.; Fang, R.; Liu, Z.; Jiang, L.; Zhang, J.; Li, H.; Liu, C.; Li, F. The Association between Toxic Pesticide Environmental Exposure and Alzheimer’s Disease: A Scientometric and Visualization Analysis. Chemosphere 2021, 263, 128238. [Google Scholar] [CrossRef] [PubMed]
  36. Liu, C.; Liu, Z.; Zhang, Z.; Li, Y.; Fang, R.; Li, F.; Zhang, J. A Scientometric Analysis and Visualization of Research on Parkinson’s Disease Associated with Pesticide Exposure. Front. Public Health 2020, 8, 91. [Google Scholar] [CrossRef] [PubMed]
  37. Twomey, S. Pollution and the Planetary Albedo. Atmos. Environ. 1974, 41, 120–125. [Google Scholar] [CrossRef]
  38. Holben, B.N.; Eck, T.F.; Slutsker, I.; Tanré, D.; Buis, J.P.; Setzer, A.; Vermote, E.; Reagan, J.A.; Kaufman, Y.J.; Nakajima, T.; et al. AERONET—A Federated Instrument Network and Data Archive for Aerosol Characterization. Remote Sens. Environ. 1998, 66, 1–16. [Google Scholar] [CrossRef]
  39. Remer, L.A.; Kaufman, Y.J.; Tanré, D.; Mattoo, S.; Chu, D.A.; Martins, J.V.; Li, R.-R.; Ichoku, C.; Levy, R.C.; Kleidman, R.G.; et al. The MODIS Aerosol Algorithm, Products, and Validation. J. Atmos. Sci. 2005, 62, 947–973. [Google Scholar] [CrossRef]
  40. Hess, M.; Koepke, P.; Schult, I. Optical Properties of Aerosols and Clouds: The Software Package OPAC. Bull. Am. Meteorol. Soc. 1998, 79, 831–844. [Google Scholar] [CrossRef]
  41. Ricchiazzi, P.; Yang, S.; Gautier, C.; Sowle, D. SBDART: A Research and Teaching Software Tool for Plane-Parallel Radiative Transfer in the Earth’s Atmosphere. Bull. Am. Meteorol. Soc. 1998, 79, 2101–2114. [Google Scholar] [CrossRef]
  42. Dubovik, O.; Holben, B.; Eck, T.F.; Smirnov, A.; Kaufman, Y.J.; King, M.D.; Tanré, D.; Slutsker, I. Variability of Absorption and Optical Properties of Key Aerosol Types Observed in Worldwide Locations. J. Atmos. Sci. 2002, 59, 590–608. [Google Scholar] [CrossRef]
  43. Ramanathan, V.; Crutzen, P.J.; Kiehl, J.T.; Rosenfeld, D. Aerosols, Climate, and the Hydrological Cycle. Science 2001, 294, 2119–2124. [Google Scholar] [CrossRef] [PubMed]
  44. Bukar, U.A.; Sayeed, M.S.; Razak, S.F.A.; Yogarayan, S.; Amodu, O.A.; Mahmood, R.A.R. A Method for Analyzing Text Using VOSviewer. MethodsX 2023, 11, 102339. [Google Scholar] [CrossRef] [PubMed]
  45. Zhu, J.; Che, H.; Xia, X.; Yu, X.; Wang, J. Analysis of Water Vapor Effects on Aerosol Properties and Direct Radiative Forcing in China. Sci. Total Environ. 2019, 650, 257–266. [Google Scholar] [CrossRef] [PubMed]
  46. Chen, A.; Zhao, C.; Shen, L.; Fan, T. Influence of Aerosol Properties and Surface Albedo on Radiative Forcing Efficiency of Key Aerosol Types Using Global AERONET Data. Atmos. Res. 2023, 282, 106519. [Google Scholar] [CrossRef]
  47. Winker, D.; Vaughan, M.; Hunt, B. The CALIPSO Mission and Initial Results from CALIOP. In Proceedings of the Lidar Remote Sensing for Environmental Monitoring VII, Goa, India, 14–16 November 2006; p. 640902. [Google Scholar] [CrossRef]
  48. Korras-Carraca, M.B.; Pappas, V.; Hatzianastassiou, N.; Vardavas, I.; Matsoukas, C. Global Vertically Resolved Aerosol Direct Radiation Effect from Three Years of CALIOP Data Using the FORTH Radiation Transfer Model. Atmos. Res. 2019, 224, 138–156. [Google Scholar] [CrossRef]
  49. Di Biagio, C.; Balkanski, Y.; Albani, S.; Boucher, O.; Formenti, P. Direct Radiative Effect by Mineral Dust Aerosols Constrained by New Microphysical and Spectral Optical Data. Geophys. Res. Lett. 2020, 47, e2019GL086186. [Google Scholar] [CrossRef]
  50. Yang, Y.; Wang, H.; Smith, S.J.; Zhang, R.; Lou, S.; Yu, H.; Li, C.; Rasch, P.J. Source Apportionments of Aerosols and Their Direct Radiative Forcing and Long-Term Trends Over Continental United States. Earth Future 2018, 6, 793–808. [Google Scholar] [CrossRef]
  51. Shindell, D.; Kuylenstierna, J.C.I.; Vignati, E.; Van Dingenen, R.; Amann, M.; Klimont, Z.; Anenberg, S.C.; Muller, N.; Janssens-Maenhout, G.; Raes, F.; et al. Simultaneously Mitigating Near-Term Climate Change and Improving Human Health and Food Security. Science 2012, 335, 183–189. [Google Scholar] [CrossRef]
  52. Liu, P.; Zhao, C.; Zhang, Q.; Deng, Z.; Huang, M.; Ma, X.; Tie, X. Aircraft Study of Aerosol Vertical Distributions over Beijing and Their Optical Properties. Tellus B Chem. Phys. Meteorol. 2009, 61, 756. [Google Scholar] [CrossRef]
  53. Marsli, I.; Diouri, M.; Steli, H.; Salhi, O. Aerosol Type Influences on Air and Climate over the Temperate Areas. Air Qual. Atmos. Health 2022, 15, 1557–1569. [Google Scholar] [CrossRef]
  54. Salim, S.N.; Adhikari, A.; Shaikh, A.A.; Menon, H.B.; Kumar, N.V.P.K.; Rajeev, K. Aerosol-Boundary Layer Dynamics and Its Effect on Aerosol Radiative Forcing and Atmospheric Heating Rate in the Indian Ocean Sector of Southern Ocean. Sci. Total Environ. 2023, 858, 159770. [Google Scholar] [CrossRef] [PubMed]
  55. Christensen, M.; Gettelman, A.; Cermak, J.; Dagan, G.; Diamond, M.; Douglas, A.; Feingold, G.; Glassmeier, F.; Goren, T.; Grosvenor, D.; et al. Opportunistic Experiments to Constrain Aerosol Effective Radiative Forcing. Atmos. Chem. Phys. 2022, 22, 641–674. [Google Scholar] [CrossRef] [PubMed]
  56. Gao, Y.; Zhao, C.; Liu, X.; Zhang, M.; Leung, L.R. WRF-Chem Simulations of Aerosols and Anthropogenic Aerosol Radiative Forcing in East Asia. Atmos. Environ. 2014, 92, 250–266. [Google Scholar] [CrossRef]
  57. Li, F.; Lin, W.; Jiang, B.; Li, J. Investigation of Aerosol Direct Effect over China under El Niño and Its Spatial Distribution Using WRF-Chem. Atmosphere 2020, 12, 58. [Google Scholar] [CrossRef]
  58. Tao, Z.; Braun, S.A.; Shi, J.J.; Chin, M.; Kim, D.; Matsui, T.; Peters-Lidard, C.D. Microphysics and Radiation Effect of Dust on Saharan Air Layer: An HS3 Case Study. Mon. Weather Rev. 2018, 146, 1813–1835. [Google Scholar] [CrossRef]
  59. Wang, P.; Qiao, X.; Zhang, H. Modeling PM2.5 and O3 with Aerosol Feedbacks Using WRF/Chem over the Sichuan Basin, Southwestern China. Chemosphere 2020, 254, 126735. [Google Scholar] [CrossRef]
  60. Karydis, V.A.; Tsimpidi, A.P.; Bacer, S.; Pozzer, A.; Nenes, A.; Lelieveld, J. Global Impact of Mineral Dust on Cloud Droplet Number Concentration. Atmos. Chem. Phys 2016, 17, 5601–5621. [Google Scholar] [CrossRef]
  61. Storelvmo, T. Aerosol Effects on Climate via Mixed-Phase and Ice Clouds. Annu. Rev. Earth Planet. Sci. 2017, 45, 199–222. [Google Scholar] [CrossRef]
  62. Gao, M.; Carmichael, G.R.; Wang, Y.; Saide, P.E.; Yu, M.; Xin, J.; Liu, Z.; Wang, Z. Modeling Study of the 2010 Regional Haze Event in the North China Plain. Atmos. Chem. Phys. 2016, 16, 1673–1691. [Google Scholar] [CrossRef]
  63. Kong, X.; Forkel, R.; Sokhi, R.S.; Suppan, P.; Baklanov, A.; Gauss, M.; Brunner, D.; Barò, R.; Balzarini, A.; Chemel, C.; et al. Analysis of Meteorology–Chemistry Interactions during Air Pollution Episodes Using Online Coupled Models within AQMEII Phase-2. Atmos. Environ. 2015, 115, 527–540. [Google Scholar] [CrossRef]
  64. Yahya, K.; Wang, K.; Zhang, Y.; Kleindienst, T.E. Application of WRF/Chem over North America under the AQMEII Phase 2—Part 2: Evaluation of 2010 Application and Responses of Air Quality and Meteorology–Chemistry Interactions to Changes in Emissions and Meteorology from 2006 to 2010. Geosci. Model Dev. 2015, 8, 2095–2117. [Google Scholar] [CrossRef]
  65. Krishnamurti, T.N. Summer Monsoon Experiment—A Review. Mon. Weather Rev. 1985, 113, 1590–1626. [Google Scholar] [CrossRef]
  66. Li, Z.; Wang, Y.; Guo, J.; Zhao, C.; Cribb, M.C.; Dong, X.; Fan, J.; Gong, D.; Huang, J.; Jiang, M.; et al. East Asian Study of Tropospheric Aerosols and Their Impact on Regional Clouds, Precipitation, and Climate (EAST-AIR CPC). J. Geophys. Res. Atmos. 2019, 124, 13026–13054. [Google Scholar] [CrossRef]
  67. Li, Z.; Lau, W.K.-M.; Ramanathan, V.; Wu, G.; Ding, Y.; Manoj, M.G.; Liu, J.; Qian, Y.; Li, J.; Zhou, T.; et al. Aerosol and Monsoon Climate Interactions over Asia. Rev. Geophys. 2016, 54, 866–929. [Google Scholar] [CrossRef]
  68. Webster, P.J.; Magaña, V.O.; Palmer, T.N.; Shukla, J.; Tomas, R.A.; Yanai, M.; Yasunari, T. Monsoons: Processes, Predictability, and the Prospects for Prediction. J. Geophys. Res. 1998, 103, 14451–14510. [Google Scholar] [CrossRef]
  69. Wang, J.; Wang, S.; Jiang, J.; Ding, A.; Zheng, M.; Zhao, B.; Wong, D.C.; Zhou, W.; Zheng, G.; Wang, L.; et al. Impact of Aerosol–Meteorology Interactions on Fine Particle Pollution during China’s Severe Haze Episode in January 2013. Environ. Res. Lett. 2014, 9, 094002. [Google Scholar] [CrossRef]
  70. Zhang, B.; Wang, Y.; Hao, J. Simulating Aerosol–Radiation–Cloud Feedbacks on Meteorology and Air Quality over Eastern China under Severe Haze Conditionsin Winter. Atmos. Chem. Phys. 2015, 15, 2387–2404. [Google Scholar] [CrossRef]
  71. Herich, H.; Kammermann, L.; Gysel, M.; Weingartner, E.; Baltensperger, U.; Lohmann, U.; Cziczo, D.J. In Situ Determination of Atmospheric Aerosol Composition as a Function of Hygroscopic Growth. J. Geophys. Res. 2008, 113, D16213. [Google Scholar] [CrossRef]
  72. Laj, P.; Bigi, A.; Rose, C.; Andrews, E.; Lund Myhre, C.; Collaud Coen, M.; Lin, Y.; Wiedensohler, A.; Schulz, M.; Ogren, J.A.; et al. A Global Analysis of Climate-Relevant Aerosol Properties Retrieved from the Network of Global Atmosphere Watch (GAW) near-Surface Observatories. Atmos. Meas. Tech. 2020, 13, 4353–4392. [Google Scholar] [CrossRef]
  73. Brennan, J.I.; Kaufman, Y.J.; Koren, I.; Li, R.R. Aerosol-Cloud Interaction-Misclassification of MODIS Clouds in Heavy Aerosol. IEEE Trans. Geosci. Remote Sens. 2005, 43, 911. [Google Scholar] [CrossRef]
  74. Cattani, E.; Costa, M.J.; Torricella, F.; Levizzani, V.; Silva, A.M. Influence of Aerosol Particles from Biomass Burning on Cloud Microphysical Properties and Radiative Forcing. Atmos. Res. 2006, 82, 310–327. [Google Scholar] [CrossRef]
  75. Fajardo-Zambrano, C.M.; Bravo-Aranda, J.A.; Granados-Muñoz, M.J.; Montilla-Rosero, E.; Casquero-Vera, J.A.; Rejano, F.; Castillo, S.; Alados-Arboledas, L. Lidar and Radar Signal Simulation: Stability Assessment of the Aerosol–Cloud Interaction Index. Remote Sens. 2022, 14, 1333. [Google Scholar] [CrossRef]
  76. Junkermann, W.; Hacker, J.M. Ultrafine Particles over Eastern Australia: An Airborne Survey. Tellus B Chem. Phys. Meteorol. 2015, 67, 25308. [Google Scholar] [CrossRef]
  77. Li, J.; Yin, Y.; Li, P.; Li, Z.; Li, R.; Cribb, M.; Dong, Z.; Zhang, F.; Li, J.; Ren, G.; et al. Aircraft Measurements of the Vertical Distribution and Activation Property of Aerosol Particles over the Loess Plateau in China. Atmos. Res. 2015, 155, 73–86. [Google Scholar] [CrossRef]
  78. Chen, D.; Ma, X.; Xie, X.; Wei, P.; Wen, W.; Xu, T.; Yang, N.; Gao, Q.; Shi, H.; Guo, X.; et al. Modelling the Effect of Aerosol Feedbacks on the Regional Meteorology Factors over China. Aerosol Air Qual. Res. 2015, 15, 1559–1579. [Google Scholar] [CrossRef]
  79. Stier, P. Limitations of Passive Remote Sensing to Constrain Global Cloud Condensation Nuclei. Atmos. Chem. Phys. 2016, 16, 6595–6607. [Google Scholar] [CrossRef]
  80. Sharma, A.; Valdes, A.C.F.; Lee, Y. Impact of Wildfires on Meteorology and Air Quality (PM2.5 and O3) over Western United States during September 2017. Atmosphere 2022, 13, 262. [Google Scholar] [CrossRef]
  81. Zhang, X.; Yuan, C.; Zhuang, Z. Exploring the Change in PM2.5 and Ozone Concentrations Caused by Aerosol–Radiation Interactions and Aerosol–Cloud Interactions and the Relationship with Meteorological Factors. Atmosphere 2021, 12, 1585. [Google Scholar] [CrossRef]
  82. Ramanathan, V.; Chung, C.; Kim, D.; Bettge, T.; Buja, L.; Kiehl, J.T.; Washington, W.M.; Fu, Q.; Sikka, D.R.; Wild, M. Atmospheric Brown Clouds: Impacts on South Asian Climate and Hydrological Cycle. Proc. Natl. Acad. Sci. USA 2005, 102, 5326–5333. [Google Scholar] [CrossRef]
  83. Menon, S.; Hansen, J.; Nazarenko, L.; Luo, Y. Climate Effects of Black Carbon Aerosols in China and India. Science 2002, 297, 2250–2253. [Google Scholar] [CrossRef]
  84. Vinoj, V.; Rasch, P.J.; Wang, H.; Yoon, J.-H.; Ma, P.-L.; Landu, K.; Singh, B. Short-Term Modulation of Indian Summer Monsoon Rainfall by West Asian Dust. Nat. Geosci. 2014, 7, 308–313. [Google Scholar] [CrossRef]
  85. Wang, C.; Kim, D.; Ekman, A.M.L.; Barth, M.C.; Rasch, P.J. Impact of Anthropogenic Aerosols on Indian Summer Monsoon. Geophys. Res. Lett. 2009, 36, L21704. [Google Scholar] [CrossRef]
  86. Lau, K.M.; Kim, M.K.; Kim, K.M. Asian Summer Monsoon Anomalies Induced by Aerosol Direct Forcing: The Role of the Tibetan Plateau. Clim. Dyn. 2006, 26, 855–864. [Google Scholar] [CrossRef]
  87. Ramanathan, V.; Feng, Y. Air Pollution, Greenhouse Gases and Climate Change: Global and Regional Perspectives. Atmos. Environ. 2009, 43, 37–50. [Google Scholar] [CrossRef]
Figure 1. Data-filtration processing and results. (a) Details of the data filtration process. (b) Document type percentage of all 3552 results identified in the research of ARI and ACI.
Atmosphere 15 01189 g001
Figure 2. Publications and citations related to ARI and ACI in the WoSCC database.
Atmosphere 15 01189 g002
Figure 3. Top 15 countries (a) and institutions (b) in terms of ARI and ACI research publications and average citations per publication (see Table S1 for full name).
Atmosphere 15 01189 g003
Figure 4. The co-authorship network map of the top 15 countries with publications related to ARI and ACI.
Atmosphere 15 01189 g004
Figure 5. Top 20 journals (a) and authors (b) in terms of ARI and ACI research publications between 1999 and 2023 (see Table S2 for full journal names, impact factors, and JCR quartiles, and Table S3 for full author names, H-Index, and average citations).
Atmosphere 15 01189 g005
Figure 6. The co-authorship network map of the top 20 authors with publications related to ARI and ACI.
Atmosphere 15 01189 g006
Figure 7. Co-occurrence author keywords network map weighted by occurrence more than 10 times (a) and average emerging time of them (b).
Atmosphere 15 01189 g007
Figure 8. Selection of terms in the bibliometric map (a) aerosol optical depth, (b) black carbon, (c) aerosols, (d) cloud condensation nuclei, and (e) aerosol-cloud-radiation interactions.
Atmosphere 15 01189 g008
Figure 9. Trend factors for the top 20 keywords sorted by normalized cumulative keyword frequency in four research groups of ARI and ACI: (a) properties, (b) types, (c) methods, and (d) impacts.
Atmosphere 15 01189 g009
Table 1. The 10 most co-cited references.
TitleReferenceJournalPublished YearCitations
1Aerosols, Cloud Microphysics, and Fractional Cloudiness[5]Science1989595
2AERONET—A Federated Instrument Network and Data Archive for Aerosol Characterization[38]Remote Sensing of Environment1998558
3The Influence of Pollution on the Shortwave Albedo of Clouds[7]Journal of the Atmospheric Sciences1977509
4Optical Properties of Aerosols and Clouds: The Software Package OPAC[40]Bulletin of the American Meteorological Society1998366
5Variability of Absorption and Optical Properties of Key Aerosol Types Observed in Worldwide Locations[42]Journal of the Atmospheric Sciences2002316
6SBDART: A Research and Teaching Software Tool for Plane-Parallel Radiative Transfer in the Earth’s Atmosphere[41]Bulletin of the American Meteorological Society1998316
7Aerosols, Climate, and the Hydrological Cycle[43]Science2001302
8Climate Forcing by Anthropogenic Aerosols[3]Science1992285
9The MODIS Aerosol Algorithm, Products, and Validation[39]Journal of the Atmospheric Sciences2005277
10Pollution and the planetary albedo[37]Atmospheric Environment1974268
Disclaimer/Publisher’s Note: The statements, opinions and data contained in all publications are solely those of the individual author(s) and contributor(s) and not of MDPI and/or the editor(s). MDPI and/or the editor(s) disclaim responsibility for any injury to people or property resulting from any ideas, methods, instructions or products referred to in the content.

