Article

Comparative Analysis of Grass Pollen Dynamics in Urban and Rural Ireland: Identifying Key Sources and Optimizing Prediction Models

by
Moisés Martínez-Bracero
1,2,*,
Andrés M. Pélez-Vereira
3,
Emma Markey
4,
Jerry Hourihane Clancy
4,
Roland Sarda-Estève
5 and
David J. O’Connor
4
1
Department of Botany, Ecology and Plant Physiology, Córdoba University, 14071 Córdoba, Spain
2
Instituto Interuniversitario de Investigación del Sistema Tierra en Andalucía (IISTA), Córdoba University, 14071 Córdoba, Spain
3
Departamento de Ingeniería Mecánica, Facultad de Ingeniería, Universidad de Tarapacá, Arica 9170016, Chile
4
School of Chemical Sciences, Dublin City University, D09 E432 Dublin, Ireland
5
Laboratoire des Sciences du Climat et de l’Environnement (LSCE), CNRS-CEA-UVSQ, 91191 Saint-Aubin, France
*
Author to whom correspondence should be addressed.
Atmosphere 2024, 15(10), 1198; https://doi.org/10.3390/atmos15101198
Submission received: 18 September 2024 / Revised: 4 October 2024 / Accepted: 6 October 2024 / Published: 8 October 2024
(This article belongs to the Special Issue Atmospheric Bioaerosols: Detection, Characterization and Modelling)

Abstract

:
The Poaceae family, one of the most diverse and widespread angiosperms, is prevalent in various natural and urban environments and is a major cause of allergies, affecting over 20% of the population in Europe, specifically in Ireland. With extensive grasslands, Ireland supports numerous grass species, though pollen release varies due to the family’s complexity. The Hirst spore-trap is commonly used to sample airborne pollen, but the area of influence is debated and may differ by pollen type. This study compares grass pollen seasons between rural Carlow and urban Dublin, aiming to create forecast models for airborne pollen and identify key grass areas influencing the main pollen season (MPS). Two Hirst samplers were analyzed, using data up to 2020, and two threshold models (based on Swedish and Danish studies) were tested to find the best fit for Ireland. Airmass footprints were calculated using Hysplit and combined with grassland data to pinpoint major pollen sources. The results showed that Carlow had higher pollen concentrations but shorter seasons than Dublin. The Swedish threshold method was the most accurate for Ireland, with the Wicklow Mountains identified as a significant pollen source. These findings improve the understanding of pollen dynamics and support better public health and allergy management.

Graphical Abstract

1. Introduction

The Poaceae family, comprising approximately 10,000 species, ranks as the fifth largest plant family globally, boasting a widespread distribution [1]. Poaceae pollen is a major cause of pollinosis in humans, leading to an allergic response in more than 35% of the European population [2,3,4], with 23% of rhinitis patients in Ireland testing positive for grass pollen allergies [5]. While the impact of allergy has been well documented and studied in other countries, far less work has been undertaken in Ireland. Most studies have focused on shorter campaigns focused on fungal spores [6,7,8,9] or on locations with potentially high concentrations [10,11]. Work on primary biological aerosol particles (PBAPs) previously performed in Ireland has shown the importance of Poaceae pollen as being the pollen type in the country, with the annual concentrations representing between 30 and 70% of the total pollen observed [12,13].
The Poaceae pollen season is complex as it represents the flowering period of a variety of species within this pollen type [14,15]. As a result, the magnitude of the Poaceae pollen season is largely driven by local vegetation and land use [16,17]. Likewise, climate variables strongly influence the reproductive development of grass species, determining pollen emission patterns [2,18,19,20]. Temperature plays a key role in the regulation of flowering periods in herbaceous species such as temperate grasses, although other variables—including photoperiod and rainfall—are also involved [21,22,23]. However, physiological and biological differences between species may give rise to different responses to given environmental stimuli [4]. High temperatures during anthesis favor anther dehiscence and thus increase pollen release into the atmosphere [24,25].
The most representative land cover radius directly influencing the airborne grass pollen concentration being collected via Hirst trap monitoring is still being debated. Previous observations using a Hirst trap over 10 m a.g.l (above ground level) have shown recorded concentrations to be representative of a 30 km area [26,27,28], while others have shown that the immediate 100 m area is the most representative [17,29]. Additionally, differences in grass pollen concentrations have been well studied, showing clear variation depending on location and environmental condition, such as in Berlin (Germany) [30], Helsinki (Findland) [31], central Spain [32], Portugal [33], Melbourne (Australia) [34], Soth Korea [35] and, more recently, between urban and rural areas [17]. The ability to use forecast models for the prediction of future concentrations of major allergens has been noted as an important endeavor showing the importance of meteorological parameters and land use for the grass pollen concentration [14,15,36,37]. Those models mainly used the meteorological parameters and the land uses of the surrounding areas.
The main aim of the present study is to create forecast models for airborne pollen and identify key grass areas influencing the main pollen season. With that in mind, different threshold models were used in order to select the best one and the airmass trajectories for the complete pollen season as well as daily peaks.
This study is the first modelling for Irish grass pollen, while based on previous studies, different methods have been merged for a better knowledge of the causes of the grass pollen concentrations in rural and urban areas.

2. Materials and Methods

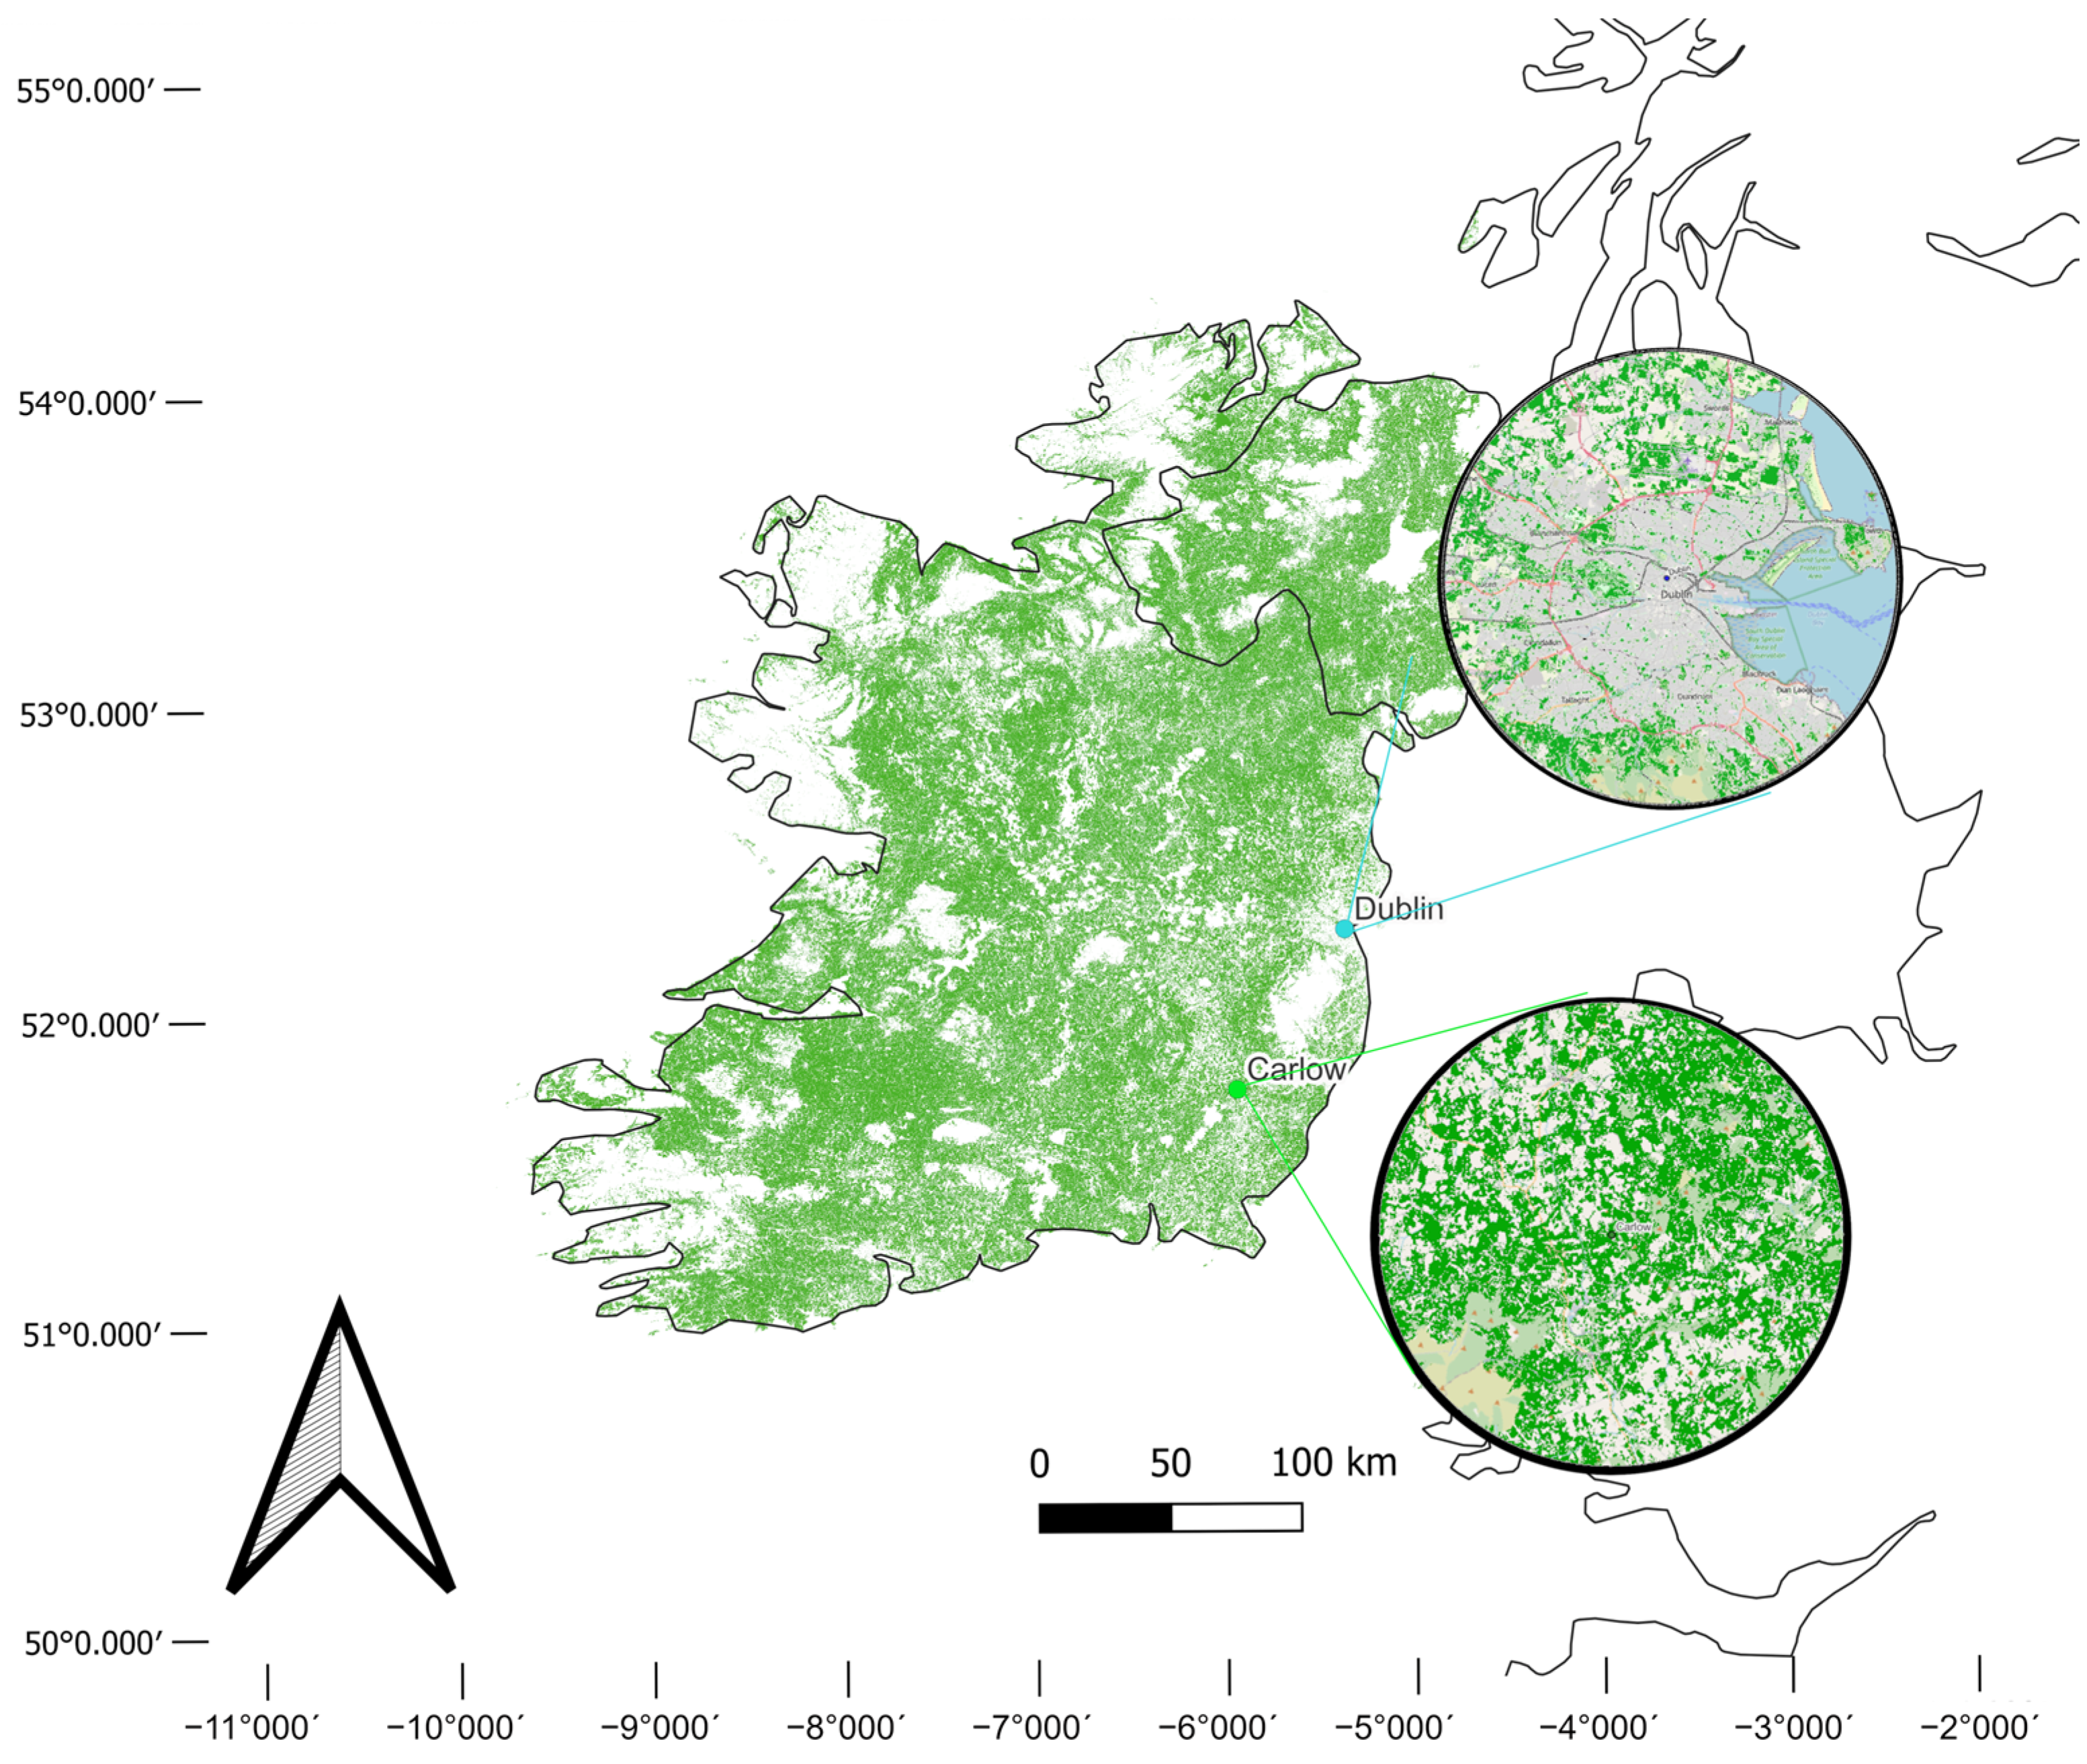
2.1. Study Area and Aerobiological Database
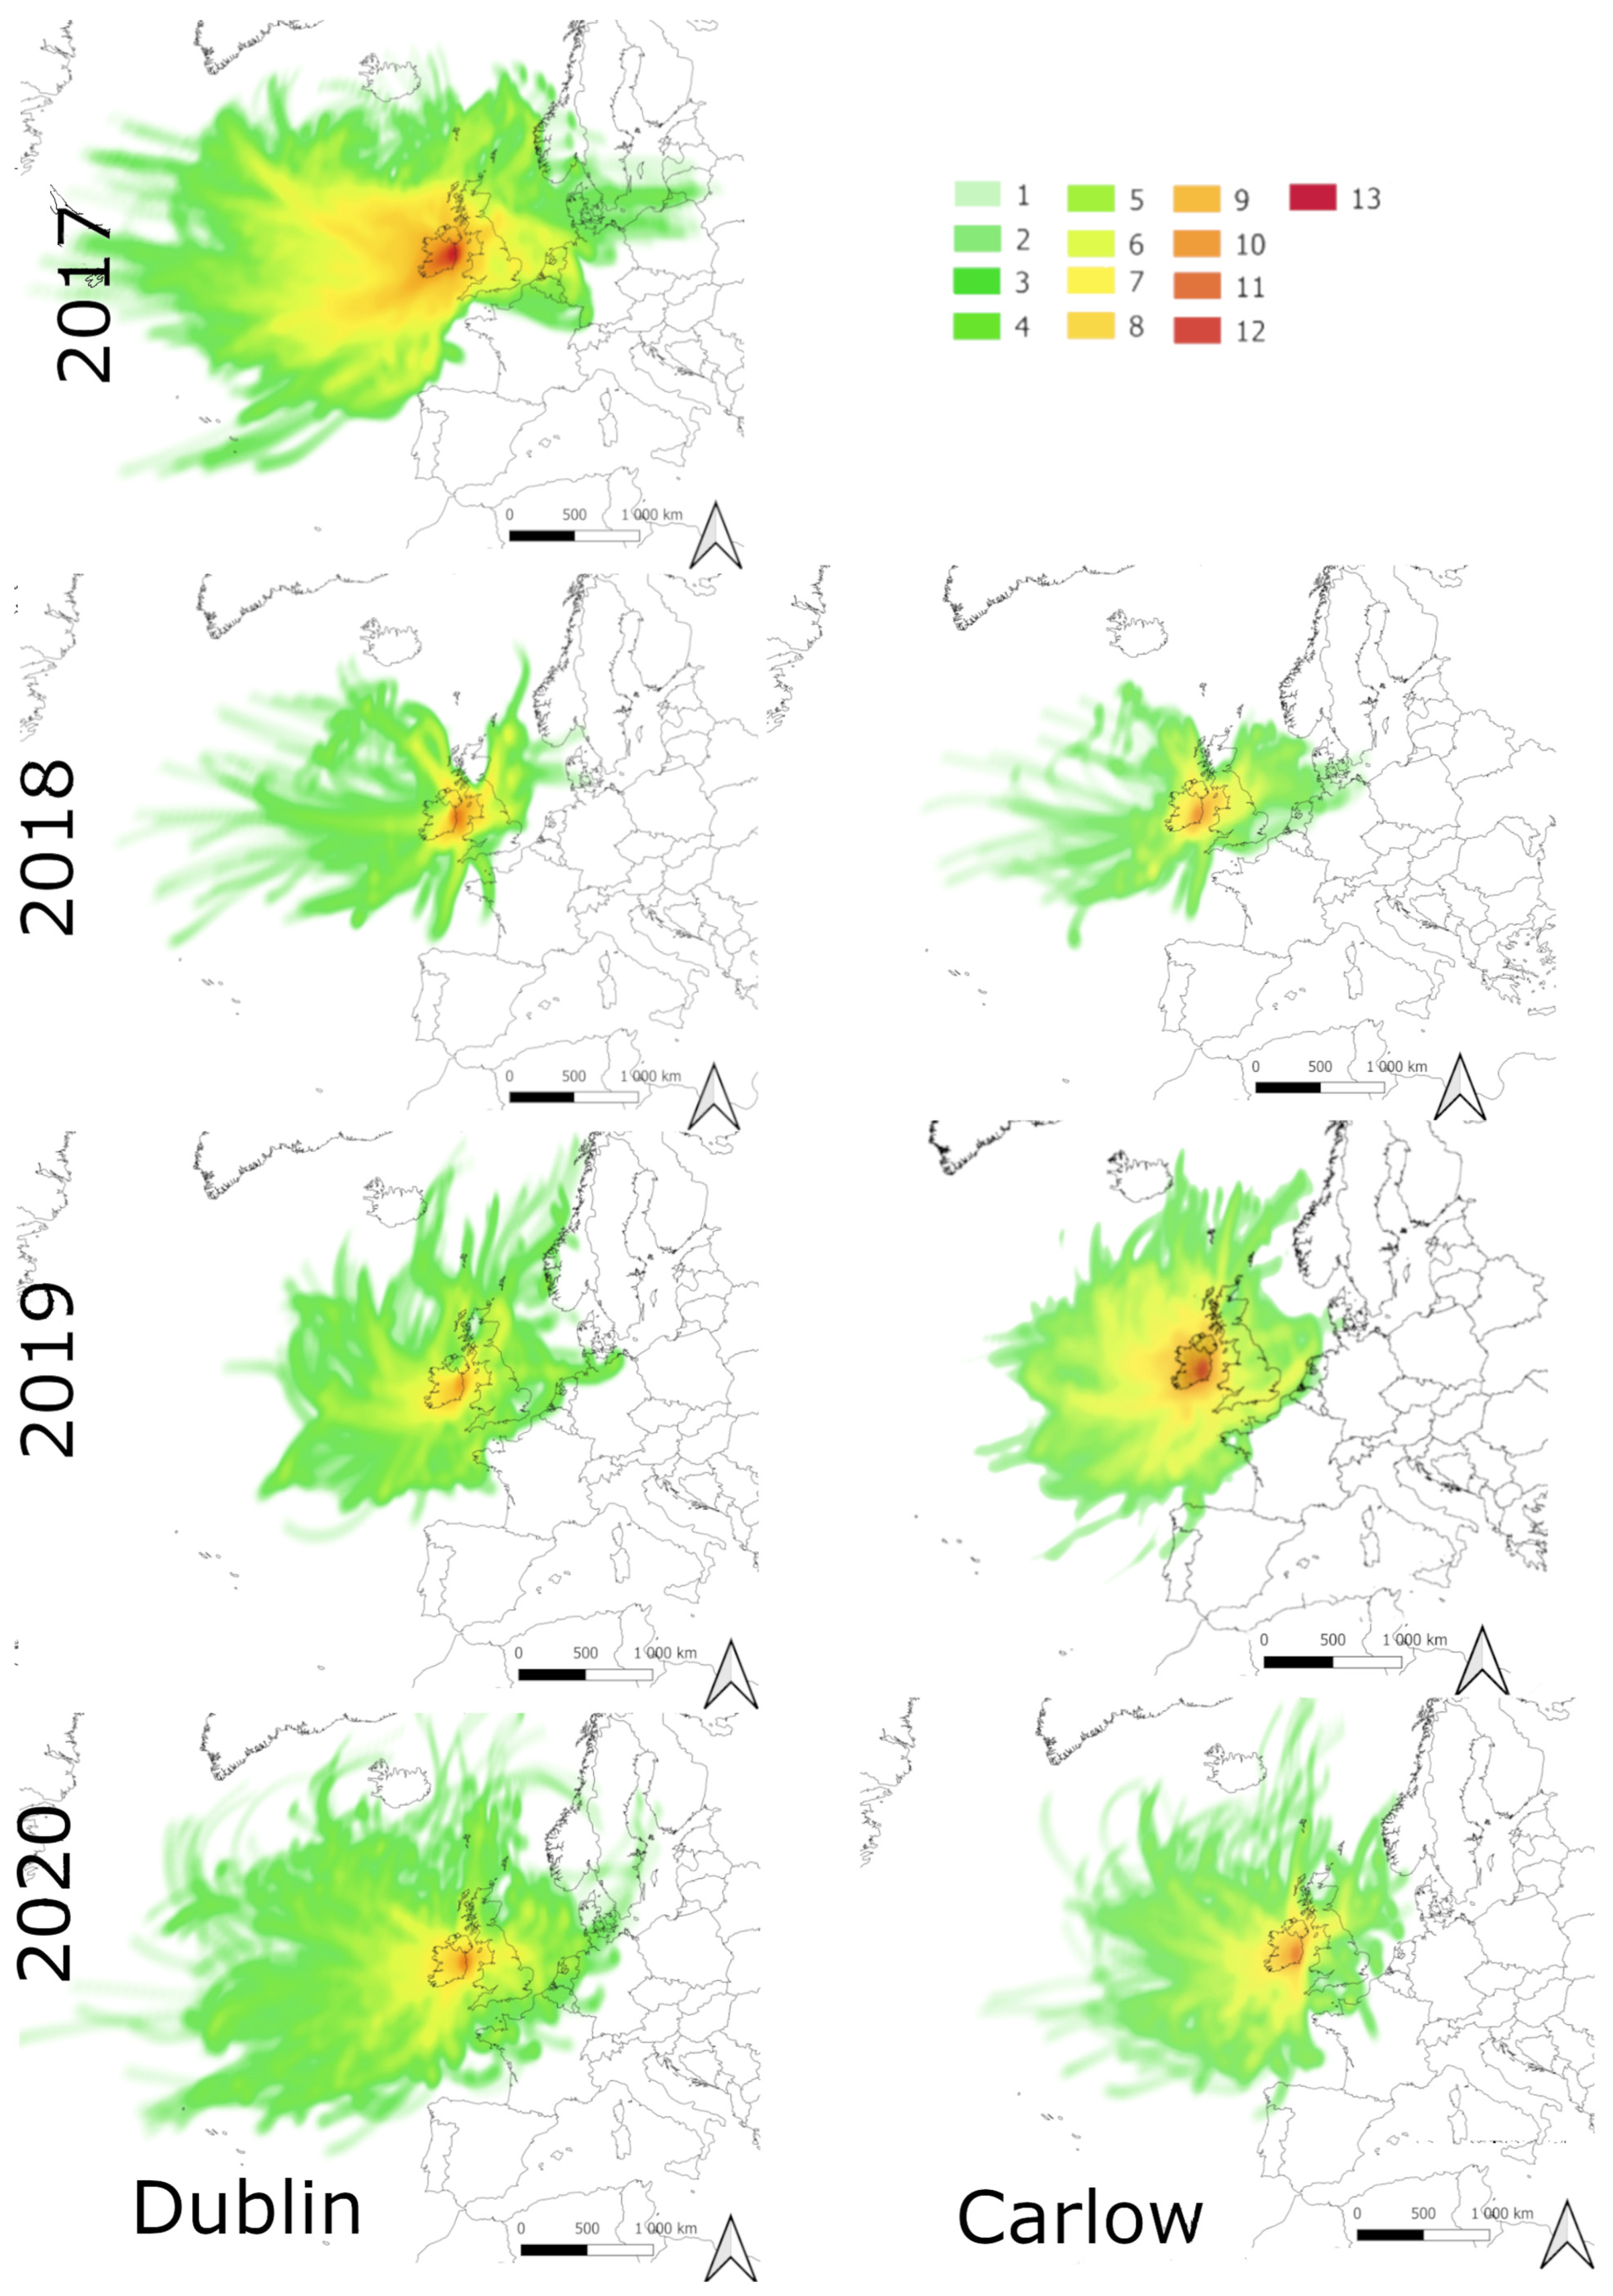
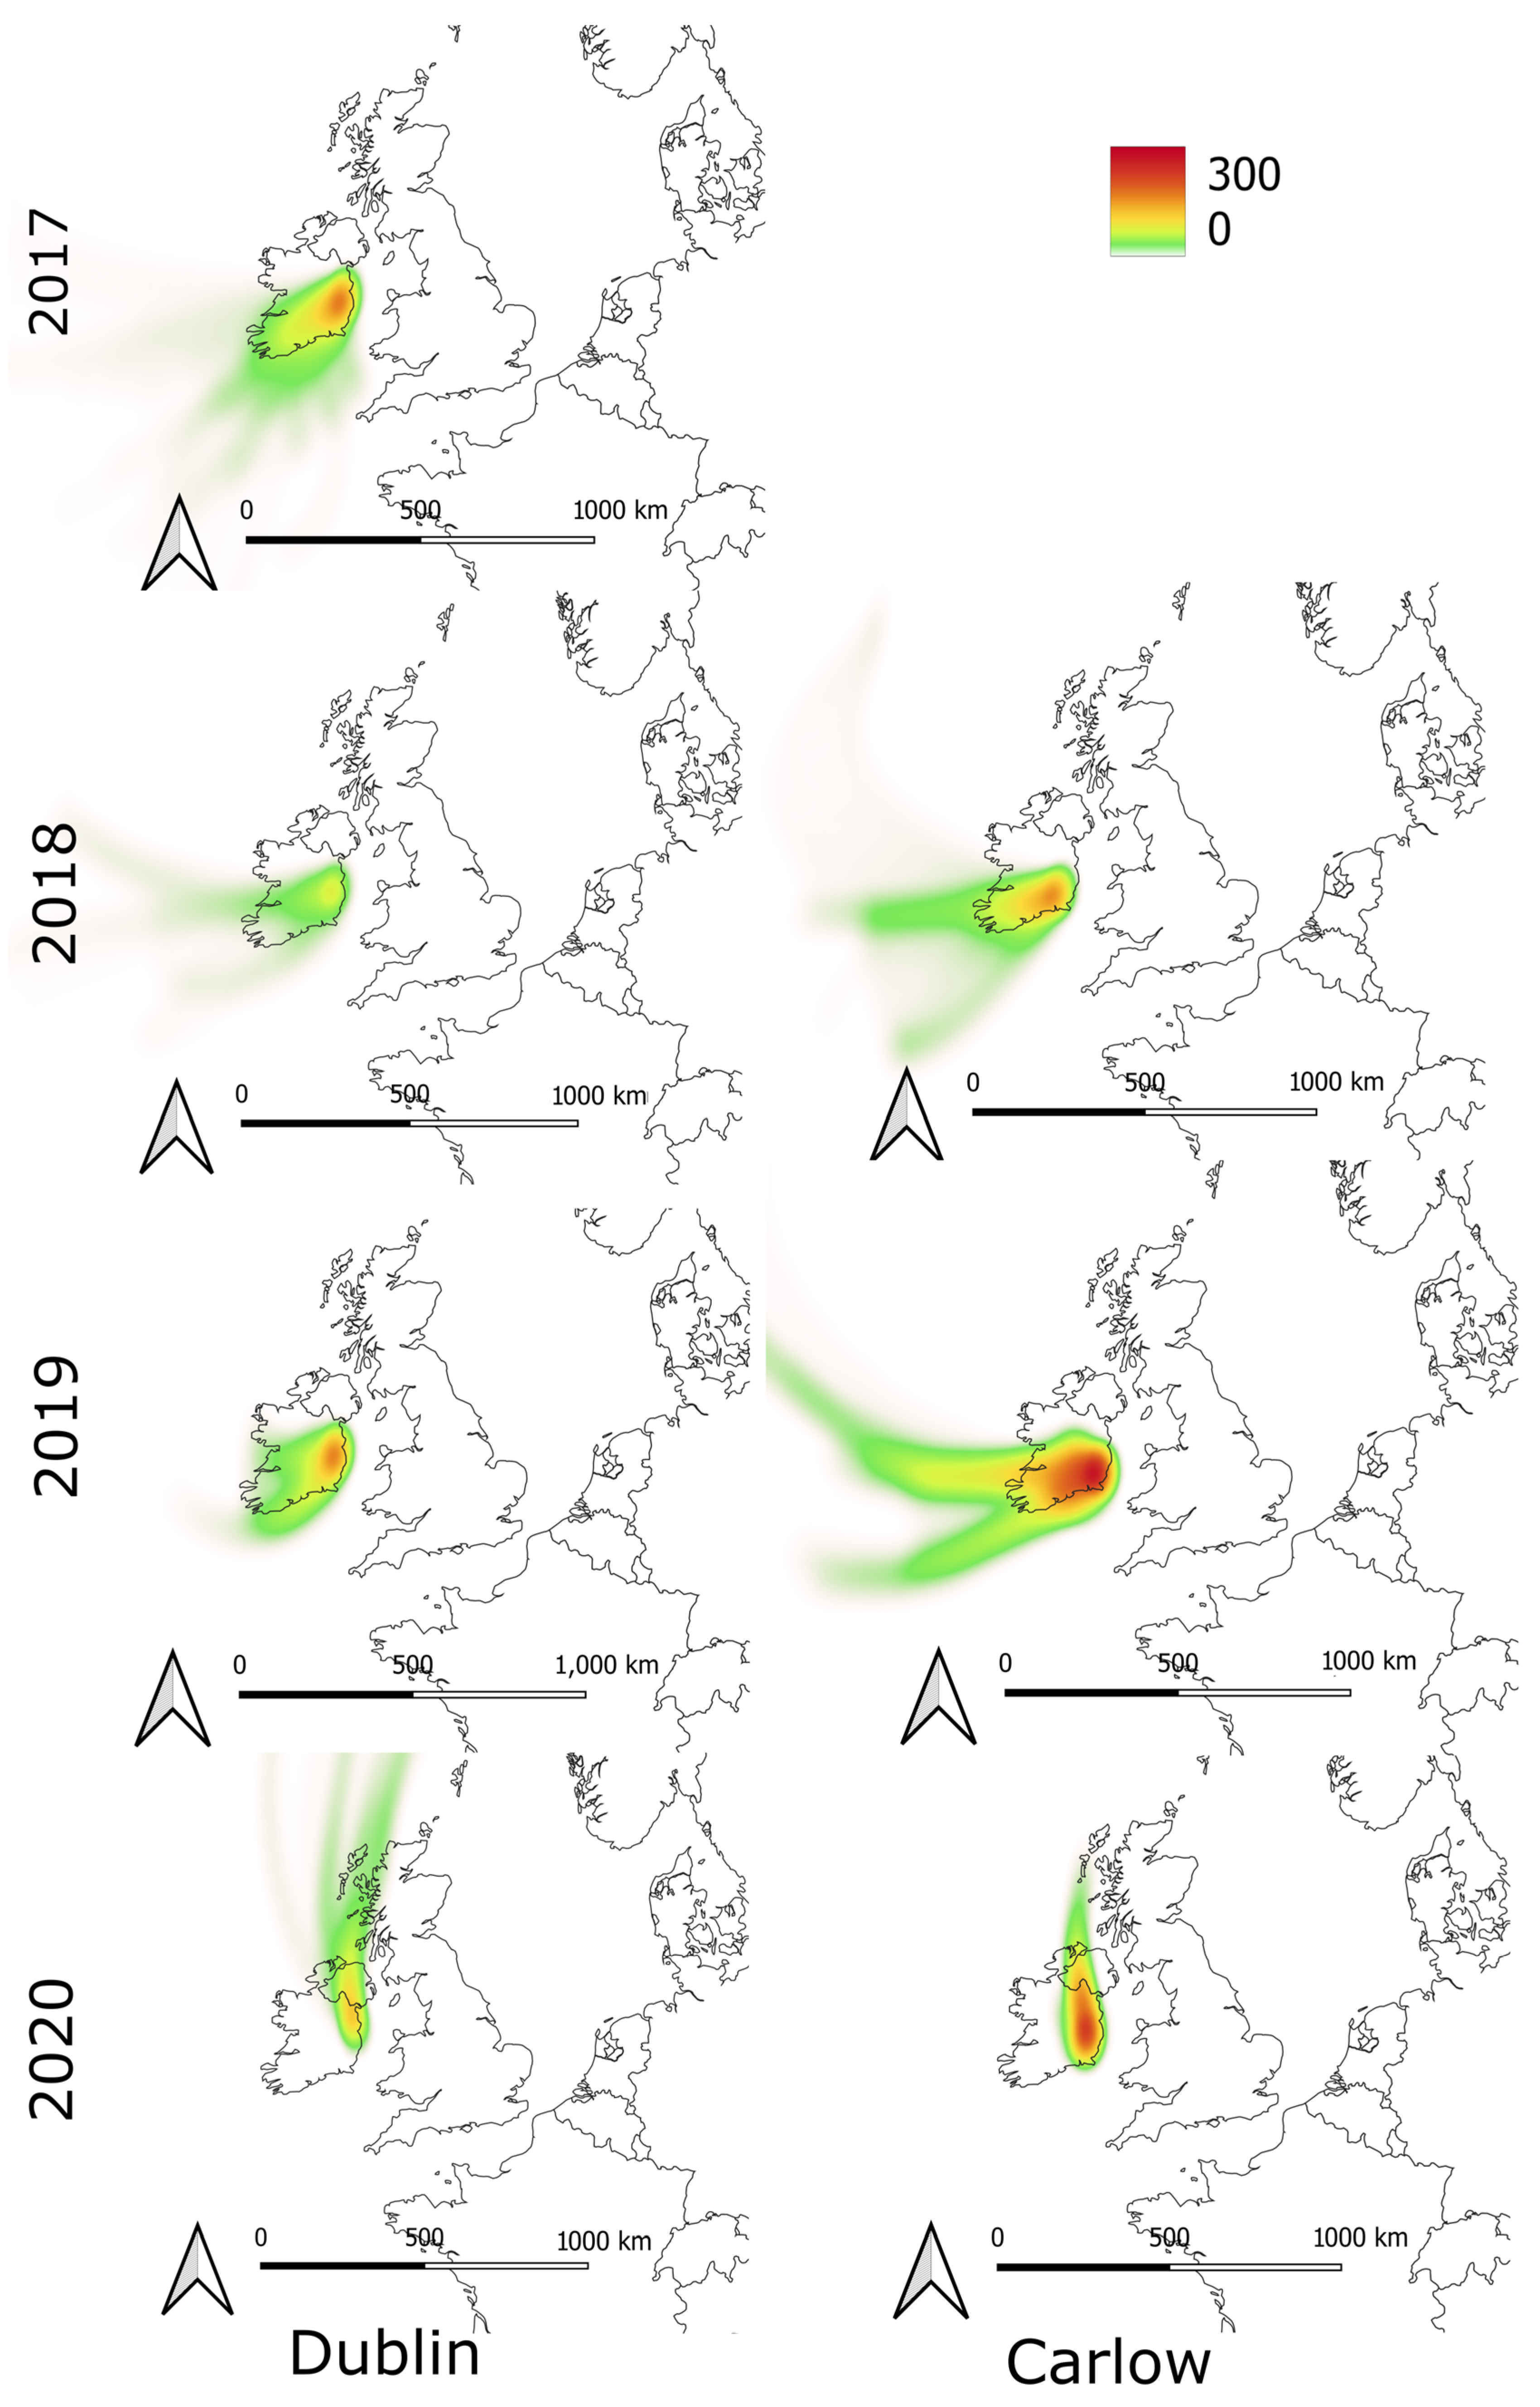
Airborne pollen concentrations were monitored from April to December in Carlow (2018–2020, 58% daily and hourly data available) and Dublin (2017–2020, 72.2% daily and hourly data available). The grassland area surrounding each site was obtained from the high-resolution layer (HRL) grassland from Copernicus [38] with a 10 m resolution, and the area around each sampling point was calculated for a 10 km and 30 km radius (Figure 1). The surveyed region possesses a cool temperate oceanic climate. Dublin has a yearly average temperature of 9.8 °C with an absolute minimum of −3.1 °C and a maximum of 28.7 °C. Precipitation is, on average, 758 mm (yearly). In contrast to this, Carlow has a yearly average temperature of 13.8 °C with an absolute minimum of −3.3 °C and a maximum of 31.4 °C. A higher average yearly rainfall of 857.4 mm is noted [39].
The grasslands in Ireland are predominantly used as animal pasture, and semi-natural grasslands exist as isolated fragments within an intensively farmed landscape. The country can be considered flat, with low central plains and some mountainous areas (the Wicklow Mountains are situated to the south of Dublin, northeast of Carlow).
Pollen monitoring was carried out using two Hirst-type samplers [40], following the EAS minimum recommendations [41]. Pollen season’s start and end dates were defined, respectively, as the first and last day on which 5 pollen grains/m3 were recorded with 3 following or previous days recording 5 or more pollen grains/m3 [18]. Pollen season descriptors and intra-diurnal comparisons were obtained using the Aerobiology package in R [42,43]. Due to differences in the intra-diurnal patterns during the pollen season, daily descriptors were calculated for the peak day of each year to provide the highest concentration pattern per site.

2.2. Footprints

The airmass footprints recorded in Dublin during the MPS were determined by using the HYSPLIT backward Lagrangian dispersion modelling method [44]. The footprints for grass pollen were calculated for the full pollen season and the peak day of every season separately. The total pollen season footprint was used to describe the main source areas during the MPS. All peak day footprints were merged and compared with grassland maps to find Ireland’s most important source areas [38].

2.3. Regression Trees

Grass pollen concentration predictions were made by utilizing regression trees based on daily threshold concentrations. Two sets of concentration thresholds, previously established by Becker et al., [45] were used (Table 1). The predictors that were used included maximum and minimum temperature (Tmax and Tmin, respectively), precipitation events (same day and 1, 2 and 3 days before expressed as Rn, Rnlag1, Rnlag2 and Rnlag3), relative humidity (Hm) and wind speed (Wspd). The models operate as a binary function to predict the occurrence of the pollen concentration threshold. This is determined by calculating the percentage of times in which the modelled threshold is exceeded in the database (over threshold fraction, OTF) as the criterion value of the binary response. This was used in place of the usual 0.5 value, following the method proposed by Real [46] and Vélez-Pereira [47]. The performance of each model was evaluated by determining sensitivity and specificity parameters, as previously discussed by De Linares [48] and Vélez-Pereira [49]. While sensitivity is the percentage of true positives concerning the sum of observed positives and specificity is the percentage of true negatives with respect to the sum of observed negatives, these parameters were used as it was reported that cross-validation of aerobiological data was not reliable due to high annual non-null days in the database.
The conceptual simplicity of the regression tree gives it a greater advantage since it facilitates its interpretation, being a powerful and intuitive tool for the development of models in various areas of knowledge. Mathematically, the regression tree is usually represented as the following:
x = m = 1 M c m I x R m
where cm is the constant m in the regression region R, x is the predictive variable that is used to split the observation into n observations, and Rm is the m homogeneity region obtained in the n set observations that respond to constant regression cm.

3. Results

At both locations, the main pollen season started in May and ended during July/August, with the earliest initiation on the 6th of May and the latest ending on the 31st of August (Table 2). The peak day varied between the 7th and 20th of June, with the highest seasonal pollen integral (SPIn) and peak daily pollen concentrations (pk.con) being found in Carlow. In general, the pollen season can be divided into short pre-peak (ln.prpk) and longer post-peak periods (ln.pspk); however, in 2018 in Dublin, the pre-peak length was longer than the post-peak (Table 2). Dublin pollen concentrations tended to increase quickly during the pre-peak, which lasted less than 20 days in the majority of the years; post-peak concentrations were maintained for up to 85 days (Table 2 and Figure 2). Carlow pollen concentrations tended to increase gradually during the pollen season’s pre-peak period, lasting between 23 and 39 days (ln.prpk), before decreasing quickly after the peak (Figure 2).
The grassland presence around the Hirst trap in each area differs. Dublin has 14.54% of the 10 km area covered by grasses, which increases to 27.25% when calculating the grass surface area for a 30 km radius circumference. On the other hand, in Carlow, the grass surface area varies from 57.82% to 57.00% for the 10 km and 30 km radius circumferences, respectively.
Longer pollen seasons and higher SPIns were found during 2019 in both locations; however, more “Very high” concentration days (higher than 100 pollen grains by m3) were found in Carlow during 2020 (Table 2).
Intra-diurnal patterns during peak days show that a higher percentage of pollen grains were recorded before noon (5:00 to 12:00 h) in Carlow. On the other hand, the highest concentrations in Dublin were recorded during the evening (15:00 to 04:00 h) (Figure 3).

3.1. Footprints

The airmass footprints during the grass MPS (Figure 4) show that the air masses arriving at the sampling site originated from the ocean during the MPS. Taking into account the percentage of the time air masses spend over the ground, the air masses influencing the locations spend the majority of their time within Ireland (68% and 73% in Dublin and Carlow, respectively) and spend less time in the UK (26% and 25% in Dublin and Carlow, respectively). Due to the MPS duration (between 51 and 97 days, Table 2), the footprints do not show a predominant direction.
The footprints for peak days show a different profile than the MPS ones (maximum airmass presence numbers vary greatly due to the different time study lengths, between 51 and 100 days in Figure 4 and 1 day in Figure 5). As one might expect, the amount of time that the air masses spend inland was related to the peak concentration days. Notably, in years when air masses were centered close to or over the sampling sites, the concentrations were higher. Examples of this are 2017 and 2019 in Dublin and 2019 in Carlow (Figure 5 and Table 2).
Peak days were used to find the most important grass pollen source areas. The results show that air originated from the south of Ireland during the peak days. The region with the highest probability of being a main source of grass pollen is the Wicklow Mountains National Park, geographically closer to Carlow than Dublin (Figure 6).

3.2. Decision Trees

Table 3 presents the performance results of two models, the “Swedish Threshold Model” and the “Danish Threshold Model,” used to predict grass pollen concentration thresholds at two sampling locations, Dublin and Carlow. The models were evaluated using key performance metrics, including over threshold fraction (OTF), sensitivity, specificity and positive likelihood ratio (PLR). The OTF values, indicating the proportion of time that the concentration thresholds were exceeded during the main pollen season, were generally higher in Carlow than in Dublin. For instance, Carlow had an OTF of 0.624 for the “Low” threshold using the Swedish model compared to 0.539 for Dublin, reflecting a greater frequency of days with higher pollen concentrations in the rural area.
In terms of sensitivity, which measures the ability to correctly identify days when pollen concentrations exceed the threshold, the Swedish model achieved a sensitivity of 0.79 for the “Low” threshold in both Dublin and Carlow, indicating a good performance for detecting days with low pollen concentrations. However, the sensitivity was generally lower for higher thresholds; for example, the sensitivity dropped to 0.357 and 0.447 for the “High” threshold in Dublin and Carlow, respectively, under the Swedish model. The Danish model showed lower sensitivity values overall, particularly at the “Very High” threshold, where it achieved 0.8 in Dublin compared to 0.917 with the Swedish model in Carlow.
Specificity, which assesses the ability to correctly identify days when pollen concentrations do not exceed the threshold, was higher at the “Medium” and “High” thresholds for both models. For example, the specificity for the “Medium” threshold was 0.862 in Dublin using the Swedish model, while in Carlow, it reached 0.861. In contrast, the Danish model recorded a specificity of 0.784 for the “Medium” threshold in Dublin and 0.816 in Carlow. The PLR, balancing sensitivity and specificity, was highest for the Swedish model at the “Low” threshold, with a value of 4.94 for both Dublin and Carlow, suggesting that this model was particularly effective at predicting days with lower pollen concentrations. Overall, the Swedish model consistently outperformed the Danish model across most thresholds, particularly for the “Low” and “Very High” concentrations, demonstrating its greater suitability for predicting grass pollen concentrations in the Irish context.
Table 4 provides an overview of the most important descriptors used in the decision trees for predicting grass pollen concentrations at two sites, Dublin (DB) and Carlow (CW), under both the Swedish (Sw) and Danish (De) threshold models. The table identifies the key variables, or “nodes,” that influence the prediction of pollen concentration levels (“Low”, “Medium”, “High” and “Very High”) for each model.
For both Dublin and Carlow, temperature was found to be the most critical factor influencing grass pollen concentration levels, consistently appearing as the first node in the decision trees across all thresholds. For instance, in the Swedish model, maximum temperature (maxtp) was the primary descriptor for predicting “Low” concentrations in Dublin, with a split value of 13.9 °C, and it remained crucial for higher thresholds as well, with splits at 16.3 °C, 18.3 °C and 16.4 °C for “Medium”, “High” and “Very High” levels, respectively. Similarly, in Carlow, maximum temperature was a key factor for the “Low” threshold, with a split at 13.6 °C, and for the “Very High” level, with a split at 26.7 °C, indicating that higher temperatures are associated with elevated pollen concentrations.
Wind speed (wsp) also emerged as an important factor, particularly for higher concentration levels. In Dublin, wind speeds lower than 6.5 knots (3.36 m/s or 12 km/h) were associated with “Very High” pollen levels in the Swedish model, while in Carlow, wind speeds greater than 3.95 knots (2,03 m/s or 7,31 km/h) were linked to “Very High” concentrations regardless of the model used. This suggests that moderate wind speeds facilitate pollen dispersal, contributing to higher concentrations.
Precipitation played a nuanced role in the models. For Dublin, the Swedish model indicated that lower rainfall amounts (below 0.45 mm) were associated with “Medium” levels, while higher precipitation on previous days was relevant for “Low” concentrations. Conversely, in Carlow, lower precipitation levels were found to be significant for all thresholds, particularly for “Low” concentrations, where rainfall in the preceding days (below 2.16 mm) was a key predictor.
Overall, Table 4 highlights the complexity of meteorological influences on pollen concentrations. While temperature consistently emerged as the most influential factor, the importance of other variables, such as wind speed and precipitation, varied between thresholds and locations.
On the other hand, while varying levels of meteorological parameters were chosen as nodes for each decision tree, all factors affected those trees built differently. Minimum and maximum temperatures were found to be the most important parameters for all the trees, decreasing their importance in “Medium” and “High” thresholds (Figure 7).

4. Discussion

Poaceae MPS started by the end of May, similar to previous studies in other northern European countries, such as the UK [17], Germany [50,51], Poland [52], Portugal [33] or northern Spain [53]. However, the Poaceae MPSs have been noted to occur later than in lower latitudes, such as in southern Spain where it starts during March [22,32] or Melbourne where it occurs in September (spring start) [34], while the end of the pollen season occurred earlier in other zones than in the present study, like in Morocco where the grass pollen season is generally finished by May [54] or Italy where it ends by July [55]. Pollen concentrations were higher at the rural site (Carlow) than the urban site (Dublin), as found in previous pollen studies in Dublin [12] and coinciding with the results of earlier studies in other areas [16,51,52]. This can be attributed to a higher grass source area around Carlow, calculated from the Copernicus grassland dataset. However, most of the grass area is used as pasture; natural/naturalized areas are the most important zones for pollen emission as the plants have a higher possibility of flowering. The importance of the Wicklow Mountains Natural Park not only lies in the flowering but also in that the pollen grains produced in the mountains contribute greatly to the pollen concentrations, as found in previous studies [2].
Generally, grass pollen concentrations were low during the start of the season, slowly increased before suddenly peaking and then slowly decreased again to background levels [32,56,57]. These results match with the Carlow MPS season concentrations evolution but not so with Dublin, where the concentrations increase rapidly after the start of the pollen season. This could be indicative of the distance to the source area [58], but some studies comparing rural and urban areas did not find those differences [52,59].
Intra-diurnal patterns for the pollen peaks (shown in Figure 3) illustrate a significant difference between the sampling areas; while the rural site shows a predominant increase in concentrations during mid-day, further corroborating previous studies [52,60], Dublin illustrates an afternoon–evening peak similar to those found in other urban areas [51]. The intra-diurnal concentrations vary throughout the year due to the different plant species contributing to this pollen type [15,61]; for this reason, including only peak days provided a better estimation of the type of plants affecting each area.
The number of species included in the Poaceae family increases the pollen season length as each one has a different flowering period. This has caused a more circular footprint pattern in comparison to other pollen types in Ireland such as Betula [36]. However, the dispersion of grass pollen is limited, generally not travelling long distances [17]. Merged grass source areas have shown that the Wicklow Mountains Natural Park represents the most prominent area of grass pollen origin for both sites. This area matches the previous dispersion patterns, which were closer to the rural site than the urban site [17]. Grasses growing at higher altitudes can be dispersed more efficiently as was found in the literature where the majority of the pollen grains were related to the grass flowering in mountainous regions [19]. The effect of temperature on airborne grass pollen has been previously described [2,17,20,22]; however, rainfall has a complicated relationship with airborne pollen, as high amounts of rainfall will decrease the concentrations. Values of rain over 5 mm have been cited noting this [62], but the rainfall in the days previous may increase plant biomass [22], leading to additional pollen release. The rainfall importance varies between both sites, as higher rainfall is observed for the lower threshold in Dublin, but in Carlow, lower precipitation is the most important factor for the lower threshold. The connection between wind patterns and pollen transport, as highlighted by Frisk et al. [17] and Maya-Manzano et al. [63], underscores the significance of incorporating wind data into predictive models. By integrating wind dynamics into these models, valuable insights about pollen dispersion across different locations were gained. This is particularly relevant for identifying peak footprint areas as pollen sources.
Decision trees serve as a crucial tool in this process by helping elucidate the relationship between various factors, such as wind patterns and pollen distribution. By analyzing decision trees, researchers can pinpoint the most influential sources of pollen (peak footprint areas), particularly from grasses. The differences in the decision tree nodes between Dublin and Carlow suggest that local environmental conditions, including urban versus rural settings, affect the way these factors interact to influence pollen levels, pointing to the importance of considering multiple meteorological variables when developing predictive models for grass pollen concentrations, especially in diverse geographic and climatic contexts. This information is essential for understanding allergen exposure and can aid in developing strategies for mitigating allergic reactions in vulnerable populations.
While temperature exerted the greatest influence on the reproductive development of grasses, it was by no means the only influential variable; others included relative humidity or rainfall, also displaying year-on-year variations, as has been proven by previous studies [20].
The overall performance of the models used to predict grass pollen concentrations, as discussed in Table 3 and Table 4, indicates that the Swedish Threshold Model generally outperforms the Danish Threshold Model in both Dublin and Carlow across multiple concentration thresholds. The Swedish model exhibited higher sensitivity, particularly for the “Low” and “Very High” thresholds, demonstrating its better ability to correctly identify days when pollen concentrations exceed these levels. Additionally, it showed higher specificity for the “Medium” and “High” thresholds, indicating its effectiveness in correctly identifying days when concentrations do not exceed these levels [47,49]. The positive likelihood ratio (PLR) was consistently higher for the Swedish model, especially at the “Low” threshold (4.94 in both locations), suggesting it is more accurate in distinguishing between days with and without significant pollen concentrations. The Swedish model also proved more robust in incorporating key meteorological variables, such as temperature, wind speed and precipitation, which were shown to have varying levels of importance across different thresholds. The Danish model, while still useful, had generally lower sensitivity and specificity scores, particularly for predicting “Very High” concentrations, indicating it is less reliable for identifying days with extreme pollen levels. Overall, the Swedish Threshold Model’s superior performance across most metrics and its greater adaptability to local environmental conditions make it a more suitable tool for predicting grass pollen concentrations in both urban and rural settings in Ireland.

5. Conclusions

The results demonstrate that the Swedish Threshold Model consistently outperforms the Danish model across multiple concentration thresholds, particularly for “Low” and “Very High” pollen levels, suggesting its superior suitability for predicting grass pollen concentrations in the Irish context. Temperature emerged as the most critical factor influencing pollen concentrations, while wind speed and precipitation also played significant roles, highlighting the complexity of environmental interactions affecting pollen dispersal.
This study further identifies the Wicklow Mountains as a key source area for grass pollen, emphasizing the importance of local geography and land use in influencing pollen distribution patterns. The observed differences in intra-diurnal pollen concentration peaks between the urban and rural sites underline the need for location-specific forecasting models that consider local environmental conditions. Overall, this study advances our understanding of grass pollen dynamics in Ireland and underscores the value of using robust, location-sensitive models like the Swedish Threshold Model for predicting airborne pollen concentrations. These insights can help improve public health responses and provide better information to allergy sufferers, especially in predicting peak pollen periods and minimizing exposure. Future research should continue to refine these models by incorporating additional environmental variables and expanding the geographical scope to further enhance their predictive accuracy.

Author Contributions

Conceptualization, D.J.O. and M.M.-B.; methodology, M.M.-B., A.M.P.-V. and E.M.; validation, A.M.P.-V. and J.H.C.; formal analysis, M.M.-B., A.M.P.-V., E.M. and J.C.; investigation, M.M.-B. and A.M.P.-V.; resources, R.S.-E. and D.J.O.; data curation, A.M.P.-V. and M.M.-B.; writing—original draft preparation, M.M.-B.; writing—review and editing, M.M.-B., A.M.P.-V., E.M. and D.J.O.; supervision, R.S.-E. and D.J.O.; project administration, R.S.-E. and D.J.O.; funding acquisition, A.M.P.-V. and M.M.-B. All authors have read and agreed to the published version of the manuscript.

Funding

This research was funded by the Universidad de Tarapacá grant number UTA-Mayor 5859-23 and the Irish Research Council under the project Real-time and Genetic Recognition of Pollen and Spores in Ireland (RaGRePoSI) grant number GOIPD/2022/598.

Institutional Review Board Statement

Not applicable.

Informed Consent Statement

Not applicable.

Data Availability Statement

Data available on request due to restrictions eg privacy or ethical. The data presented in this study are available on request from the corresponding author. The data are not publicly available due to it is a part of a continuing analysis for as of yet unpublished work, and releasing the detailed data early could impact the integrity of this work.

Acknowledgments

A not-reviewed part of this article was presented in the European Aerosol Conference 2023 [64].

Conflicts of Interest

The authors declare no conflicts of interest.

References

  1. The Angiosperm Phylogeny Group; Chase, M.W.; Christenhusz, M.J.M.; Fay, M.F.; Byng, J.W.; Judd, W.S.; Soltis, D.E.; Mabberley, D.J.; Sennikov, A.N.; Soltis, P.S.; et al. An Update of the Angiosperm Phylogeny Group Classification for the Orders and Families of Flowering Plants: APG IV. Bot. J. Linn. Soc. 2016, 181, 1–20. [Google Scholar] [CrossRef]
  2. de León, D.G.; García-Mozo, H.; Galán, C.; Alcázar, P.; Lima, M.; González-Andújar, J.L. Disentangling the Effects of Feedback Structure and Climate on Poaceae Annual Airborne Pollen Fluctuations and the Possible Consequences of Climate Change. Sci. Total Environ. 2015, 530, 103–109. [Google Scholar] [CrossRef] [PubMed]
  3. Schiavoni, G.; D’Amato, G.; Afferni, C. The Dangerous Liaison between Pollens and Pollution in Respiratory Allergy. Ann. Allergy Asthma Immunol. 2017, 118, 269–275. [Google Scholar] [CrossRef] [PubMed]
  4. García-Mozo, H. Poaceae Pollen as the Leading Aeroallergen Worldwide: A Review. Allergy 2017, 72, 1849–1858. [Google Scholar] [CrossRef]
  5. Nae, A.; Hinchion, K.; Keogh, I.J. A Fifteen-Year Review of Skin Allergy Testing in Irish Patients with Symptomatic Rhinitis. World J. Otorhinolaryngol.-Head Neck Surg. 2021, 7, 338–343. [Google Scholar] [CrossRef]
  6. Martínez-Bracero, M.; Markey, E.; Clancy, J.H.; Sodeau, J.; O’Connor, D.J. First Long-Time Airborne Fungal Spores Study in Dublin, Ireland (1978–1980). Atmosphere 2022, 13, 313. [Google Scholar] [CrossRef]
  7. O’Connor, D.J.; Sadyś, M.; Skjøth, C.A.; Healy, D.A.; Kennedy, R.; Sodeau, J.R. Atmospheric Concentrations of Alternaria, Cladosporium, Ganoderma and Didymella Spores Monitored in Cork (Ireland) and Worcester (England) during the Summer of 2010. Aerobiologia 2014, 30, 397–411. [Google Scholar] [CrossRef]
  8. O’Connor, D.J.; Healy, D.A.; Sodeau, J.R. A 1-Month Online Monitoring Campaign of Ambient Fungal Spore Concentrations in the Harbour Region of Cork, Ireland. Aerobiologia 2015, 31, 295–314. [Google Scholar] [CrossRef]
  9. Healy, D.A.; Huffman, J.A.; O’Connor, D.J.; Pöhlker, C.; Pöschl, U.; Sodeau, J.R. Ambient Measurements of Biological Aerosol Particles near Killarney, Ireland: A Comparison between Real-Time Fluorescence and Microscopy Techniques. Atmos. Chem. Phys. 2014, 14, 8055–8069. [Google Scholar] [CrossRef]
  10. Feeney, P.; Rodríguez, S.F.; Molina, R.; McGillicuddy, E.; Hellebust, S.; Quirke, M.; Daly, S.; O’Connor, D.; Sodeau, J. A Comparison of On-Line and Off-Line Bioaerosol Measurements at a Biowaste Site. Waste Manag. 2018, 76, 323–338. [Google Scholar] [CrossRef]
  11. O’Connor, D.J.; Daly, S.M.; Sodeau, J.R. On-Line Monitoring of Airborne Bioaerosols Released from a Composting/Green Waste Site. Waste Manag. 2015, 42, 23–30. [Google Scholar] [CrossRef] [PubMed]
  12. Markey, E.; Clancy, J.H.; Martínez-Bracero, M.; Maya-Manzano, J.M.; Smith, M.; Skjøth, C.; Dowding, P.; Sarda-Estève, R.; Baisnée, D.; Donnelly, A.; et al. A Comprehensive Aerobiological Study of the Airborne Pollen in the Irish Environment. Aerobiologia 2022, 38, 343–366. [Google Scholar] [CrossRef] [PubMed]
  13. McDonald, M.; O’driscoll, B. Aerobiological Studies Based in Galway. A Comparison of Pollen and Spore Counts over Two Seasons of Widely Differing Weather Conditions. Clin. Exp. Allergy 1980, 10, 211–215. [Google Scholar] [CrossRef] [PubMed]
  14. Kurganskiy, A.; Creer, S.; de Vere, N.; Griffith, G.W.; Osborne, N.J.; Wheeler, B.W.; McInnes, R.N.; Clewlow, Y.; Barber, A.; Brennan, G.L.; et al. Predicting the Severity of the Grass Pollen Season and the Effect of Climate Change in Northwest Europe. Sci. Adv. 2021, 7, eabd7658. [Google Scholar] [CrossRef] [PubMed]
  15. Rojo, J.; Rivero, R.; Romero-Morte, J.; Fernández-González, F.; Pérez-Badia, R. Modeling Pollen Time Series Using Seasonal-Trend Decomposition Procedure Based on LOESS Smoothing. Int. J. Biometeorol. 2017, 61, 335–348. [Google Scholar] [CrossRef]
  16. Bosch-Cano, F.; Bernard, N.; Sudre, B.; Gillet, F.; Thibaudon, M.; Richard, H.; Badot, P.-M.; Ruffaldi, P. Human Exposure to Allergenic Pollens: A Comparison between Urban and Rural Areas. Environ. Res. 2011, 111, 619–625. [Google Scholar] [CrossRef]
  17. Frisk, C.A.; Apangu, G.P.; Petch, G.M.; Adams-Groom, B.; Skjøth, C.A. Atmospheric Transport Reveals Grass Pollen Dispersion Distances. Sci. Total Environ. 2022, 814, 152806. [Google Scholar] [CrossRef]
  18. García-Mozo, H.; Galán, C.; Alcázar, P.; de la Guardia, C.D.; Nieto-Lugilde, D.; Recio, M.; Hidalgo, P.; Gónzalez-Minero, F.; Ruiz, L.; Domínguez-Vilches, E. Trends in Grass Pollen Season in Southern Spain. Aerobiologia 2010, 26, 157–169. [Google Scholar] [CrossRef]
  19. Cebrino, J.; Galán, C.; Domínguez-Vilches, E. Aerobiological and Phenological Study of the Main Poaceae Species in Córdoba City (Spain) and the Surrounding Hills. Aerobiologia 2016, 32, 595–606. [Google Scholar] [CrossRef]
  20. Romero-Morte, J.; Rojo, J.; Pérez-Badia, R. Meteorological Factors Driving Airborne Grass Pollen Concentration in Central Iberian Peninsula. Aerobiologia 2020, 36, 527–540. [Google Scholar] [CrossRef]
  21. Heide, O.M. Control of Flowering and Reproduction in Temperate Grasses. New Phytol. 1994, 128, 347–362. [Google Scholar] [CrossRef] [PubMed]
  22. Romero-Morte, J.; Rojo, J.; Rivero, R.; Fernández-González, F.; Pérez-Badia, R. Standardised Index for Measuring Atmospheric Grass-Pollen Emission. Sci. Total Environ. 2018, 612, 180–191. [Google Scholar] [CrossRef] [PubMed]
  23. Bennie, J.; Davies, T.W.; Cruse, D.; Bell, F.; Gaston, K.J. Artificial Light at Night Alters Grassland Vegetation Species Composition and Phenology. J. Appl. Ecol. 2018, 55, 442–450. [Google Scholar] [CrossRef]
  24. Aboulaich, N.; Bouziane, H.; Kadiri, M.; del Mar Trigo, M.; Riadi, H.; Kazzaz, M.; Merzouki, A. Pollen Production in Anemophilous Species of the Poaceae Family in Tetouan (NW Morocco). Aerobiologia 2009, 25, 27–38. [Google Scholar] [CrossRef]
  25. Brighetti, M.A.; Costa, C.; Menesatti, P.; Antonucci, F.; Tripodi, S.; Travaglini, A. Multivariate Statistical Forecasting Modeling to Predict Poaceae Pollen Critical Concentrations by Meteoclimatic Data. Aerobiologia 2014, 30, 25–33. [Google Scholar] [CrossRef]
  26. Pashley, C.H.; Fairs, A.; Edwards, R.E.; Bailey, J.P.; Corden, J.M.; Wardlaw, A.J. Reproducibility between Counts of Airborne Allergenic Pollen from Two Cities in the East Midlands, UK. Aerobiologia 2009, 25, 249–263. [Google Scholar] [CrossRef]
  27. Rojo, J.; Oteros, J.; Pérez-Badia, R.; Cervigón, P.; Ferencova, Z.; Gutiérrez-Bustillo, A.M.; Bergmann, K.-C.; Oliver, G.; Thibaudon, M.; Albertini, R.; et al. Near-Ground Effect of Height on Pollen Exposure. Environ. Res. 2019, 174, 160–169. [Google Scholar] [CrossRef]
  28. López-Orozco, R.; García-Mozo, H.; Oteros, J.; Galán, C. Long-Term Trends in Atmospheric Quercus Pollen Related to Climate Change in Southern Spain: A 25-Year Perspective. Atmos. Environ. 2021, 262, 118637. [Google Scholar] [CrossRef]
  29. Skjøth, C.A.; Ørby, P.V.; Becker, T.; Geels, C.; Schlünssen, V.; Sigsgaard, T.; Bønløkke, J.H.; Sommer, J.; Søgaard, P.; Hertel, O. Identifying Urban Sources as Cause of Elevated Grass Pollen Concentrations Using GIS and Remote Sensing. Biogeosciences 2013, 10, 541–554. [Google Scholar] [CrossRef]
  30. Werchan, B.; Werchan, M.; Mücke, H.-G.; Gauger, U.; Simoleit, A.; Zuberbier, T.; Bergmann, K.-C. Spatial Distribution of Allergenic Pollen through a Large Metropolitan Area. Environ. Monit. Assess. 2017, 189, 169. [Google Scholar] [CrossRef]
  31. Hjort, J.; Hugg, T.T.; Antikainen, H.; Rusanen, J.; Sofiev, M.; Kukkonen, J.; Jaakkola, M.S.; Jaakkola, J.J.K. Fine-Scale Exposure to Allergenic Pollen in the Urban Environment: Evaluation of Land Use Regression Approach. Environ. Health Perspect. 2016, 124, 619–626. [Google Scholar] [CrossRef] [PubMed]
  32. Sabariego, S.; Pérez-Badia, R.; Bouso, V.; Gutiérrez, M. Poaceae Pollen in the Atmosphere of Aranjuez, Madrid and Toledo (Central Spain). Aerobiologia 2011, 27, 221–228. [Google Scholar] [CrossRef]
  33. Camacho, I.; Caeiro, E.; Nunes, C.; Morais-Almeida, M. Airborne Pollen Calendar of Portugal: A 15-Year Survey (2002–2017). Allergol. Immunopathol. 2020, 48, 194–201. [Google Scholar] [CrossRef] [PubMed]
  34. Kok Ong, E.; Bir Singh, M.; Bruce Knox, R. Seasonal Distribution of Pollen in the Atmosphere of Melbourne: An Airborne Pollen Calendar. Aerobiologia 1995, 11, 51–55. [Google Scholar] [CrossRef]
  35. Oh, J.-W.; Lee, H.-B.; Kang, I.-J.; Kim, S.-W.; Park, K.-S.; Kook, M.-H.; Kim, B.-S.; Baek, H.-S.; Kim, J.-H.; Kim, J.-K.; et al. The Revised Edition of Korean Calendar for Allergenic Pollens. Allergy Asthma Immunol. Res. 2012, 4, 5. [Google Scholar] [CrossRef]
  36. Maya-Manzano, J.M.; Skjøth, C.A.; Smith, M.; Dowding, P.; Sarda-Estève, R.; Baisnée, D.; McGillicuddy, E.; Sewell, G.; O’Connor, D.J. Spatial and Temporal Variations in the Distribution of Birch Trees and Airborne Betula Pollen in Ireland. Agric. For. Meteorol. 2021, 298–299, 108298. [Google Scholar] [CrossRef]
  37. Vélez-Pereira, A.M.; De Linares, C.; Belmonte, J. Aerobiological Modeling I: A Review of Predictive Models. Sci. Total Environ. 2021, 795, 148783. [Google Scholar] [CrossRef]
  38. Copernicus Land Monitoring Service Grassland 2018. 2018. Available online: https://land.copernicus.eu/pan-european/high-resolution-layers/grassland/status-maps/grassland-2018?tab=metadata (accessed on 4 October 2022).
  39. 30 Year Averages—Met Éireann—The Irish Meteorological Service. Available online: https://www.met.ie/climate/30-year-averages (accessed on 16 February 2023).
  40. Hirst, J.M. An Automatic Volumetric Spore Trap. Ann. Appl. Biol. 1952, 39, 257–265. [Google Scholar] [CrossRef]
  41. Galán, C.; Smith, M.; Thibaudon, M.; Frenguelli, G.; Oteros, J.; Gehrig, R.; Berger, U.; Clot, B.; Brandao, R.; Group, E.Q.W. Pollen Monitoring: Minimum Requirements and Reproducibility of Analysis. Aerobiologia 2014, 30, 385–395. [Google Scholar] [CrossRef]
  42. R Development Core Team R: A Language and Environment for Statistical Computing. R Foundation for Statistical Computing. Available online: http://www.r-project.org/ (accessed on 17 July 2017).
  43. Rojo, J.; Picornell, A.; Oteros, J. AeRobiology: The Computational Tool for Biological Data in the Air. Methods Ecol. Evol. 2019, 10, 1371–1376. [Google Scholar] [CrossRef]
  44. Stein, A.; Draxler, R.R.; Rolph, G.D.; Stunder, B.J.; Cohen, M.; Ngan, F. NOAA’s HYSPLIT Atmospheric Transport and Dispersion Modeling System. Bull. Am. Meteorol. Soc. 2015, 96, 2059–2077. [Google Scholar] [CrossRef]
  45. Becker, J.; Steckling-Muschack, N.; Mittermeier, I.; Bergmann, K.-C.; Böse-O’Reilly, S.; Buters, J.; Damialis, A.; Heigl, K.; Heinrich, J.; Kabesch, M.; et al. Threshold Values of Grass Pollen (Poaceae) Concentrations and Increase in Emergency Department Visits, Hospital Admissions, Drug Consumption and Allergic Symptoms in Patients with Allergic Rhinitis: A Systematic Review. Aerobiologia 2021, 37, 633–662. [Google Scholar] [CrossRef]
  46. Real, R.; Barbosa, A.M.; Vargas, J.M. Obtaining Environmental Favourability Functions from Logistic Regression. Environ. Ecol. Stat. 2006, 13, 237–245. [Google Scholar] [CrossRef]
  47. Vélez-Pereira, A.M.; De Linares, C.; Canela, M.A.; Belmonte, J. A Comparison of Models for the Forecast of Daily Concentration Thresholds of Airborne Fungal Spores. Atmosphere 2023, 14, 1016. [Google Scholar] [CrossRef]
  48. Linares, C.D.; de la Guardia, C.D.; Lugilde, D.N.; Alba, F. Airborne Study of Grass Allergen (Lol p 1) in Different-Sized Particles. Int. Arch. Allergy Immunol. 2010, 152, 49–57. [Google Scholar] [CrossRef] [PubMed]
  49. Vélez-Pereira, A.M.; De Linares, C.; Canela, M.-A.; Belmonte, J. Logistic Regression Models for Predicting Daily Airborne Alternaria and Cladosporium Concentration Levels in Catalonia (NE Spain). Int. J. Biometeorol. 2019, 63, 1541–1553. [Google Scholar] [CrossRef] [PubMed]
  50. Estrella, N.; Menzel, A.; Krämer, U.; Behrendt, H. Integration of Flowering Dates in Phenology and Pollen Counts in Aerobiology: Analysis of Their Spatial and Temporal Coherence in Germany (1992–1999). Int. J. Biometeorol. 2006, 51, 49–59. [Google Scholar] [CrossRef]
  51. Simoleit, A.; Werchan, M.; Werchan, B.; Mücke, H.-G.; Gauger, U.; Zuberbier, T.; Bergmann, K.-C. Birch, Grass, and Mugwort Pollen Concentrations and Intradiurnal Patterns at Two Different Urban Sites in Berlin, Germany. Allergo J. Int. 2017, 26, 155–164. [Google Scholar] [CrossRef]
  52. Kasprzyk, I. Comparative Study of Seasonal and Intradiurnal Variation of Airborne Herbaceous Pollen in Urban and Rural Areas. Aerobiologia 2006, 22, 185–195. [Google Scholar] [CrossRef]
  53. Rodríguez-Rajo, F.J.; Jato, V.; Aira, M.J. Pollen Content in the Atmosphere of Lugo (NW Spain) with Reference to Meteorological Factors (1999–2001). Aerobiologia 2003, 19, 213–225. [Google Scholar] [CrossRef]
  54. Boullayali, A.; Elhassani, L.; Janati, A.; Achmakh, L.; Bouziane, H. Airborne Pollen Trends in Tétouan (NW of Morocco). Aerobiologia 2021, 37, 479–505. [Google Scholar] [CrossRef]
  55. Ghitarrini, S.; Galán, C.; Frenguelli, G.; Tedeschini, E. Phenological Analysis of Grasses (Poaceae) as a Support for the Dissection of Their Pollen Season in Perugia (Central Italy). Aerobiologia 2017, 33, 339–349. [Google Scholar] [CrossRef]
  56. Plaza, M.P.; Alcázar, P.; Hernández-Ceballos, M.A.; Galán, C. Mismatch in Aeroallergens and Airborne Grass Pollen Concentrations. Atmos. Environ. 2016, 144, 361–369. [Google Scholar] [CrossRef]
  57. Norris-Hill, J. The Modelling of Daily Poaceae Pollen Concentrations. Grana 1995, 34, 182–188. [Google Scholar] [CrossRef]
  58. Jetschni, J.; Jochner-Oette, S. Spatial and Temporal Variations of Airborne Poaceae Pollen along an Urbanization Gradient Assessed by Different Types of Pollen Traps. Atmosphere 2021, 12, 974. [Google Scholar] [CrossRef]
  59. Sikoparija, B.; Radisic, P.; Pejak, T.; Simic, S. Airborne Grass and Ragweed Pollen in the Southern Panonnian Valley—Consideration of Rural and Urban Environment. Ann. Agric. Environ. Med. 2006, 13, 2. [Google Scholar]
  60. Simoleit, A.; Gauger, U.; Mücke, H.-G.; Werchan, M.; Obstová, B.; Zuberbier, T.; Bergmann, K.-C. Intradiurnal Patterns of Allergenic Airborne Pollen near a City Motorway in Berlin, Germany. Aerobiologia 2016, 32, 199–209. [Google Scholar] [CrossRef]
  61. Brennan, G.L.; Potter, C.; de Vere, N.; Griffith, G.W.; Skjøth, C.A.; Osborne, N.J.; Wheeler, B.W.; McInnes, R.N.; Clewlow, Y.; Barber, A.; et al. Temperate Airborne Grass Pollen Defined by Spatio-Temporal Shifts in Community Composition. Nat. Ecol. Evol. 2019, 3, 750–754. [Google Scholar] [CrossRef] [PubMed]
  62. Kluska, K.; Piotrowicz, K.; Kasprzyk, I. The Impact of Rainfall on the Diurnal Patterns of Atmospheric Pollen Concentrations. Agric. For. Meteorol. 2020, 291, 108042. [Google Scholar] [CrossRef]
  63. Maya-Manzano, J.; Sadyś, M.; Tormo-Molina, R.; Fernández-Rodríguez, S.; Oteros, J.; Silva-Palacios, I.; Gonzalo-Garijo, A. Relationships between Airborne Pollen Grains, Wind Direction and Land Cover Using GIS and Circular Statistics. Sci. Total Environ. 2017, 584, 603–613. [Google Scholar] [CrossRef]
  64. Martínez-Bracero, M.; Vélez-Pereira, A.M.; O’Connor, D.J. Grass Pollen Modelling in Ireland Rural and Urban Areas; Poster presentation; Málaga, Spain, 3 September 2023. [Google Scholar]
Figure 1. Sampling site locations: green areas represent the grassland areas, and circles show the 30 km surrounding each sampling point.
Atmosphere 15 01198 g001
Figure 2. Grass pollen concentrations during the years of study. Figures on the left show each year’s daily concentrations; red dashed lines indicate the start and end of the pollen season, while the green dashed line indicates the peak day. The pictures on the right compare daily concentrations for each year, and the average is marked by the black line.
Atmosphere 15 01198 g002
Figure 3. Bi-hourly comparison of daily peaks in Carlow and Dublin; the shaded area indicates the standard deviation.
Atmosphere 15 01198 g003
Figure 4. MPS grass footprints (logarithm scale). The scale shows the exponent in base 10 of points included in the area calculated by Hysplit during the total length of the pollen season.
Atmosphere 15 01198 g004
Figure 5. Peak concentration days footprints. The scale is numeric up to the maximum number of points included in all areas calculated by HYSPLIT for the 48 h before the peak date.
Atmosphere 15 01198 g005
Figure 6. Grass source areas show the number of points in the area calculated by HYSPLIT (percentage is based on the highest points found in an area).
Atmosphere 15 01198 g006
Figure 7. Percentage of parameter importance on the development of tree regression. Tmax: daily maximum temperature, Tmin: daily minimum temperature, Rn: daily rainfall, Rnlag1: precipitation 1 day before, Rnlag2: precipitation 2 days before, Rnlag3: precipitation 3 days before, Hm: relative humidity, Wsp: wind speed.
Atmosphere 15 01198 g007
Table 1. Category and concentration per threshold [45].
Category ThresholdConcentration Rank by Threshold Proposed to
SwedenDenmark
Null<1 pollen grains/m3<1 pollen grains/m3
Low1–10 pollen grains/m31–30 pollen grains/m3
Medium10–30 pollen grains/m330–50 pollen grains/m3
High30–100 pollen grains/m350–150 pollen grains/m3
Very high≥100 pollen grains/m3≥150 pollen grains/m3
Table 2. Main pollen season (MPS) parameters for the two sampling points. 30: days with concentration over 30 pollen grains/m3, 50: days with concentration over 50 pollen grains/m3, 100: days with concentration over 100 pollen grains/m3, 150: days with concentration over 150 pollen grains/m3.
Location
DublinCarlow
Year2017201820192020201820192020
Start date31-May17-May27-May24-May22-May15-May6-May
End date20-Jul7-Jul6-Aug31-Aug15-Jul8-Aug31-Aug
Length season5152721005586118
Peak value546.65410.15514.90333.802383.519818.462335.97
Peak day17-Jun17-Jun15-Jun7-Jun13-Jun20-Jun13-Jun
Length pre-peak18322015233739
Sum pre-peak1641.252700.75961.401093.7513,318.3017,922.079452.61
Length post-peak33205285324979
Sum post-peak2462.201381.576966.355180.0713,303.339892.2311,409.06
Days over
(pollen grains/m3)
3031245156504944
5025214038453741
10013112821352629
150982112322127
Table 3. Details on the performance of the model and critical values were used as positive binary answers per concentration thresholds and aerobiological station.
StationCategory ThresholdSwedish Threshold ModelDanish Threshold Model
OTFSensitivitySpecificityPLROTFSensitivitySpecificityPRL
DublinLow0.5390.7900.8404.9400.5400.6610.4881.290
Medium0.2720.4640.8623.3600.1800.3590.7841.660
High0.1800.3570.8612.5700.1400.4440.8162.410
Very high0.0810.4290.7932.0700.0600.8000.5211.670
CarlowLow0.6240.7900.844.9400.6200.6610.4881.290
Medium0.4390.3570.8612.5700.3100.4440.8162.410
High0.3050.4470.8272.5800.2700.3530.8812.970
Very high0.1920.9170.5802.1800.1700.4380.6421.220
OTF: over threshold fraction data. PRL: positive likelihood ratio. Non-null days: Dublin 0.370 and Carlow 0.341.
Table 4. Most important descriptors for the decision trees.
ReSiteTh LevelsSplit1st Node (CV)2nd Node (CV)Rain Effect
SwDBL813Tmax (>13.90)Tmax (>18.00)RnLag2 (>1.25), Rnlag3c (>2.05)
M924Tmax (>16.30)Tmax (>14.00), rain (<0.45)Rnlag2 (>6.75)
H1219Tmax (>18.30)Rn (<0.46)RnLag1 (<2.06), Rnlag2 (<1.96)
VH68Tmax (>16.40)Wsp (<6.50)Rnlag3 (<1.35)
CWL713Tmax (>13.60)Tmin (>=6.90), RnLag1 (<0.15)Rnlag3 (<2.16)
M717Tmax (>=14.80)Hm (<12.00)Rnlag3 (<0.25)
H811Tmax (>=28.20)Rn (<1.65)Rnlag1 (<1.25), Rnlag1 (<0.75)
VH78Tmax (>=26.70)wsp (>3.95)Rnlag1 (<1.45), Rnlag3 (>0.30)
DeDBL813Tmax (>=13.90)Tmax (>18.00)Rnlag (>1.25), Rnlag3 (>2.06)
M1219Tmax (>16.30)Rn (<0.45)Rnlag2 (<1.95), Rnlag1 (<2.65)
H1017Tmax (>16.40)Rn (<0.05)Rnlag2 (<0.45)
VH33Tmax (>16.40)Wsp (<6.35)-
CWL713Tmax (>13.50)RnLag3 (<0.15)Rnlag3 (<2.15)
M812Tmax (>=26.20)Rn (<1.65)Rnlag3 (<0.60), Rnlag1 (>=0.75)
H59Tmax (>23.00)Wsp (>=4.55), Tmin (>13.80)-
VH78Tmax (>26.70)Wsp (>3.95)Rnlag1 (<1.45)
Sw: Swedish threshold model, De: Danish threshold model, DB: Dublin, CW: Carlow, Th: threshold. L: Low, M: Medium, H: High, VH: Very high, CV: critical value, Tmax: daily maximum temperature, Rn: daily rainfall, Wsp: wind speed, Rnlag1: precipitation 1 day before, Rnlag2: precipitation 2 days before, Rnlag3: precipitation 3 days before, Tmin: daily minimum temperature, Hm: relative humidity.
Disclaimer/Publisher’s Note: The statements, opinions and data contained in all publications are solely those of the individual author(s) and contributor(s) and not of MDPI and/or the editor(s). MDPI and/or the editor(s) disclaim responsibility for any injury to people or property resulting from any ideas, methods, instructions or products referred to in the content.

