Article

Exploring the Configurational Relationships between Urban Heat Island Patterns and the Built Environment: A Case Study of Beijing

1
Urban and Rural Planning Research Center, Linyi Natural Resources and Planning Bureau, Linyi 276000, China
2
College of Geography and Environment, Shandong Normal University, Jinan 250358, China
*
Author to whom correspondence should be addressed.
Atmosphere 2024, 15(10), 1200; https://doi.org/10.3390/atmos15101200
Submission received: 27 August 2024 / Revised: 20 September 2024 / Accepted: 2 October 2024 / Published: 8 October 2024

Abstract

:
The spatial heterogeneity of land surface temperature (LST) within cities is profoundly influenced by the built environment. Although significant progress has been made in the study of the urban thermal environment, there is still a lack of research on how the pattern and structural layout of the built environment affects the thermal environment. In this study, we take the Fifth Ring Road of Beijing as an example, invert the urban LST on the basis of multisource spatial data, characterize the built environment, and use k-means cluster analysis to investigate the main influencing factors of the LST in different functional areas and building patterns within the city, as well as the spatial relationship between the built environment and the urban LST. The results show the following: (1) The urban heat island (UHI) effect occurs to varying degrees over a large part of the study area, and these UHI areas are mainly concentrated in the southwestern part of the city, forming a large contiguous area between the second and fifth ring roads. (2) Class 1 is dominated by transport blocks, Class 3 is dominated by commercial blocks, and Class 5 is dominated by green space blocks, with a clustering index of 0.38. (3) The high-density, high-height class (HH-Class 2) has a greater number of blocks distributed in a ring shape around the periphery of the second ring road. The high-density, low-height class (HL-Class 2) has a relatively small number of blocks but a relatively large area, and the largest blocks are located in the western part of the study area. (4) In the HH and HL building patterns, extreme heat scenarios often occur; from the perspective of functional areas, the probability of extreme heat in the transport block is much higher than that of other functional areas, and except for the HH scenario, the green space functional area plays a very important role in reducing the temperature. This study explores the characteristics of the built environment that influence the urban LST from the perspective of different urban functional zones in cities to provide decision support for quantitative territorial spatial planning, optimization, and management.

1. Introduction

Urbanization has drastically altered the Earth’s surface from natural and seminatural environments to impermeable urban environments, resulting in higher temperatures in urban areas than in surrounding rural areas, creating the well-known urban heat island (UHI) effect [1]. In recent years, further urbanization has led to a surge in land surface temperature (LST), exacerbated by the UHI effect [2,3,4]. The UHI effect has resulted in numerous negative impacts, including increased energy consumption for cooling buildings, the deterioration of air quality, increased mortality due to overheating, and the intensification of extreme weather events, impairing the health and comfort of urban residents [5,6]. Therefore, in the context of the increasing global UHI effect, effectively mitigating the negative impacts of the UHI effect is highly important for the sustainable development of cities [7,8].
Current research on the thermal environment has focused on the UHI effect, the cooling effect of green spaces and vegetation, the albedo of building materials, the health effects of the thermal environment, and the impact of energy consumption. Oke [9] discussed the energy basis of the UHI effect and proposed the causes and mechanisms of the increase in urban LST. Voogt and Oke [10] elaborated on the application of remote sensing technology in urban climate research at the macro level, especially UHI effect monitoring and analysis. He and Zhang [11] explored the application of high-resolution models in studying the UHI effect, discussed the application of models for predicting and analyzing urban air quality, and emphasized the importance of future research and technological advances for further enhancing the capabilities of models. Huang et al. [12] explored the mitigation of the UHI effect by green spaces in Taipei city, providing data on the cooling effects of different types of green space. Wang et al. [13] summarized the potential of cool roof technology in mitigating the UHI effect, highlighting its value as an effective urban climate regulation tool and highlighting key issues and research directions that need to be addressed in the future. Kaveh et al. [14] discussed recent research on the UHI effect, particularly the impacts of building materials and urban planning. Akbari et al. [15] discussed the practical effects of energy-efficient technologies in reducing the UHI effect, lowering energy consumption in buildings, and improving the quality of the urban environment through case studies and simulation analyses. The pattern of the UHI effect is closely related to the configuration of the built environment [16]. Although significant progress has been made in urban thermal environment research, there is still a lack of research on how the pattern and structural layout of the built environment affect the thermal environment. In particular, more empirical studies and model simulations are needed to determine how to systematically analyze and optimize the spatial layout and building configurations of cities to comprehensively reduce the UHI effect.
The strength of the UHI effect is closely related to the characteristics of the built environment (e.g., building materials, building density, etc.) [17], and the strength of the UHI effect varies considerably in different cities and regions, with the UHI effect usually being most pronounced in the city center. Oke’s [9] model of the ‘urban heat island effect’ shows that there is a significant difference in UHI effect between different types of built environments (e.g., residential, commercial and industrial) in cities. There are significant differences in the UHI effect between different types of built environments in a city (e.g., residential, commercial, and industrial), with residential areas having a weaker UHI effect due to the relatively high amount of green cover and commercial and industrial areas having a stronger UHI effect due to the high density of the buildings and the high heat capacity of the materials. The layout of buildings and streets in a city also affects wind speed and airflow, reducing the natural cooling effect and stagnating hot air in the city. Yang et al. [18] explored how the built environment influences the UHI effect during urbanization and concluded that building height (BH), building density (BD), and material properties have a significant effect on local climate. In addition, there are different thermal properties of different building materials and their contribution to the UHI effect, and the selection of building materials with low heat capacities and high grayness values can significantly reduce the UHI effect [19]. Wu et al. [20] discussed the long-term impacts of urban planning and built environment management strategies on the UHI effect, with a focus on the potentials of urban greening and open space configuration to mitigate the UHI [21]. Overall, the built environment has a significant impact on the UHI effect, and by studying and optimizing these environmental factors, the UHI effect can be effectively mitigated, and the comfort and sustainability of cities can be improved [22].
The main objectives of this study are as follows: (1) To gain a general understanding of the overall thermal environment of the study area through the inversion of the LST and the UHI effect and to analyze the spatial distribution of the urban LST, which will help us to comprehensively understand the UHI effect in Beijing. (2) We will use k-means cluster analysis to construct a set of factor systems to measure the spatial characteristics of the urban built environment, identify the main factors that dominate the spatial characteristics of the urban built environment, classify the types of the urban built environment, and analyze the characteristics of its internal factors. (3) By analyzing the LST in different built environment types, we aim to investigate the influence of multiple environmental factors in the urban built environment on the average LST and explore and screen the factors that have a significant effect on the average LST of a city. On this basis, this study attempts to explore the potential differences in the characteristics of the built environment affecting the urban LST at the urban block scale to provide scientific research ideas and applicable operational procedures for mitigating the UHI effect.

2. Methodology

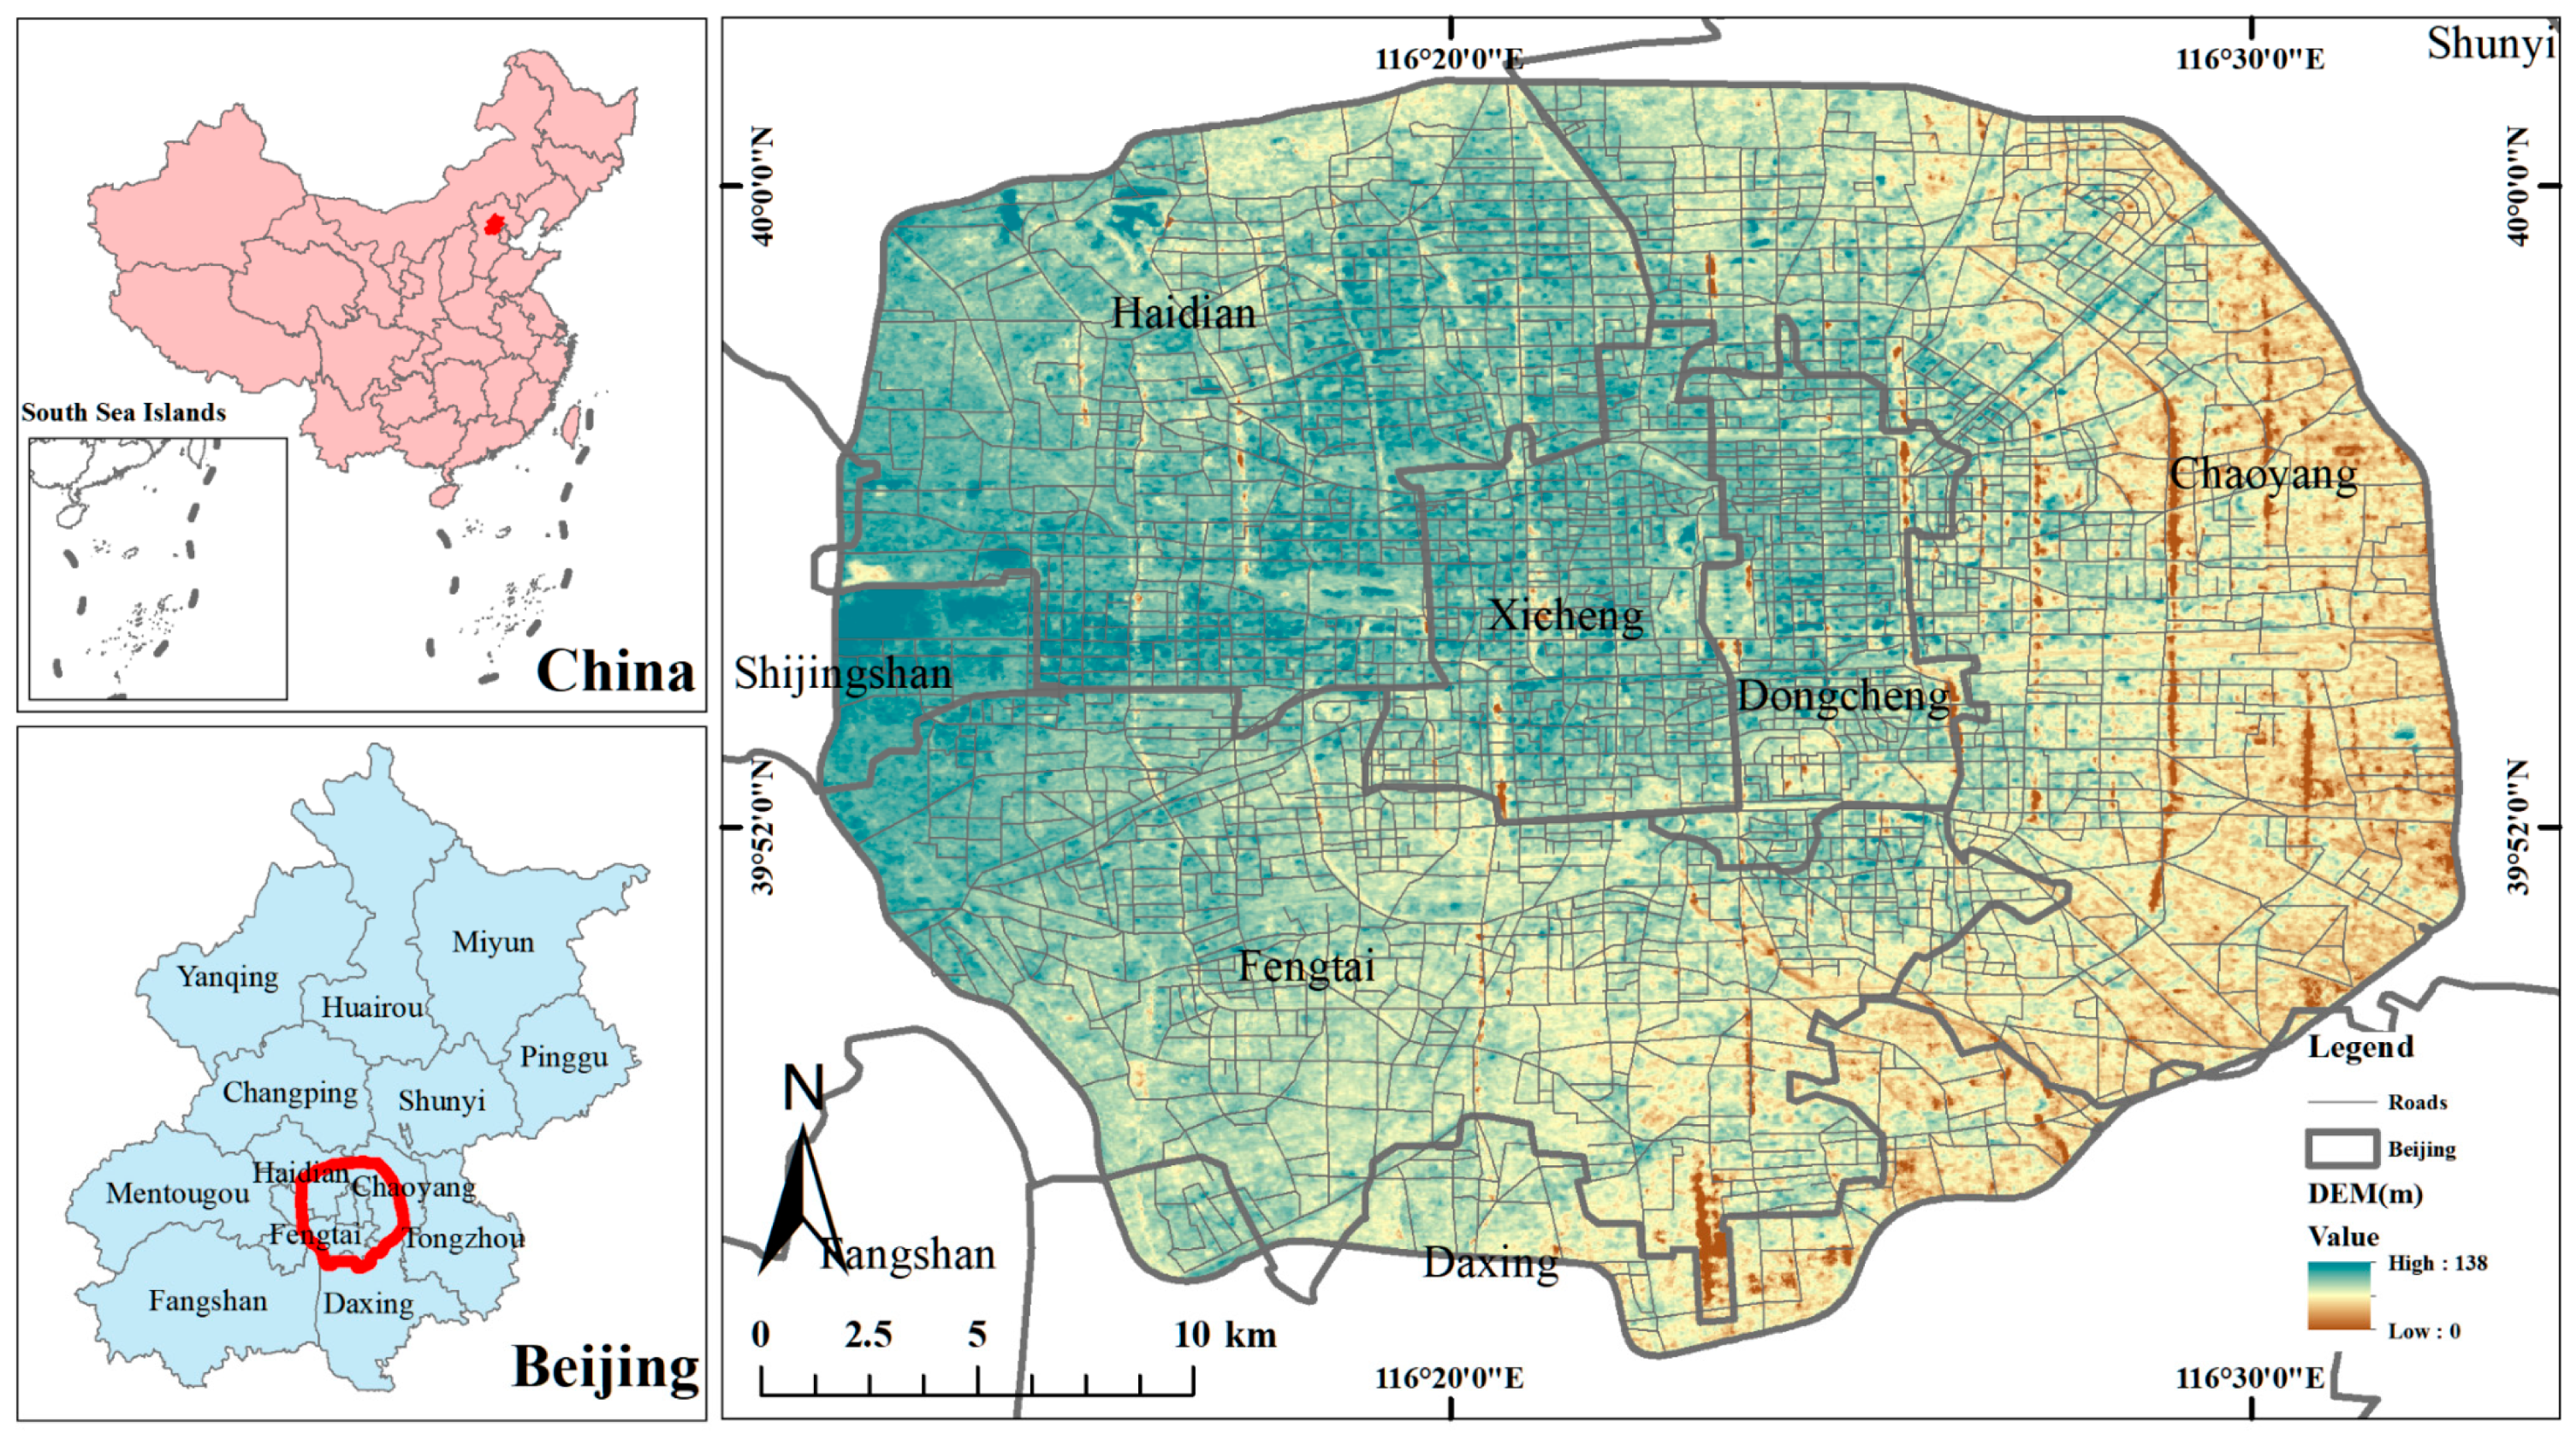
2.1. Study Area and Data

The study area used in this paper is located within the Fifth Ring Road of Beijing, with a total area of 667.28 square kilometers (Figure 1). The study area is located on the North China Plain, with a typical warm–temperate semi-humid continental monsoon climate, an average annual temperature of 11–12 °C, and an average annual sunshine hour of 2800 h. Within the Fifth Ring Road of Beijing, Dongcheng District and Xicheng District are the core functional areas, and Chaoyang District, Fengtai District, Haidian District, Shijingshan District, and Daxing District are the expansion areas. Half of the city’s population resides within the Five Ring Road. As the main area of Beijing’s urban construction and development, the area within the Fifth Ring Road is undergoing fast construction and has a large population capacity. The rapid development of the city has led to increasingly prominent thermal environmental problems. The average temperature in Beijing in 2019 will be about 1 °C higher than 20 years ago. In recent years, urban ecological problems represented by the heat island effect have attracted extensive attention from planning decisions and managers.
The radiometrically calibrated Landsat 8 image was sourced from the geospatial data cloud platform (www.gscloud.cn) provided by the Chinese Academy of Sciences. It was taken at 10:52 on 2 September 2019. The weather was clear and cloudless, meeting the retrieval requirements of the LST. In addition, the building data (231,021 in total) and Point of Interest (POI) data (655,625 in total) of the study area were collected on the basis of the Gaode map. The basic block study unit of this study was divided with the aid of OSM road network data.

2.2. Methods

Figure 2 illustrates the framework of this study, including the process of inverse analysis of the urban thermal environment. The basic logic of the method (the reverse analysis process) is that only by analyzing the thermal environment of an urban built environment on the basis of its accurate identification can mitigation measures be better aligned with the development planning of the built environment. On this basis, first, the LST was retrieved from Landsat 8 remote sensing images for the accurate characterization of the urban thermal environment on a large scale. Secondly, we extracted the most critical morphological and socioeconomic characteristics of the built environment through building data and POI data and then drew a built environment pattern identification map through a k-means unsupervised clustering algorithm. Finally, theoretically, if we adopted corresponding mitigation measures (e.g., green and blue spaces) under different built environment patterns, we could accurately improve the thermal environment in the region.

2.2.1. LST Retrieval via the Radiative Transfer Equation Algorithm

At present, there are two general methods of measuring the UHI: one is to use remote sensing data to measure the LST, and the other is to measure the air temperature data at temperature measurement points. The former involves measuring the temperature of the fixed surface, which is the temperature of the ground material itself after being radiated by sunlight, while the latter involves measuring the temperature of the flowing gas, i.e., the temperature of the air. Because of the prevalence of near-surface air currents near the ground, the measurement of air temperature at a particular point is more strongly influenced by the surrounding environment. In contrast to air and LST data, which each have their own strengths, temperature point data have greater spatial and temporal accuracy but are difficult to obtain, whereas remotely sensed data have wider coverage and greater spatial and temporal consistency.
In this work, we used Landsat 8 TIRS band 10 (TIRS 10) as a data source to retrieve and study the LST of the study area via the radiative transfer equation algorithm to characterize and quantify the thermal environment of the city [23].
L sensor   = [ ε B ( T s ) + ( 1 ε ) L ] τ + L
B T s = L λ L τ 1 ε L / ( τ ε )
T s = K 2 ln ( K 1 B T s + 1 )
where L sensor   represents the radiant brightness at the satellite altitude received by the sensor, ε represents the surface-specific emissivity, τ represents the atmospheric transmittance, L represents the atmospheric downgradient radiant brightness, and B ( T s ) represents the radiant brightness of a blackbody whose temperature is T s . The values of τ (atmospheric transmittance), L (atmospheric downgradient radiance), and L (atmospheric uplink radiance) are τ = 0.78, L = 1.69, and L = 2.80, respectively, as determined by entering the imaging time and central latitude and longitude of the image used on the NASA website (http://atmcorr.gsfc.nasa.gov/). The thermal infrared band of the Landsat 8 data used in this study is the 10th band, which is in the lower atmospheric absorption region. The inverse function of Planck’s equation could be used to obtain the true surface temperature, where K 2 = 1321.08 and K 1 = 774.89.

2.2.2. Measurement of Built Environment Indicators

As the most significant area where human activities change the land surface, cities have developed building forms with typical characteristics of high density, high height, and high intensity, which have a direct impact on the urban climate. In this study, the most widely used building density (BD) and average building height (BH) were selected to measure the important building components in the built environment [24,25]. The calculation formula was as follows:
B D = i = 1 n P i × H i S
B H = i = 1 n H i n
where B D is an index used to quantify the building density within a unit, and B H represents the average height of buildings within a unit. The land use data of Beijing came from the resource and environment data cloud platform (http://www.resdc.cn/DOI) and the land use types included 8 categories (cropland, forest, shrub, grassland, wetland, water, impervious, barren). Moreover, this study was based on the urban land classification system and definitions in the “Urban Land Classification and Planning Construction Land Standards” issued by the Ministry of Housing and Urban–Rural Development of the People’s Republic of China to standardize the primary classification of POI data and construct the functional area identification classification system. On the block, the functional area of the city was marked by calculating the frequency density (FD) and the category coefficient (CF) of the POI type and the ranking between the types.
F D i j = N i j A i
where N i j represents the number of j t h POIs in the functional area and A i represents the total area of each area in the functional area i . The POI type uses a large category of tags as follows:
C F i j = ( N i j N i ) / ( N j N )
where N i j represents the number of types j POIs in functional area i , N i represents the total number of POIs in functional area i , N j represents the number of types j POIs in the entire block, and N represents the total number of POIs in the entire block.

2.2.3. Pattern Recognition of the Urban Built Environment via the K-Means Algorithm

Mixed land use and mixed functions are very common in urban built-up areas, and Beijing, as the country’s capital city, has always shown intensive and high-density mixed characteristics, so how to accurately identify the patterns of the built-up environment in mixed situations becomes particularly important, and the unsupervised k-means algorithm provides the possibility of doing so.
We used the k-means clustering method to classify the city samples. The k-means algorithm is an unsupervised cluster analysis algorithm solved via iteration [26,27]. The steps were to determine the number of clusters K, select K points in the feature space as the initial cluster centroids, calculate the distance from each feature to each cluster centroid, assign each feature to this shortest distance cluster centroid, and finally obtain the clusters, thus completing the first round of clustering. After each round of clustering, the cluster centers were updated according to the set method. The new clusters were selected, and then the clustering centers were updated again. This process was repeated several times to obtain a final K-categories with the latest cluster center as the centroid. To evaluate the effect of clustering, an evaluation method was introduced to check the quality of clustering. In this work, the silhouette coefficient method was used to evaluate the effectiveness of clustering. The silhouette coefficient measure the similarity (i.e., cohesiveness) between the object and the cluster to which it belongs. Its values are in the range [−1, 1]. A value close to 1 indicates that there is a close connection between the object and the cluster to which it belongs. The higher the value, the more suitable and acceptable the model (Figure 3).
The k-means method is a nonhierarchical cluster algorithm, which groups objects into mutually exclusive clusters. The number of clusters k has to be prescribed for this method. The similarity measure is the squared Euclidian distance SED between two data objects (vectors including fields of one or more variables) x 1 and x 2 :
S E D = | | x 1 x 2 | | ²
This measure is then used to define the so-called within-cluster sum of squares WSS:
W S S = i = 1 k x C i | | x z i | | ²
where x denotes all data objects belonging to the cluster C i , z i is the ith corresponding cluster centroids (CC), and k is the number of clusters. Since several variables were used in this study, the data objects of each variable were normalized by subtracting their corresponding temporal–spatial mean and dividing it by their standard deviation afterward.

2.2.4. Analysis Process

In the case study within the fifth ring of Beijing, first, we measured the most important architectural and socioeconomic indicators of the built environment and identified different patterns of the built environment on the basis of the k-means algorithm. Then, we statistically analyzed the LST statistics of different built environment patterns via reverse analysis, and ArcGIS 10.6 software was used to calculate the LST statistics. Finally, in addition to identifying relevant influencing factors from the LST, this study analyzed the regional differences in the thermal environment from the built environment (the thermal environment of the built environment in different patterns will be analyzed in greater depth later). Thus, we assessed the regional thermal environment from the perspective of the built environment itself, which would help planners and managers to suggest precise and feasible mitigation measures.

3. Results

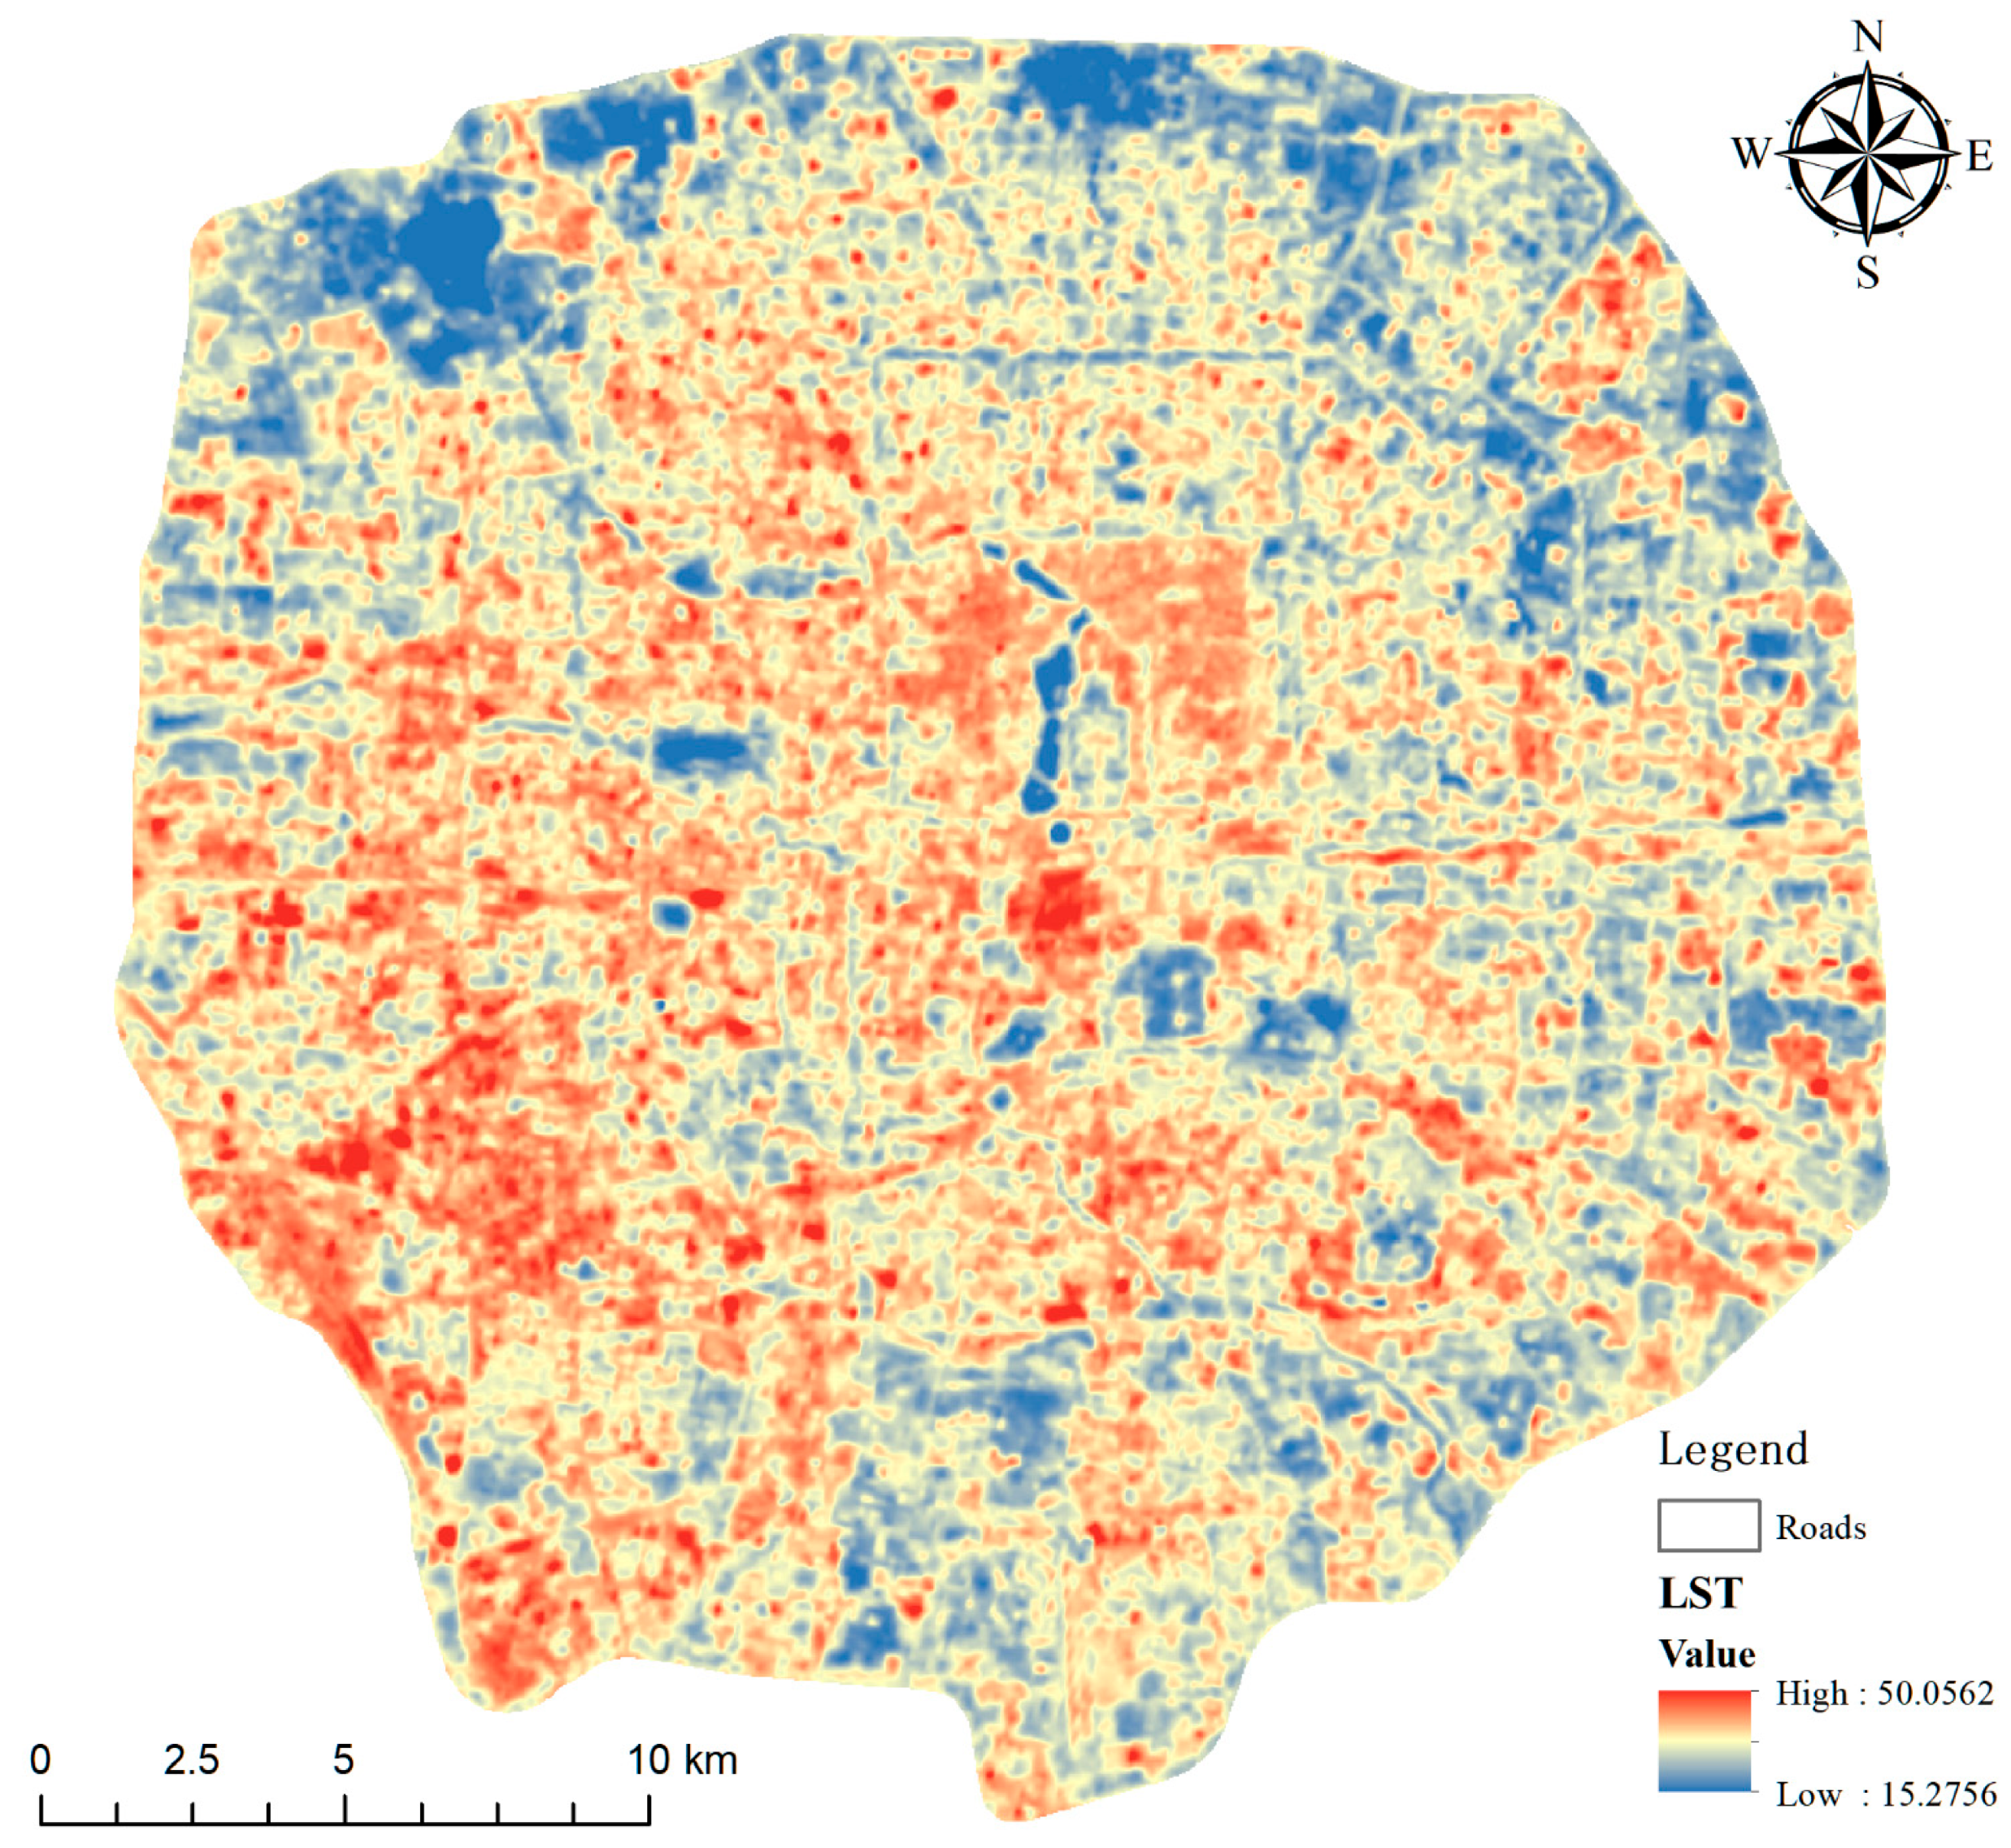
3.1. Results of LST Retrieval

As shown in Figure 4, the thermal environment within the Fifth Ring Road of Beijing is not in the optimal condition, with the lowest LST of 15.28 °C occurring on the surface of water bodies and the highest LST of 50.10 °C occurring in buildings. The heat island effect occurs to varying degrees in a large range of blocks in the study area, and these heat island areas are mostly clustered in the southwestern part of the city, where large contiguous areas are formed between the second and fifth rings.

3.2. Built Environment Measurement Results

We used k-means cluster analysis to classify the POI data into five classes, as shown in Figure 5. Class 1 is dominated by transport sites, with a clustering index of 0.44. Class 3 is dominated by commercial sites, with a clustering index of 0.55. Class 5 is dominated by greenfield spatial sites, with a clustering index of 0.38. Compared with the three classifications described above, Class 2 and Class 4 are not significantly dominated by land use. We also analyzed the clustering of the BD and MH building indices and classified the results into ‘Low-Low’ (LL), ‘Low-High’ (LH), ‘High-Low’ (HL) and ‘High-High’ (HH) categories, as shown in Figure 5. When the building height was low and the density was low, the result was LL. When the building height was high and the density was low, the result was LH. When the building height was high and the density was high, the result was HH. When the building height was low and the density was high, the result was HL.

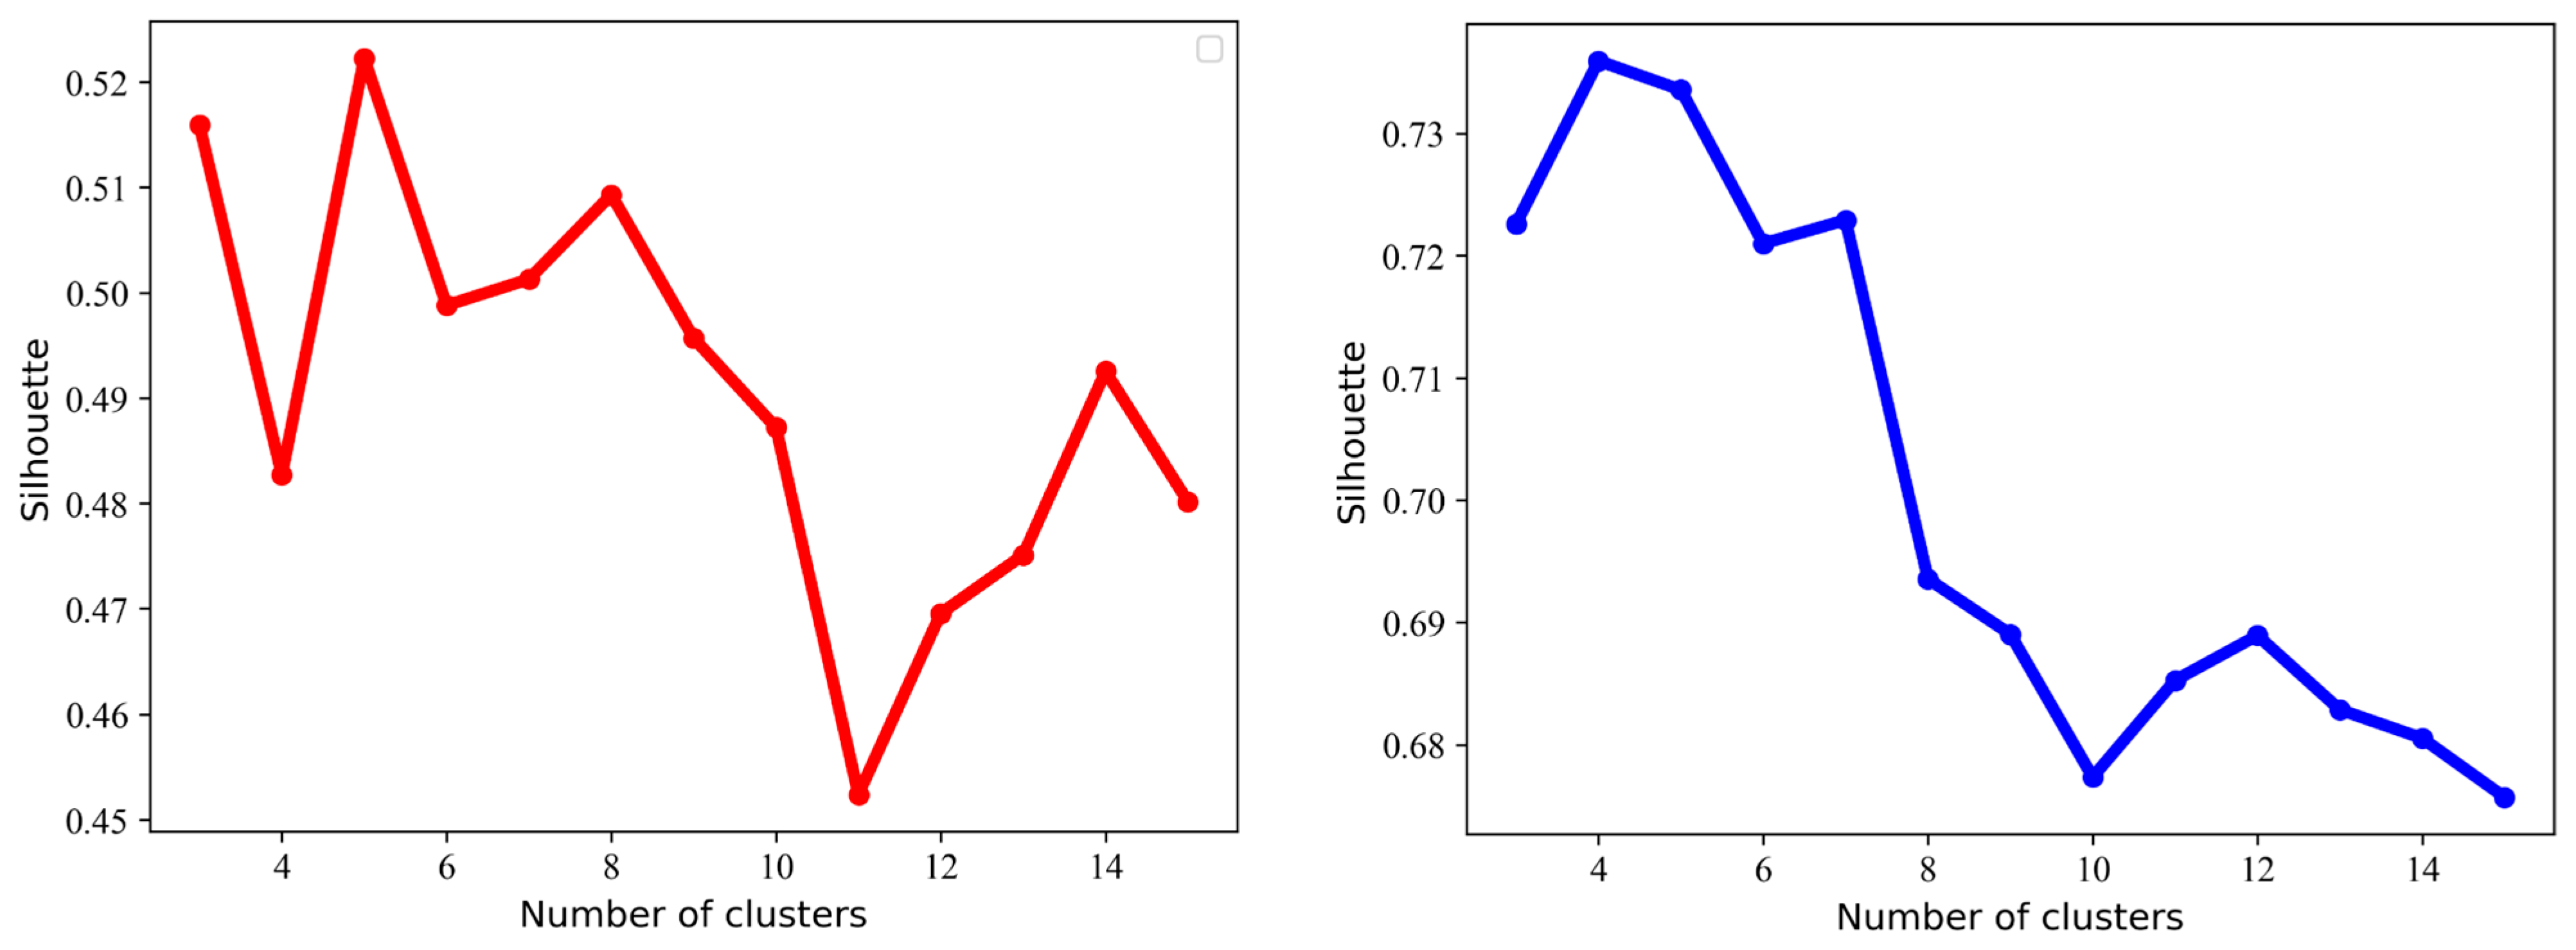
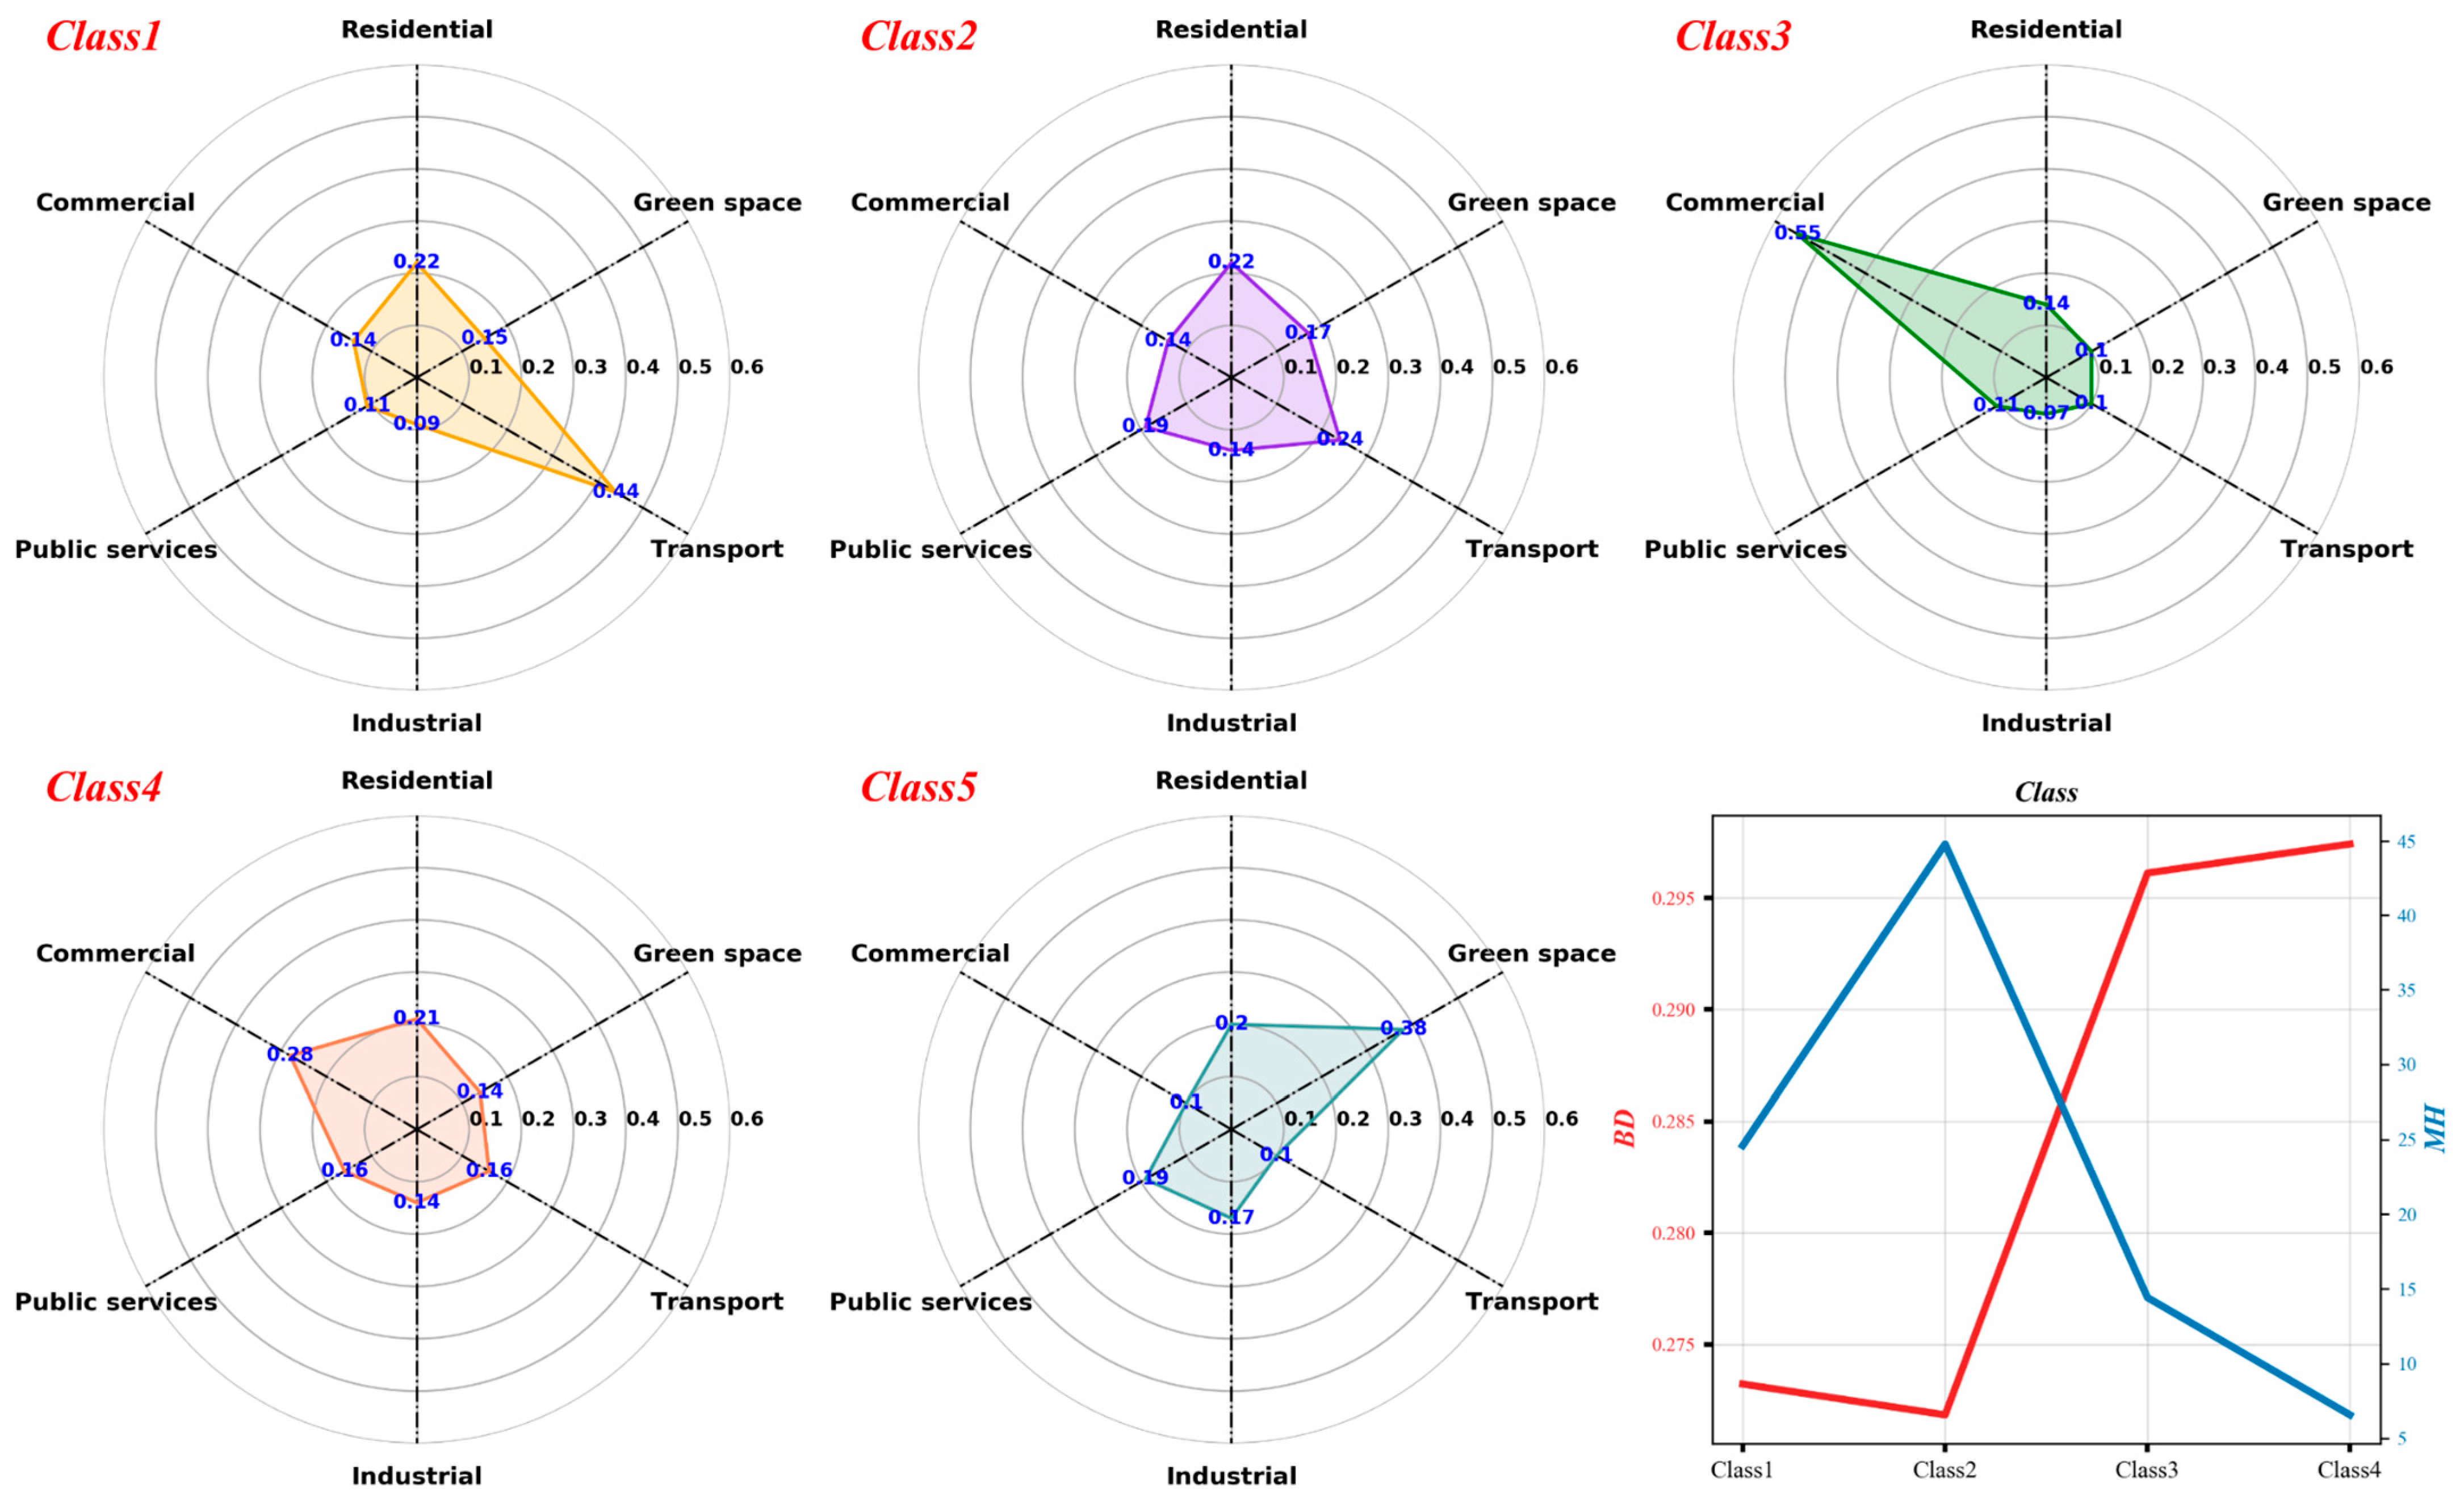
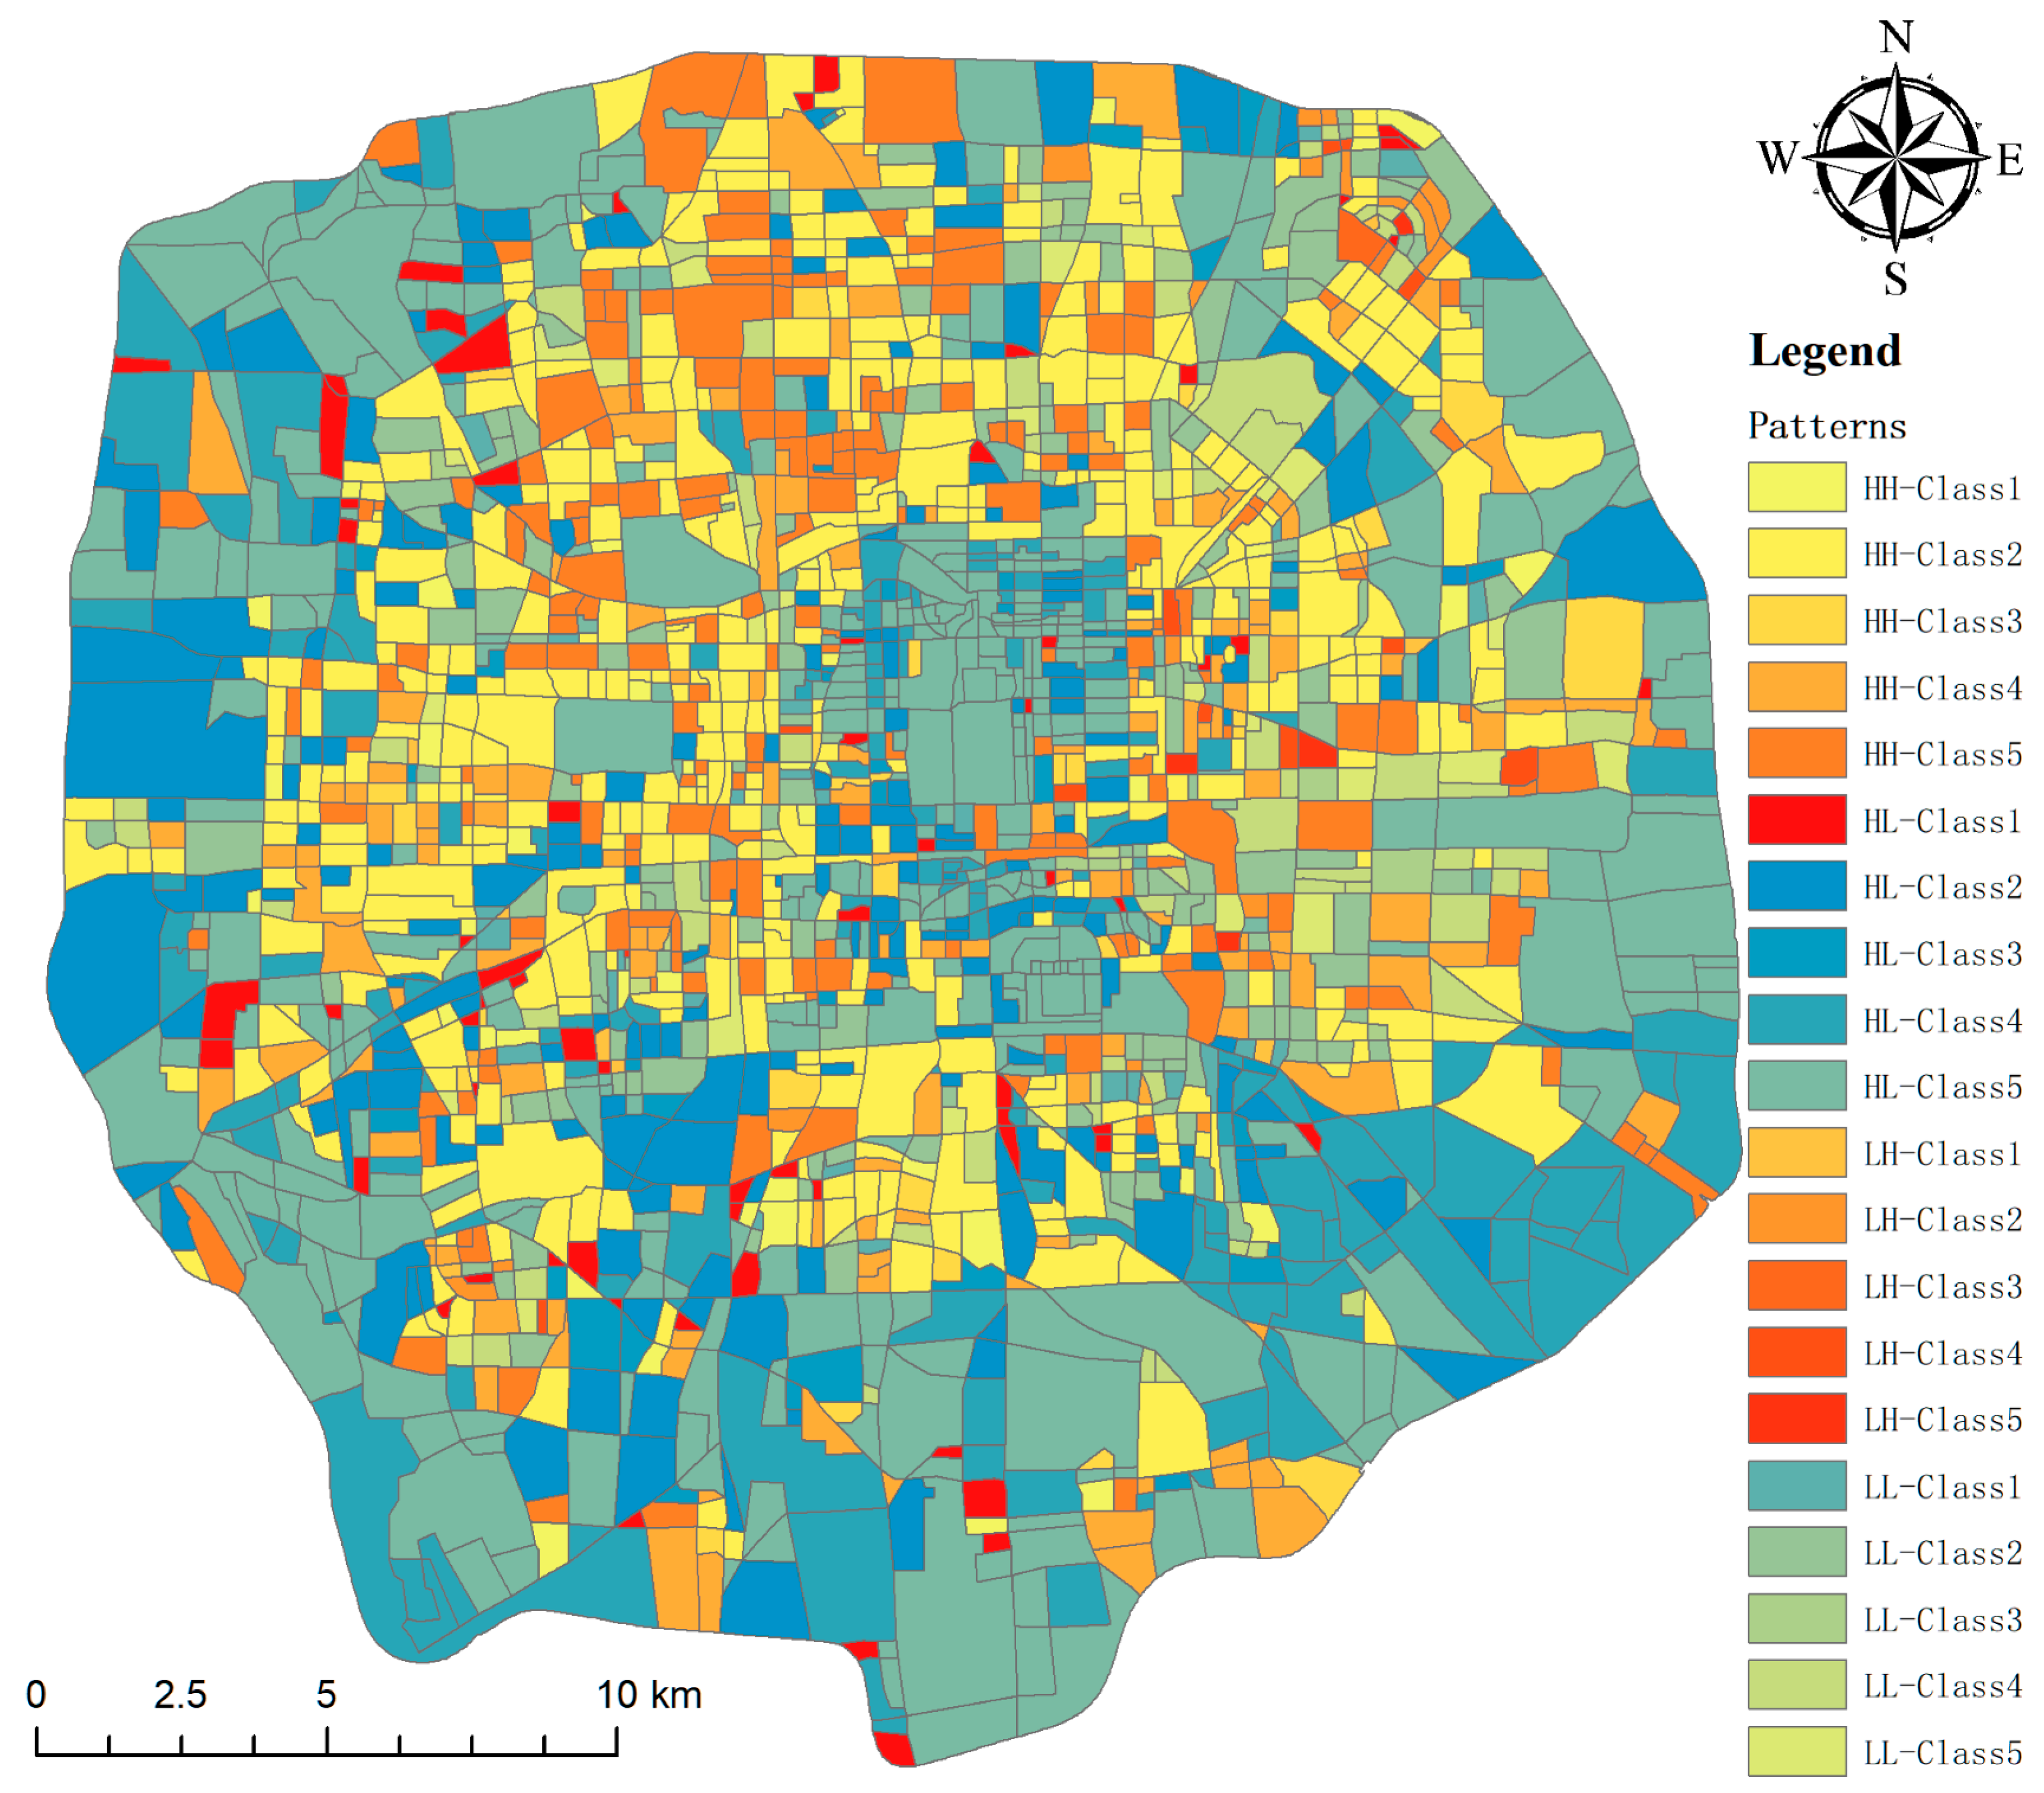
3.3. Results of Urban Built Environment Pattern Recognition under Unsupervised Classification

We superimposed the results of the above two cluster analyses to obtain the results of the pattern recognition of the built environment in the study area (Figure 6) and classified the spatial pattern of the urban built environment into 20 types. HH-Class1 and HH-Class2 are the blocks that are mainly used for transportation functions and are in the background of HH buildings, and the blocks of HH-Class1 are few in number and sparsely distributed, whereas the blocks of HH-Class2 are greater in number and are distributed in a ring around the periphery of the Second Ring Road. The HH-Class1 blocks are few in number and sparsely distributed; the HH-Class2 blocks are more numerous and distributed in a ring shape around the periphery of the second ring road. HH-Class3 and HH-Class4 are blocks with predominantly commercial functions in the context of HH buildings; these two types of blocks are small in number and mainly distributed around HH-Class2. HH-Class5 is a block with predominantly green space functions in the context of HH buildings; HH-Class5 blocks are larger in size and predominantly located in the northern part of the study area. HL-Class1 and HL-Class2 are blocks with a predominantly transport function in the context of HL buildings, with a smaller number of HL-Class1 blocks and larger blocks distributed in the northwestern and southwestern parts of the study area and a smaller number of HL-Class2 blocks but larger blocks, with the largest blocks located in the west of the study area. HL-Class3 and HL-Class4 are blocks with predominantly commercial functions in the context of HL buildings; these two types of blocks are fewer in number and located mainly in the central part of the study area. HL-class 5 blocks are blocks with predominantly green space functions in the context of HL buildings; these types of blocks are distributed mainly around the study area. LH-Class1 and LH-Class2 are blocks with predominantly transport functions in the context of LH buildings, LH-Class3 and LH-Class4 are blocks with predominantly commercial functions in the context of LH buildings, and LH-Class5 is a block with predominantly green space functions in the context of low-density, LH buildings. These five types of blocks are predominantly located in the eastern part of the study area, with LL-Class1 and LL-Class2 being predominantly transit-oriented blocks in the context of LL buildings, LL-Class3 and LL-Class4 being predominantly commercial-oriented blocks in the context of LL buildings, and LL-Class5 a being predominantly green space-oriented block in the context of LL buildings. These five types of blocks are predominantly located in the northeastern part of the study area.

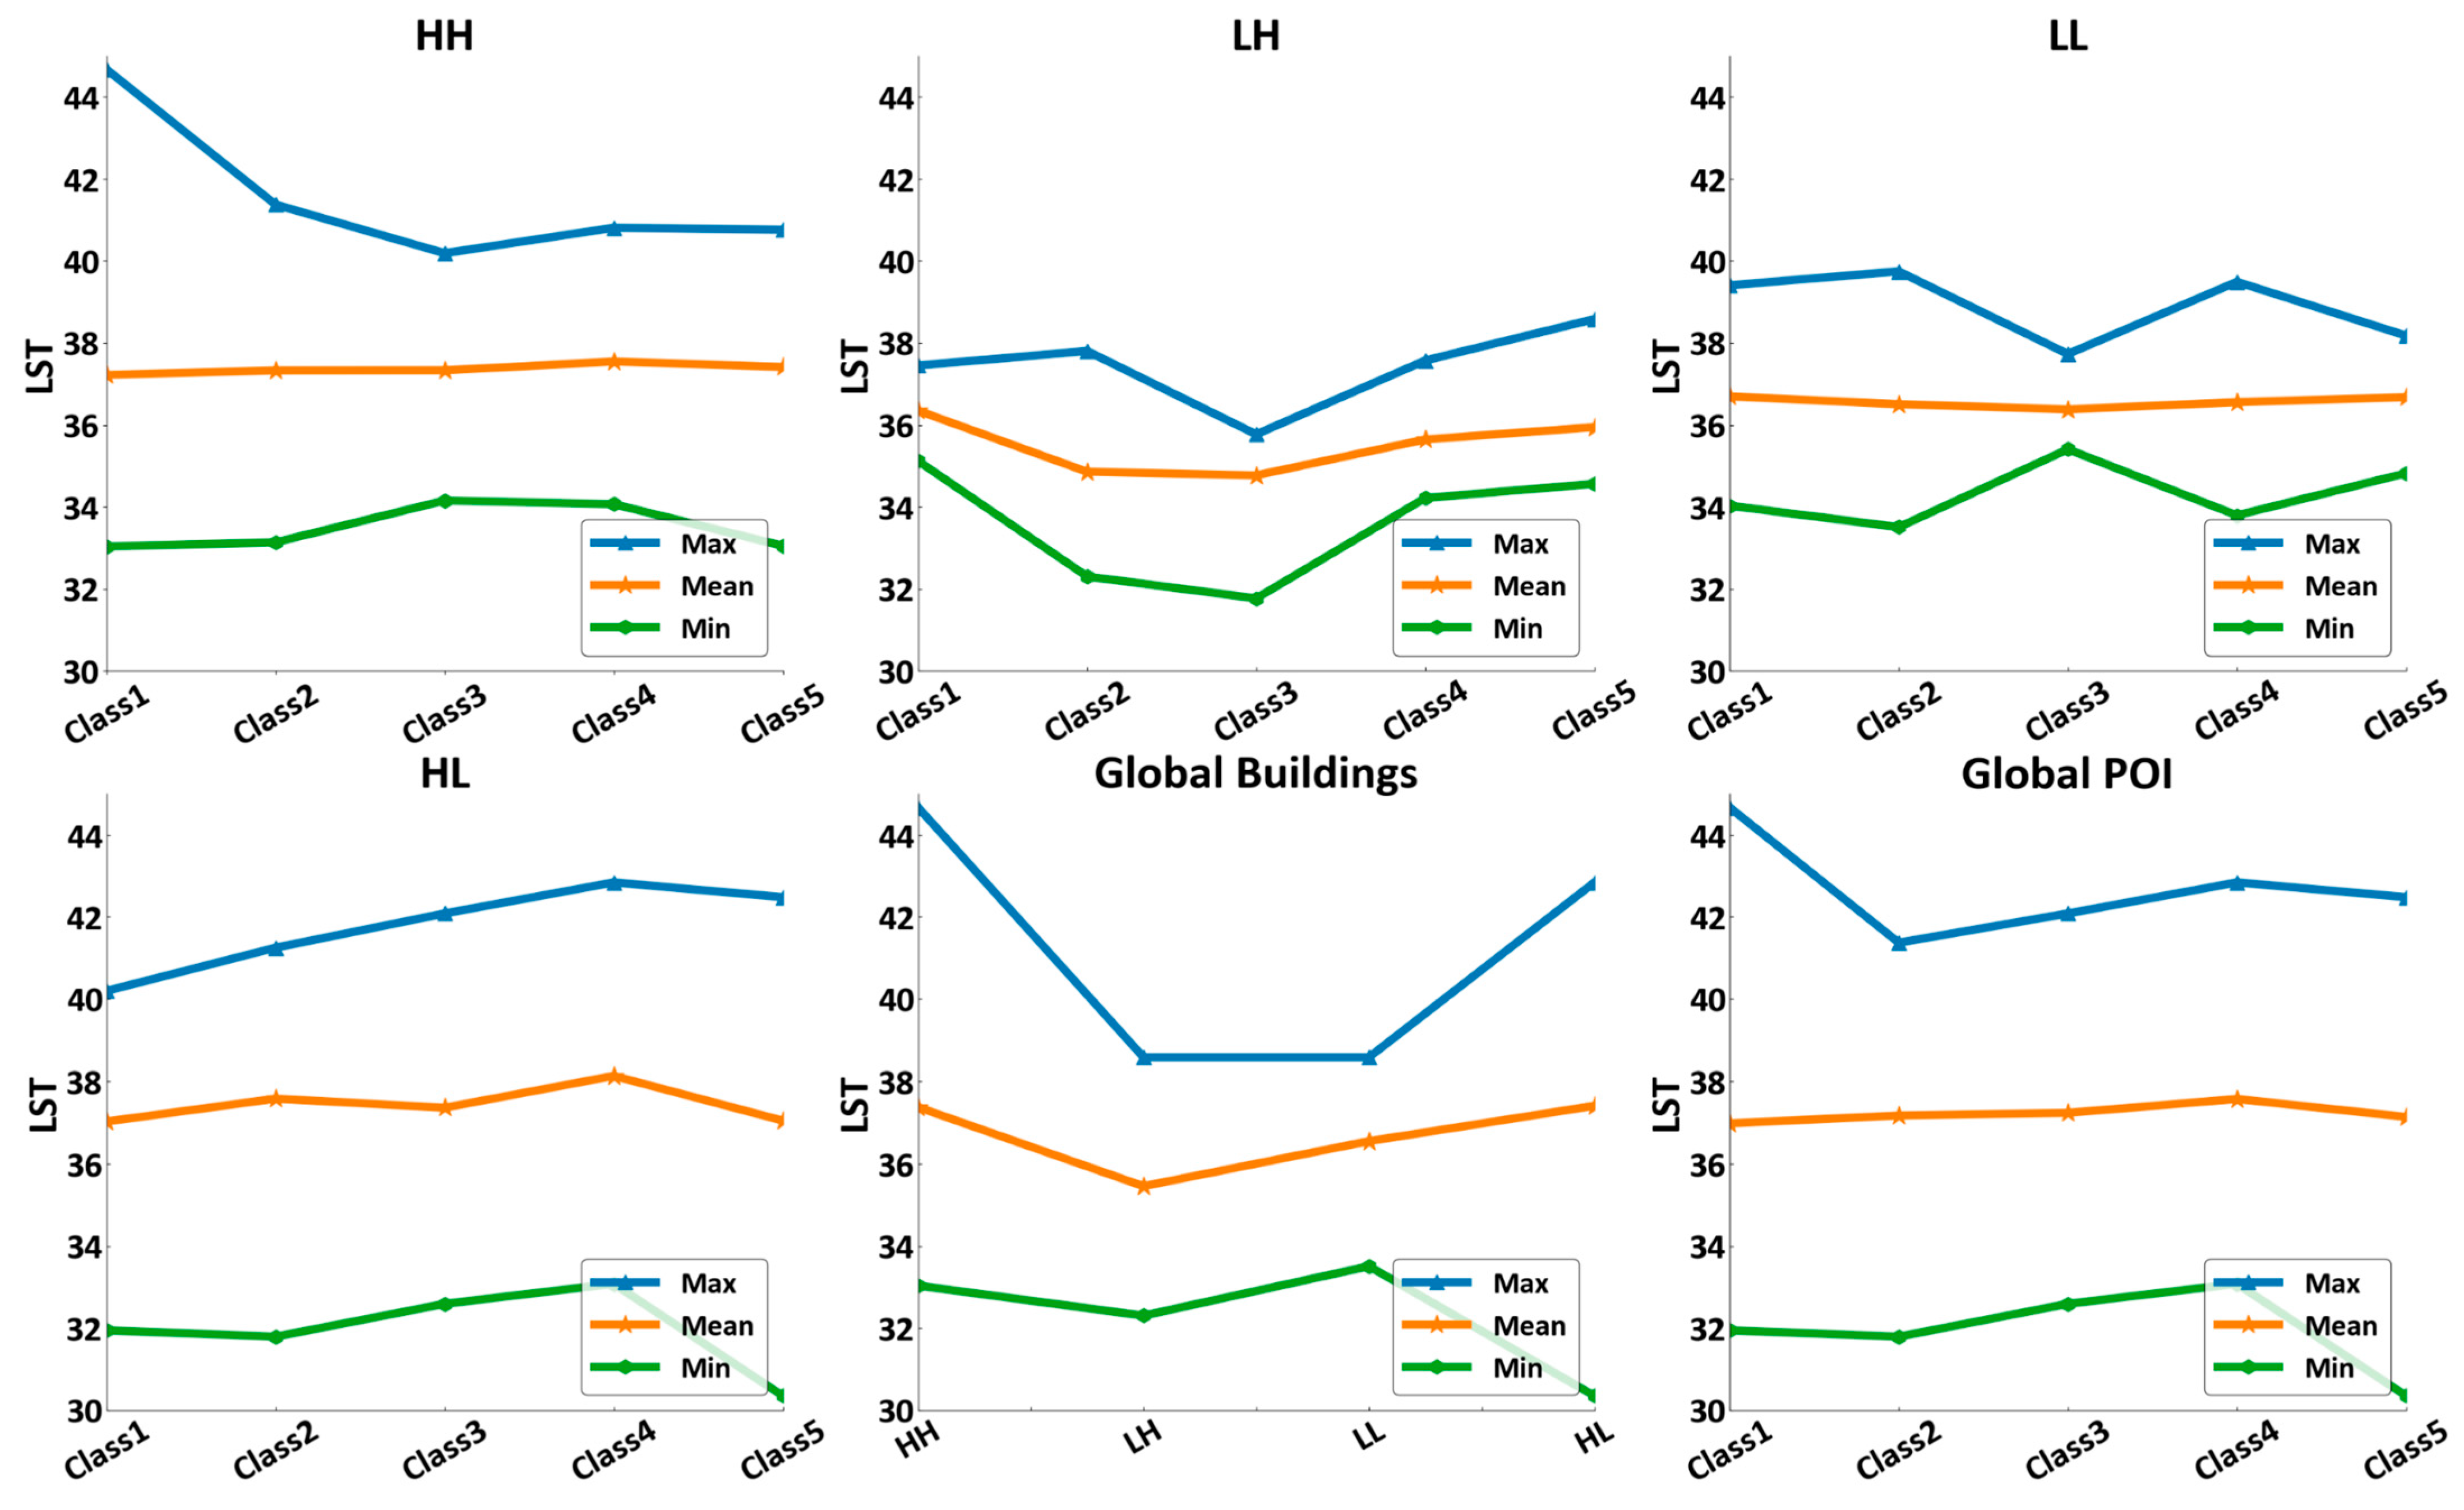
3.4. Results of LST Retrieval

We conducted a comprehensive analysis of land surface temperature (LST) across various built environment patterns, and the results are presented in Figure 7. The analysis revealed that the impact of the built environment on the LST exhibited both local consistency and global variability, with significant spatial heterogeneity observed within blocks. In blocks predominantly characterized by transport and green space functions, the highest average LST of 37.3 °C was observed in contexts with high-density and high-height buildings. In contrast, the maximum temperature was generally less than 37 °C in the other built environment scenarios. In blocks with a commercial focus, the highest average LST, approaching 38 °C, was recorded in contexts with high-density but low-height buildings. Additionally, in transport and commercial areas, the lowest average LST of 35.2 °C was found in contexts with low-density and high-height buildings. This finding indicates that extreme high-temperature scenarios are more likely to occur in high-density high-height or high-density low-height building patterns.
From a functional area perspective, the probability of experiencing extremely high temperatures was significantly greater in transport blocks than in other functional areas. However, in most cases, except for high-density high-height scenarios, green space functional areas demonstrated effective cooling capabilities, mitigating the urban heat island effect. These findings not only highlight the complex influence of different built environments on LST but also underscore the crucial role of green spaces in regulating urban thermal environments, highlighting the importance of incorporating and designing green spaces in urban planning for improving thermal conditions and enhancing residents’ quality of life.

4. Discussion

4.1. Characteristics of LST in Blocks

There are similarities between the UHI effects in Beijing and those in other rapidly urbanizing cities. However, there are some notable differences in the intensity and distribution of UHI effects due to differences in urban form, climate, and historical development patterns [28]. In cities such as Los Angeles and Paris, the intensity of UHI effects tends to be greater in areas with less vegetation and more impervious surfaces, similar to our findings in Beijing [29,30,31]. However, the LST in these cities also shows more pronounced diurnal variations, with night-time temperatures remaining higher due to the heat retention properties of urban materials. In contrast, the LST in Beijing was more evenly distributed throughout the day, which may be due to the special climatic conditions and urban structure of Beijing [32]. In our study, we found that the role of water bodies in mitigating LST was more pronounced. Studies in cities such as Chicago and Wuhan have shown that proximity to water bodies can significantly reduce local temperatures [33,34]. While our study did not focus extensively on the effects of water bodies in Beijing, this area deserves further study, especially given that Beijing has several large rivers and several lakes [35]. A good urban design can also promote urban air circulation, reducing the frequency of air pollution and the intensity of UHIs. Cities such as Barcelona and New York have grid-like urban layouts that promote air circulation and reduce heat build-up, in contrast to Beijing’s more irregular and dense urban form [36,37]. This difference in urban form is likely to contribute to the higher intensity of UHIs in central Beijing, where narrow streets and high-rise buildings restrict air circulation and build heat [38].

4.2. Distribution of LST in Different Configurations of the Built Environment

LST is closely related to the configuration of the built environment [39]. LSTs are significantly greater in areas with a high density of buildings (e.g., business and transport blocks). This observation is consistent with the broader understanding that densely built environments are characterized by high use of impermeable materials and minimal vegetation [40]. Similar results have been reported in other megacities, such as Shanghai, where high-density urban centers tend to be the hottest areas due to similar environmental and infrastructural conditions [41]. The physical characteristics of the built environment, including the type of building materials, the density of buildings, and the extent of green space, can directly affect the thermal attributes of urban areas [42]. For example, impermeable surfaces such as asphalt and concrete have high thermal inertia, which means that they absorb and retain more heat, resulting in higher temperatures during the day and slower cooling at night. This phenomenon is particularly evident in Beijing’s Central Business District, where the combination of high-rise buildings and limited vegetation causes the LST to rise extremely rapidly [43]. In addition, the spatial layout of different land uses contributes to differences in UHI intensity across cities [44]. Commercial, transport, and industrial blocks, typically characterized by high building densities and limited green space, tend to be the hottest areas [45]. In contrast, residential areas, especially those with moderate building density and abundant vegetation, tend to be cooler [46]. This pattern has also been observed in other cities; for example, studies in Los Angeles and Paris have shown that residential areas with more green cover have lower temperatures than commercial or industrial blocks [29,30]. Our research also highlights the role of urban green spaces in mitigating UHIs. Beijing parks and other vegetation-rich areas were identified as urban cool islands that significantly reduce temperatures in the surrounding areas [47]. This finding is consistent with the results of numerous studies around the world that have highlighted the cooling effect of vegetation due to evapotranspiration and shading [48]. For example, studies in New York City and Melbourne have shown that urban parks can reduce local temperatures by several degrees, contributing to an overall reduction in the impact of hyperthermia in urban areas [36].

4.3. Implications for Urban Planning and Policy

As global temperatures continue to rise, UHI effects are likely to become more pronounced, exacerbating heat-related health risks and increasing the energy demand for cooling. Urban planners and policy makers need to take a proactive approach to incorporating UHI mitigation into long-term urban development planning [49,50]. This may include setting urban greening targets, implementing building codes that promote energy-efficient design, and investing in technologies that can improve the ability of urban infrastructure to cope with extreme heat events [51]. The important impact of green spaces on reducing UHIs emphasizes the need to incorporate more vegetation into urban design. Urban planners should prioritize the creation and maintenance of parks, green roofs and street trees, especially in built-up areas [52]. This approach not only mitigates UHIs but also improves urban biodiversity, air quality, and overall quality of life for residents [21]. Our research suggests that land use planning should consider the thermal properties of urban building materials. For example, the use of materials with higher albedo (reflectivity) can help reduce heat absorption in buildings and pavements, thereby lowering the overall temperature in urban areas [53]. Policies that encourage the use of cool roofs, reflective pavements, and other heat-reducing technologies are particularly effective in dealing with exceptionally high temperatures [54]. In addition, promoting mixed-use development with integrated green spaces through zoning regulations can help to distribute heat more evenly across the urban landscape and reduce the occurrence of extreme heat zones. This approach has been successfully implemented in cities such as Singapore, where strategic urban planning has decreased despite high levels of urbanization [55].

4.4. Limitations and Future Avenues

This study adopts the city block as the spatial unit for the analysis of the UHI index to investigate the main influencing factors of the LST under different functional areas and building patterns within the city and to propose measures to improve the urban thermal environment. First, the city block is the basic unit of the urban structure, and the irregular shape of the city block [56] significantly affects the seasonal LST in some cases, which may imply that the use of differently shaped spatial units has a potential impact on the study of the LST. Second, the study used LST data imaged at 10:52 a.m., but the daily maximum temperature occurred between 14:00 p.m. and 16:00 p.m., and the warming/cooling effect on urban landscapes during this time needs more attention [57]. Second, all available Landsat images should be utilized to obtain the mean LST to improve the representativeness of the results. In addition, this study used a road generation analysis unit, a method that ignores the warming effect of major roads. Roads tend to absorb solar radiation, which increases their temperature anomalously, and whether this localized warmer air mass in the high-temperature zone is transferred into pavement blocks, which affects the internal temperature of the blocks, remains to be explored.

5. Conclusions

In this study, we take the Fifth Ring Road of Beijing as an example, invert the urban LST on the basis of multisource spatial data, characterize the built environment, and use k-means cluster analysis to explore the main influencing factors of the LST under different functional zones and building modes within the city, as well as the spatial role of the built environment in relation to the urban LST. Our main findings are as follows: The UHI effect occurs to varying degrees over a large area of the study area, and these UHI areas are mainly concentrated in the southwestern part of the city, forming a large contiguous area between the second and fifth ring roads. We used k-means cluster analysis to classify the POI data into five classes, of which Class 1 was dominated by transport blocks, Class 3 by commercial blocks, and Class 5 by green space blocks, with a clustering index of 0.38. Compared with the three classifications described above, the dominant sites in Class 2 and Class 4 are not obvious. We superimposed the results of the above two clustering analyses to obtain the results of pattern recognition of the built environment in the study area and classified the spatial pattern of the built environment in the city into 20 types. The blocks of the HH-class 2 type are more numerous and distributed in a ring shape on the periphery of the second ring road. The neighborhoods of the HH class 5 type have a larger area and are located mainly in the northern part of the study area. The blocks of the HL-class 2 type are less numerous but larger and are located mainly in the northern part of the study area. And the largest blocks distributed in the western part of the study area. HL-Class3 and HL-Class4 are the two types of blocks that are fewer in number and are mainly distributed in the central part of the study area. The remaining types of blocks are small in number and area, and their distribution is not centralized. This study analyses the LST under different scenarios on the basis of the above built environment patterns, and the results reveal that extreme high-temperature scenarios often occur under building patterns that are in the HH and HL categories. From the perspective of the functional areas, the probability of extremely high temperatures occurring in the transport block is much greater than that in the other functional areas, except in the HH scenario, where the greenfield functional areas play a very important role in reducing the temperature.

Author Contributions

Conceptualization, J.X.; methodology, Y.L.; software, J.C.; validation, J.X., and Y.L.; writing—original draft preparation, J.X., and J.C.; writing—review and editing, Y.L.; visualization, Y.L., and J.C.; supervision, J.C.; project administration, J.C.; funding acquisition, Y.L. All authors have read and agreed to the published version of the manuscript.

Funding

This research was funded by “LinYi association for science and technology Research topic (No. 2023kxy051)”, “LinYi association for science and technology Research topic (No. 2022kxy057)” and “Linyi Overall Urban Design Project (No. 2022110031016728)”.

Institutional Review Board Statement

Not applicable.

Informed Consent Statement

Not applicable.

Data Availability Statement

The availability of data and materials is based on personal requests.

Acknowledgments

I would like to express my deepest gratitude to everyone who supported and contributed to this work.

Conflicts of Interest

The authors declare that they have no competing interests.

References

  1. Kardinal Jusuf, S.; Wong, N.H.; Hagen, E.; Anggoro, R.; Hong, Y. The influence of land use on the urban heat island in Singapore. Habitat Int. 2007, 31, 232–242. [Google Scholar] [CrossRef]
  2. Kikegawa, Y.; Genchi, Y.; Kondo, H.; Hanaki, K. Impacts of city-block-scale countermeasures against urban heat-island phenomena upon a building’s energy-consumption for air-conditioning. Appl. Energy 2006, 83, 649–668. [Google Scholar] [CrossRef]
  3. Li, J.; Song, C.; Cao, L.; Zhu, F.; Meng, X.; Wu, J. Impacts of landscape structure on surface urban heat islands: A case study of Shanghai, China. Remote Sens. Environ. 2011, 115, 3249–3263. [Google Scholar] [CrossRef]
  4. Li, X.; Zhou, W.; Ouyang, Z.; Xu, W.; Zheng, H. Spatial pattern of greenspace affects land surface temperature: Evidence from the heavily urbanized Beijing metropolitan area, China. Landsc. Ecol. 2012, 27, 887–898. [Google Scholar] [CrossRef]
  5. Kong, F.; Yin, H.; James, P.; Hutyra, L.R.; He, H.S. Effects of spatial pattern of greenspace on urban cooling in a large metropolitan area of eastern China. Landsc. Urban Plan. 2014, 128, 35–47. [Google Scholar] [CrossRef]
  6. Liu, Y.; Peng, J.; Wang, Y. Efficiency of landscape metrics characterizing urban land surface temperature. Landsc. Urban Plan. 2018, 180, 36–53. [Google Scholar] [CrossRef]
  7. Kuang, W.; Liu, Y.; Dou, Y.; Chi, W.; Chen, G.; Gao, C.; Yang, T.; Liu, J.; Zhang, R. What are hot and what are not in an urban landscape: Quantifying and explaining the land surface temperature pattern in Beijing, China. Landsc. Ecol. 2014, 30, 357–373. [Google Scholar] [CrossRef]
  8. Silva, J.S.; da Silva, R.M.; Santos, C.A.G. Spatiotemporal impact of land use/land cover changes on urban heat islands: A case study of Paço do Lumiar, Brazil. Build. Environ. 2018, 136, 279–292. [Google Scholar] [CrossRef]
  9. Oke, T.R. The energetic basis of the urban heat island. Q. J. R. Meteorol. Soc. 1982, 108, 1–24. [Google Scholar] [CrossRef]
  10. Voogt, J.A.; Oke, T.R. Thermal remote sensing of urban climates. Remote Sens. Environ. 2003, 86, 370–384. [Google Scholar] [CrossRef]
  11. He, C.; Zhang, Q. High-resolution urban climate modeling: Advances and applications. Climate 2021, 9, 51. [Google Scholar]
  12. Huang, Y.J.; Hsu, Y.H.; Chen, Y.W.; Wang, W.Y.; Chang, C.C. Urban green space and its effect on the urban heat island effect in Taipei City, Taiwan. Landsc. Urban Plan. 2011, 102, 24–32. [Google Scholar]
  13. Wang, X.; Liu, G.; Zhang, N.; Liu, H.; Tang, X.; Lyu, M.; Meng, H. Effects of cooling roofs on mitigating the urban heat island and human thermal stress in the Pearl River Delta, China. Build. Environ. 2023, 245, 110880. [Google Scholar] [CrossRef]
  14. Deilami, K.; Kamruzzaman, M.; Liu, Y. Urban heat island effect: A systematic review of spatiotemporal factors, data, methods, and mitigation measures. Int. J. Appl. Earth Obs. Geoinf. 2018, 67, 30–42. [Google Scholar] [CrossRef]
  15. Hashem Akbari, S.D.; Dorsano, S.; Huang, Y.J.; Winnett, S. Cooling Our Communities: A Guidebook on Tree Planting and Light-Colored Surfacing; Environmental Protection Agency: Washington, DC, USA, 1992. [Google Scholar]
  16. Xu, Y.; Ren, C.; Ma, P.; Ho, J.; Wang, W.; Lau, K.K.-L.; Lin, H.; Ng, E. Urban morphology detection and computation for urban climate research. Landsc. Urban Plan. 2017, 167, 212–224. [Google Scholar] [CrossRef]
  17. Hatvani-Kovacs, G.; Belusko, M.; Skinner, N.; Pockett, J.; Boland, J. Heat stress risk and resilience in the urban environment. Sustain. Cities Soc. 2016, 26, 278–288. [Google Scholar] [CrossRef]
  18. Yang, X.; Peng, L.L.H.; Jiang, Z.; Chen, Y.; Yao, L.; He, Y.; Xu, T. Impact of urban heat island on energy demand in buildings: Local climate zones in Nanjing. Appl. Energy 2020, 260, 114279. [Google Scholar] [CrossRef]
  19. Li, X.; Zhou, Y.; Yu, S.; Jia, G.; Li, H.; Li, W. Urban heat island impacts on building energy consumption: A review of approaches and findings. Energy 2019, 174, 407–419. [Google Scholar] [CrossRef]
  20. Wu, B.; Zhang, Y.; Wang, Y.; He, Y.; Wang, J.; Wu, Y.; Lin, X.; Wu, S. Mitigation of urban heat island in China (2000–2020) through vegetation-induced cooling. Sustain. Cities Soc. 2024, 112, 105599. [Google Scholar] [CrossRef]
  21. Lu, Y.; Chen, R.; Chen, B.; Wu, J. Inclusive green environment for all? An investigation of spatial access equity of urban green space and associated socioeconomic drivers in China. Landsc. Urban Plan. 2024, 241, 104926. [Google Scholar] [CrossRef]
  22. Cilek, A.; Unal, M.; Middel, A. The effects of 2-D and 3-D urban landscape metrics on mean radiant temperature in hot-arid Phoenix and Tempe, Arizona, USA. Sustain. Cities Soc. 2024, 101, 105116. [Google Scholar] [CrossRef]
  23. Barsi, J.A.; Barker, J.L.; Schott, J.R. An Atmospheric Correction Parameter Calculator for a Single Thermal Band Earth-Sensing Instrument. In Proceedings of the 2003 IEEE International Geoscience and Remote Sensing Symposium, Toulouse, France, 21–25 July 2003. [Google Scholar]
  24. Alavipanah, S.; Schreyer, J.; Haase, D.; Lakes, T.; Qureshi, S. The effect of multidimensional indicators on urban thermal conditions. J. Clean. Prod. 2018, 177, 115–123. [Google Scholar] [CrossRef]
  25. Berger, C.; Rosentreter, J.; Voltersen, M.; Baumgart, C.; Schmullius, C.; Hese, S. Spatiotemporal analysis of the relationship between 2D/3D urban site characteristics and land surface temperature. Remote Sens. Environ. 2017, 193, 225–243. [Google Scholar] [CrossRef]
  26. Luo, Y.; Peng, S.; Jiang, Y.; Feng, Y.; Khan, S.; Han, B. Analysis of urban heat island effect using k-means clustering. In Proceedings of the 2nd International Conference on Information Science and Engineering, Hangzhou, China, 4–6 December 2010. [Google Scholar]
  27. Acosta, M.P.; Vahdatikhaki, F.; Santos, J.; Jarro, S.P.; Dorée, A.G. Data-driven analysis of Urban Heat Island phenomenon based on street typology. Sustain. Cities Soc. 2024, 101, 105170. [Google Scholar] [CrossRef]
  28. Liu, J.; Zhang, S.; Yin, L.; Li, B.; Zhang, B. Exploring the relationship between seasonal variations of land surface temperature and urban morphological factors in complex urban areas. Environ. Sci. Pollut. Res. 2023, 30, 59861–59876. [Google Scholar] [CrossRef]
  29. Lemonsu, A.; Viguié, V.; Daniel, M.; Masson, V. Vulnerability to heat waves: Impact of urban expansion scenarios on urban heat island and heat stress in Paris (France). Urban Clim. 2015, 14, 586–605. [Google Scholar] [CrossRef]
  30. Taha, H. Characterization of Urban Heat and Exacerbation: Development of a Heat Island Index for California. Climate 2017, 5, 59. [Google Scholar] [CrossRef]
  31. Zhou, B.; Rybski, D.; Kropp, J.P. On the statistics of urban heat island intensity. Geophys. Res. Lett. 2013, 40, 5486–5491. [Google Scholar] [CrossRef]
  32. Zhao, K.; Ning, Z.; Xu, C.; Zhao, X.; Huang, X. How do driving factors affect the diurnal variation of land surface temperature across different urban functional blocks? A case study of Xi′an, China. Sustain. Cities Soc. 2024, 114, 105738. [Google Scholar] [CrossRef]
  33. Alfraihat, R.; Mulugeta, G.; Gala, T.S. Ecological Evaluation of Urban Heat Island in Chicago City, USA. J. Atmos. Pollut. 2016, 4, 23–29. [Google Scholar] [CrossRef]
  34. Chen, H.; Deng, Q.; Zhou, Z.; Ren, Z.; Shan, X. Influence of land cover change on spatiotemporal distribution of urban heat island —A case in Wuhan main urban area. Sustain. Cities Soc. 2022, 79, 103715. [Google Scholar] [CrossRef]
  35. Cao, B.; Chen, Q.; Du, M.; Cheng, Q.; Li, Y.; Liu, R. Simulation Analysis of the Cooling Effect of Urban Water Bodies on the Local Thermal Environment. Water 2022, 14, 3091. [Google Scholar] [CrossRef]
  36. Shaker, R.R.; Altman, Y.; Deng, C.; Vaz, E.; Forsythe, K.W. Investigating urban heat island through spatial analysis of New York City streetscapes. J. Clean. Prod. 2019, 233, 972–992. [Google Scholar] [CrossRef]
  37. Hidalgo García, D.; Arco Díaz, J. Mitigation and Resilience of Local Climatic Zones to the Effects of Extreme Heat: Study on the City of Barcelona (Spain). Urban Sci. 2023, 7, 102. [Google Scholar] [CrossRef]
  38. Cui, Y.; Yan, D.; Hong, T.; Ma, J. Temporal and spatial characteristics of the urban heat island in Beijing and the impact on building design and energy performance. Energy 2017, 130, 286–297. [Google Scholar] [CrossRef]
  39. Zhang, K.; Wang, R.; Shen, C.; Da, L. Temporal and spatial characteristics of the urban heat island during rapid urbanization in Shanghai, China. Environ. Monit. Assess. 2009, 169, 101–112. [Google Scholar] [CrossRef]
  40. Yu, X.; Liu, Y.; Zhang, Z.; Xiao, R. Influences of buildings on urban heat island based on 3D landscape metrics: An investigation of China’s 30 megacities at micro grid-cell scale and macro city scale. Landsc. Ecol. 2021, 36, 2743–2762. [Google Scholar] [CrossRef]
  41. Zeng, P.; Zong, C.; Duan, Z.; Wei, X. Exploring the spatial interplay between built-up environments and surface urban heat island phenomena in the main urban area of Shanghai. Energy Build. 2023, 301, 113739. [Google Scholar] [CrossRef]
  42. Huang, H.; Yang, H.; Chen, Y.; Chen, T.; Bai, L.; Peng, Z.-R. Urban green space optimization based on a climate health risk appraisal–A case study of Beijing city, China. Urban For. Urban Green. 2021, 62, 127154. [Google Scholar] [CrossRef]
  43. Li, T.; Huang, X.; Guo, H.; Hong, T. Contribution and Marginal Effects of Landscape Patterns on Thermal Environment: A Study Based on the BRT Model. Buildings 2024, 14, 2388. [Google Scholar] [CrossRef]
  44. Kim, S.W.; Brown, R.D. Urban heat island (UHI) intensity and magnitude estimations: A systematic literature review. Sci. Total Environ. 2021, 779, 146389. [Google Scholar] [CrossRef] [PubMed]
  45. Ke, X.; Men, H.; Zhou, T.; Li, Z.; Zhu, F. Variance of the impact of urban green space on the urban heat island effect among different urban functional zones: A case study in Wuhan. Urban For. Urban Green. 2021, 62, 127159. [Google Scholar] [CrossRef]
  46. Tang, L.; Zhan, Q.; Fan, Y.; Liu, H.; Fan, Z. Exploring the impacts of greenspace spatial patterns on land surface temperature across different urban functional zones: A case study in Wuhan metropolitan area, China. Ecol. Indic. 2023, 146, 109787. [Google Scholar] [CrossRef]
  47. Liao, W.; Cai, Z.; Feng, Y.; Gan, D.; Li, X. A simple and easy method to quantify the cool island intensity of urban greenspace. Urban For. Urban Green. 2021, 62, 127173. [Google Scholar] [CrossRef]
  48. Marando, F.; Heris, M.P.; Zulian, G.; Udías, A.; Mentaschi, L.; Chrysoulakis, N.; Parastatidis, D.; Maes, J. Urban heat island mitigation by green infrastructure in European Functional Urban Areas. Sustain. Cities Soc. 2022, 77, 103564. [Google Scholar] [CrossRef]
  49. Kim, H.; Gu, D.; Kim, H.Y. Effects of Urban Heat Island mitigation in various climate zones in the United States. Sustain. Cities Soc. 2018, 41, 841–852. [Google Scholar] [CrossRef]
  50. Mentaschi, L.; Duveiller, G.; Zulian, G.; Corbane, C.; Pesaresi, M.; Maes, J.; Stocchino, A.; Feyen, L. Global long-term mapping of surface temperature shows intensified intracity urban heat island extremes. Glob. Environ. Chang. 2022, 72, 102441. [Google Scholar] [CrossRef]
  51. Park, J.; Kim, J.-H.; Lee, D.K.; Park, C.Y.; Jeong, S.G. The influence of small green space type and structure at the street level on urban heat island mitigation. Urban For. Urban Green. 2017, 21, 203–212. [Google Scholar] [CrossRef]
  52. Xu, C.; Chen, G.; Huang, Q.; Su, M.; Rong, Q.; Yue, W.; Haase, D. Can improving the spatial equity of urban green space mitigate the effect of urban heat islands? An empirical study. Sci. Total Environ. 2022, 841, 156687. [Google Scholar] [CrossRef] [PubMed]
  53. Stache, E.; Schilperoort, B.; Ottelé, M.; Jonkers, H.M. Comparative analysis in thermal behavior of common urban building materials and vegetation and consequences for urban heat island effect. Build. Environ. 2022, 213, 108489. [Google Scholar] [CrossRef]
  54. Costanzo, V.; Evola, G.; Marletta, L. Energy savings in buildings or UHI mitigation? Comparison between green roofs and cool roofs. Energy Build. 2016, 114, 247–255. [Google Scholar] [CrossRef]
  55. Sanchez, B.; Roth, M.; Patel, P.; Simón-Moral, A. Application of a Semi-Empirical Approach to Map Maximum Urban Heat Island Intensity in Singapore. Sustainability 2023, 15, 12834. [Google Scholar] [CrossRef]
  56. Yao, L.; Li, T.; Xu, M.; Xu, Y. How the landscape features of urban green space impact seasonal land surface temperatures at a city-block-scale: An urban heat island study in Beijing, China. Urban For. Urban Green. 2020, 52, 126704. [Google Scholar] [CrossRef]
  57. Wang, C.; Wang, Z.-H.; Wang, C.; Myint, S.W. Environmental cooling provided by urban trees under extreme heat and cold waves in U.S. cities. Remote Sens. Environ. 2019, 227, 28–43. [Google Scholar] [CrossRef]
Figure 1. The study area and basic data.
Atmosphere 15 01200 g001
Figure 2. Research framework.
Atmosphere 15 01200 g002
Figure 3. The clustering results of the urban built environment with the k-means algorithm. (Left): POI functionality clustering. (Right): Building characteristics clustering.
Atmosphere 15 01200 g003
Figure 4. Results of LST retrieval.
Atmosphere 15 01200 g004
Figure 5. Built environment measurement results.
Atmosphere 15 01200 g005
Figure 6. The results of the identification of patterns in urban built environments.
Atmosphere 15 01200 g006
Figure 7. LST analysis of different patterns.
Atmosphere 15 01200 g007
Disclaimer/Publisher’s Note: The statements, opinions and data contained in all publications are solely those of the individual author(s) and contributor(s) and not of MDPI and/or the editor(s). MDPI and/or the editor(s) disclaim responsibility for any injury to people or property resulting from any ideas, methods, instructions or products referred to in the content.

