Article

Concept of Sporadic E Monitoring Using Space-Based Low Power Multiple Beacon-Systems

1
TU Delft-Faculty of Aerospace Engineering, Kluyverweg 1, 2629 HS Delft, The Netherlands
2
Electronic Circuits and Systems, KU Leuven, Kleinhoefstraat 4, 2440 Geel, Belgium
3
Union of Belgian Radio-Amateurs, RST-VZW, 3800 Sint-Truiden, Belgium
*
Author to whom correspondence should be addressed.
Atmosphere 2024, 15(11), 1306; https://doi.org/10.3390/atmos15111306
Submission received: 24 September 2024 / Revised: 23 October 2024 / Accepted: 25 October 2024 / Published: 30 October 2024
(This article belongs to the Section Atmospheric Techniques, Instruments, and Modeling)

Abstract

:
Current monitoring systems to detect sporadic E use ground-based setups, ionosondes, and the network of GNSS satellites in order to assess the phenomenon of sporadic E. This paper aims to monitor sporadic E using a miniature space-based platform in an atypical way. The setup consists of multiple radio-amateur beacon systems aboard satellites, each having a specific modulation and transmission scheme. This Radio Amateur Beacon System for the Investigation of the Ionosphere (RABSII) is coupled to a GNSS receiver, revealing the location of the platform. Multiple beacon data streams are sequentially sent from a satellite platform towards the Earth. By receiving and comparing the Signal-to-Noise ratios of these streams using a dedicated ground-based radio-amateur network of receiving stations, the presence of sporadic E can be determined, and a location-based model can be built. The advantage of this miniaturized, low-power, low-cost instrument is its ability to be put on any satellite platform in the future in order to map sporadic E.

1. Introduction

The ionosphere is a layer of the upper atmosphere which is ionized by solar radiation [1]. It plays a role in atmospheric effects and forms the inner edge of the magnetosphere. It affects radio wave propagation and has practical importance for long-distance radio communication. The main effects of the ionosphere on radio propagation are reflection, refraction, and scattering [1].
One of these effects is linked to sporadic E, a temporary ionospheric radio propagation reflection phenomenon with a low prediction probability. The region in the Earth’s atmosphere in which these reflections can occur is around 100 to 120 km in altitude, with a horizontal extent between 2 and 100 km, moving at a horizontal speed of 20 to 130 m/s while having a thickness roughly between 0.6 and 5 km [2]. The sporadic E layer can last for several hours or even less [2]. Sporadic E can create interference for low-power communication devices as well as broadcasting services. On the other hand, the presence of a temporary reflection layer can be used for emergency communication purposes [3].
Currently, there is no clear explanation for the cause of this effect. Previous research has tried to link its occurrence to the 11-year solar cycle, but the results are inconclusive. In Europe, there appears to be a connection between the peak of sunspot activity and the occurrence of sporadic E. However, in other regions, the opposite appears to be true, with a decrease in sporadic E occurrences during times of high sunspot activity [4]. A possible explanation is linked to an eventual correlation between the formation of sporadic E and iron-magnesium meteor ablation located at around 100 to 140 km above the surface of the Earth [4,5].
The sporadic E phenomenon has been studied using multiple techniques, such as sounding rockets [6,7], ground-based instrumentation [8,9], ionosondes [10,11], space-based GNSS Radio Occultation (RO) [12,13], and even combinations of these techniques [14,15]. These methods all contribute to gaining a deeper understanding of the spatial and temporal behavior of sporadic E clouds, but they come with their specific disadvantages. Ground-based measurement techniques require expensive infrastructure and are limited to local observations. This is also the case for sounding rockets and ionosondes. Space-based measurements like GNSS ROs have global coverage, but they come with their specific drawbacks. The GNSS RO technique uses high GNSS frequencies (1557.42 MHz and 1227.60 MHz), which suffer from errors such as refraction, temperature errors, and water vapor influences [16]. This paper aims to research sporadic E at much lower frequencies in the 10 m band (28 MHz), as well as in the 6 m band (50 MHz) [3], using space-based beacon systems. Ground-based reception is globally covered by using widespread, readily available radio-amateur receiving stations [17,18]. This creates a small, low-cost, and low-power dedicated monitoring system which can be piggybacked onto any satellite platform. This paper describes the basic concept, as well as the design, building, and testing of such a prototype beacon system.

2. The Ionosphere and Sporadic E Reflections

The ionosphere, which is part of the Earth’s atmosphere, is generated by the radiation of the Sun and partially by cosmic rays [19]. Its dimensions range from 60 km to 1600 km [20]. The electrical properties of the ionosphere have a fundamental effect on radio propagation, linked to the intensity of the Sun’s radiation [20]. The ionosphere is formed by an intense process of ultraviolet light and X-rays derived from the Sun’s activity, which interact with the atoms and molecules in the atmosphere. Hence, free electrons and ions are generated, of which the intensity varies with height and the time of day/night [21].
The ionosphere can be divided into different layers based on altitude and varying electron density. These layers exist due to the differential absorption of solar radiation at different heights. A distinction can be made between D, E, and F layers (Figure 1).
The E layer extends from 100 to 125 km, and is present during day- and nighttime. The layer is relatively thin (5 to 10 km), is ionized by X-rays and UV radiation, and its variability is limited. Hence, the layer is unintermitted due to the slower recombination rate creating some residual ionization [22,23]. Inside the E layer, a specific phenomenon occurs, called sporadic E [24]. The height at which these temporary reflections take place is from 100 to 120 km [2]. Sporadic E can be observed at different frequencies, namely in the High Frequency HF (3–30 MHz), as well as in the Very High Frequency VHF (30–300 MHz) band [3].
The most common mechanism responsible for the formation of sporadic E is wind shear [24]. Wind shear can be described as the interaction between ftidal winds and the magnetic field of the Earth. This phenomenon occurs when horizontal wind patterns in the ionosphere generate areas where charged particles converge or diverge, leading to their accumulation in thin layers. This process is fully controlled by the dynamics of ions [25].
Another mechanism which contributes to the formation of sporadic E, especially in the polar regions, is linked to disturbances in magnetic activity and associated with the K-index [23]. Two possible interactions exist for auroral sporadic E; the eastward auroral electrojet and the westward auroral electrojet [26]. These interactions are connected to the electron density gradient, producing plasma instabilities in the E layer region.
Additionally, meteoric ablation can cause sporadic E to be formed [5]. Sporadic E formation is linked to meteor showers by different research, but no full confirmation has yet been found [5].
As indicated above, different mechanisms exist which can contribute to the formation of sporadic E. The exact contribution of each mechanism is still not fully understood [27]. Additionally, sporadic E causes signal propagation to deviate significantly from what is anticipated based on experience or computer propagation models, which often results in unforeseen long-distance propagation [3]. The concept of this paper adds an additional monitoring system in order to access sporadic E from space. If successful, this low-cost payload can be globally distributed onto multiple satellite platforms in order to have a fully functional monitoring system. Hence, a contribution can be made to existing models and the results can be used to verify prediction methods.

3. Sporadic E Monitoring System Design

From the discussion above, it is clear that further research on how the sporadic E layer is formed is necessary. It is still unclear how and to what extend each mechanism contributes to the formation of the sporadic E layer. Also, the temporal and spatial distribution of this layer needs further research.
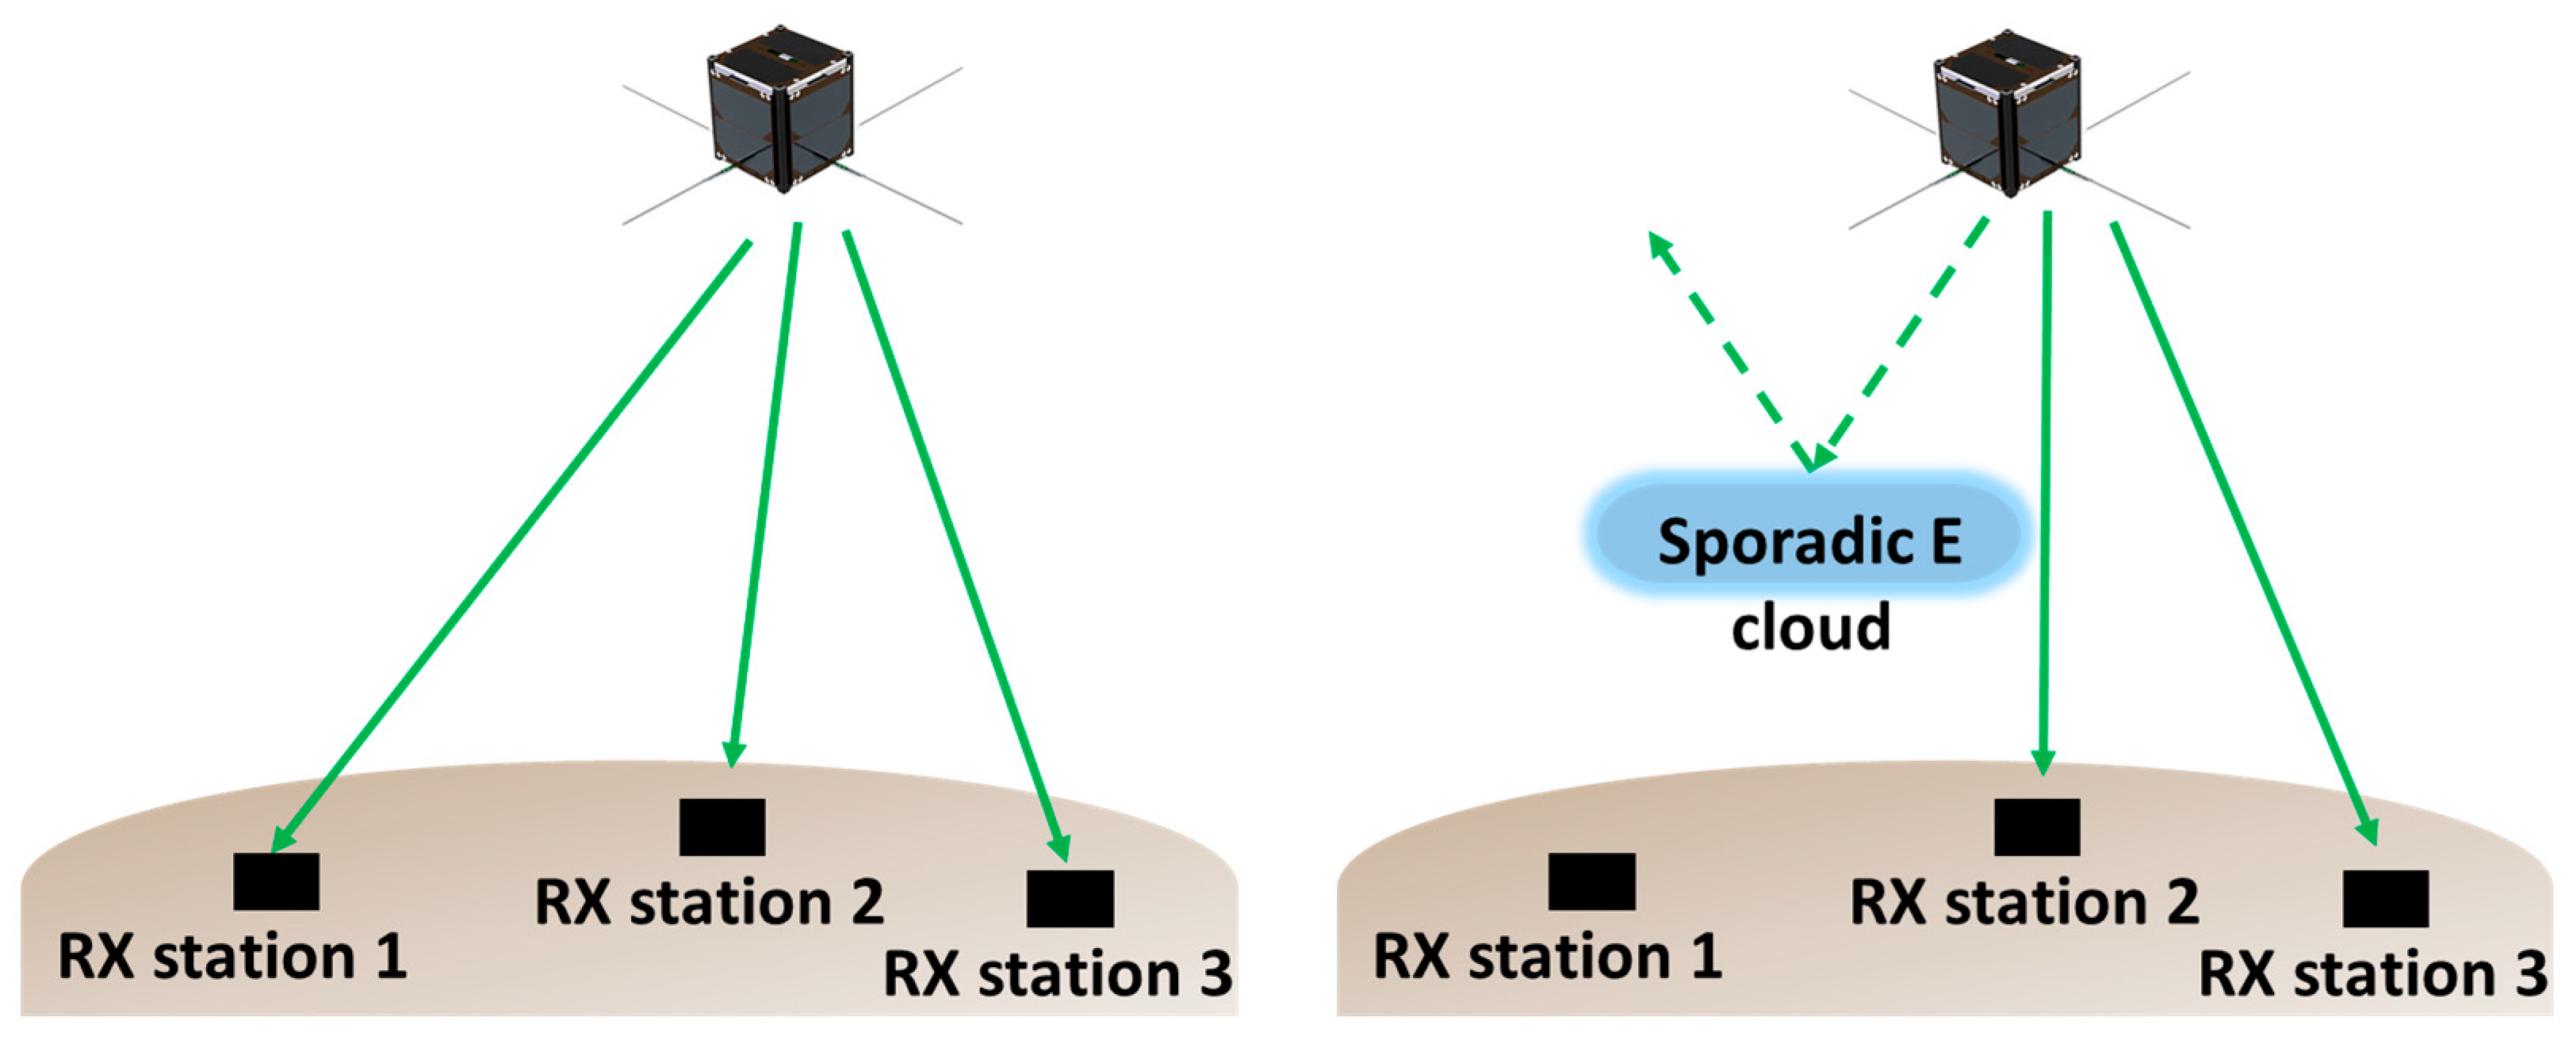
Currently, different ground-based monitoring systems exist in order to observe and analyze these temporal and spatial aspects of sporadic E, such as a ground-based observation network using the VHF band [28], using convolutional neural networks [29], using ground-based HF beacons [3], using ionosondes and incoherent scatter radars [30], and satellite-based observation techniques [31,32]. For satellite-based observations, certain techniques can be used to assess sporadic E, each with their pros and cons. The idea of this proposal is to work with a different approach, namely, to use a space-based multi-beacon system in combination with an established ground-based amateur-radio receiving network. The idea of the Radio Amateur Beacon System for the Investigation of the Ionosphere (RABSII) is to use two modulation schemes sending at different frequency bands, each having a dedicated Signal-to-Noise Ratio (SNR). A beacon system will sequentially transmit an FT4 and a CW (morse code) signal, while ground stations receive the transmitted signal. The analysis of sporadic E will be conducted in an atypical way, meaning the ground stations will continuously receive a signal (if the satellite is visible above the horizon) and conclude in this case that no sporadic E is present. As soon as a sporadic E layer appears, the beacon will be reflected by the sporadic E cloud, interrupting the reception of signals at the ground stations (Figure 2).
The described concept allows for the comparison of the SNR of the FT4 and CW signals, which can reveal information about ionospheric parameters such as electron density, refraction, and electron density gradients. The electron density influences the signal attenuation α [33,34] as follows:
α = 0 L σ e N s d s
in which σe is the electron collision cross-section, N(s) is the electron density measured along the propagation path (s) of the signal, and L is the length of the propagation path through the ionosphere. This attenuation can be linked to the SNR value [33,34] as follows:
S N R = P t P n e α
in which Pt is the transmitted power and Pn is the noise power.
Additionally, the SNR value can be linked to the electron density gradient [33,34] as follows:
S N R = P t P n e α f ( N e )
in which f ( N e ) is the electron density gradient on scintillation and diffraction. The former refers to the effect of signal scattering causing variations in the amplitude and phase of the signal, while the latter refers to the bending of the signal due to changes in atmospheric conditions.
Hence, by measuring the SNR value of the received signal at different frequencies, these ionospheric parameters can be modeled. Using a beacon system with two signals, each having a dedicated SNR value for detection at different frequencies, creates the possibility of analyzing ionospheric parameters in a different way.
Besides the E layer, the F layer can also influence incoming radio signals as such [23]. The two installed beacon systems transmitting at different frequencies enable the reception on ground of different signal levels, which enables the opportunity to check on the influences of other effects, like F layer behavior. Additionally, the obtained data can be compared with existing F layer models [35,36] in order to distinguish between sporadic E and F layer effects on the signals.
If in the future these beacon systems are piggybacked on multiple satellite platforms, this approach creates the possibility of worldwide mapping of sporadic E, using widespread receiving stations. These maps will contribute to the already existing monitoring systems for sporadic E and will enlarge the validation possibilities of existing models.
In the next paragraphs, the beacon payload, the spacecraft platform, and the radio-amateur ground-station monitoring system are described.

3.1. The Beacon Payload Design

In the radio-amateur community, multiple digital modes are used on the HF (3–30 MHz) and VHF (30–300 MHz)/UHF (0.3–3 GHz) bands, such as morse (CW), Packet Radio, Radio Teletype (RTTY), AMTOR, and PACTOR [37]. Recently, more advanced digital techniques are used as well, such as FT4, FT8, Phase Shift Keying 31 baud (PSK31), and JT65 [38,39]. All of these digital modes are developed taking into account a static transmitter receiver setup. For the monitoring of sporadic E aboard a satellite system, the situation is distinctly different. The satellite is moving in a Low Earth Orbit (LEO), while the receiving ground station is at a fixed location. Hence, a dedicated selection of a digital mode, robust enough to withstand this Doppler shift, has to be performed.
Sporadic E can be observed in the HF and VHF band. For this setup, two frequencies in the upper HF region are envisioned: one in the 10 m band (28 MHz) and another in the 6 m band (50 MHz). There will be two separate instruments designed: one for the 10 m band and another for the 6 m band. The satellite platform will consist of two separate satellites, each housing an individual instrument. At both frequencies, a sequential beacon of FT4 and CW modulation will be transmitted.
In order to trace the location of sporadic E, the position of the satellites has to be known and will be implemented inside the coding of the beacon system. For this, the radio-amateur Maidenhead Locator System will be used [37]. While moving at the horizon, the locator setting of the satellite will change, using an onboard GNSS receiver. This will allow the receiving station to determine the location of the beacon system and hence the location of the possible sporadic E cloud.

3.1.1. The FT4-Beacon System

Specifically for the monitoring of sporadic E on the 10 m band, FT4 is an interesting mode. This mode uses short transmit/receive sequences, which is preferrable in the case of a moving satellite. FT4 relies on synchronized time-based transmissions and structured messages utilizing lossless compression. Additionally, strong Forward Error Correction (FEC) is an essential component of FT4. The message always consists of 77 bits of user information and a 14-bit Cyclic Redundancy Check (CRC) in a 2500 Hz bandwidth. An additional 83 bits are added for FEC, resulting in a total codeword length of 174 bits [40]. FT4 is a transmitted burst of a 4-tone Continuous-Phase Frequency Shift Keying (CPFSK) over 5.04 s, synchronized at every 7.5 s starting at timestamp 0 of GNSS time. The tone patterns, known as Costas arrays [41], are necessary for synchronization purposes at the receiving side. The burst consists of 105 tones (frequencies), and each tone represents two bits. The transmitting function receives an array of 105 numbers. Each number has a value of 0, 1, 2, or 3.
0 = Lowest Frequency (LF)
1 = LF + 1 × 20.8333 Hz
2 = LF + 2 × 20.8333 Hz
3 = LF + 3 × 20.8333 Hz
The SNR of FT4 can go as low as −17.5 dB, depending on the decoding algorithm [40]. This creates opportunities to detect sporadic E in a detailed and robust way.

3.1.2. The CW-Beacon System

The Continuous Wave (CW)-beacon is a purely analog mode, compared to the digital FT4-mode. In CW mode, information, in essence morse code, is transmitted using a simple on-off keying of the RF-signal. Hence, messages consist of dots (short in duration) and dashes (long in duration) representing letters and numbers. In CW, only a limited bandwidth of 100 Hz is used. Typical SNR values of −1 dB can be decoded, depending on the filter setting and setup of the receiving station on the ground [37].
By using two modulation systems at different frequencies, each with their dedicated SNR values during reception, a comparison can be made between the two signals. The receiving network on the ground for the reception of CW can detect SNR values as low as −1 dB, while for FT4, this is as low as −17.5 dB. Said in a different way, a comparison is possible between a low-power signal (CW) and a very-low-power signal (FT4). Based on these levels, FT4 is detectable below the noise level, while CW needs a higher amplitude signal. Consequently, if reception of FT4 is possible, but not of CW, the intensity of the sporadic E cloud is high. If both modulation schemes are received, it means the intensity of the sporadic E cloud is lower. This permits a comparison between both signal levels, enabling an alternative way of building the sporadic E model.
The combination of FT4 and CW as a beacon setup consists of alternating the FT4 and CW signal in a periodic transmission scheme. From timestamp 0 s to 15 s, FT4 will be transmitted. Additionally, CW is activated for 15 s. This sequence is determined by the mission scenario aboard the satellite and also depends on the available power and other payloads onboard the satellite.

3.2. Spacecraft Platform Design

This compact and low-power instrument can be carried by any satellite, including very small platforms like PocketQubes, measuring 5 × 5 × 5 cm for 1 unit (1P), and having a mass of around 250 g [42]. They are cheaper to build and come with a lower launch cost compared to bigger platforms. As a technology demonstrator, TU Delft launched a 3P PocketQube, Delfi-PQ, on 14 January 2021 [43]. Implementing a new standard for its subsystem functionalities and components enabled the rapid development, design, and manufacturing of new subsystems and payloads in an educational environment, actively involving students in their Space Engineering Master program in satellite end-to-end development.
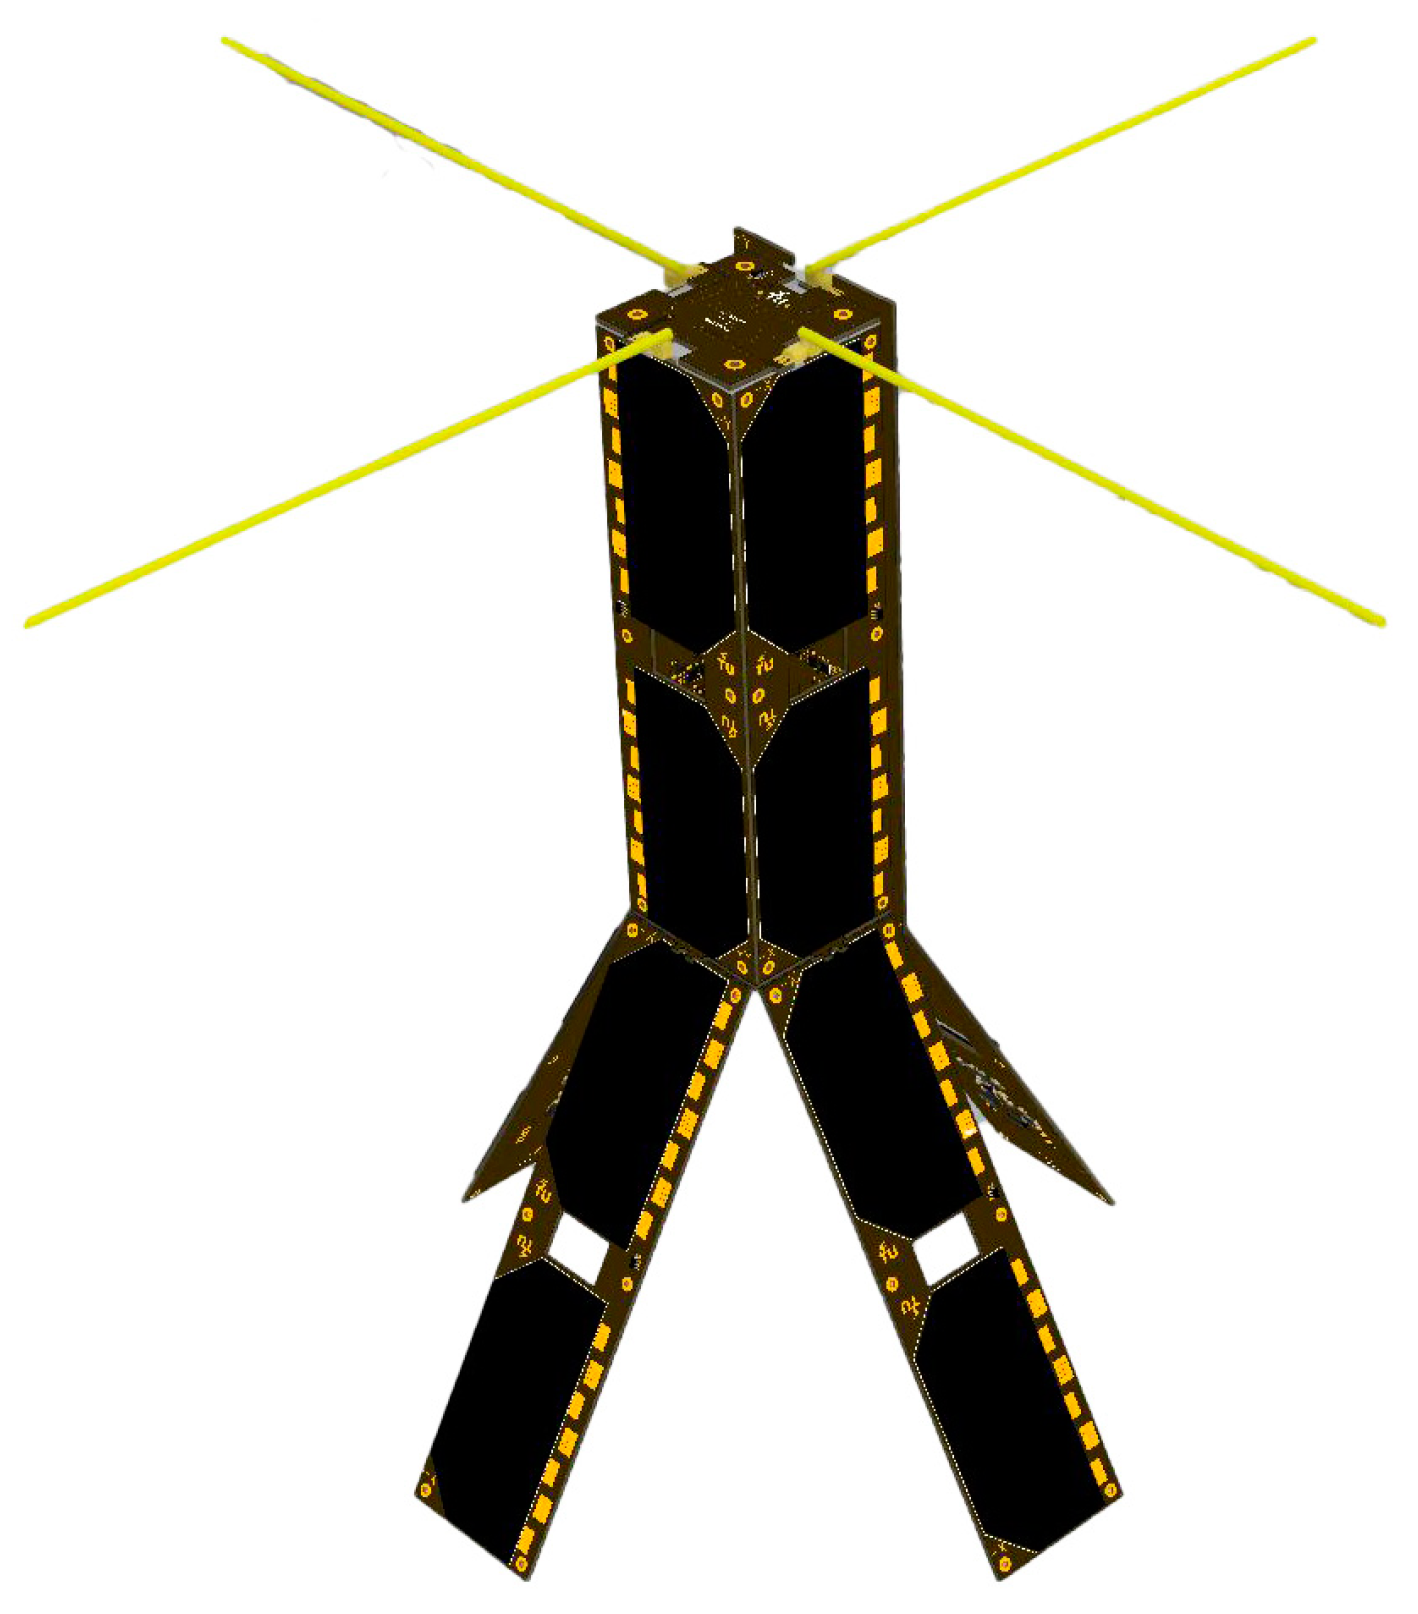
The instrument will be hosted on a platform derived from Delfi-PQ, implementing all the lessons learnt with that mission. This time, a pair of twin satellites will be launched, each equipped with laser reflectors, GNSS sensors, inter-satellite communication systems, and radiation sensors, along with the primary payload aimed at enabling atmospheric measurements through the fusion of data gathered by these sensors. The two satellites will fly in a formation, maintaining a maximum separation of 100 km to ensure they would be sampling the same atmospheric region. Station-keeping will be carried out using differential drag, achieved by actuating a set of spoilers on both the satellites to create “high” and “low” drag configurations, helping to develop expertise for future TU Delft satellite missions employing autonomous formation flying. Figure 3 illustrates one of the Delfi-Twin satellites in its high-drag configuration. The other drag configuration is achieved by reducing the angle of the deployed panels with respect to the direction of motion.
In order to fit inside a pico-satellite platform, the dimensions of the Printed Circuit Board (PCB) and its mass shall be limited. The future engineering model will be suitable for the PocketQube-sized PCB of 42 × 42 × 20 mm. The requirements for this engineering model are listed in Table 1 below but need additional adaptations in the frame of the developed PocketQube.

3.3. Radio-Amateur Ground-Station Monitoring System

In order to receive these beacons, the worldwide network of radio-amateurs can provide an automated global receiving system. Currently, several monitoring systems such as the Weak-Signal-Propagation-Reporter network [17] and the CW Reverse Beacon Network [18] exist and are fully operational to monitor propagation aspects. These networks are already used for space weather monitoring [44], which entails sporadic E monitoring.
The instrument will be designed to be used on two dedicated frequencies in the HF band: one in the 10 m band (28 MHz) and another in the 6 m band (50 MHz). For both frequencies, the radio-amateur receiving network can provide the necessary monitoring using sources such as OpenWebRX [45,46] and the Reverse Beacon Network [47].

4. Preliminary Design and Results

4.1. Beacon Hardware

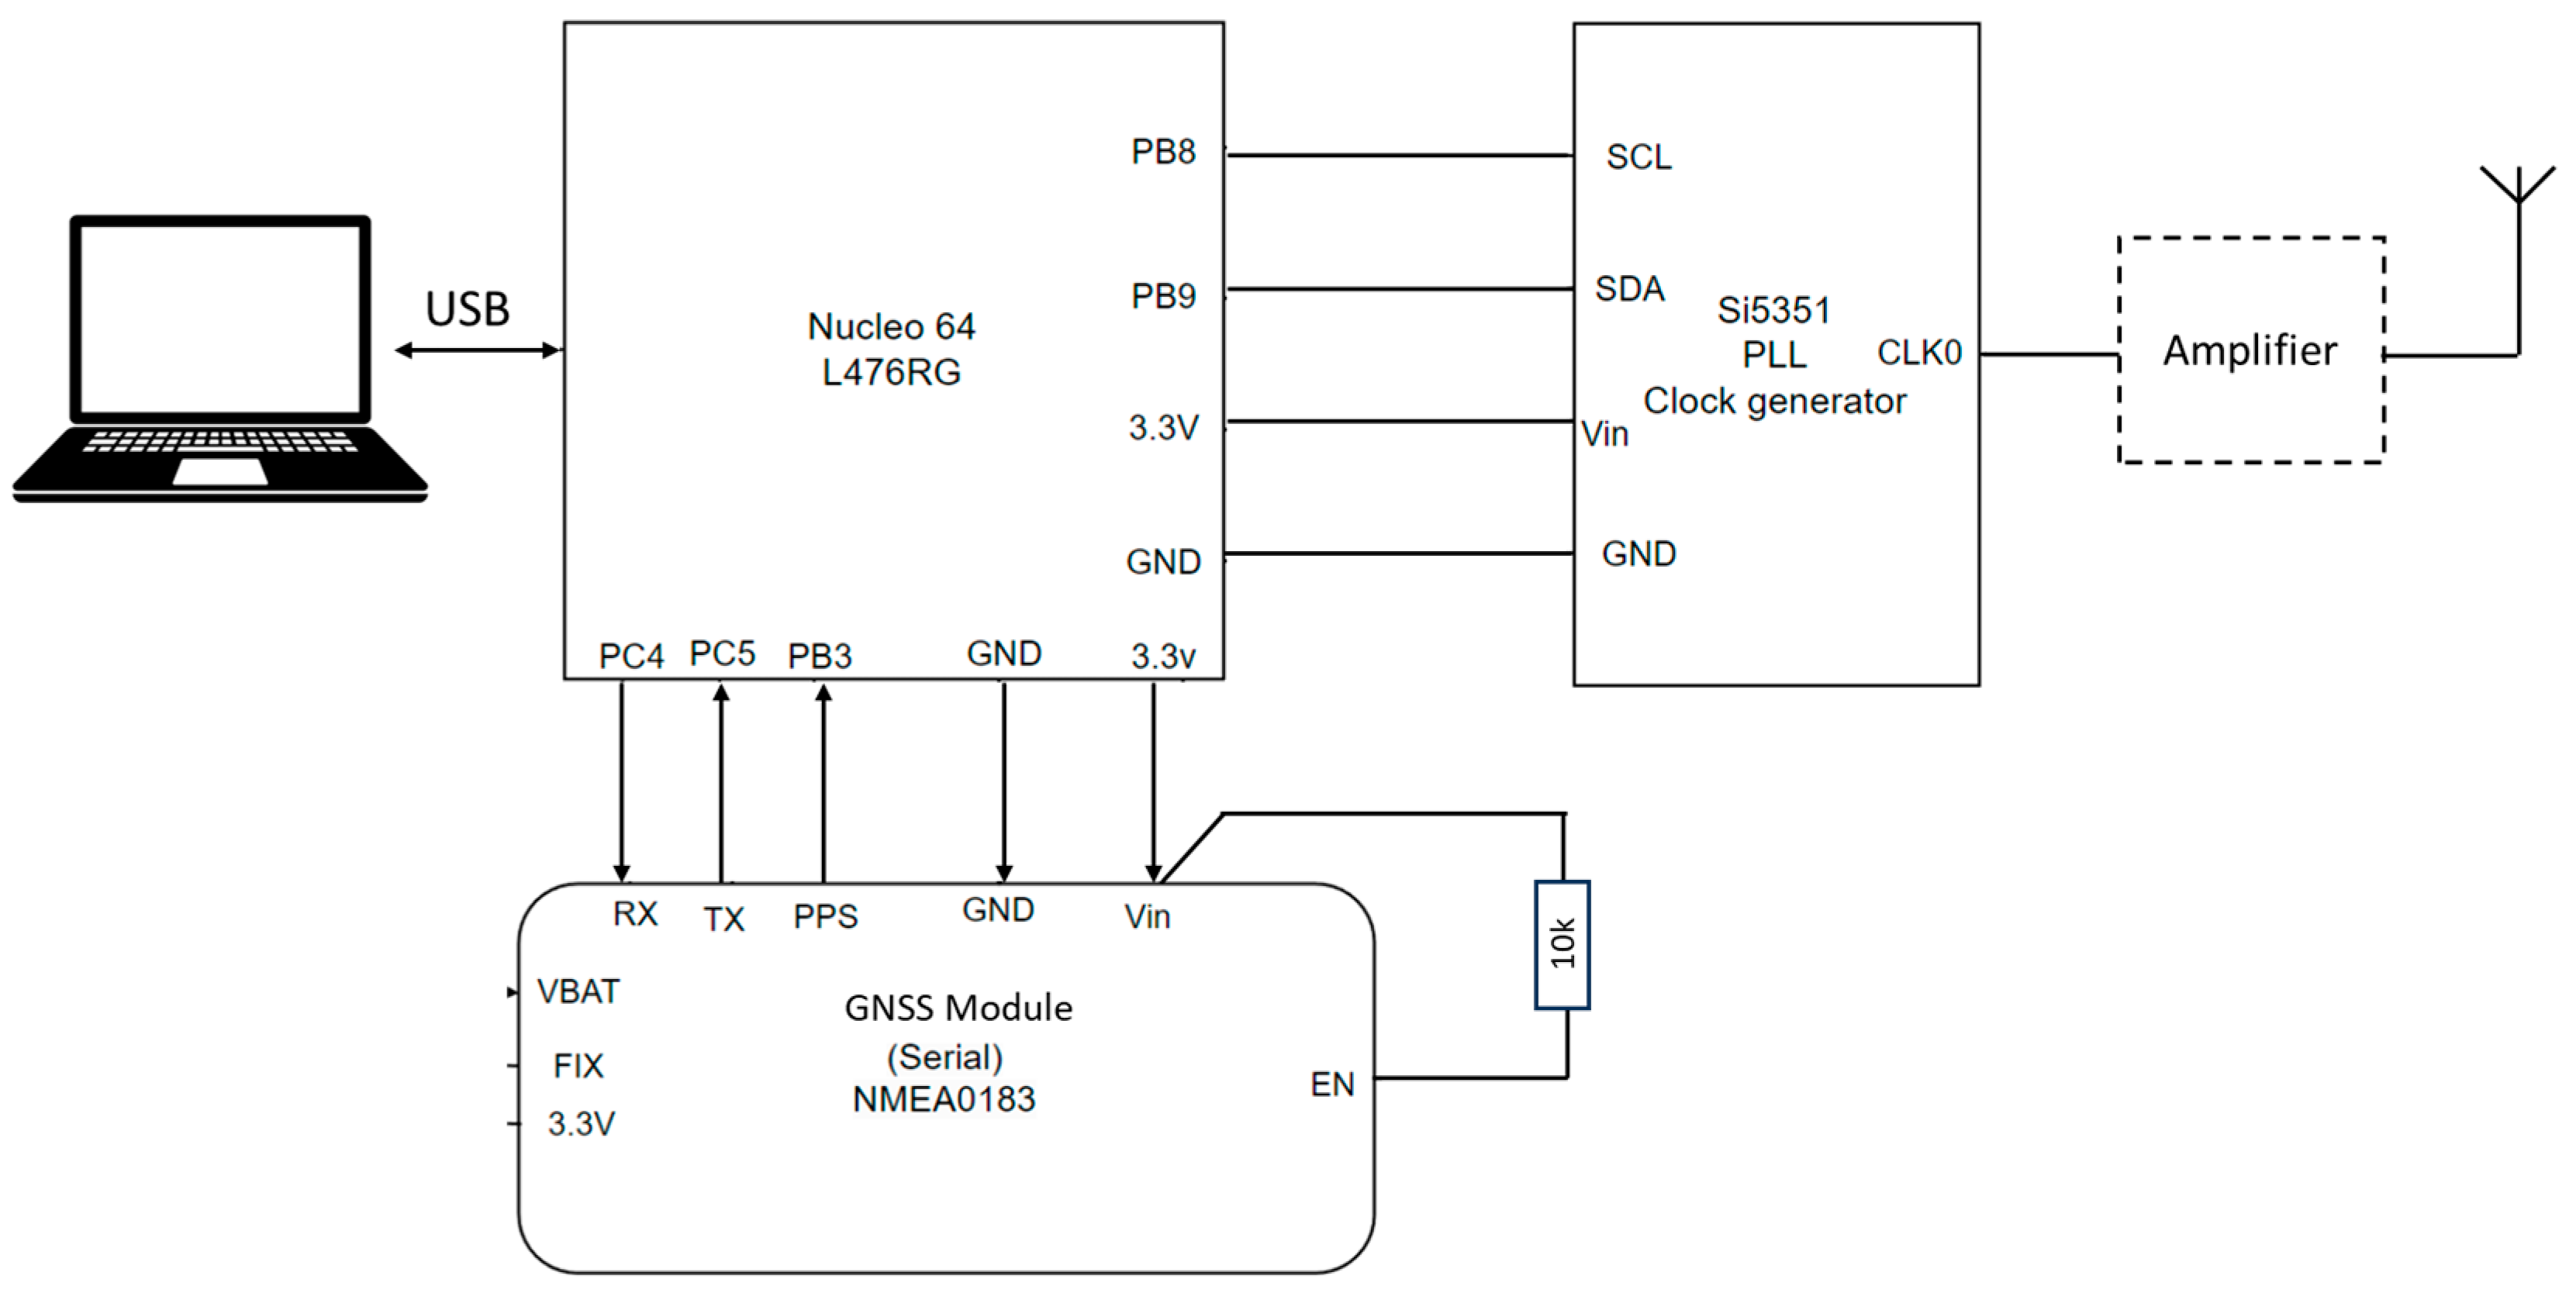
The beacon system consists of multiple elements which are controlled by a STM32 Nucleo64 microcontroller [48] linked to a GNSS module in order to align with the timing. A Si5351 clock generator [49] is used to create the output signal, which can be applied to an additional amplifier before being transmitted by an antenna (Figure 4).
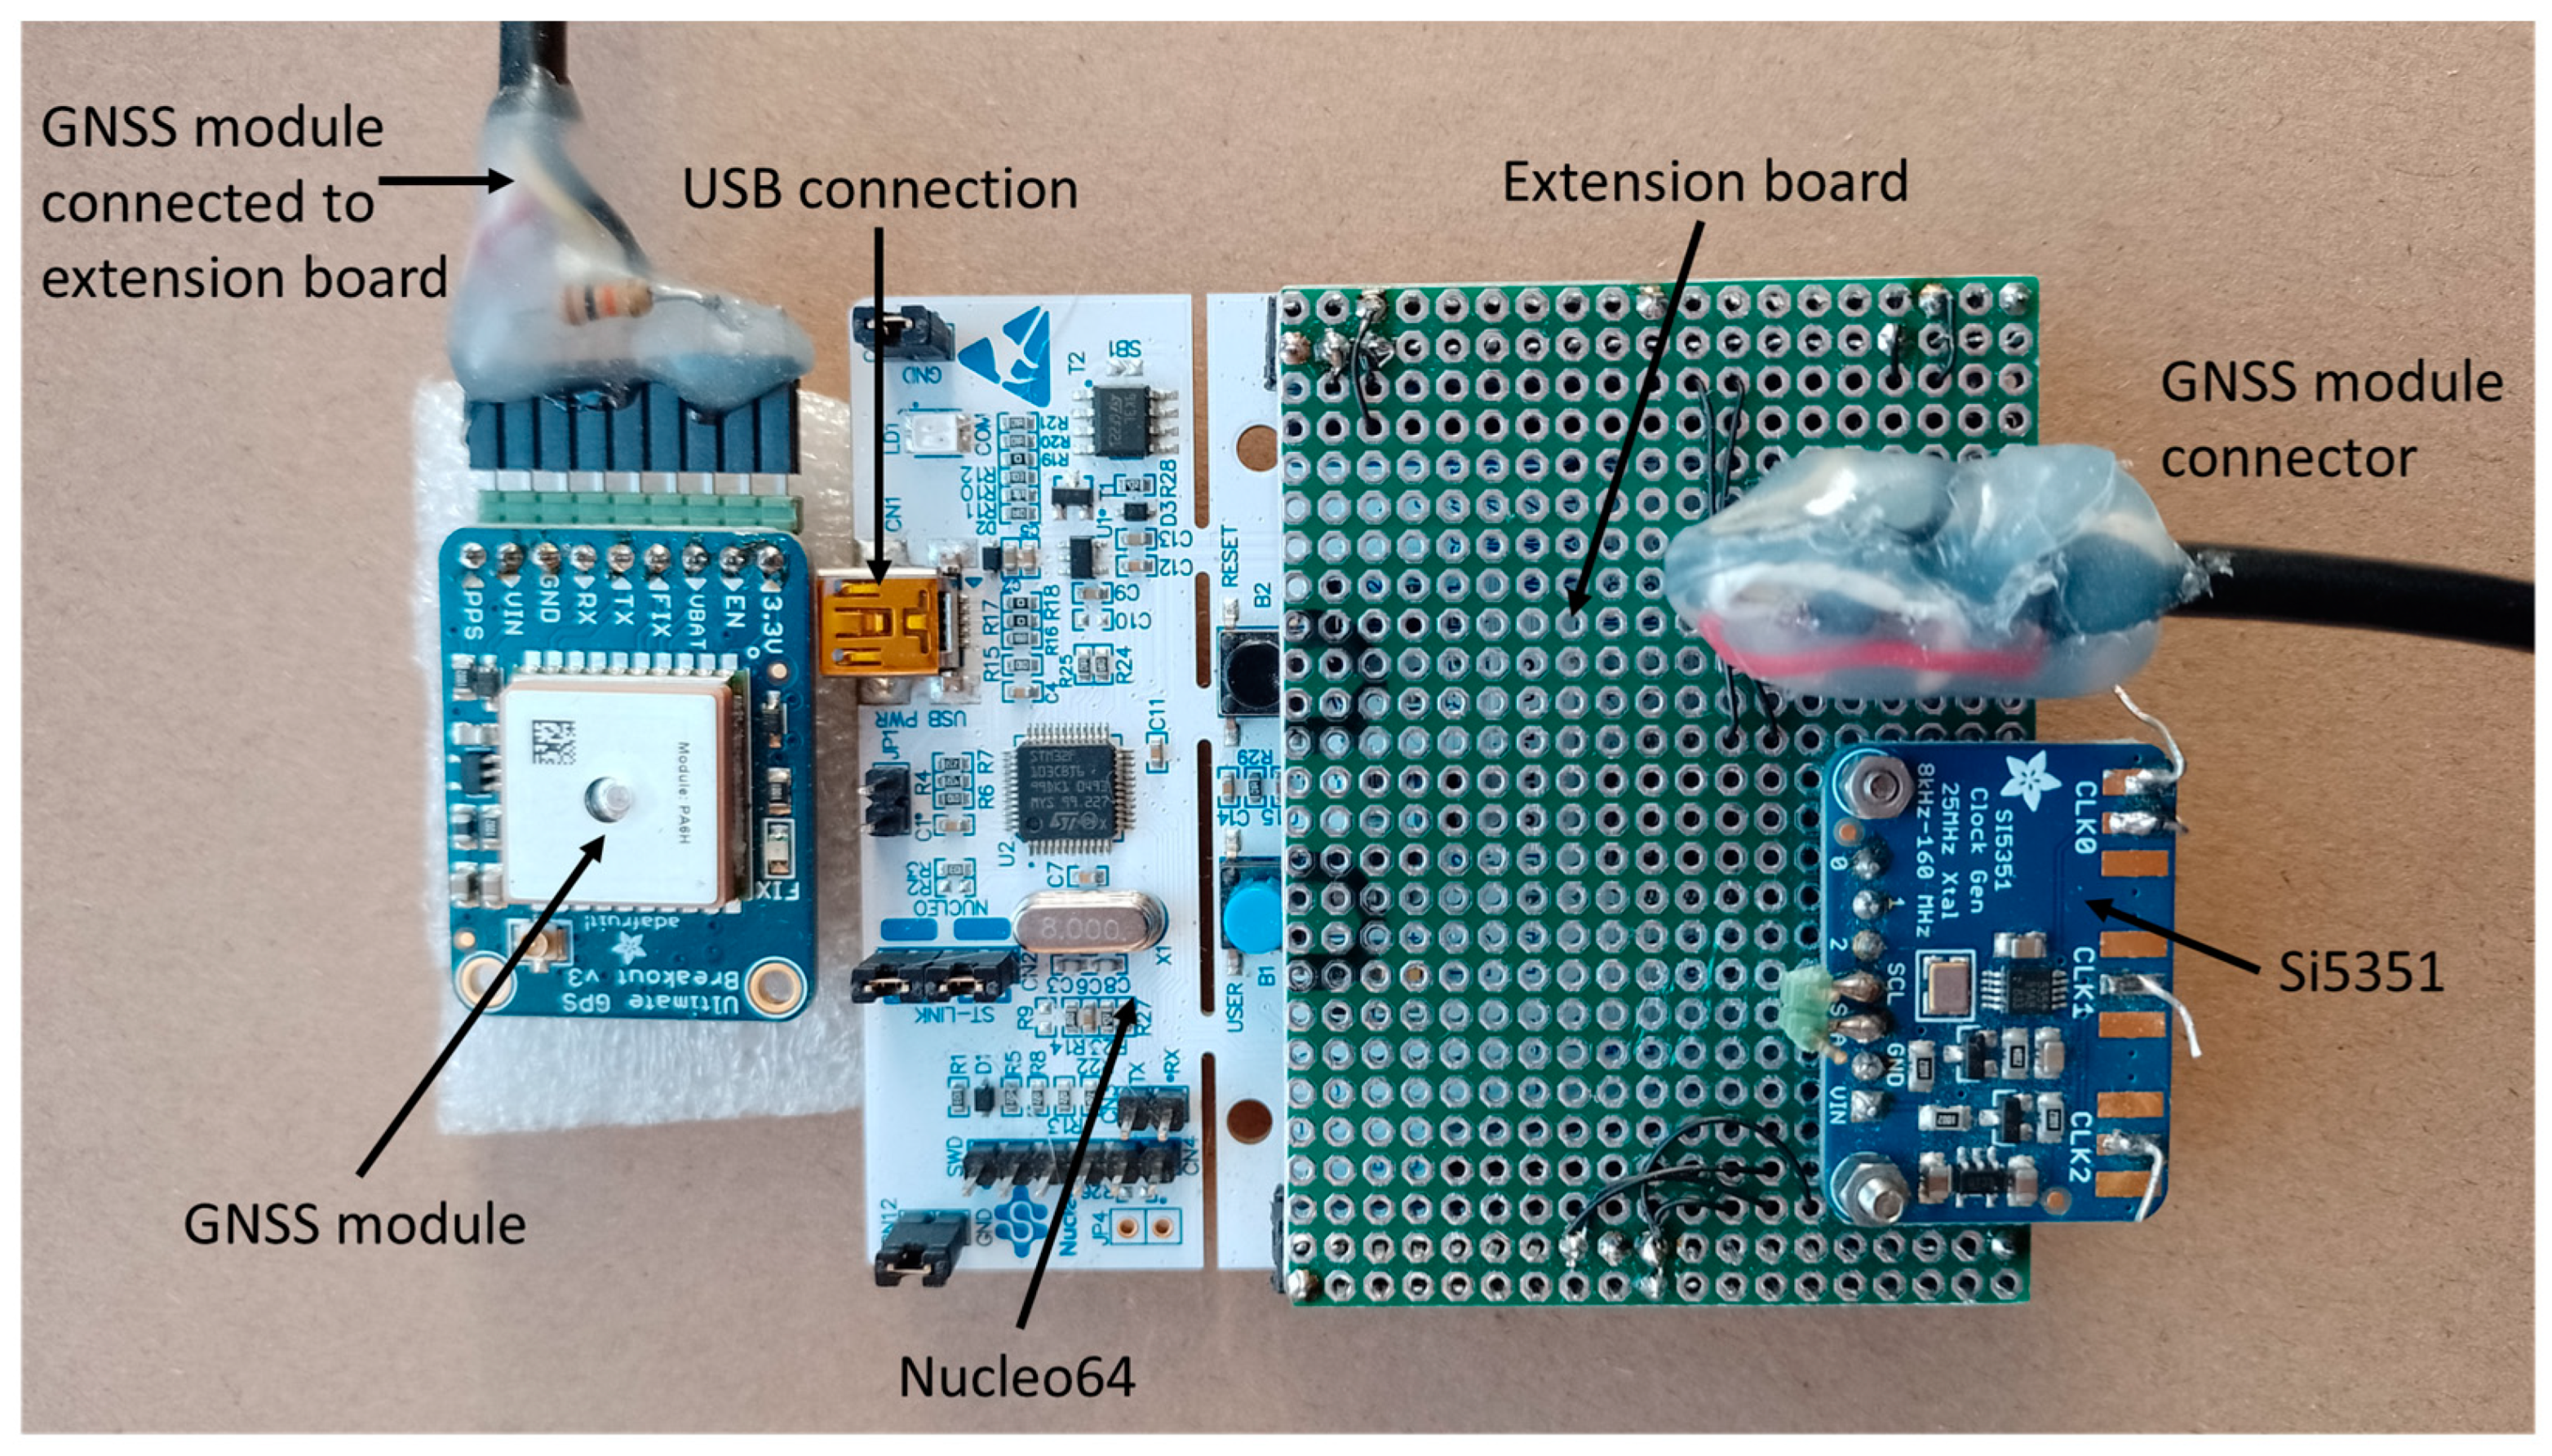
The GNSS module (Figure 4) is used for receiving accurate positioning and timing information. This board is connected to an extension board, which is connected to the Nucleo64 (Figure 5). In the final design, a GNSS receiver will be available aboard the satellite platform, hence, this signal will be provided by the spacecraft bus.
The Si5351 PLL clock generator board is used to generate the final output signal of FT4 and CW. These signals are transmitted using the antenna connected to the output of the amplifier, the input for which is connected to the clock output (CLK0) of the Si5351.
A laptop is used in order to program the Nucleo64 evaluation board. The firmware is designed in-house and is based on an interrupt service routine which is engaged every 48 ms (complementary with 20.8333 Hz). This time resolution of 48 ms is used for transmitting the FT4 and CW signals. The CPU has a clock frequency of 80 MHz, which divided by 64,000 and additionally by 60 generates the interrupt frequency of 20.8333 Hz. The time unit info used by the interrupt service routine is stored in a rotating buffer with two pointers (input pointer and output pointer) using an eight-bit value. The GNSS signal is used as a trigger in order to start the FT4/CW burst.
The next step will be the redesign of the breadboard of Figure 5 into a smaller PCB, enabling its housing aboard a small satellite platform. Hence, dedicated SMD components need to be selected and will be placed on a 42 × 42 × 20 mm PCB. Also, a specific impedance matching circuit and filter design for the 6 m and the 10 m band must be designed to connect the antennas and beacon systems. Additionally, the powering of the different components is part of future design. These depend on the available voltage levels and stability of the spacecraft power bus.

4.2. Beacon Testing

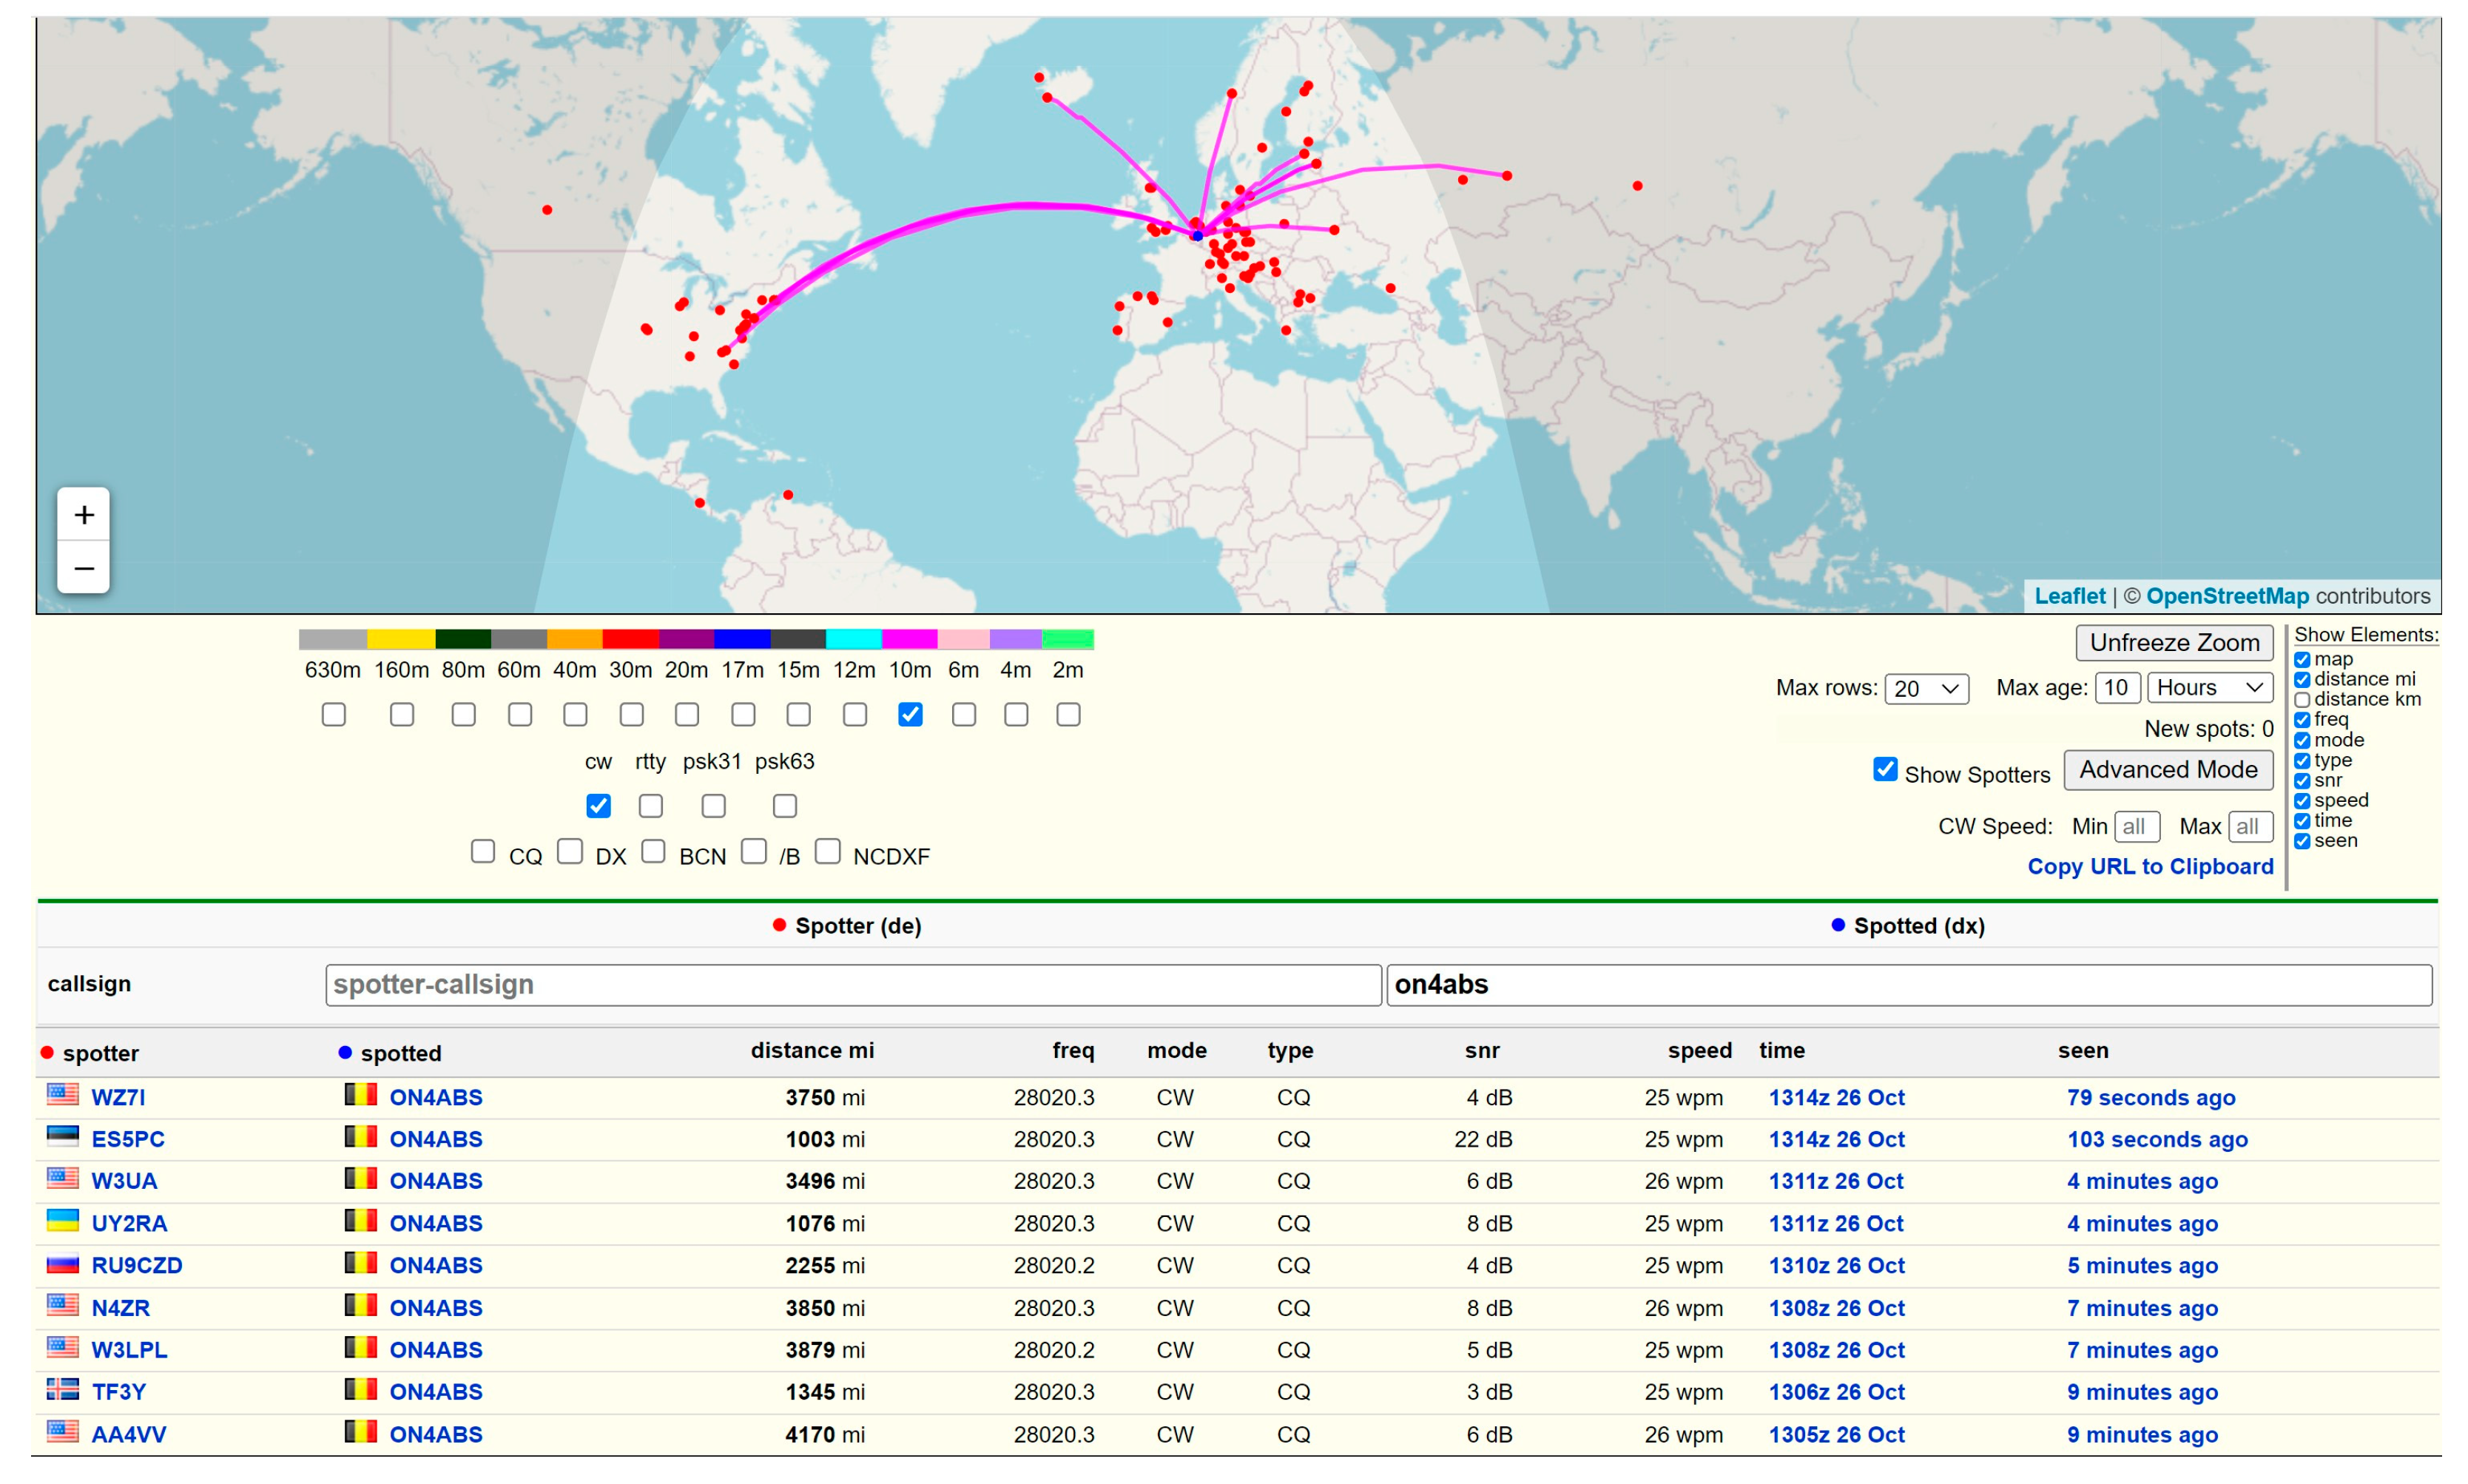
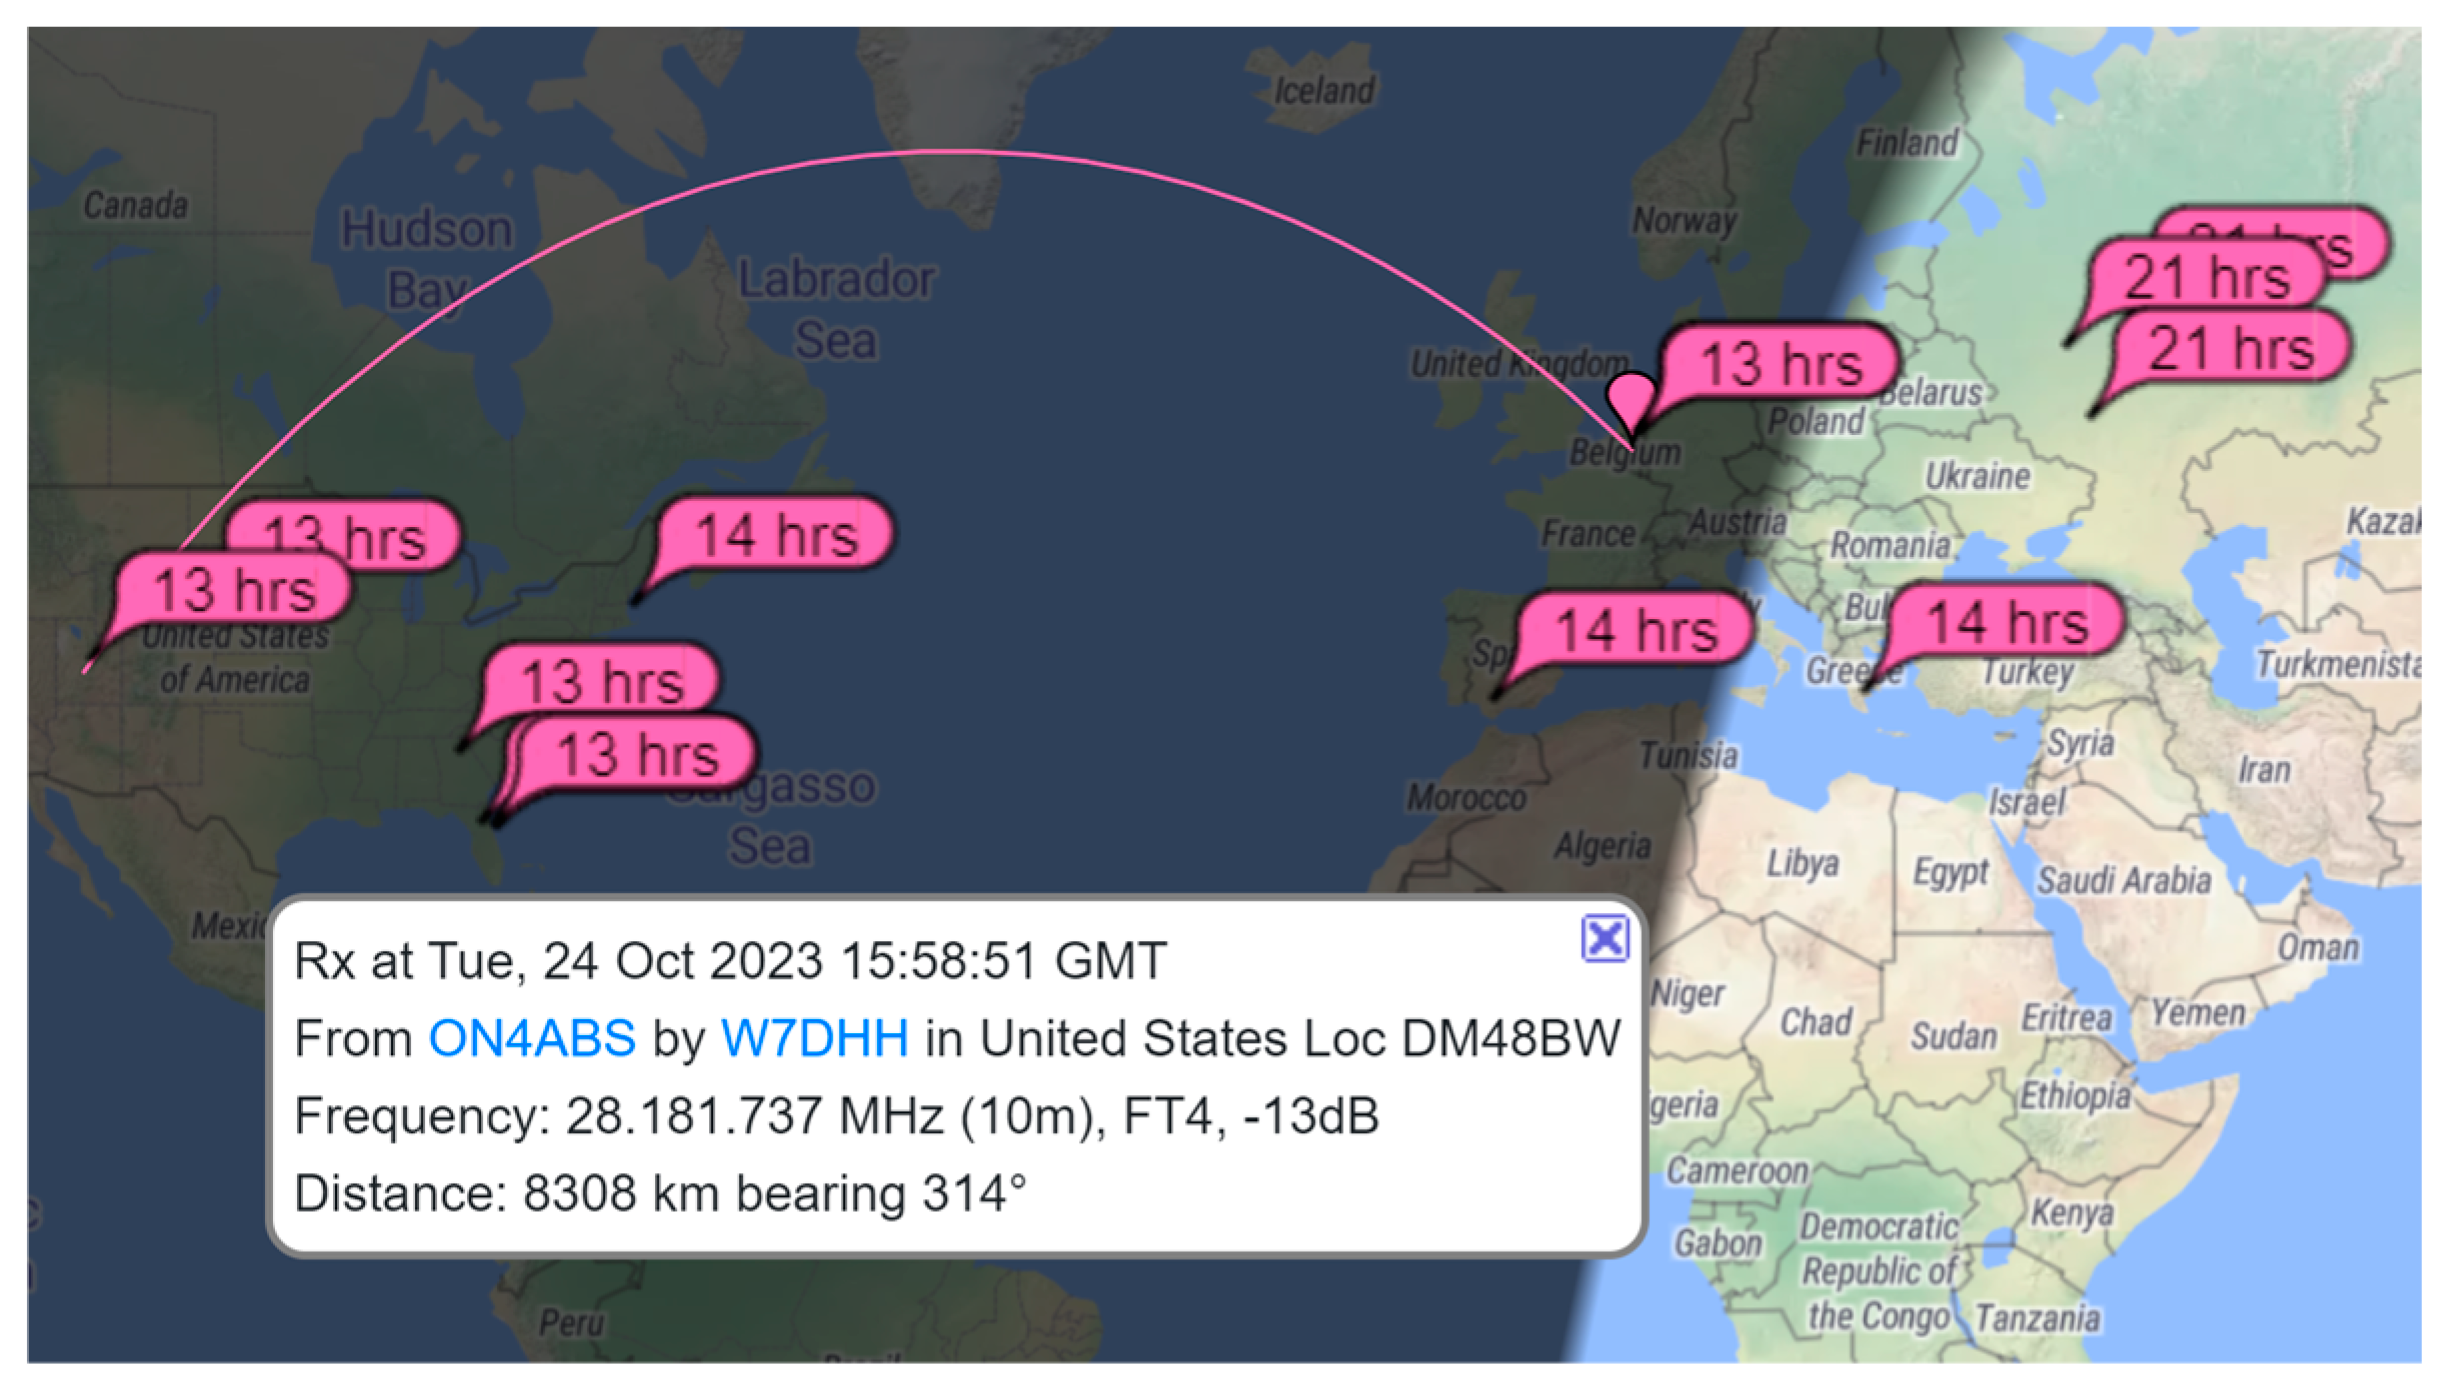
The setup in Figure 4 was used to test the beacon system in the 10 m band in FT4 and CW configuration. With this setup, a power level of 1 W was generated at the output of the amplifier. The OpenWebRX system was used to monitor FT4, while the Reverse Beacon Network checked on the reception of CW. In Figure 6, an example of CW reception is indicated, including a map of the propagation paths (top of the figure), while in Figure 7, the reception of an FT4 example is shown using OpenWebRX. It is clear that multiple propagation paths are possible and that the setup as such works for FT4 and CW.

4.3. Doppler Shift Testing

A Doppler shift is inseparable linked to the use of a moving satellite platform in LEO. This Doppler shift can be calculated using Equation (4) as follows [50]:
f = f 0 1 + v c
in which f is the observed frequency by the ground station, v is the speed of the approaching satellite and c is the velocity of the speed of light. Using the values for v = 7823 m/s, c = 3.108 m/s, and f0 = 28.106 Hz, the observed frequency on the ground f = 28,000, 730.17 Hz. This means a difference of 730.17 Hz is observed while the satellite is approaching the ground station, and the same value in case the satellite is drifting away from the station. Hence, a total shift of 1460.34 Hz can be observed. The satellite has a pass-over time of about 10 min, meaning a shift of 146.1 Hz/min, or 2.435 Hz/s. The time needed for FT4 transmission is 0.048 s [40], or 20.83 Hz. Consequently, a shift of 2.435 Hz/s/20.83 Hz = 0.117 Hz or 117 mHz is valid for each tone out of the four tones in FT4.
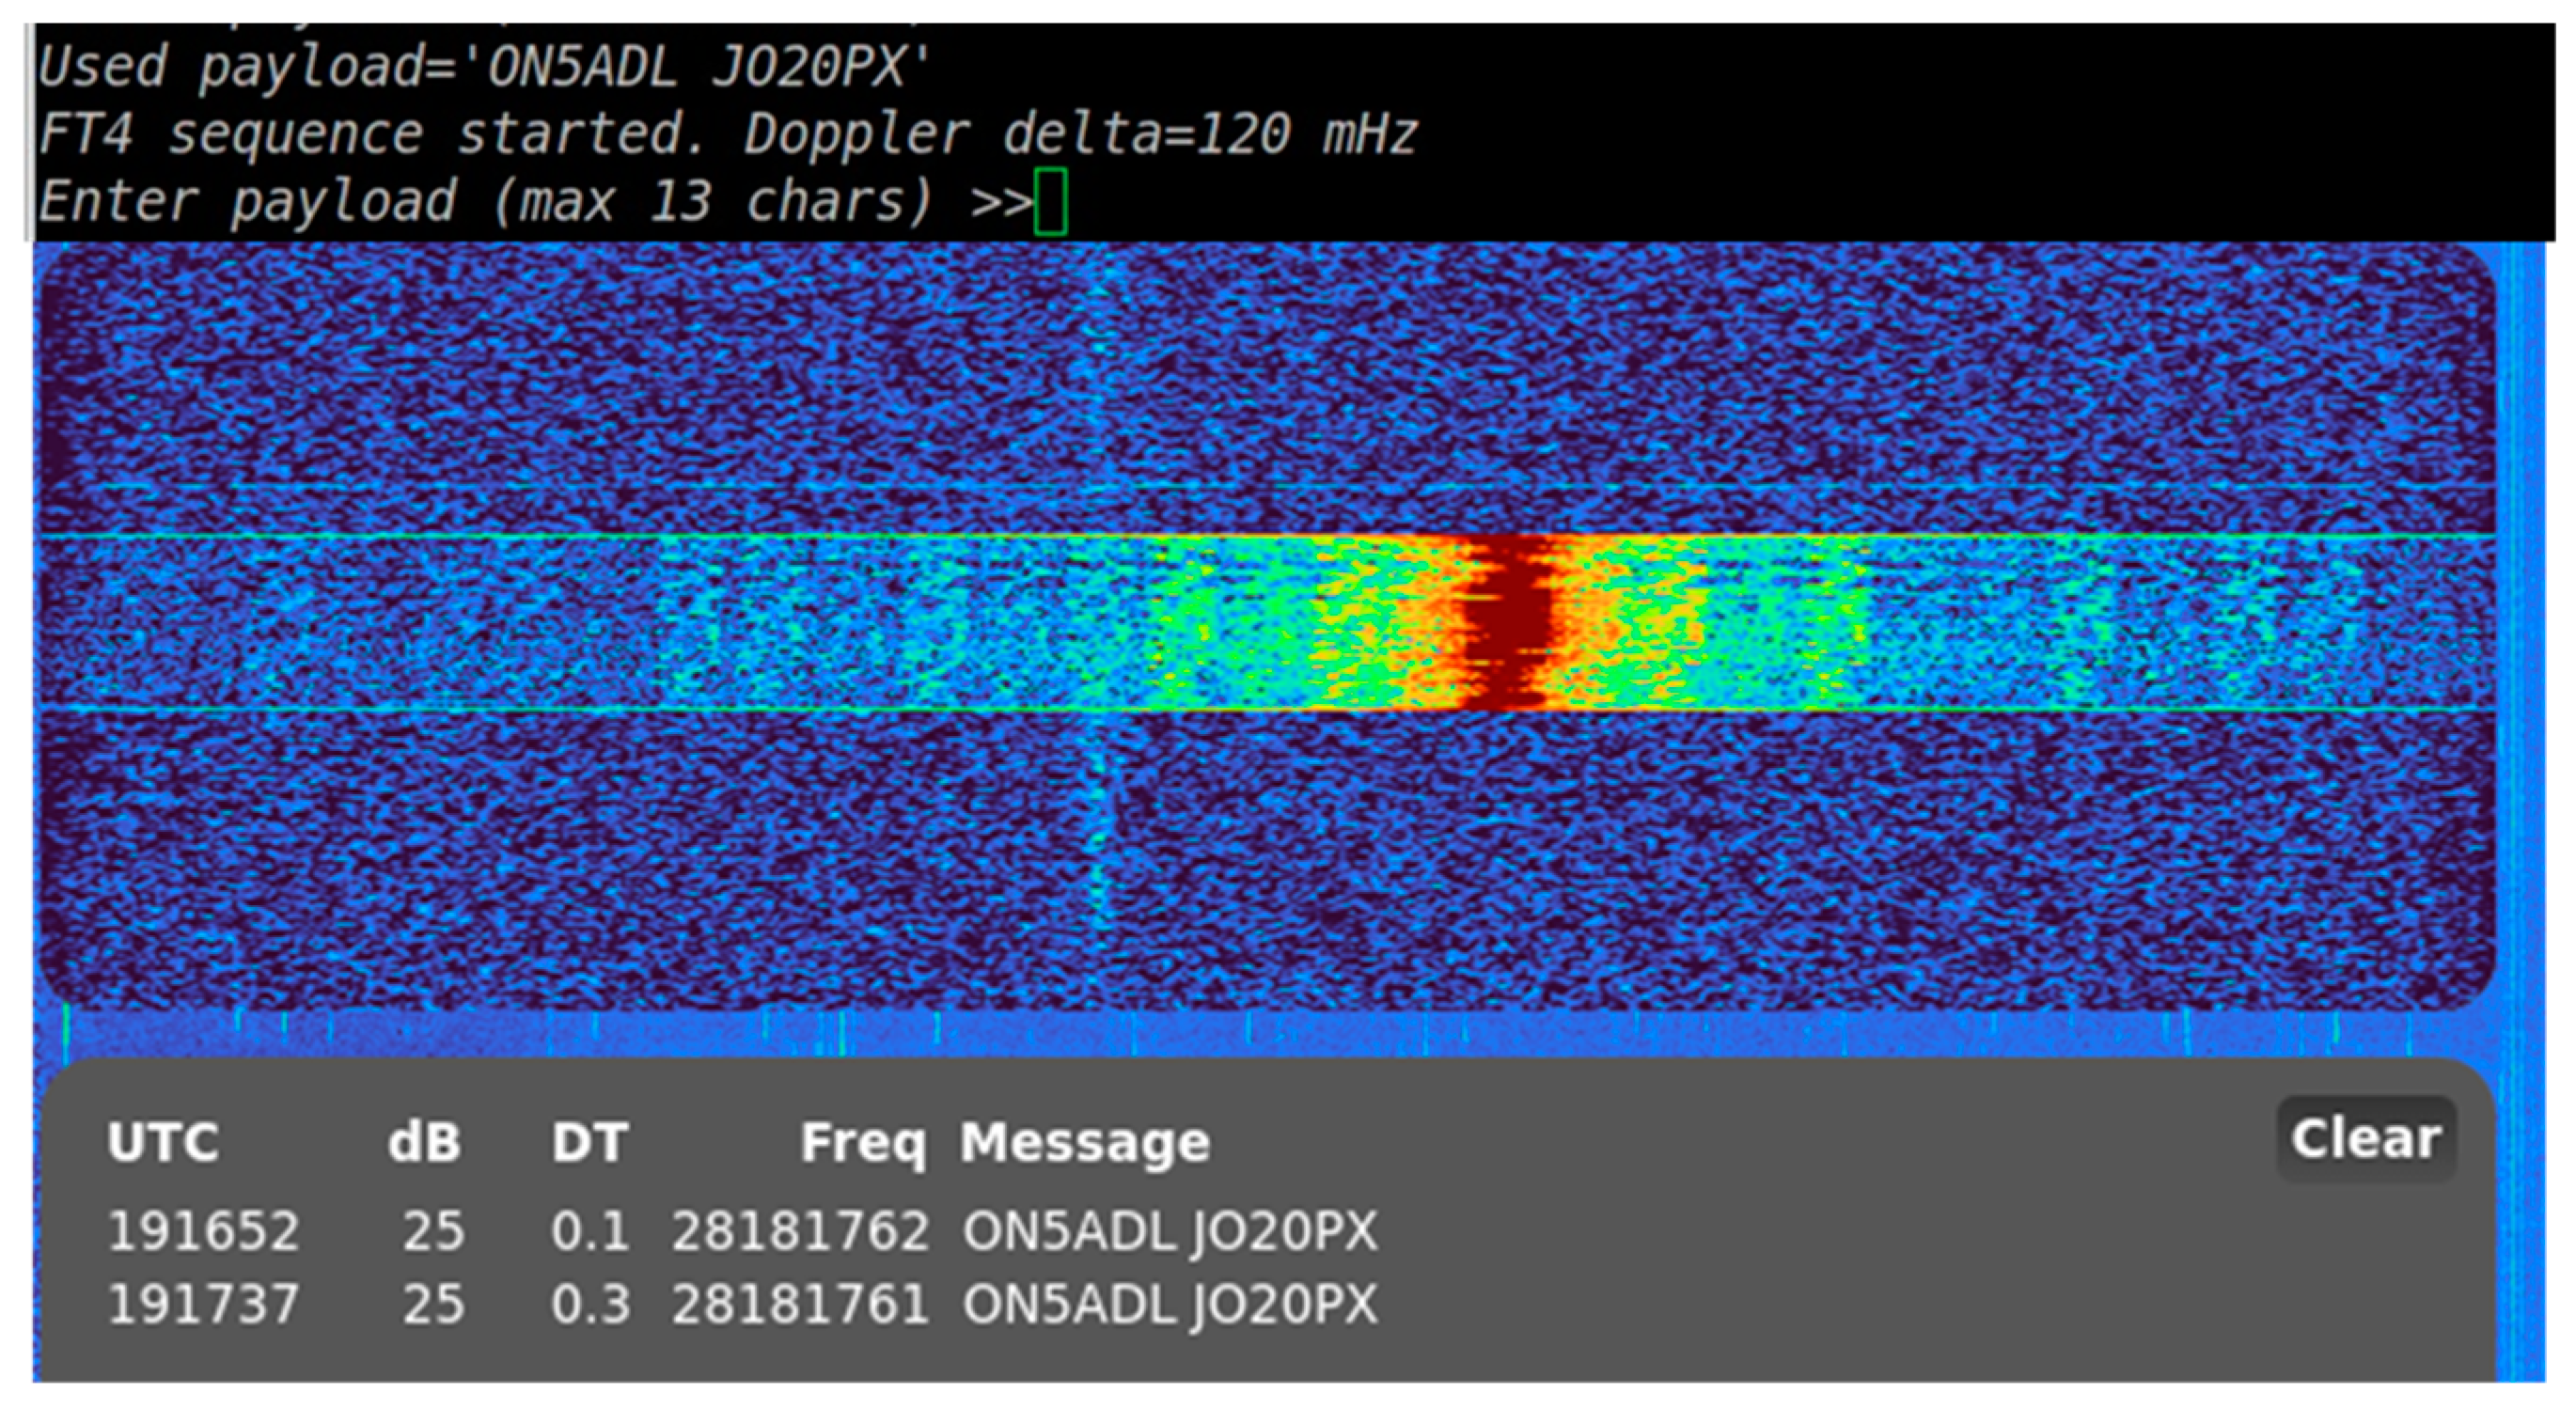
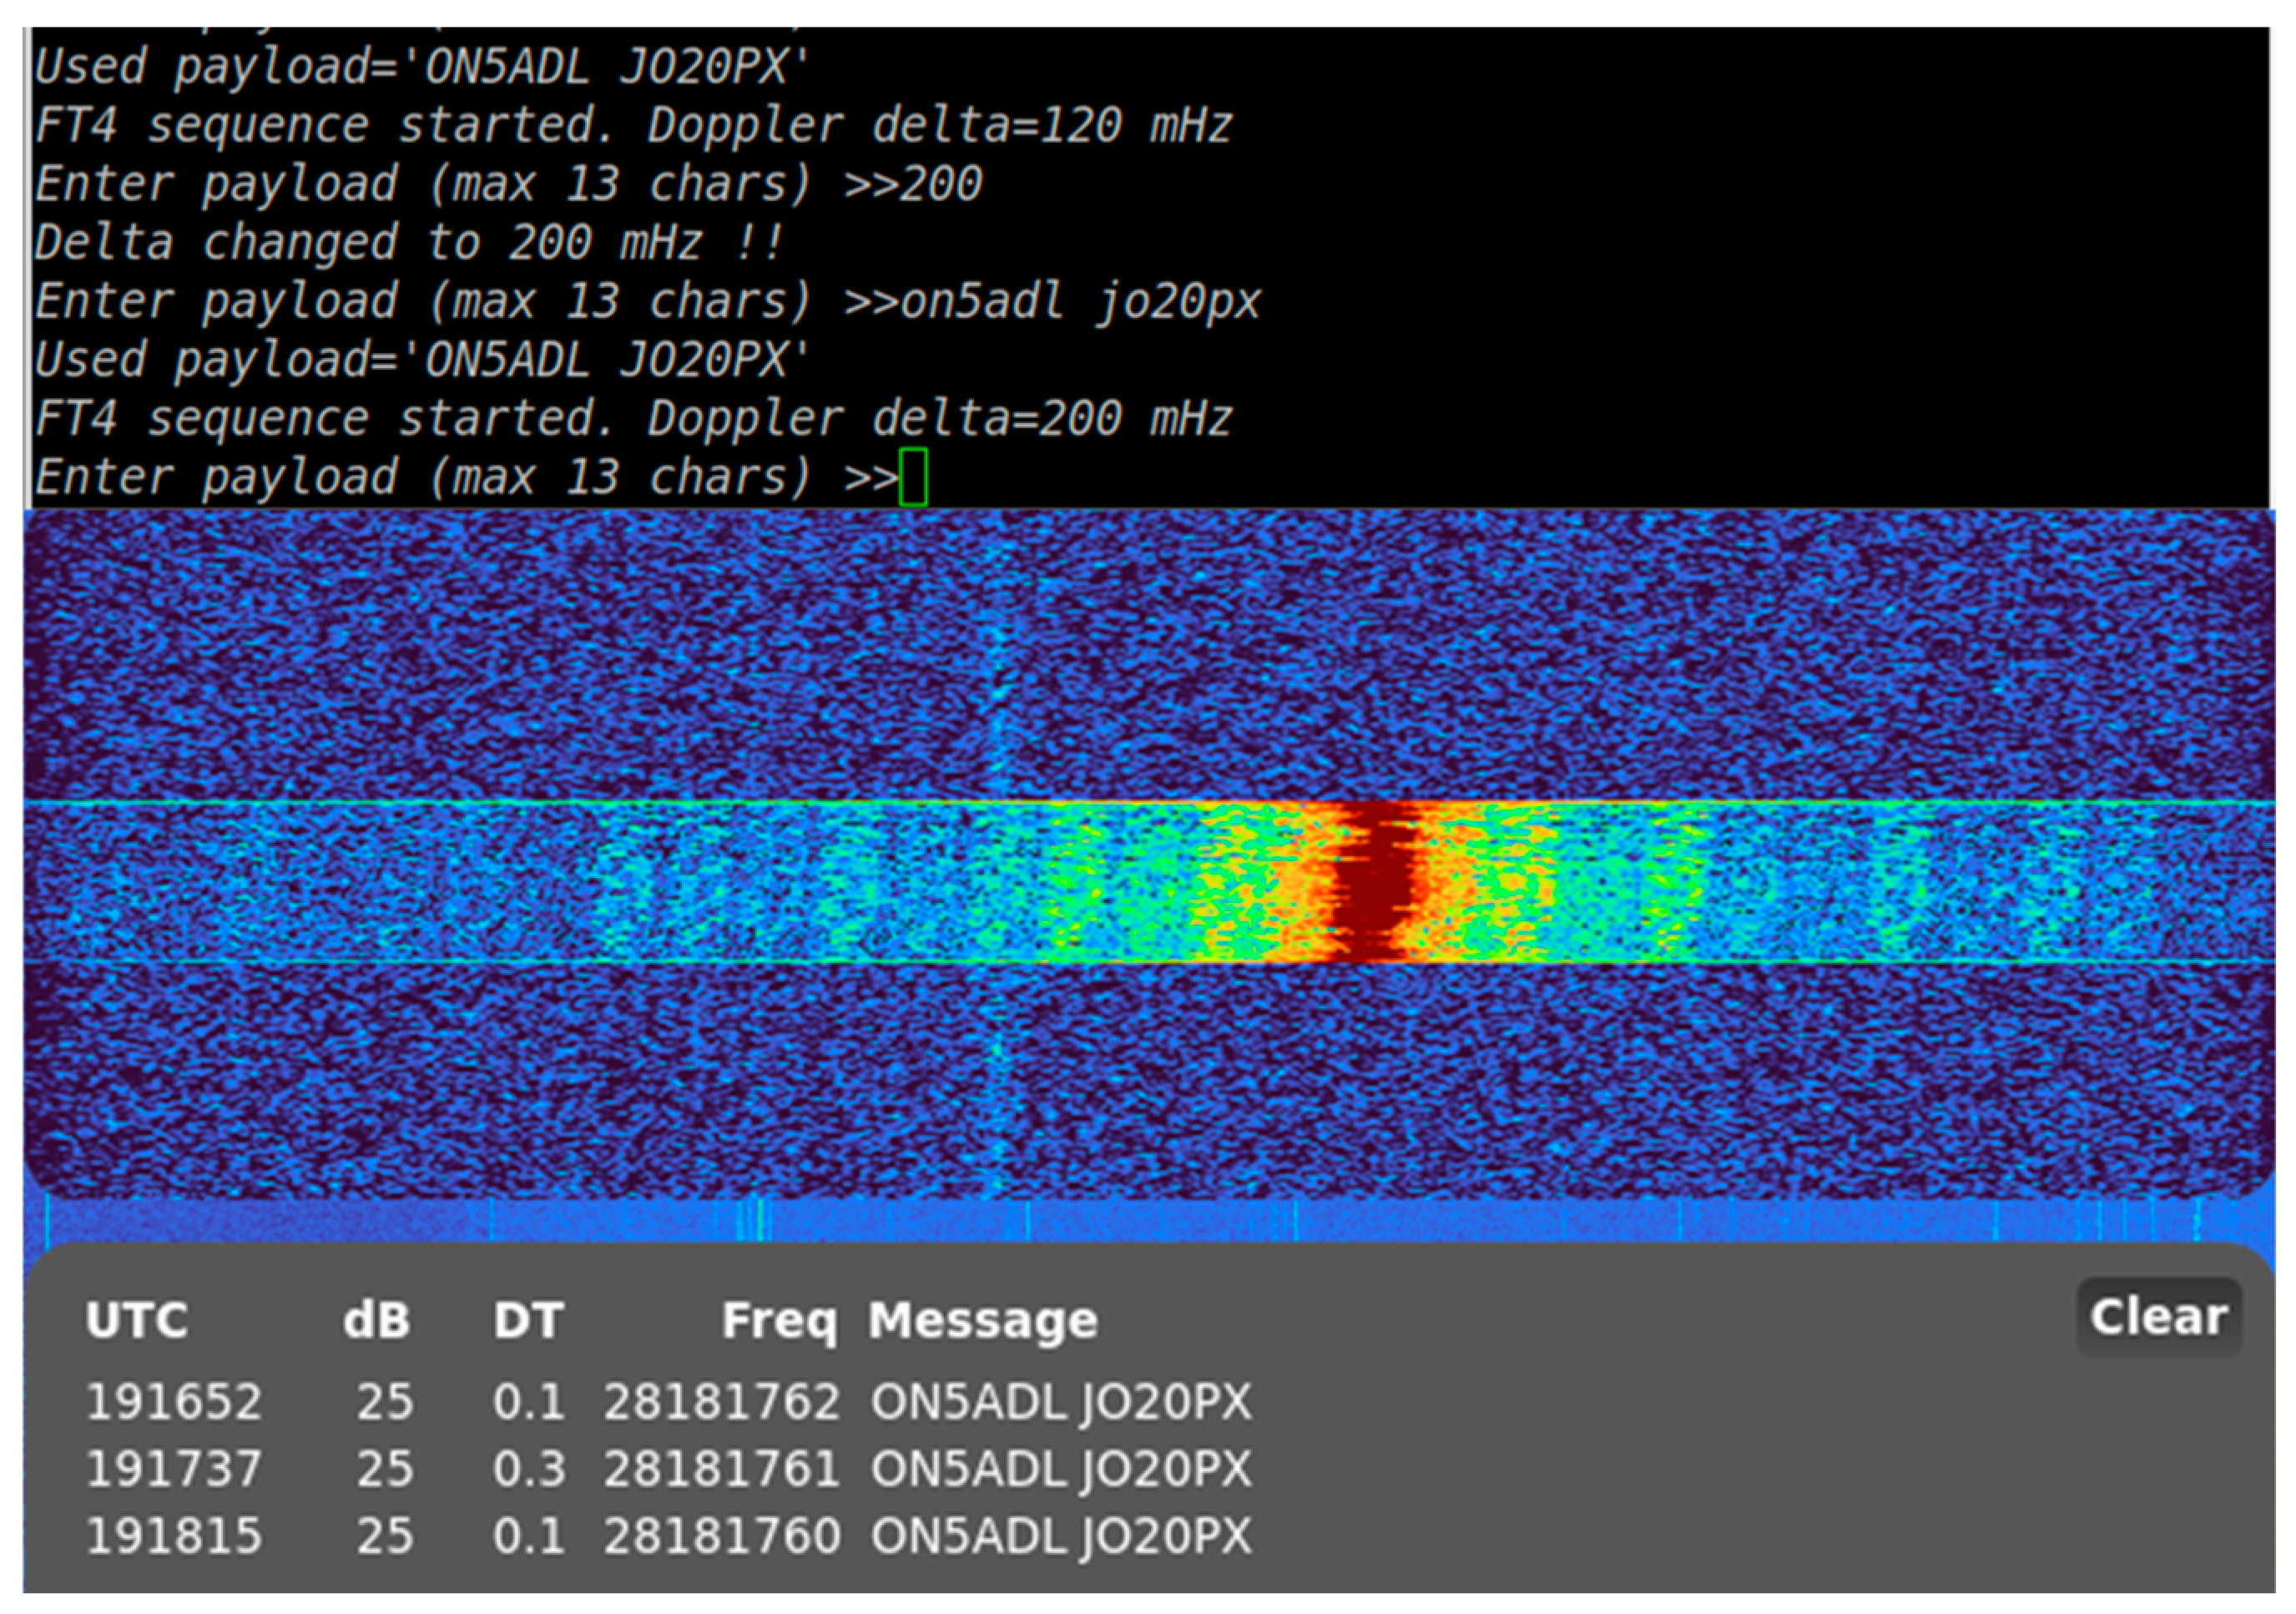
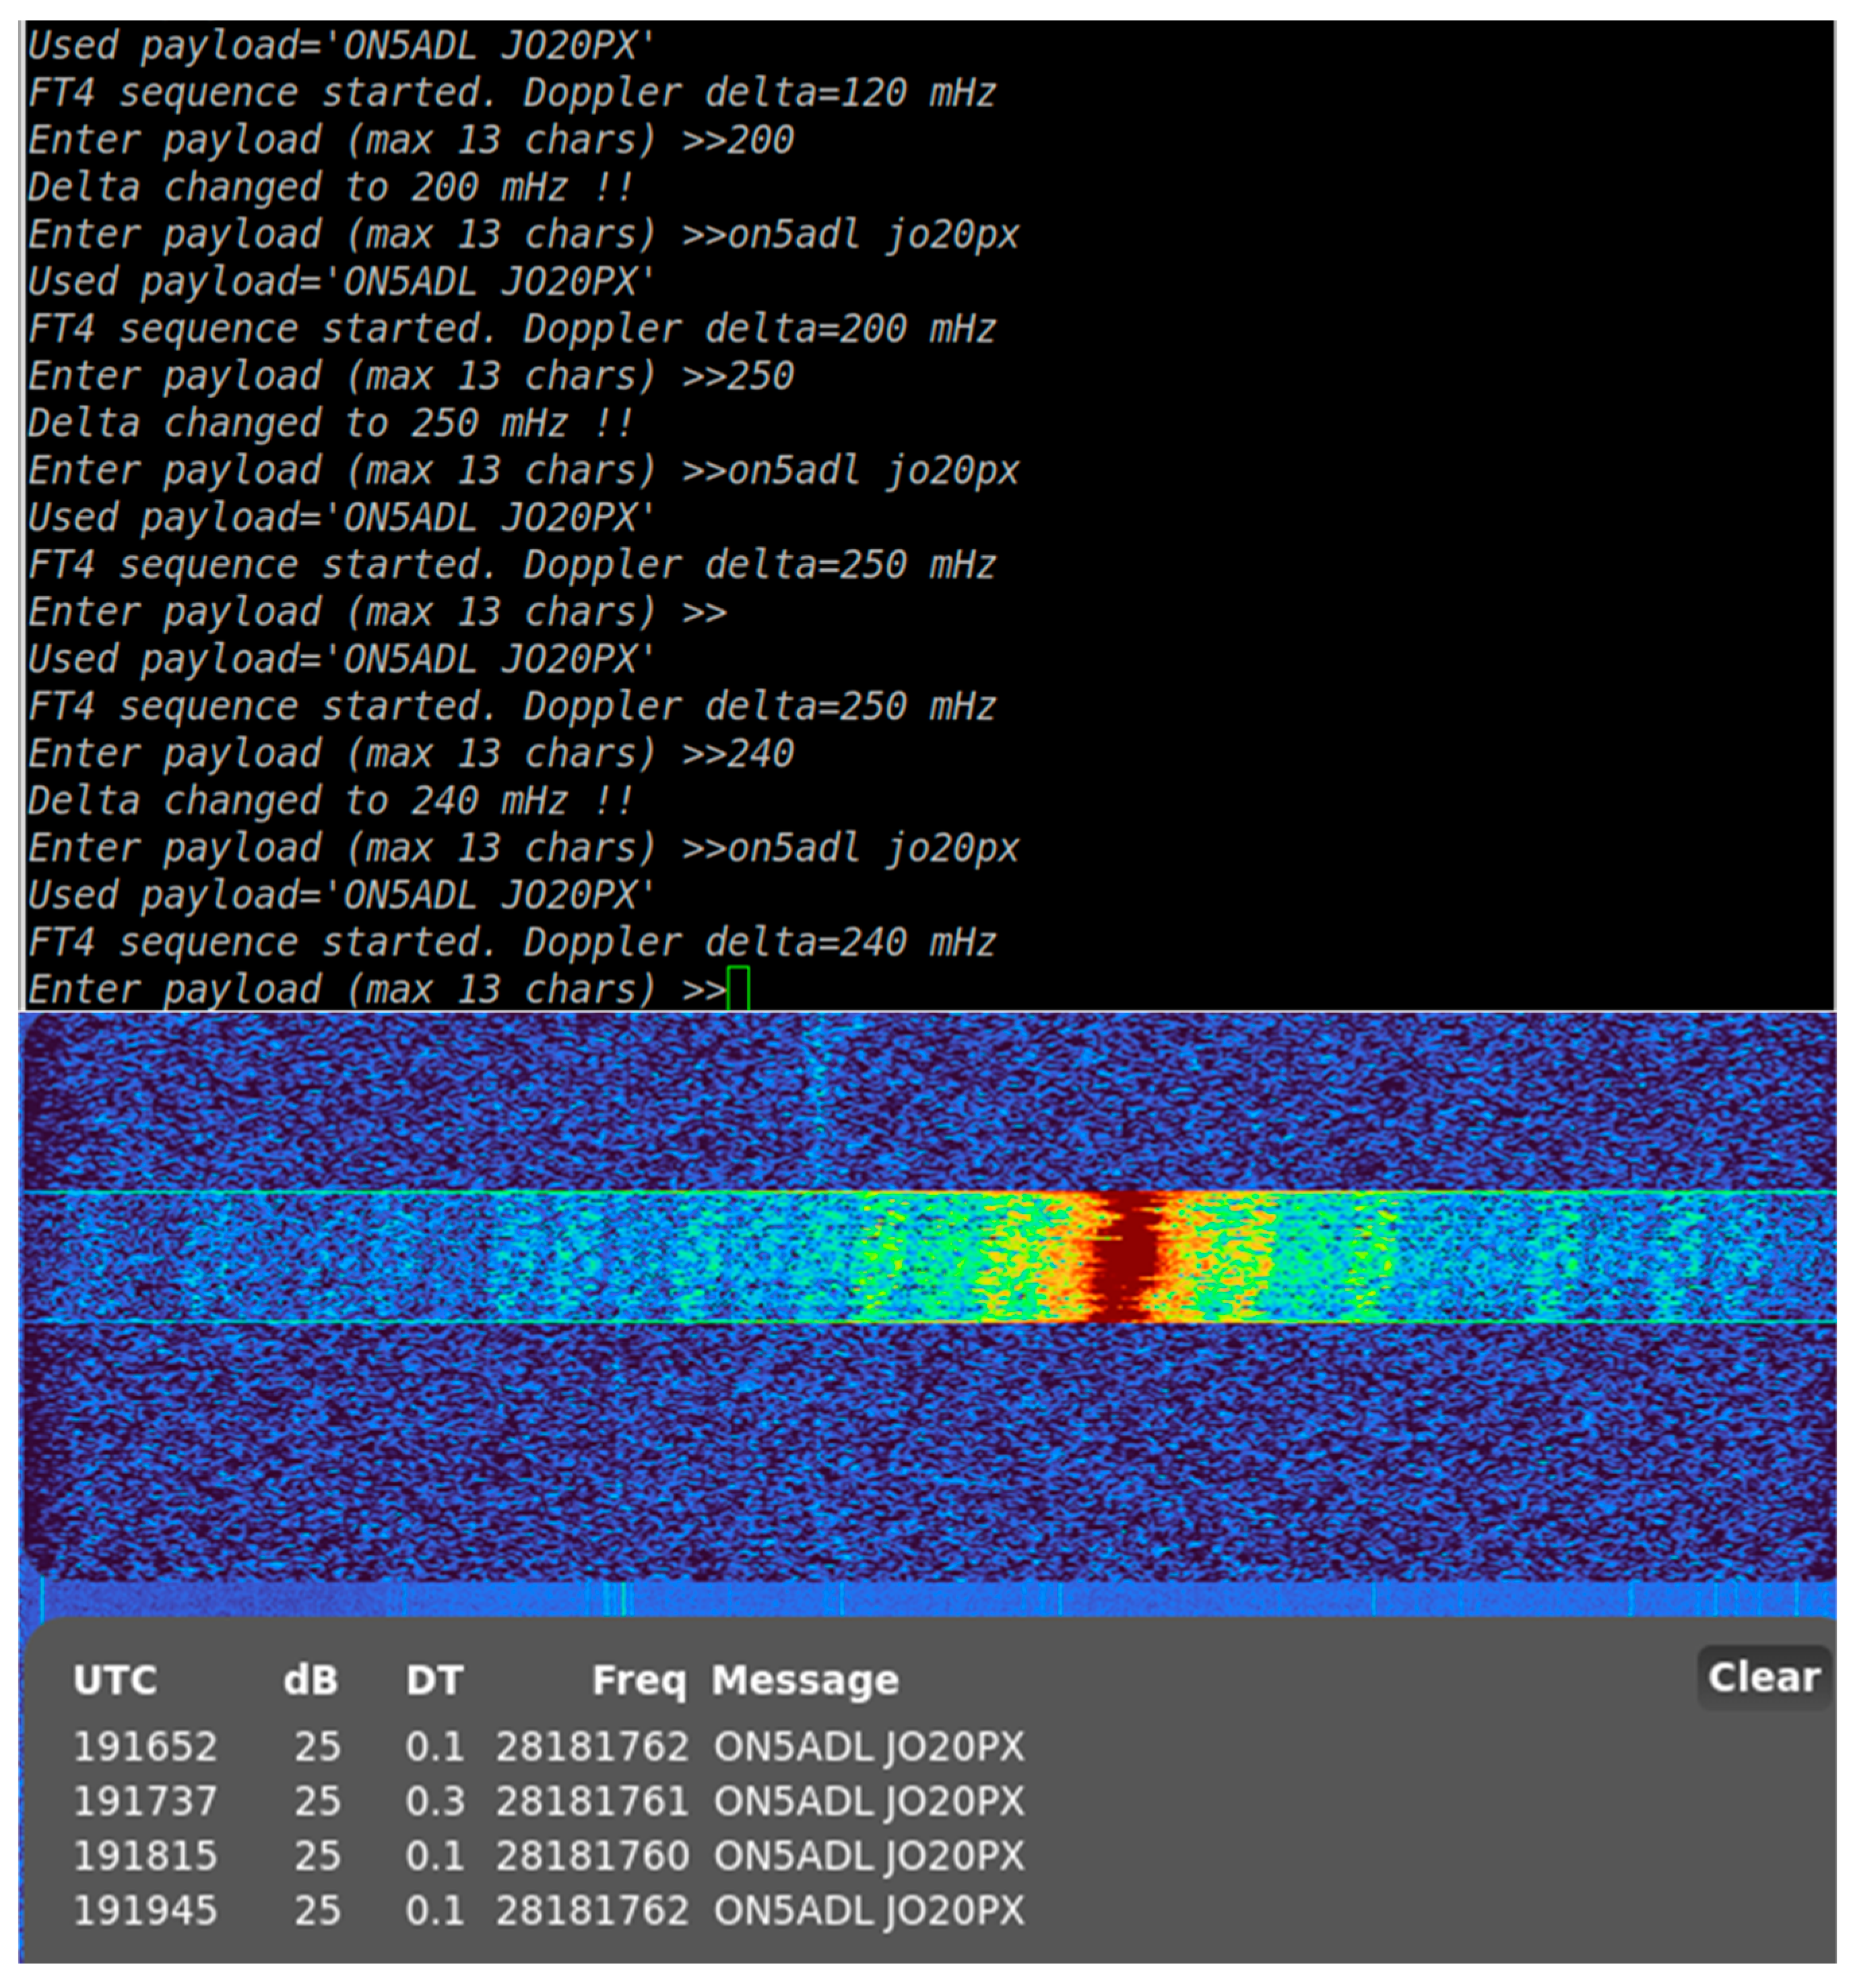
Tests were conducted in which an artificial shift was implemented in the FT4 transmitting beacon in order to check if detection by ground-based decoding systems was still possible. Tests were conducted using the setup shown in Figure 4. Using OpenWebRX, in Figure 8, Figure 9 and Figure 10, different situations were investigated in which a tone shift was implemented of 120 mHz, 200 mHz, and 240 mHz. On the top of the figures, the command with the applied Doppler shift is shown (“Doppler delta = XXX mHz”). In the middle, the waterfall signal is shown, indicating a Doppler shift. At the bottom, the time (UTC), the signal level of reception (dB), the frequency (Hz), and the message are shown. The latter contains the callsign (ON5ADL) and the locator value (JO20PX). It is shown in the lower part of Figure 8 and Figure 9 that the decoding of the transmitted signal having a shift of 120 mHz and 200 mHz is still possible (message is received). A test was also performed at 250 mHz, but as shown in Figure 10, no reception occurred. However, at 240 mHz, reception was possible. Hence, the Doppler shift linked to the setup (i.c. 117 mHz) does not create any issues in the ground station network for decoding.

5. Conclusions and Future Work

In this work, an FT4-CW beacon system able to assess sporadic E aboard a low-flying platform is described. The system transmits in the 6 m and 10 m radio-amateur bands, using a worldwide spread receiving network of radio-amateur stations in order to check on the SNR values received during FT4 and CW transmissions. Comparing the SNR values of two signals at reception enables the detection of ionospheric phenomena. The design of such an analytical model is part of future work. A fully functional prototype is described, accompanied with functional and Doppler effect tests. The results show the potential of this concept to be used in sporadic E analysis.
The current design needs further improvements like miniaturization in order to fit onto a PocketQube-sized PCB by converting the schematics into an SMD-based circuit. Currently, a prototype SMD version of the described lumped circuit is built and will be tested in the near future. Additionally, the power handling system needs to be worked out, as well as the filtering and impedance matching network for the two dedicated radio-amateur bands (6 m and 10 m). Additionally, dedicated deployable antennas are under investigation. Due to the small size of the satellite platform, compromise antennas shall be designed for the two radio-amateur bands. With this in mind, link budget calculations are necessary to see if the output power levels are satisfying for ground-based signal reception
The low cost, compactness, and versatility of this instrument allows it to be flown on any platform as a piggyback payload, enabling the deployment of multiple beacons for a more thorough investigation of the issues at hand. Hence, global coverage with a high temporal revisit time can be achieved. The design, simulation and testing of such a constellation is part of future work.

Author Contributions

Conceptualization, J.V., M.B., S.S. and S.U.; methodology, J.V.; software, M.B.; validation, J.V. and M.B.; formal analysis, J.V. and M.B.; investigation, J.V. and M.B.; resources, J.V.; data curation, J.V. and M.B.; writing—original draft preparation, J.V., M.B., S.S. and S.U.; writing—review and editing, J.V.; visualization, J.V.; supervision, J.V.; project administration, J.V., S.S. and S.U.; funding acquisition, J.V. All authors have read and agreed to the published version of the manuscript.

Funding

This research received no external funding.

Institutional Review Board Statement

Not applicable.

Informed Consent Statement

Not applicable.

Data Availability Statement

The original contributions presented in the study are included in the article, further inquiries can be directed to the corresponding author.

Acknowledgments

The authors thank all participants in the study. Special thanks goes to AMSAT Belgium for their willingness to promote the concept among their members in order to obtain all necessary data once the concept is flying aboard a satellite.

Conflicts of Interest

The authors declare no conflicts of interest.

References

  1. Schunk, R.W.; Nagy, A.F. Ionospheres: Physics, Plasma Physics, and Chemistry, 2nd ed.; Cambridge University Press: New York, NY, USA, 2009. [Google Scholar]
  2. Whitehead, J.D. Recent work on mid-latitude and equatorial sporadic-E. J. Atmos. Terr. Phys. 1989, 51, 401–424. [Google Scholar] [CrossRef]
  3. Rice, D.D.; Sojka, J.J.; Eccles, J.V.; Bradly, J.J.; Hunsucker, R.D. First Results of Mapping Sporadic E with a Passive Observing Network. Space Weather. 2011, 9, 1–11. [Google Scholar] [CrossRef]
  4. Harrison, R. Sporadic E—Stardust Propagation. Amat. Radio Mag. 2023, 91, 40–45. [Google Scholar]
  5. Maruyama, T.; Kato, H.; Nakamura, M. Meteor-Induced Transient Sporadic E as Inferred from Rapid-Run Ionosonde Observations at Midlatitudes. J. Geophys. Res.—Space Phys. 2008, 113, A09308-1-7. [Google Scholar] [CrossRef]
  6. Wakabayashi, M.; Ono, T.; Mori, H.; Bernhardt, P.A. Electron density and plasma waves in mid-latitude sporadic-E layer observed during the SEEK-2 campaign. Ann. Geophys. 2005, 23, 2335–2345. [Google Scholar] [CrossRef]
  7. Aubry, M.; Blanc, M.; Clauvel, R.; Taieb, C.; Bowen, P.J.; Norman, K.; Willmore, A.P.; Sayers, J.; Wager, J.H. Some Rocket Results on Sporadic E. Radio Sci. 1966, 1, 170–177. [Google Scholar] [CrossRef]
  8. Ning, B.; Hu, L.; Li, G.; Liu, L.; Wan, W. The First Time Observations of Low-Latitude Ionospheric Irregularities by VHF Radar in Hainan. Sci. China Technol. Sci. 2012, 55, 1189–1197. [Google Scholar] [CrossRef]
  9. Hysell, D.L.; Nossa, E.; Larsen, M.F.; Munro, J.; Sulzer, M.P.; Gonzalez, S.A. Sporadic E Layer Observations over Arecibo Using Coherent and Incoherent Scatter Radar: Assessing Dynamic Stability in the Lower Thermosphere. J. Geophys. Res. Space Phys. 2009, 114, A12303. [Google Scholar] [CrossRef]
  10. Haldoupis, C. An Improved Ionosonde-Based Parameter to Assess Sporadic E Layer Intensities: A Simple Idea and an Algorithm. J. Geophys. Res. Space Phys. 2019, 124, 2127–2134. [Google Scholar] [CrossRef]
  11. Liu, T.; Yang, G.; Jiang, C. High-Resolution Sporadic E Layer Observation Based on Ionosonde Using a Cross-Spectrum Analysis Imaging Technique. Space Weather 2023, 21, e2022SW003195. [Google Scholar] [CrossRef]
  12. Savastano, G.; Nordström, K.; Angling, M.J. Semi-Supervised Classification of Lower-Ionospheric Perturbations Using GNSS Radio Occultation Observations from Spire Global’s Cubesat Constellation. J. Space Weather Space Clim. 2022, 12, 14. [Google Scholar] [CrossRef]
  13. Arras, C.; Jacobi, C.; Wickert, J. Semidiurnal Tidal Signature in Sporadic E Occurrence Rates Derived from GPS Radio Occultation Measurements at Higher Midlatitudes. Ann. Geophys. 2009, 27, 2555–2563. [Google Scholar] [CrossRef]
  14. Hodos, T.J.; Nava, O.A.; Dao, E.V.; Emmons, D.J. Global Sporadic-E Occurrence Rate Climatology Using GPS Radio Occultation and Ionosonde Data. J. Geophys. Res. Space Phys. 2022, 127, e2022JA030795. [Google Scholar] [CrossRef]
  15. Gooch, J.Y.; Colman, J.J.; Nava, O.A.; Emmons, D.J. Global Ionosonde and GPS Radio Occultation Sporadic-E Intensity and Height Comparison. J. Atmos. Sol.-Terr. Phys. 2020, 199, 105200. [Google Scholar] [CrossRef]
  16. Kursinski, E.R.; Haij, G.A.; Leroy, S.S.; Herman, B. The GPS Radio Occultation Technique. TAO Terr. Atmos. Ocean. Sci. 2000, 11, 53–114. [Google Scholar] [CrossRef]
  17. Frissell, N.A.; Vega, J.S.; Markowitz, E.; Gerrard, A.J.; Engelke, W.D.; Erickson, P.J.; Miller, E.S.; Luetzelschwab, R.C.; Bortnik, J. High-Frequency Communications Response to Solar Activity in September 2017 as Observed by Amateur Radio Networks. Space Weather 2019, 17, 118–132. [Google Scholar] [CrossRef]
  18. Frissell, N.A.; Miller, E.S.; Kaeppler, S.R.; Ceglia, F.; Pascoe, D.; Sinanis, N.; Smith, P.; Williams, R.; Shovkoplyas, A. Ionospheric Sounding Using Real-Time Amateur Radio Reporting Networks. Space Weather 2014, 12, 651–656. [Google Scholar] [CrossRef]
  19. Bychkov, V.; Golubkov, G.; Nikitin, A. The Atmosphere and Ionosphere: Elementary Processes, Discharges and Plasmoids, 1st ed.; Springer: Dordrecht, The Netherlands, 2013; pp. 79–165. [Google Scholar] [CrossRef]
  20. Heelis, R.A.; Maute, A. Challenges to Understanding the Earth’s Ionosphere and Thermosphere. J. Geophys. Res. Space Phys. 2020, 125, 1–44. [Google Scholar] [CrossRef]
  21. Bychkov, V.; Golubkov, G.; Nikitin, A. The Atmosphere and Ionosphere: Dynamics, Processes and Monitoring; Springer: Dordrecht, The Netherlands, 2010; pp. 97–147. [Google Scholar] [CrossRef]
  22. Yonezawa, T. Theory of formation of the ionosphere. Space Sci. Rev. 1966, 5, 3–56. [Google Scholar] [CrossRef]
  23. Jacobs, G.; Cohen, T.J.; Rose, R.B. The New Shortwave Propagation Handbook, 2nd ed.; CQ communications Inc.: New York, NY, USA, 1997. [Google Scholar]
  24. Haldoupis, C. A tutorial review on sporadic E layers. In Aeronomy of the Earth’s Atmosphere and Ionosphere, 1st ed.; Abdu, M.A., Pancheva, D., Eds.; Springer: Dordrecht, The Netherlands, 2011; Volume 2, pp. 381–394. [Google Scholar]
  25. Abdu, M.A.; Pancheva, D. Aeronomy of the Earth’s Atmosphere and Ionosphere, 1st ed.; Springer: Dordrecht, The Netherlands, 2011. [Google Scholar] [CrossRef]
  26. Resende, L.C.A.; Zhu, Y.; Denardini, C.M.; Batista, I.S.; Shi, J.; Moro, J.; Chen, S.S.; Conceição-Santos, F.; Da Silva, L.A.; Andrioli, V.F.; et al. New Findings of the Sporadic E (Es) Layer Development Around the Magnetic Equator During a High-Speed Solar (HSS) Wind Stream Event. J. Geophys. Res. Space Phys. 2021, 126, 1–17. [Google Scholar] [CrossRef]
  27. Collinson, G.A.; McFadden, J.; Grebowsky, J.; Mitchell, D.; Lillis, R.; Withers, P.; Vogt, M.F.; Benna, M.; Espley, J.; Jakosky, B. Constantly Forming Sporadic E-like Layers and Rifts in the Martian Ionosphere and Their Implications for Earth. Nat. Astron. 2020, 4, 486–491. [Google Scholar] [CrossRef]
  28. Hosokawa, K.; Sakai, J.; Tomizawa, I.; Saito, S.; Tsugawa, T.; Nishioka, M.; Ishii, M. A monitoring network for anomalous propagation of aeronautical VHF radio waves due to sporadic E in Japan. Earth Planets Space 2020, 72, 1–10. [Google Scholar] [CrossRef]
  29. Ellis, J.A.; Emmons, D.J.; Cohen, M.B. Detection and Classification of Sporadic E Using Convolutional Neural Networks. Space Weather 2024, 22, 1–19. [Google Scholar] [CrossRef]
  30. Mathews, J.D. Sporadic E: Current Views and Recent Progress. J. Atmos. Sol.-Terr. Phys. 1998, 60, 413–435. [Google Scholar] [CrossRef]
  31. Wu, D.L.; Ao, C.O.; Hajj, G.A.; de la Torre Juarez, M.; Mannucci, A.J. Sporadic E Morphology from GPS-CHAMP Radio Occultation. J. Geophys. Res.—Space Phys. 2005, 110, A01306-n/a. [Google Scholar] [CrossRef]
  32. Garcia-Fernandez, M.; Tsuda, T. A Global Distribution of Sporadic E Events Revealed by Means of CHAMP-GPS Occultations. Earth Planets Space 2006, 58, 33–36. [Google Scholar] [CrossRef]
  33. Davies, K. Ionospheric Radio; IEE Electromagnetic Waves Series, No. 31; Peter Peregrinus Ltd.: London, UK, 1990. [Google Scholar]
  34. Budden, K.G. The Propagation of Radio Waves: The Theory of Radio Waves of Low Power in the Ionosphere and Magnetosphere; Cambridge University Press: New York, NY, USA, 1985. [Google Scholar]
  35. Venkatesh, K.; Pallamraju, D.; Dalsania, K.P.; Chakrabarty, D.; Pant, T.K. Evaluation of the Performance of F-Layer Peak Height Models Used in IRI-2016 over the Indian Equatorial and Low Latitudes. Adv. Space Res. 2024, 73, 3797–3807. [Google Scholar] [CrossRef]
  36. Oliver, W.L. An Asymptotic Model of the F Layer. J. Geophys. Res. Space Phys. 2012, 117, A01312-1-10. [Google Scholar] [CrossRef]
  37. McCune, E. The ARRL Handbook for Radio Communications, 98th ed.; ARRL: Newington, CT, USA, 2021. [Google Scholar]
  38. Greenman, M. Digital Modes, 1st ed.; Radio Society of Great Britain: Bedford, UK, 2011; Volume 1. [Google Scholar]
  39. Silver, H.W. Digital Protocols and Modes. In The ARRL Handbook for Radio Communications, 98th ed.; The American Radio Relay League: Newington, CT, USA, 2021; pp. 15.1–15.36. [Google Scholar]
  40. Franke, S.; Sommerville, B.; Taylor, J. The FT4 and FT8 Communication Protocols. QEX July/August 2020, 7–17. Available online: https://wsjt.sourceforge.io/FT4_FT8_QEX.pdf (accessed on 24 September 2024).
  41. Correll, B.; Swanson, C.N. Difference-Based Structural Properties of Costas Arrays. Des. Codes Cryptogr. 2023, 91, 779–794. [Google Scholar] [CrossRef]
  42. Radu, S.; Uludag, S.; Speretta, S.; Bouwmeester, J.; Gill, E.; Chronas Foteinakis, N. Delfi-PQ: The first pocketqube of Delft University of Technology. In Proceedings of the 69th International Astronautical Congress, Bremen, Germany, 1–5 October 2018. [Google Scholar]
  43. Bouwmeester, J.; Radu, S.; Uludag, M.S.; Chronas, N.; Speretta, S.; Menicucci, A.; Gill, E.K.A. Utility and Constraints of PocketQubes. CEAS Space J. 2020, 12, 573–586. [Google Scholar] [CrossRef]
  44. Frissell, N.; Romanek, V.; Miller, E.; Erickson, P.; Engelke, W.; Luetzelschwab, R.; Gerzoff, R.; Howell, F. HamSCI: Ionospheric Climatology Over a Complete Solar Cycle Observed Using Amateur Radio Contact Data. Authorea 2022, 2, 1–14. [Google Scholar] [CrossRef]
  45. Retzler, A. Software Defined Radio Receiver Application with Web-based Interface. Bachelor’s Thesis, Budapest University of Technology and Economics, Budapest, Hungary, 2014. [Google Scholar]
  46. Tutun, J.; Girianto, S. An SDR-Based Multistation FM Broadcasting Monitoring System. In Proceedings of the 11th International Conference on Telecommunication Systems Services and Applications (TSSA), Lombok, Indonesia, 26–27 October 2017. [Google Scholar] [CrossRef]
  47. Frissell, N.A.; Kaeppler, S.R.; Sanchez, D.F.; Perry, G.W.; Engelke, W.D.; Erickson, P.J.; Coster, A.J.; Ruohoniemi, J.M.; Baker, J.B.H.; West, M.L. First Observations of Large Scale Traveling Ionospheric Disturbances Using Automated Amateur Radio Receiving Networks. Geophys. Res. Lett. 2022, 49, e2022GL097879. [Google Scholar] [CrossRef]
  48. STM32 Nucleo-64 Development Board with STM32F401RE MCU, Supports Arduino and ST Morpho Connectivity. Available online: https://www.st.com/en/evaluation-tools/nucleo-f401re.html (accessed on 25 July 2024).
  49. Si5351A/B/C, I²C Programmable Any-Frequency CMOS Clock Generator + VCXO, Silicon Labs. Available online: https://cdn-shop.adafruit.com/datasheets/Si5351.pdf (accessed on 18 September 2024).
  50. Sidiku Mosunmola, B.; Agboola, A.O.; Ale, F.; Abdullahi, M. The Mathematical Model Of Doppler Frequency Shift in Leo At Ku, K And Ka Frequency Bands. Int. J. Trend Res. Dev. (IJTRD) 2017, 4, 156–160. Available online: https://www.ijtrd.com/papers/IJTRD12035.pdf (accessed on 25 July 2024).
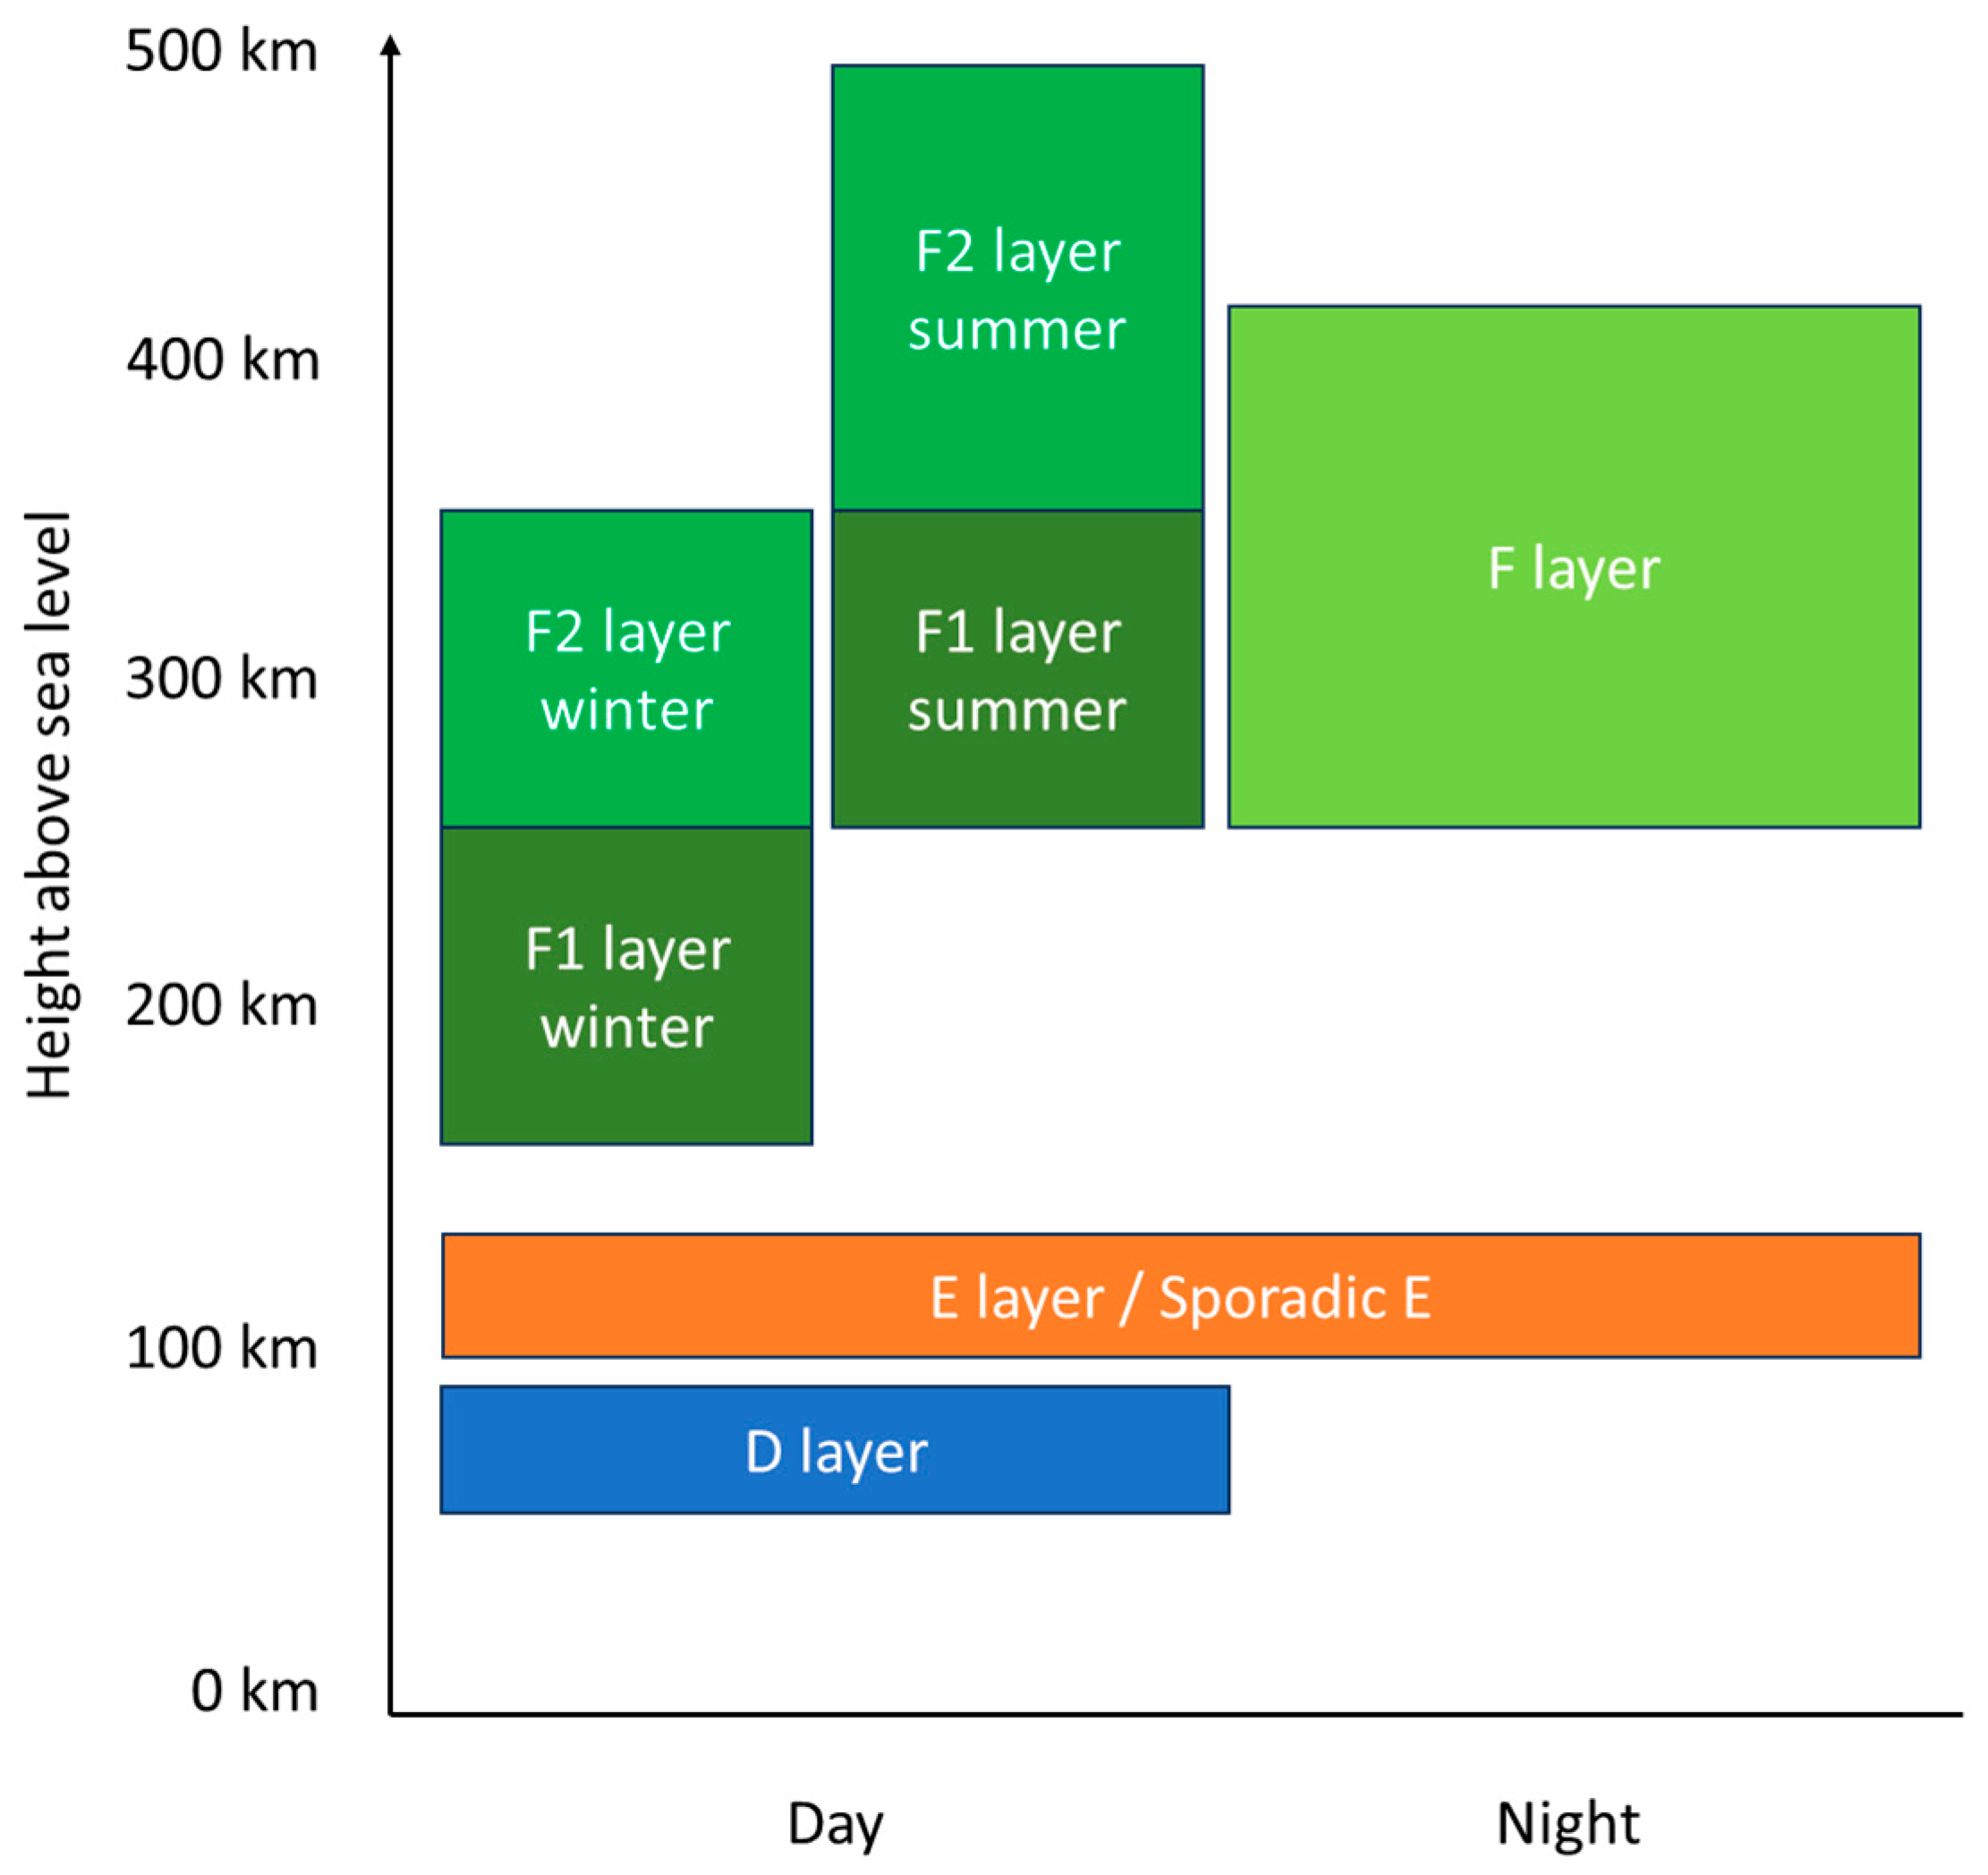
Figure 1. Ionospheric layers.
Atmosphere 15 01306 g001
Figure 2. Sporadic E reception setup.
Atmosphere 15 01306 g002
Figure 3. Initial CAD of Delfi-Twin satellites.
Atmosphere 15 01306 g003
Figure 4. Schematic of the FT4/CW beacon system.
Atmosphere 15 01306 g004
Figure 5. Prototype board containing the Nucleo64, the Si5351 and the GNSS module (amplifier not shown).
Atmosphere 15 01306 g005
Figure 6. The reception of the beacon CW by the Reverse Beacon Network.
Atmosphere 15 01306 g006
Figure 7. The reception of the beacon FT4 by OpenWebRX.
Atmosphere 15 01306 g007
Figure 8. Simulated Doppler shift on the FT4 signal at 120 mHz.
Atmosphere 15 01306 g008
Figure 9. Simulated Doppler shift on the FT4 signal at 200 mHz.
Atmosphere 15 01306 g009
Figure 10. Simulated Doppler shift on the FT4 signal at 250–240 mHz.
Atmosphere 15 01306 g010
Table 1. Parametric overview of the used space-based platform.
ParameterValueUnit
Orbit
Mass
550
10.5
km
Grams
Volume42 × 42 × 20mm
GNSS onboard neededPreferably
Voltage level5V
Power consumption300mW
RF output power level>10mW
Current consumption (idle)20mA
Current consumption (peak)60mA
Power supplySolar based
Frequency for satellite 1
Frequency for satellite 2
28
50
MHz
MHz
Disclaimer/Publisher’s Note: The statements, opinions and data contained in all publications are solely those of the individual author(s) and contributor(s) and not of MDPI and/or the editor(s). MDPI and/or the editor(s) disclaim responsibility for any injury to people or property resulting from any ideas, methods, instructions or products referred to in the content.