Article

Transmission Spectroscopy Along the Transit of Venus: A Proxy for Exoplanets Atmospheric Characterization

1
Institute of Astrophysics and Space Sciences, Observatório Astronómico de Lisboa, Ed. Leste, Tapada da Ajuda, 1349-018 Lisboa, Portugal
2
Faculdade de Ciências, Universidade de Lisboa, Campo Grande 016, 1749-016 Lisboa, Portugal
3
Institute of Astrophysics and Space Sciences, Universidade do Porto, CAUP, Rua das Estrelas, 4150-762 Porto, Portugal
4
Departamento de Física e Astronomia, Faculdade de Ciências, Universidade do Porto, Rua do Campo Alegre, 4169-007 Porto, Portugal
5
INAF—Osservatorio Astrofisico di Arcetri, Largo Enrico Fermi 5, 50125 Firenze, Italy
6
National Solar Observatory, 22 Ohia Ku Street, Pukalani, HI 96768, USA
7
LESIA, Observatoire de Paris, Université PSL, CNRS, Sorbonne Université, Université Paris Cité, 5 Place Jules Janssen, 92195 Meudon, France
8
Université Paris-Saclay, UVSQ, DYPAC, 78000 Versailles, France
9
Université Côte d’Azur, Observatoire de la Côte d’Azur, CNRS, Laboratoire Lagrange, Bd de l’Observatoire, CS 34229, 06304 Nice Cedex 4, France
*
Author to whom correspondence should be addressed.
Atmosphere 2024, 15(12), 1431; https://doi.org/10.3390/atmos15121431
Submission received: 30 September 2024 / Revised: 15 November 2024 / Accepted: 26 November 2024 / Published: 28 November 2024
(This article belongs to the Section Planetary Atmospheres)

Abstract

:
We present an analysis of high-resolution, near-infrared (NIR) spectra relative to the solar transit of Venus of 5–6 June 2012, as observed with the Facility Infrared Spectropolarimeter (FIRS) at the Dunn Solar Telescope in New Mexico. These observations offer the unique opportunity to probe the upper layers (above ∼84 km in altitude) of a thick, CO2-dominated atmosphere with the transmission spectroscopy technique—a proxy for future studies of highly-irradiated atmospheres of Earth-sized exoplanets. We were able to directly observe absorption lines from the two most abundant CO2 isotopologues, and from the main isotopologue of CO in the retrieved spectrum of Venus. Furthermore, we performed a cross-correlation analysis of the transmission spectrum using transmission templates generated with petitRADTRANS. With the cross-correlation technique, it was possible to confirm detections of both CO2 isotopologues and CO. Additionally, we retrieved a tentative cross-correlation signal for O3 on Venus. We demonstrate the feasibility of high-resolution, ground-based observations to study the chemical inventory of planetary atmospheres, employing techniques commonly used in exoplanet characterization.

1. Introduction

The transits of Venus across the solar disk represent some of the rarest astronomical phenomena that can be predicted. Historically, these events have great scientific relevance. In the eighteenth century, they enabled the first detection of the Venusian atmosphere and motivated the first estimates of the absolute scale of the Solar System [1,2]. The transit of Venus of 5–6 June 2012 was the last one of the twenty-first century and it offered a unique opportunity to closely observe a transiting, thick, CO2-dominated atmosphere using high-resolution ground-based spectrographs [3].
Several studies have relied on the transmission spectroscopy technique to characterize the atmospheric composition, dynamics, and structure of hot giant exoplanets [4,5,6]. This technique is also being applied to the characterization of increasingly smaller planets, including mini-Neptunes, super-Earths, and telluric Earth-sized worlds [7,8]. Nonetheless, a challenging aspect of the characterization of small, Earth-mass exoplanets arises from their compact atmospheres, with small atmospheric scale heights [9].
As future ground- and space-based observatories (e.g., ELT or ARIEL) aim to characterize potential Earth analogs, Venus comprises a valuable proxy for an Earth-sized rocky exoplanet. Due to their short orbital periods, Venus-like planets are easier to detect and characterize with the transit method than planets with similar radii but larger orbital distances. Thus, the characterization of nearby, highly irradiated atmospheres, akin to Venus, is likely to initiate the study of Earth-sized planets within the inner edge of the habitable zone [10]. In this context, dedicated observations of Venus solar transits consist of an important test bed to the feasibility of current atmospheric characterization techniques to effectively study exoplanets within this mass range [2,11].
Observations of Venus transits can help identify observational discriminants of a Venus-like atmosphere and climate, which can be critical to distinguish between Earth- and Venus-like exoplanets in future observation campaigns. In this regard, the prominent observation of strong carbon dioxide bands (e.g., 4.3 μm) in transmission spectra have been regarded as a good indicator for the presence of a terrestrial atmosphere; nonetheless, they appear insufficient to discriminate between a CO2-dominated environment and an atmosphere with trace abundances of this gas [12]. The additional observation of the weaker CO2 bands can, however, suggest a higher, Venus-like abundance and allow to differentiate between distinct terrestrial climates [12]. Particularly, near-infrared (NIR) spectral bands (e.g., 1.5, 2.0, and 4.8 μm) offer the opportunity to observe some of these weaker spectral lines.
In this context, this work presents the analysis of high spectral resolution (R ∼ 90,000), NIR observations of Venus solar transit of 5–6 June 2012, covering the wavelength range from 15,624 Å to 15,680 Å. Particularly, we aimed to retrieve the planetary transmission spectrum from the aureole region of Venus. The aureole consists of a shining arc of light that is observed along the limb of Venus just before it enters onto or emerges off the solar disk. This optical phenomenon is caused by sunlight refraction in the mesosphere of Venus above the main cloud deck (i.e., at ∼70–100 km) [1,2,13,14,15].
We complement our study with a cross-correlation analysis of the transmission spectrum here retrieved. The cross-correlation technique is commonly used in the characterization of exoplanetary atmospheres, and it has successfully allowed the detection of atmospheric species in high noise spectra [4,5]. Recent modeling work from Mollière, P. and Snellen, I. (2019) [16] has addressed the feasibility of this spectral analysis tool to detect isotopologues in planetary atmospheres. Here, we take advantage of observational data with an intrinsically high planetary signal to evaluate the performance of this technique in conditions where molecular absorption lines can simultaneously be observed. In doing so, we can evaluate whether current line lists are sufficient to detect molecular species which may help discriminate between Venus- and Earth-like climates.

2. Observations

Observations of the Venus solar transit of 5–6 June 2012 were conducted with the infrared arm of the Facility Infrared Spectropolarimeter (FIRS) at the 76.2 cm aperture Dunn Solar Telescope (DST), located at the U.S. National Solar Observatory on Sacramento Peak, New Mexico [17]. The observations were performed using FIRS Fe I 15,648 Å mode, which covers a near-infrared wavelength range from 15,624 Å to 15,680 Å. Combined with a single instrument slit, with a width of 0.3″ and height of 75″, this observation mode enabled us to achieve a spectral resolving power of R ∼ 90,000. The employed FIRS mode is affected by a Rayleigh limit of 0.52″; however, Venus’ apparent diameter during observations was 57.8″. Hence, these data provide spatially resolved spectra of the Venus disk, following a spatial sampling of 0.3″× 0.15″/pixel.
The FIRS slit was aligned perpendicularly to the transit path and was scanned in the direction of the planet’s path across the Sun. This study considers 295 2-D spectra taken throughout Venus’ passage of the solar limb at ingress. Each 2-D spectrum corresponds to a 125 msec exposure with associated values of spectral intensity across 502 spatial pixels and 1018 wavelength bins, with a binning of 0.055 Å. All exposures were individually processed, following bias, dark, and flat-field corrections. For the latter, a master flat-field image was constructed from observations of the solar disk center with spectral lines removed [17]. A solution to the spectral geometry and wavelength was determined based on line fitting in spectra taken with a calibration grid. The spectra were then interpolated to make the spectral and spatial coordinates rectilinear.

3. Methodology

3.1. Transmission Spectrum Extraction

To extract the transmission spectrum of Venus we started by reconstructing an intensity raster map [17]. Each 2-D spectrum had its values of spectral intensity averaged across all wavelength bins for each row of spatial pixels. This results in 295 slices with an individual averaged value of spectral intensity for each spatial pixel. All slices were then stacked next to one another according to the scanning spatial sequence, resulting in the raster map (Figure 1; average intensity represented by a log-scaled color bar). The intensity distribution on the map facilitates the identification of groups of pixels sampling the Sun (showcasing a maximum intensity towards the right-hand side of the image), as well as the planetary disk blocking a portion of the solar disk between contacts I and II.
The raster map showcases a region of particularly enhanced average spectral intensity surrounding the planetary disk at the center-top part of the image (between X = 36″ and 66″, and Y = 59″ and 70″). This thin band corresponds to the aureole of Venus’ atmosphere, and we relied on this specific region of the planetary limb to extract our transmission spectrum. For that, we started by describing a spatial window around Venus that enveloped the limb. Attending to the apparent diameter of Venus during observations (of 57.8″) and to the spatial sampling of our data (0.3″ × 0.15″/pixel), we determined that the planetary limb comprises the area delimited by two concentric ellipses centered at (X, Y) = (57″, 39.75″), as illustrated with gray dashed lines in Figure 1.
We then reconstructed the intensity raster map for the region between both ellipses in which the aureole signal could be observed, i.e., between X = 36″ and X = 66″. All slices were subsequently re-aligned such that the pixels with maximum spectral intensity were at the same vertical position (Figure 2). A spatial window, centered around these high-intensity pixels, was selected with a width of four pixels in order to define our region of interest pertaining to the atmospheric aureole. All spectra contained within this area are considered to carry the atmospheric signal of the planet.
To account for the presence of stray light contaminating our aureole spectra, we selected an out-of-interest area separated by 13 pixels from the top of our region of interest and spanning until the top of each slice. For each slice, we extracted the corresponding transmission spectrum by averaging the spectra of interest and dividing the result by the average background spectrum from the same slice. We note that this step results in the normalization of our spectra, while also removing the telluric absorption lines [11].
Lastly, we combined all the individual transmission spectra into a unique average spectrum of Venus with a higher signal-to-noise ratio. Consequently, the information about the altitude and the corresponding Doppler shifts by winds were lost with this step [11]. To correct for remaining low-frequency variations in the spectrum, we further normalized it by fitting the continuum with splines and dividing the spectrum by the resulting fit.
It is noteworthy that FIRS infrared data from regions of the planet’s limb projected onto the solar disk appears contaminated by wiggle patterns (i.e., fringes), which could not be removed with frequent flat fields and which seem to originate from two distinct sources. On the one hand, high-frequency fringes have been found to be well aligned with the detector and are most likely features of the read-out electronics. On the other, low-frequency fringes appear aligned with the spectra due to optical interference in the instrument. We tried to correct such interference signals using two distinct approaches. For lower-frequency fringes, we directly fit them in each individual spectrum using a cubic splines fit. Because directly fitting higher-frequency fringes in the spectrum risked removing part of the absorption signal from Venus’ atmosphere, we opted to suppress their contribution in the Fourier space. However, despite these efforts, we were unable to fully clean the data from this interference and ultimately focused our spectral analysis on the unaffected aureole region of Venus.

3.2. Atmospheric Transmission Models

In order to perform a cross-correlation analysis of the transmission spectrum of Venus [5], we used the petitRADTRANS package [18] to create an atmospheric transmission model for each chemical species here regarded.
Attending to the chemical abundances estimated for the upper atmosphere of Venus [2,19], we searched for species that could present absorption lines in our wavelength range. Particularly, we aimed to retrieve cross-correlation signals for CO2, CO and O3.
petitRADTRANS is a radiative transfer code commonly used to calculate transmission spectra of exoplanetary atmospheres at either low- or high-spectral resolution. Our models were computed at a resolving power of R = 106, and were subsequently convolved with a Gaussian kernel using tayph (https://github.com/Hoeijmakers/tayph, accessed on 1 May 2024), so that the spectral resolution could be reduced to match that of FIRS. petitRADTRANS takes as input a pressure-temperature (PT) profile, the planetary radius and surface gravity, the mean-molecular weight of the atmosphere, and the abundances of the requested species.
According to Ehrenreich, D.; et al. (2012) [2], who calculated a theoretical transmission spectrum of the atmosphere of Venus as it could be observed during the solar transit of June 2012, the lowest altitude on Venus that is possible to be probed with transmission spectroscopy is set by Mie scattering from the high-altitude atmospheric haze, which corresponds to the dominant diffusion regime in the atmosphere [2]. The upper haze on Venus is characterized by a bimodal distribution of aerosols, with mode-1 and mode-2 particles. Mode-1 particles have typical radii from 0.1 to 0.3 μm, and their size distribution is described by a log-normal distribution with a mean of 0.2 μm and a standard deviation of 0.2. On the other hand, mode-2 particles have typical radii from 0.4 to 1.0 μm, and follow a log-normal distribution with a mean of 0.6 μm and a standard deviation of 1.5. According to the lowest probed altitudes computed by Ehrenreich et al. (2012) [2], based on the radiative transfer code described in Ehrenreich et al. (2006) [9], the lowest altitude probed with our NIR observations should correspond to ∼72 km, if the atmospheric haze is only composed of mode-1 aerosol particles and ∼84 km if mode-2 particles are also included. Furthermore, according to Pere, C; et al. (2016) [15], who estimated the highest altitudes probed on Venus when observing refracted aureole light, we expect the maximum altitude contributing to our transmission spectrum to extend beyond 150 km. This marks the minimum altitude at which a light beam passing through Venus’ atmosphere experiences enough refraction to be detectable. The same authors estimated the scale height of Venus’ atmosphere at these upper layers to be H = 4.8 ± 0.5 km [15]. Despite the 150 km minimum, a beam can still probe heights up to 250 km as it travels through the atmosphere. Therefore, approximately 21 scale heights above 150 km altitude are still expected to be probed, with the deviation by refraction becoming too small beyond these altitudes to deflect sunlight towards the observer. Therefore, we expect our NIR transmission spectrum of Venus to probe the atmospheric layers above the top of Venus’ cloud deck.
Based on the Venus International Reference Atmosphere (VIRA) [20,21] temperature profile at these altitudes, we chose to approximate the Venus’ PT profile to an isothermal profile with a temperature of 175 K. We adopted atmospheric top and bottom pressures of 10−8 and 10−3 bars, respectively, for all models except for that of 16O3. Attending to the localized vertical distribution of ozone on Venus (∼90–100 km; [22]), we adopted atmospheric top and bottom pressures of 10−6 and 10−5 bars, respectively, for computing the corresponding transmission model.
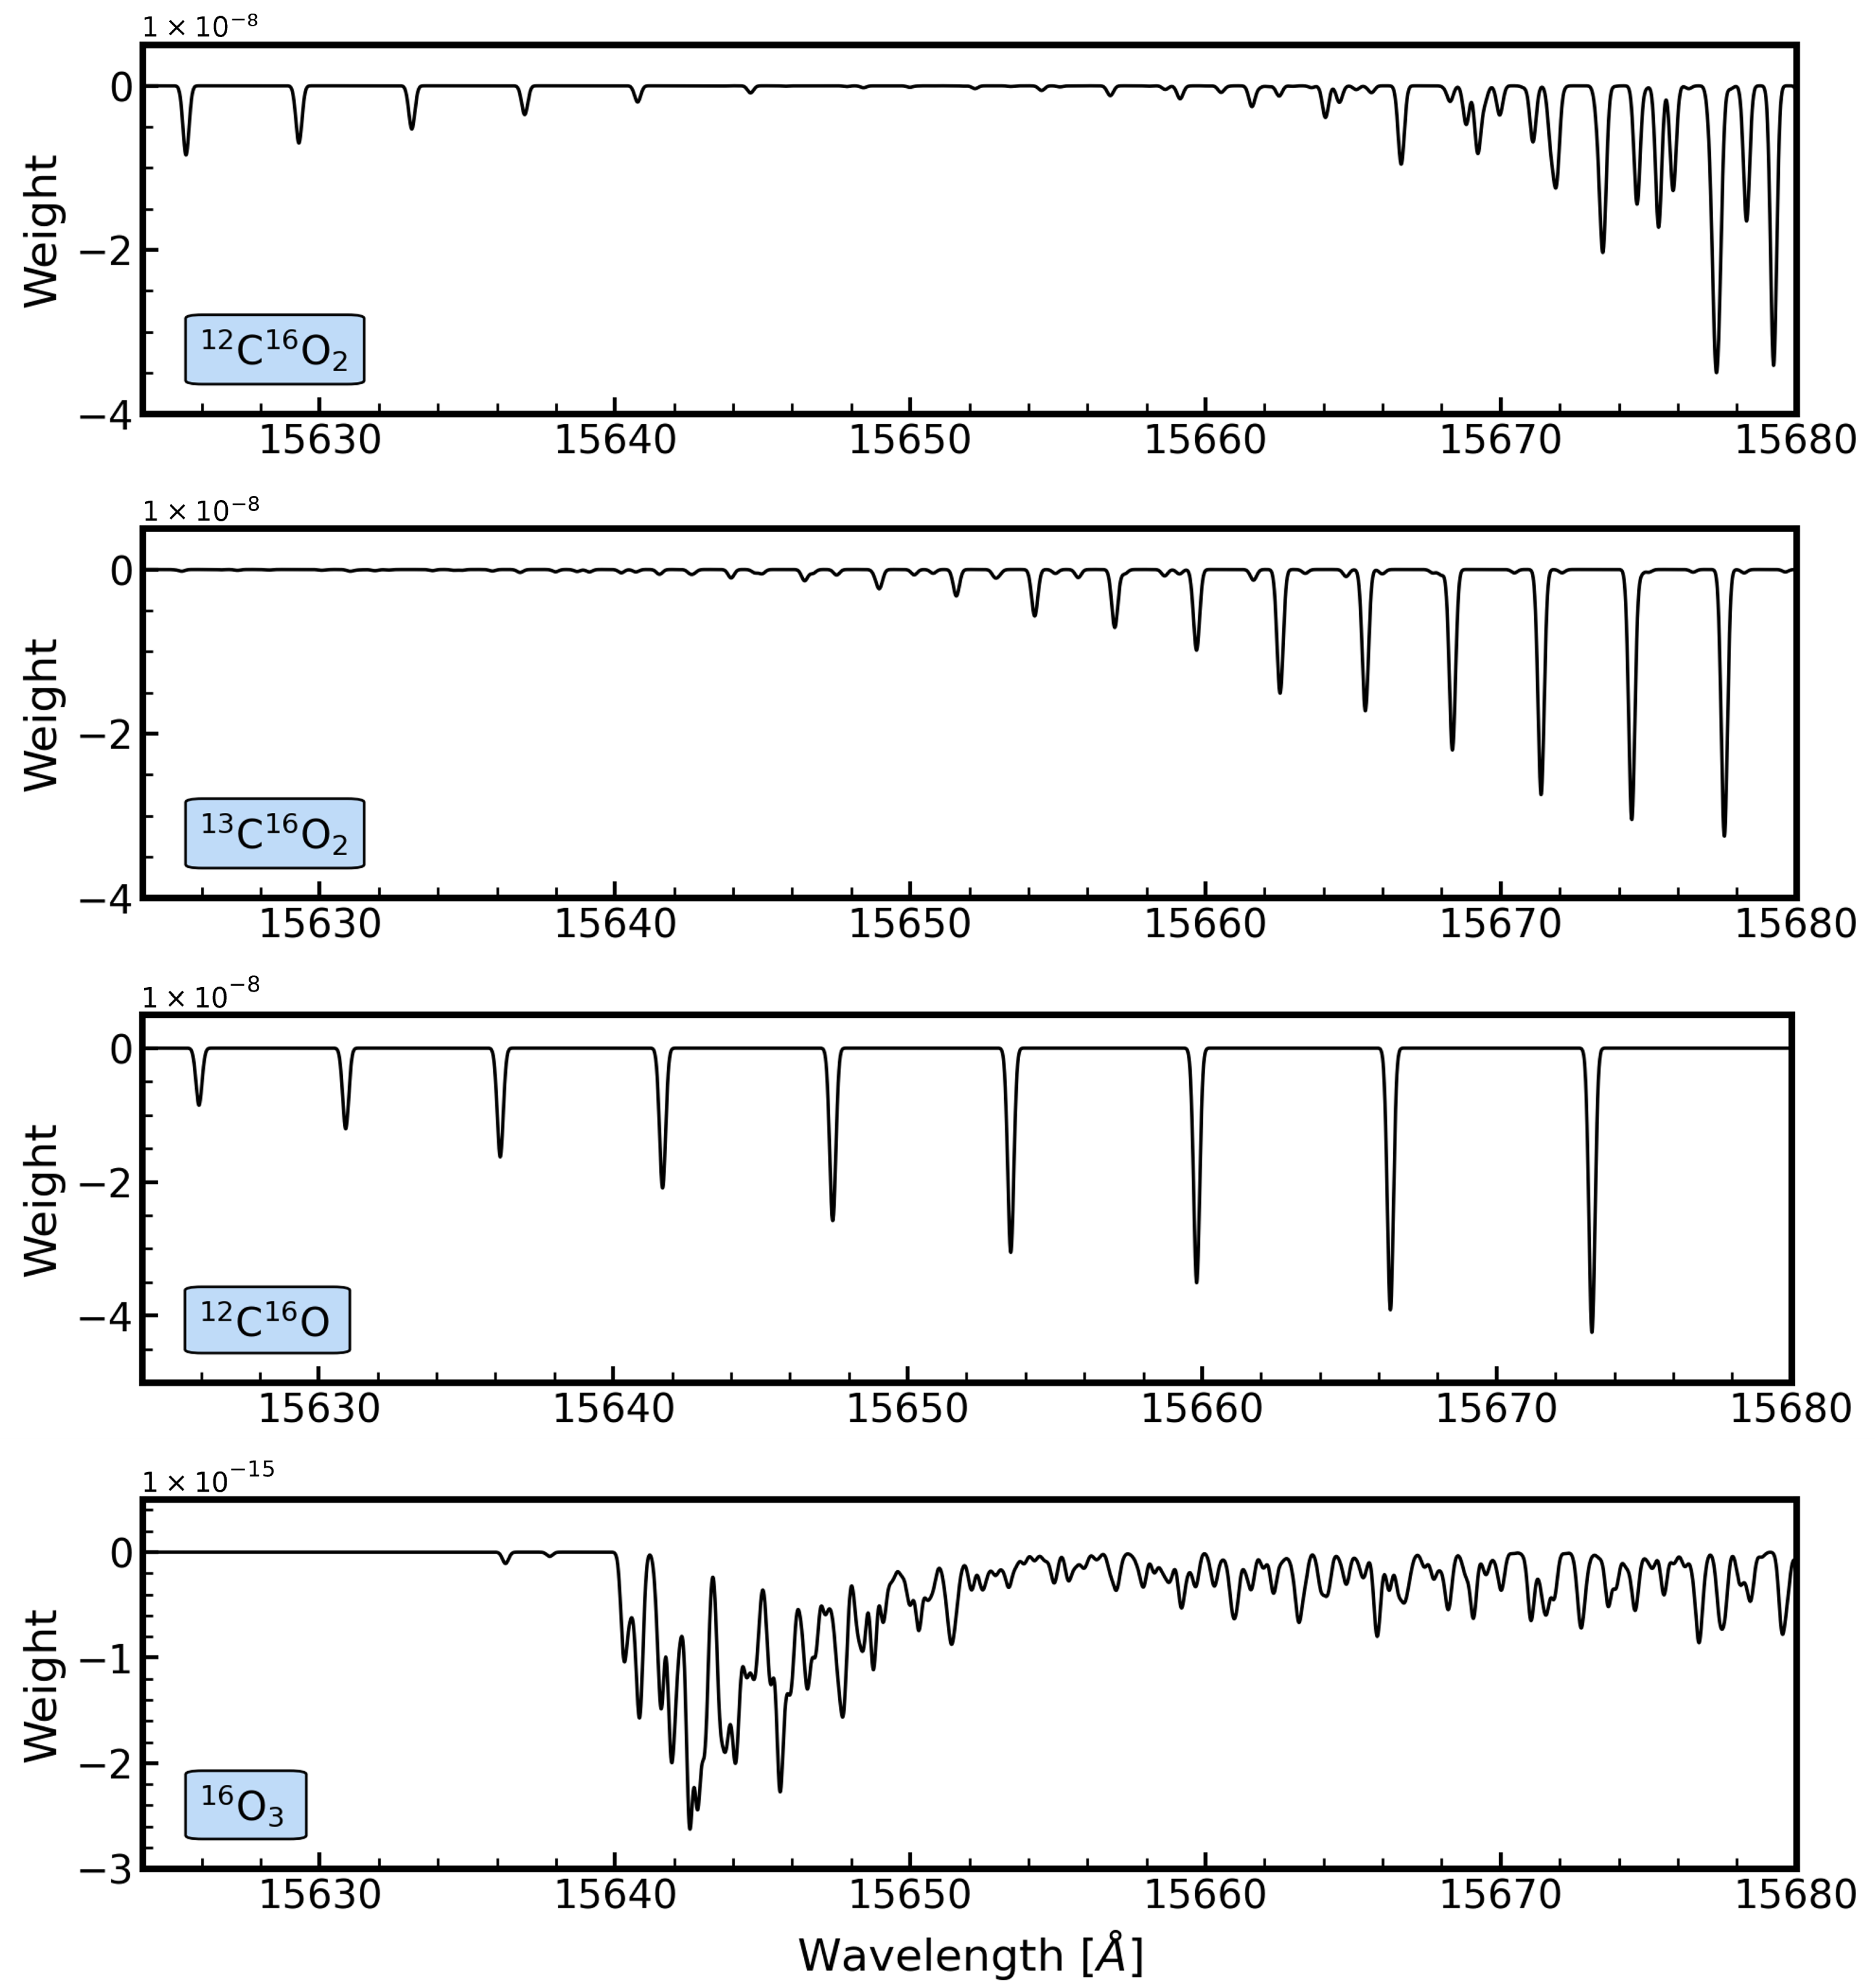
The petitRADTRANS package has available pre-computed HITEMP line opacities of 12C16O2, 12C16O and 16O3, which we included in our models [23]. We also converted pre-computed HITEMP line opacities of 13C16O2 from the Data Analysis Centre for Exoplanets (DACE) opacity database (https://dace.unige.ch/opacityDatabase/?, accessed on 1 May 2024) [24] into the petitRADTRANS format, following the procedure described in the code documentation website (https://petitradtrans.readthedocs.io, accessed on 1 May 2024). For all gases, we assumed constant vertical abundance profiles (see Table 1 for the adopted abundances). In Figure A1, we show our transmission templates ready to be used for cross-correlation.
We note that no continuum opacity sources were included in our transmission models (e.g., sulphuric acid cloud or haze droplets). Effectively, matching absorption features between our spectral templates and the retrieved transmission spectrum is sufficient for the purpose of our cross-correlation analysis. Additionally, as we work with relative spectral intensity measurements, the spectral signature of sulphuric acid in this wavelength range should correspond to a flat continuum. Hence, it would not be introducing any specific spectral signatures that would end up matching those of a transmission model with H2SO4. Following Hedelt, P.; et al. (2011) [11], we also recognize that extinction by H2SO4 cloud particles can essentially be neglected at the altitudes probed with our observations, as this effect is expected to only extend up to about 80 km altitude. Furthermore, according to Hedelt, P.; et al. (2011) [11], the transmission spectrum of Venus in the NIR should reveal negligible contributions from atmospheric haze opacities, due to the low extinction coefficients expected for such aerosols at the observed wavelengths. Note that such coefficients account for the integrated extinction along the extensive path the light beam travels through the atmosphere during an occultation event.

3.3. Cross-Correlation Analysis

We carried out a cross-correlation analysis using the normalized spectrum of Venus and the transmission templates of each molecular species. The cross-correlation technique enables individual lines in the transmission spectrum to be combined into a unique line profile. This statistical approach has been successfully used for the detection and characterization of exoplanetary atmospheres since it enables the detection of chemical species whose lines would otherwise go unnoticed due to the high noise in the transmission spectrum [5].
We note that during the transit of 5–6 June 2012, Venus was approximately three times closer to the Earth than the Sun. The transit depth can be estimated as the square of the ratio between the angular diameters of the two bodies (57.8″ for Venus and 31.5′ for the Sun), which results in 934 ppm [2]. For an Earth-sized exoplanet transiting a Sun-like star, the transit depth would be 75.7 ppm [2]. Since the S/N of our Venus DST/FIRS observations is considerably higher than that expected for future observations of telluric exoplanets, one central goal of this work was to evaluate the current feasibility of using the cross-correlation method to successively detect atmospheric constituents, which have been suggested as observational discriminants of Venus-like climates [12]. To address this topic is to assess whether current molecular absorption line-lists (e.g., HITRAN or HITEMP) used for calculating template spectra, have the precision required to detect important atmospheric absorbers on Venus.
Therefore, we computed cross-correlation functions (CCFs) using the SciPy cross-correlation tool [25] and estimated the statistical significance of CCF peaks suggestive of a planetary absorption signal. To estimate such significance, we determined peak amplitudes by fitting each signal with a Gaussian profile [4,26]. We used the lmfit Python package [27] to find the best-fit values and respective uncertainties.

4. Results and Discussion

4.1. Planetary Transmission Spectrum

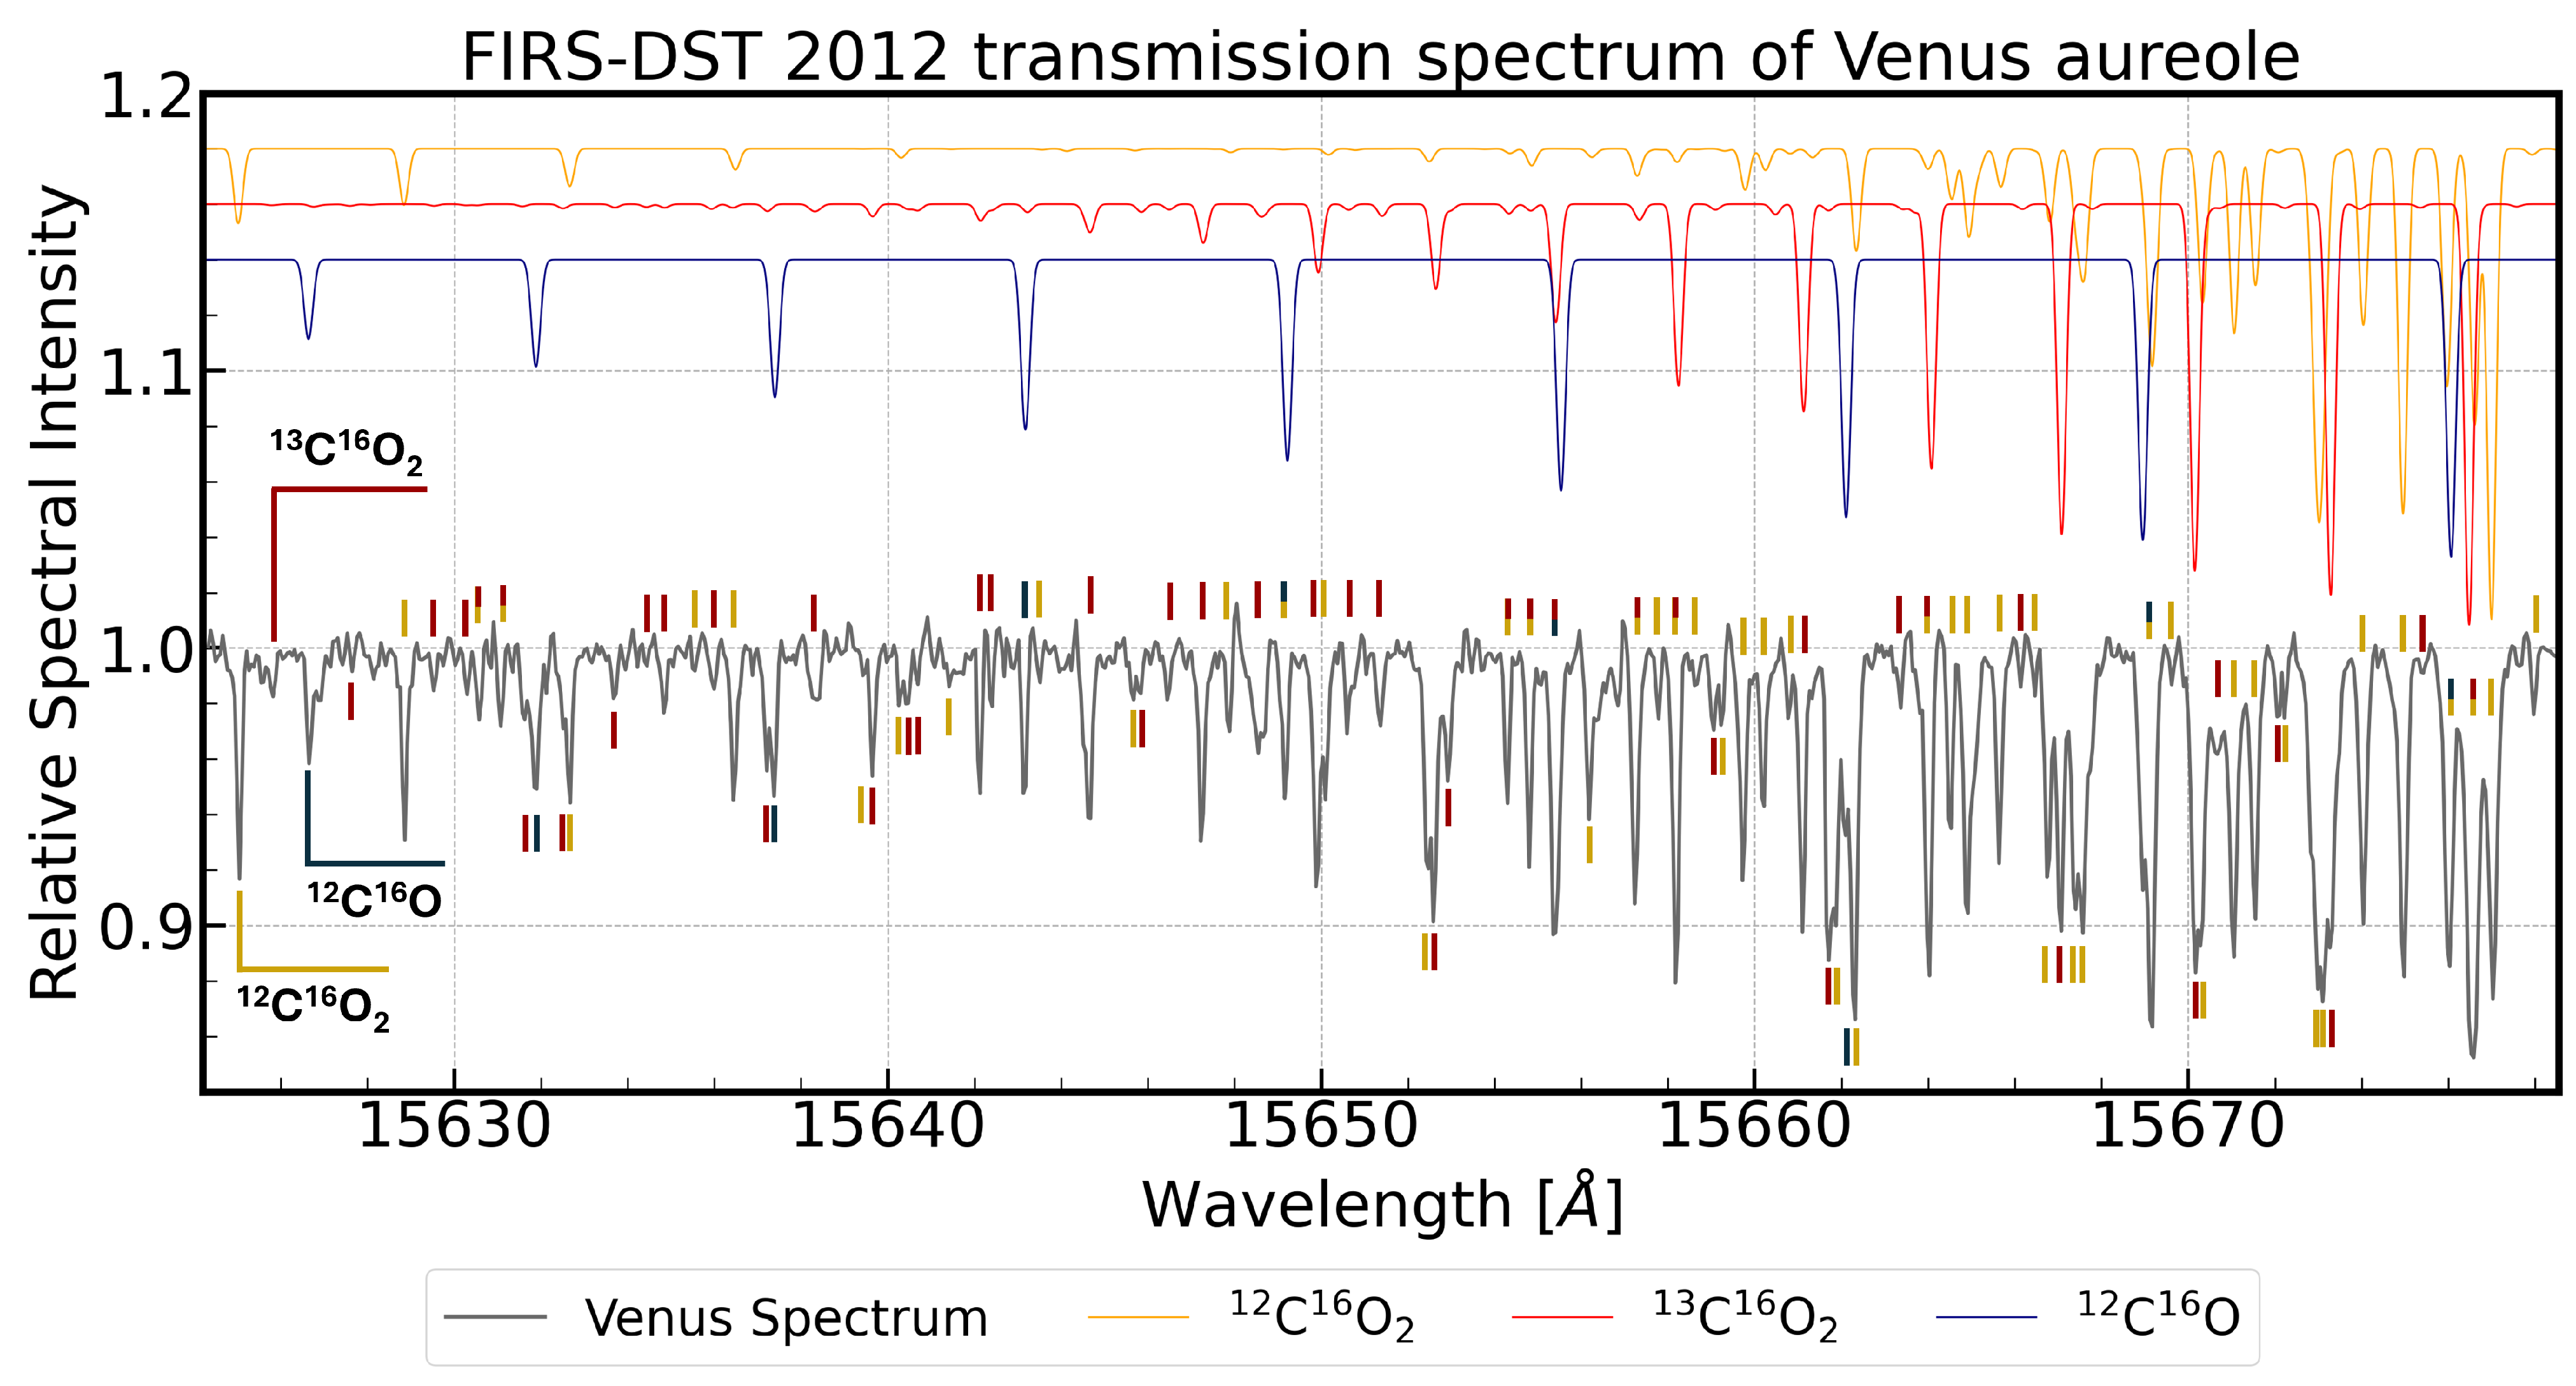
The average transmission spectrum of Venus extracted from the region of the atmospheric aureole is shown in Figure 3. The synthetic transmission spectra for 12C16O2, 13C16O2 and 12C16O generated with petitRADTRANS are also plotted with distinct vertical offsets. By comparing the observed with model spectra, we were able to recognize the position of distinct spectral features across the analyzed wavelength range. These essentially correspond to the strongest spectral lines, with several weaker features observed in the data not being clearly reflected in synthetic spectra.
We also note that the computed line profiles are not necessarily the most suitable when it comes to spectral line fitting. Performing a detailed fit and retrieval of the data will be the subject of future work, in which model parameters should be revisited. In the context of cross-correlation analysis, which motivates this study, such differences are not a concern as long as template spectra can be used to assign distinct statistical weights to each spectral wavelength where a specific molecule is known to absorb. Individual absorption lines could still be easily identified upon a visual inspection of the spectrum using line positions from the HITRAN (High-Resolution Transmission Molecular Absorption Database; [28]) line database as a reference. In doing so, it was possible to recognize individual atmospheric absorption lines as those of 12C16O2, 13C16O2 and 12C16O (see Figure 3).
The observation of weak CO2 absorption lines has been suggested as an observational discriminant of a Venus-like environment in telluric exoplanets [12]. This is associated with the high abundance of CO2 implied for the observed atmosphere by the presence of these weaker lines. While the observation of strong CO2 bands (e.g., 4.3 μ m) in transmission spectra suggests the detection of an atmosphere for terrestrial exoplanets, the inherently higher probability for these molecular transitions to take place turns their detection insufficient to discriminate between a CO2 dominated environment and one with trace amounts of this gas. The detection of weak absorption features in the retrieved transmission spectrum of Venus corroborates this hypothesis.
The extracted spectrum comprises a unique template with enhanced S/N (<60) of what a Venus-like exoplanetary atmosphere should look like when observed by NIR high-dispersion spectrographs. The visual inspection of the retrieved spectrum of Venus showcased the great chemical detail made possible by high-resolution spectroscopy. Importantly, isotopologue transition lines, only discernible at high spectral resolution, were successfully identified and used to evaluate HITRAN line list positions for 12C16O2, 13C16O2 and 12C16O.

4.2. Cross-Correlation Analysis

The resulting CCFs in Venus rest frame for the previously detected species in the transmission spectrum are shown in Figure 4, alongside the best-fit Gaussian profiles. The best-fit parameters from the Gaussian profiles (amplitude, center radial velocity, and FWHM) are listed in Table 2, along with their associated uncertainties for each CCF peak. To measure the significance of the observed signals in the CCFs we calculated the ratio of the fit amplitude to the standard deviation of the out-of-peak continuum, where the cross-correlation function is expected to be dominated by noise. We define out-of-peak continuum regions between [−30, −100] km s−1 and [+30, +100] km s−1.
For CO2, it was possible to reveal CCF signals for the two most abundant isotopologues. For the main isotopologue, 12C16O2, we find an absorption signal with a significance of 4.2 σ . Our analysis for 13C16O2 has revealed a central peak, at −0.88 ± 0.56 km s−1, but also two secondary peaks at about −60 km s−1 and +60 km s−1, which also appear significant.
To address the significance of the main peak we studied the origin of these secondary peaks on the CCF. For that, we self cross-correlated the transmission model for 13C16O2 at the same spectral resolution as the observations. The result of the template-template CCF is shown in orange in Figure 4. The template-template CCF reveals the expected signal at 0 km s−1, along with two symmetric peaks at radial velocities similar to those observed in the data-template CCF. These secondary peaks are likely a result of the periodic distribution of spectral lines for this isotopologue. Moreover, the presence of these peaks in both the data-template and template-template CCFs reinforces the detection of 13C16O2 in Venus’s transmission spectrum [26]. In this context, we masked the intervals of RV between [−40, −70] km s−1 and [+40, +70] km s−1 when measuring the significance of the main peak for 13C16O2, which was estimated to be 4.7 σ .
We note that we have calculated template-template cross-correlations for the remaining spectral templates (see Figure 4). Nonetheless, these secondary signals do not result in relevant peaks in the rest of our CCFs, apart from 13C16O2, which made us only account for these effects when estimating the significance of this detection.
Additionally, the CCF analysis enabled the detection of the main isotopologue of CO in Venus’s upper atmosphere, with a significance of 3.9 σ . In Venus’s atmosphere, CO comprises a photolytic by-product of CO2 which has been regarded as an indicator of atmospheric desiccation for rocky exoplanets [12]. This is because photolytic by-products of H2O, such as hydroxyl radicals, act as catalysts in the chemical reaction between CO and free oxygen, resulting in the production of CO2 [29].
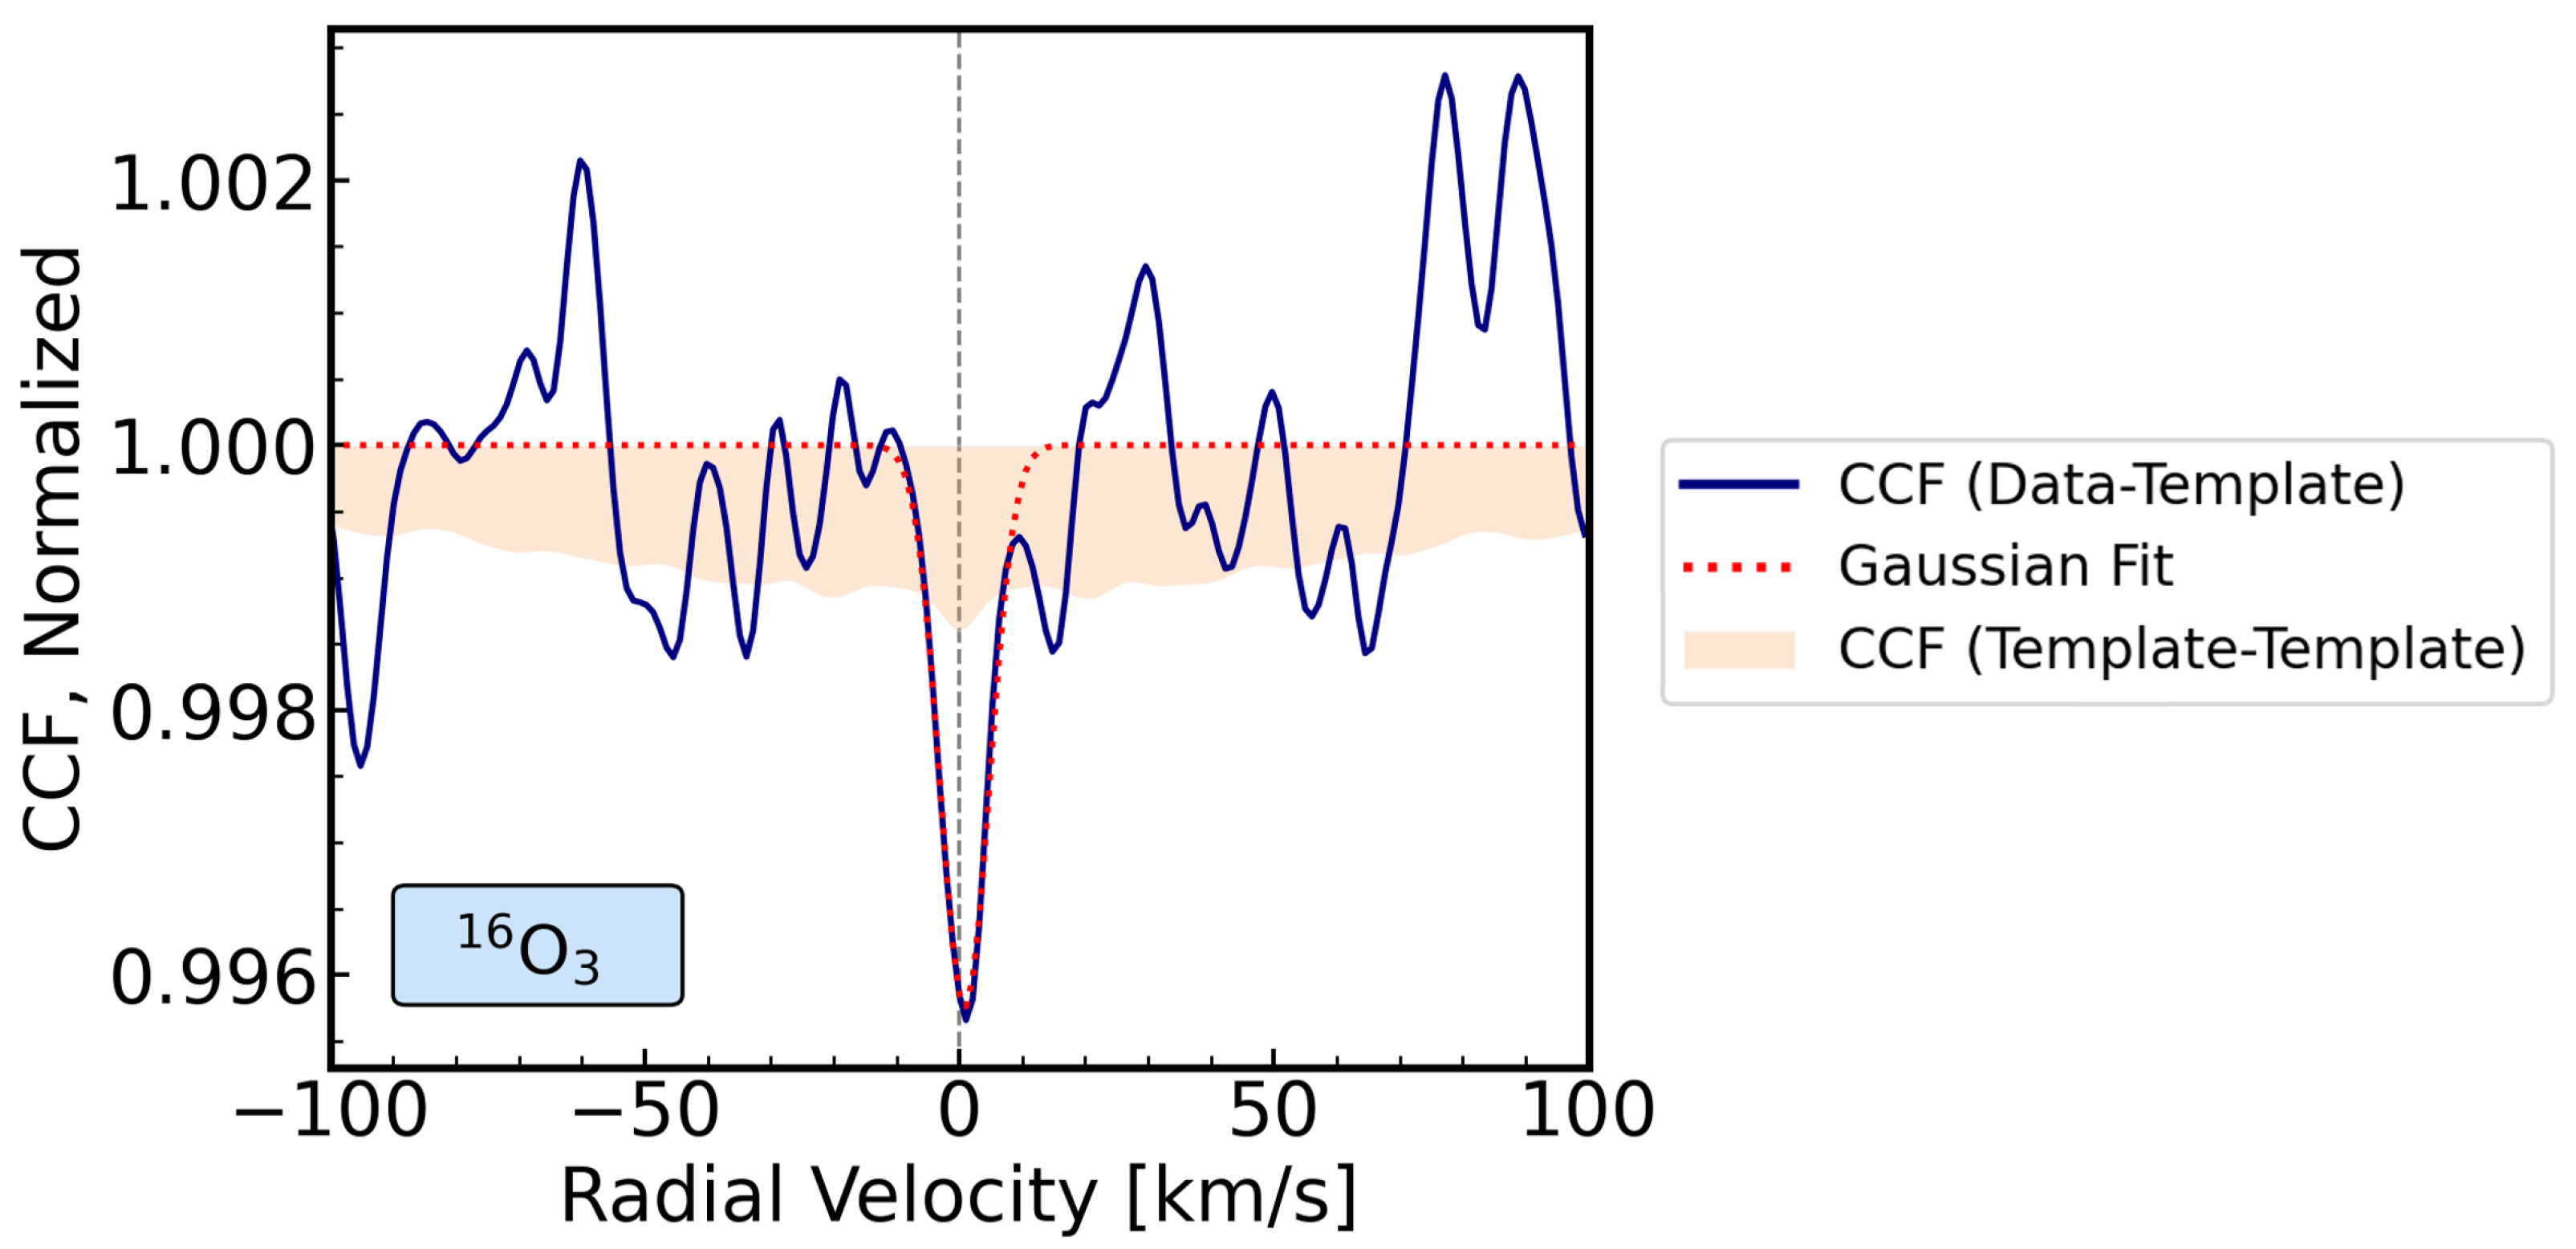
We also report a tentative detection of the main isotopologue of O3 with a significance of 3.5 σ , as shown in Figure 5. Interestingly, this potential finding follows previous detections of an ozone layer on Venus, located within the altitude range probed with our DST/FIRS observations [22,30]. Similarly to CO, O3 is produced from CO2 photolysis on Venus’ upper atmosphere [22]. However, granted its low statistical significance, we are unable to confidently claim a detection of ozone in Venus’ upper atmosphere. Nonetheless, if confirmed, this signal highlights the potential of the cross-correlation technique as a powerful tool in the search for minor atmospheric constituents in Solar System atmospheres, particularly in cases where individual spectral lines cannot be directly observed.

5. Conclusions

Our DST/FIRS high-resolution observations of Venus in the 1.5 μ m band have allowed for the resolution of distinct spectral absorption lines from the two most abundant isotopes of CO2, as well as from the main isotope of CO. Such CO2 absorption lines comprise particularly weak spectral features in comparison with strong carbon dioxide bands (e.g., 4.3 μ m). The observation of weak absorption bands of this greenhouse gas has been contemplated as an important indicator of a Venus-like abundance of CO2, which can facilitate the characterization of rocky exoplanets with Venus-like environments [12]. We showed the potential of the transmission spectroscopy technique to observe these absorption features in the NIR, using high-resolution spectrographs and relied on their observation to validate HITRAN line positions.
Additionally, our cross-correlation analysis of Venus’ transmission spectrum allowed us to retrieve CCF signals for 12C16O2, 13C16O2 and 12C16O, alongside a tentative sign of 16O3. We note that the reported detection significances cannot be used to estimate the atmospheric abundances of the said species, given these are relative to baseline regions of the CCF.
The detection of atmospheric isotopologues in telluric exoplanets, alongside the subsequent computation of isotopic ratios, comprises a valuable tool to study formation and evolutionary mechanisms in distant telluric worlds, and would ultimately provide valuable insights into the evolution and diversity of planetary systems. We highlight the capability of the cross-correlation technique to differentiate between distinct isotopologues present in the retrieved transmission spectrum of Venus. By working with observational data, our study builds upon preceding modeling efforts which explored the feasibility of the cross-correlation method to detect isotopologues in high-resolution exoplanet spectra (e.g., [16]). Eventually, our approach allows testing the cross-correlation technique in a context that more closely resembles exoplanet observations.
Furthermore, by analyzing Venus data, we are ultimately characterizing an atmosphere that has already been studied in great detail with different techniques and instrumentation, including in situ measurements. Having a previous understanding of which atmospheric species we might detect increases our confidence in the validation of the cross-correlation technique performance. A Venus-like atmospheric composition is more likely to be first characterized by current and future generations of optical instruments, as a result of exoplanet detection techniques and their biases. In this context, we evaluate whether current line lists (e.g., HITEMP and HITRAN) are sufficient to detect atmospheric species that may characterize Venus-like exoplanet environments.
Currently, it is not possible to resolve exoplanets in front of their host star as in the case of the transit of Venus here analyzed. Consequently, the reported method used to retrieve the transmission spectrum of Venus differs from that involved in retrieving the atmospheric transmission spectra of an exoplanet. One particular difference to consider is the altitude range examined in these observations. In this work, we relied on refracted light from the atmosphere to extract the planetary transmission spectrum, which constrains the altitude of the upper atmospheric layers under analysis. Conversely, exoplanet observations should not only be limited to regions affected by refraction, with other parts of the atmosphere also contributing to the planet’s transmission spectrum. Nonetheless, we expect an overlap between the atmospheric regions here observed and those to be probed in exoplanets, where similar spectral features can arise. The observations of the Venus solar transit analyzed in this study demonstrate the potential of this observational technique. With the development of future high-resolution spectrographs for the Extremely Large Telescope (e.g., ANDES; [31]), this method could be widely applied. In that context, atmospheric observables identified for Venus should be critical to differentiate between Earth and Venus analogs.

Author Contributions

Conceptualization, A.B. and P.M.; methodology, A.B., P.M., O.D., T.A.S. and S.A.J.; software, A.B. and P.M.; validation, P.M., O.D. and T.A.S.; formal analysis, A.B., P.M., T.A.S. and S.A.J.; investigation, A.B., P.M., O.D., T.A.S., S.A.J., T.W. and P.T.; resources, A.B., P.M., O.D., T.A.S., S.A.J., T.W. and P.T.; data curation, A.B. and S.A.J.; writing—original draft preparation, A.B. and P.M.; writing—review and editing, A.B., P.M., O.D. and T.A.S.; visualization, A.B., P.M., O.D., T.A.S., S.A.J., T.W. and P.T.; supervision, P.M. and O.D. All authors have read and agreed to the published version of the manuscript.

Funding

This research received no external funding.

Institutional Review Board Statement

Not applicable.

Informed Consent Statement

Not applicable.

Data Availability Statement

The raw data supporting the conclusions of this article will be made available by the authors, without undue reservation.The data are not publicly available due to privacy.

Acknowledgments

This work was supported by the Portuguese Fundação para a Ciência e a Tecnologia of reference PTDC/FIS-AST/29942/2017, through national funds and by FEDER through COMPETE 2020 of reference POCI-01-0145-FEDER-007672.

Conflicts of Interest

The authors declare no conflicts of interest.

Abbreviations

The following abbreviations are used in this manuscript:
NIRNear-Infrared
FIRSFacility Infrared Spectropolarimeter
DSTDunn Solar Telescope
ELTExtremely Large Telescope
ARIELAtmospheric Remote-sensing Infrared Exoplanet Large-survey
HITRANHigh-Resolution Transmission Molecular Absorption Database
VIRAVenus International Reference Atmosphere
DACEData Analysis Centre for Exoplanets
CCFCross-Correlation Function
RVRadial Velocity
FWHMFull Width at Half Maximum
SPICAVSpectroscopy for Investigation of Characteristics of the Atmosphere of Venus
SOIRSolar Occultation at Infrared

Appendix A

Figure A1. Transmission templates used in cross-correlation analysis for each chemical species. The y-axis displays the statistical weight assigned to each spectral wavelength, which is used to calculate the cross-correlation function. This function acts as a weighted average of the relative spectral intensity observed across the entire wavelength range, for distinct radial velocity offsets of the template. The results we present for each species use an isothermal PT profile at 175 K.
Atmosphere 15 01431 g0a1

References

  1. William, S.; Sanjay, S. Venus, 1st ed.; Reaktion Books: London, UK, 2022; pp. 44–61. [Google Scholar]
  2. Ehrenreich, D.; Vidal-Madjar, A.; Widemann, T.; Gronoff, G.; Tanga, P.; Barthélemy, M.; Lilensten, J.; Lecavelier Des Etangs, A.; Arnold, L. Transmission spectrum of Venus as a transiting exoplanet. Astron. Astrophys. 2012, 537, L2. [Google Scholar] [CrossRef]
  3. Reale, F.; Gambino, A.; Micela, G.; Maggio, A.; Widemann, T.; Piccioni, G. Using the transit of Venus to probe the upper planetary atmosphere. Nat. Commun. 2015, 6, 7563. [Google Scholar] [CrossRef] [PubMed]
  4. Azevedo Silva, T.; Demangeon, O.; Santos, N.; Allart, R.; Borsa, F.; Cristo, E.; Esparza-Borges, E.; Seidel, J.; Palle, E.; Sousa, S.; et al. Detection of barium in the atmospheres of the ultra-hot gas giants WASP-76b and WASP-121b. Together with new detections of Co and Sr+ on WASP-121b. Astron. Astrophys. 2022, 666, L10. [Google Scholar] [CrossRef]
  5. Snellen, I.; de Kok, R.; de Mooij, E.; Albrecht, S. The orbital motion, absolute mass and high-altitude winds of exoplanet HD209458b. Nature 2010, 465, 1049–1051. [Google Scholar] [CrossRef] [PubMed]
  6. Seidel, J.; Prinoth, B.; Knudstrup, E.; Hoeijmakers, H.; Zanazzi, J.; Albrecht, S. Detection of atmospheric species and dynamics in the bloated hot Jupiter WASP-172 b with ESPRESSO. Astron. Astrophys. 2023, 678, A150. [Google Scholar] [CrossRef]
  7. Madhusudhan, N.; Sarkar, S.; Constantinou, S.; Holmberg, M.; Piette, A.; Moses, J. Carbon-bearing Molecules in a Possible Hycean Atmosphere. Astrophys. J. Lett. 2023, 956, L13. [Google Scholar] [CrossRef]
  8. Lustig-Yaeger, J.; Meadows, V.; Lincowski, A. The Detectability and Characterization of the TRAPPIST-1 Exoplanet Atmospheres with JWST. Astron. J. 2019, 158, 27. [Google Scholar] [CrossRef]
  9. Ehrenreich, D.; Tinetti, G.; Lecavelier Des Etangs, A.; Vidal-Madjar, A.; Selsis, F. The transmission spectrum of Earth-size transiting planets. Astron. Astrophys. 2006, 448, 379–393. [Google Scholar] [CrossRef]
  10. Kane, S.; Barclay, T.; Gelino, D. A potential super-Venus in the Kepler-69 System. Astrophys. J. Lett. 2013, 770, L20. [Google Scholar] [CrossRef]
  11. Hedelt, P.; Alonso, R.; Brown, T.; Collados Vera, M.; Rauer, H.; Schleicher, H.; Schmidt, W.; Schreier, F.; Titz, R. Venus transit 2004: Illustrating the capability of exoplanet transmission spectroscopy. Astron. Astrophys. 2011, 533, A136. [Google Scholar] [CrossRef]
  12. Lincowski, A.; Meadows, V.; Crisp, D.; Robinson, T.; Luger, R.; Lustig-Yaeger, J.; Arney, G. Evolved Climates and Observational Discriminants for the TRAPPIST-1 Planetary System. Astrophys. J. 2018, 867, 76. [Google Scholar] [CrossRef]
  13. Pasachoff, J.; Schneider, G.; Widemann, T. High-resolution satellite imaging of the 2004 transit of Venus and asymmetries in the cytherean atmosphere. Astron. J. 2011, 141, 112. [Google Scholar] [CrossRef]
  14. Tanga, P.; Widemann, T.; Sicardy, B.; Pasachoff, J.; Arnaud, J.; Comolli, L.; Rondi, A.; Rondi, S.; Sütterlin, P. Sunlight refraction in the mesosphere of Venus during the transit on June 8th, 2004. Icarus 2012, 218, 207–219. [Google Scholar] [CrossRef]
  15. Pere, C.; Tanga, P.; Widemann, T.; Bendjoya, P.; Mahieux, A.; Wilquet, V.; Vandaele, A. Multilayer modeling of the aureole photometry during the Venus transit: Comparison between SDO/HMI and VEx/SOIR data. Astron. Astrophys. 2016, 595, A115. [Google Scholar] [CrossRef]
  16. Mollière, P.; Snellen, I. Detecting isotopologues in exoplanet atmospheres using ground-based high-dispersion spectroscopy Astron. Astrophys. 2019, 622, A139. [Google Scholar] [CrossRef]
  17. Jaeggli, S.; Reardon, K.; Pasachoff, J.; Schneider, G.; Widemann, T.; Tanga, P. 1565 nm Observations of the transit of Venus, Proxy for a Transiting Exoplanet. AAS/Sol. Phys. Div. Meet. 2013, 44, 100–150. [Google Scholar]
  18. Mollière, P.; Wardenier, J.; van Boekel, R.; Henning, T.; Molaverdikhani, K.; Snellen, I. petitRADTRANS. A Python radiative transfer package for exoplanet characterization and retrieval. Astron. Astrophys. 2019, 267, A67. [Google Scholar] [CrossRef]
  19. Gruchola, S.; Galli, A.; Vorburger, A.; Wurz, P. The upper atmosphere of Venus: Model predictions for mass spectrometry measurements. Planet. Space Sci. 2019, 170, 29–41. [Google Scholar] [CrossRef]
  20. Keating, G.; Bertaux, J.; Bougher, S.; Dickinson, R.; Cravens, T.; Nagy, A.; Hedin, A.; Krasnopolsky, V.; Nicholson III, J.; Paxton, L.; et al. Models of Venus neutral upper atmosphere: Structure and composition. Adv. Space Res. 1985, 5, 117–171. [Google Scholar] [CrossRef]
  21. Seiff, A.; Schofield, J.; Kliore, A.; Taylor, F.; Limaye, S.; Revercomb, H.; Sromovsky, L.; Kerzhanovich, V.; Moroz, V.; Marov, M. Models of the structure of the atmosphere of Venus from the surface to 100 kilometers altitude. Adv. Space Res. 1985, 5, 3–58. [Google Scholar] [CrossRef]
  22. Montmessin, F.; Bertaux, J.; Lefèvre, F.; Marcq, E.; Belyaev, D.; Gérard, J.; Korablev, O.; Fedorova, A.; Sarago, V.; Vandaele, A. A layer of ozone detected in the nightside upper atmosphere of Venus. Icarus 2011, 216, 82–85. [Google Scholar] [CrossRef]
  23. Rothman, L.; Gordon, I.; Barber, R.; Dothe, H.; Gamache, R.; Goldman, A.; Perevalov, V.; Tashkun, S.; Tennyson, J. HITEMP, the high-temperature molecular spectroscopic database. J. Quant. Spectrosc. Radiat. Transf. 2010, 111, 2139–2150. [Google Scholar] [CrossRef]
  24. Grimm, S.; Malik, M.; Kitzmann, D.; Guzmán-Mesa, A.; Hoeijmakers, H.; Fisher, C.; Mendonça, J.; Yurchenko, S.; Tennyson, J.; Alesina, F.; et al. HELIOS-K 2.0 Opacity Calculator and Open-source Opacity Database for Exoplanetary Atmospheres. Astrophys. J. Suppl. Ser. 2021, 253, 30. [Google Scholar] [CrossRef]
  25. Virtanen, P.; Gommers, R.; Oliphant, T.; Haberland, M.; Reddy, T.; Cournapeau, D.; Burovski, E.; Peterson, P.; Weckesser, W.; Bright, J.; et al. SciPy 1.0: Fundamental algorithms for scientific computing in Python. Nat. Methods 2020, 17, 261–272. [Google Scholar] [CrossRef]
  26. Esparza-Borges, E.; López-Morales, M.; Adams Redai, J.; Pallé, E.; Kirk, J.; Casasayas-Barris, N.; Batalha, N.; Rackham, B.; Bean, J.; Casewell, S.; et al. Detection of Carbon Monoxide in the Atmosphere of WASP-39b Applying Standard Cross-correlation Techniques to JWST NIRSpec G395H Data. Astrophys. J. Lett. 2023, 955, L19. [Google Scholar] [CrossRef]
  27. Newville, M.; Stensitzki, T.; Allen, D.; Rawlik, M.; Ingargiola, A.; Nelson, A. Lmfit: Non-Linear Least-Square Minimization and Curve-Fitting for Python. Astrophys. Source Code Libr. 2016. [Google Scholar] [CrossRef]
  28. Gordon, I.; Rothman, L.; Hargreaves, R.; Hashemi, R.; Karlovets, E.; Skinner, F.; Conway, E.; Hill, C.; Kochanov, R.; Tan, Y.; et al. The HITRAN2020 molecular spectroscopic database. J. Quant. Spectrosc. Radiat. Transf. 2022, 277, 107949. [Google Scholar] [CrossRef]
  29. Gao, P.; Hu, R.; Robinson, T.; Li, C.; Yung, Y. Stability of CO2 Atmospheres on Desiccated M Dwarf Exoplanets. Astrophys. J. 2015, 806, 249. [Google Scholar] [CrossRef]
  30. Marcq, E.; Baggio, L.; Lefèvre, F.; Stolzenbach, A.; Montmessin, F.; Belyaev, D.; Korablev, O.; Bertaux, J. Discovery of cloud top ozone on Venus. Icarus 2019, 319, 491–498. [Google Scholar] [CrossRef]
  31. Palle, E.; Biazzo, K.; Bolmont, E.; Molliere, P.; Poppenhaeger, K.; Birkby, J.; Brogi, M.; Chauvin, G.; Chiavassa, A.; Hoeijmakers, J.; et al. Ground-breaking Exoplanet Science with the ANDES spectrograph at the ELT. arXiv 2023, arXiv:2311.17075. [Google Scholar] [CrossRef]
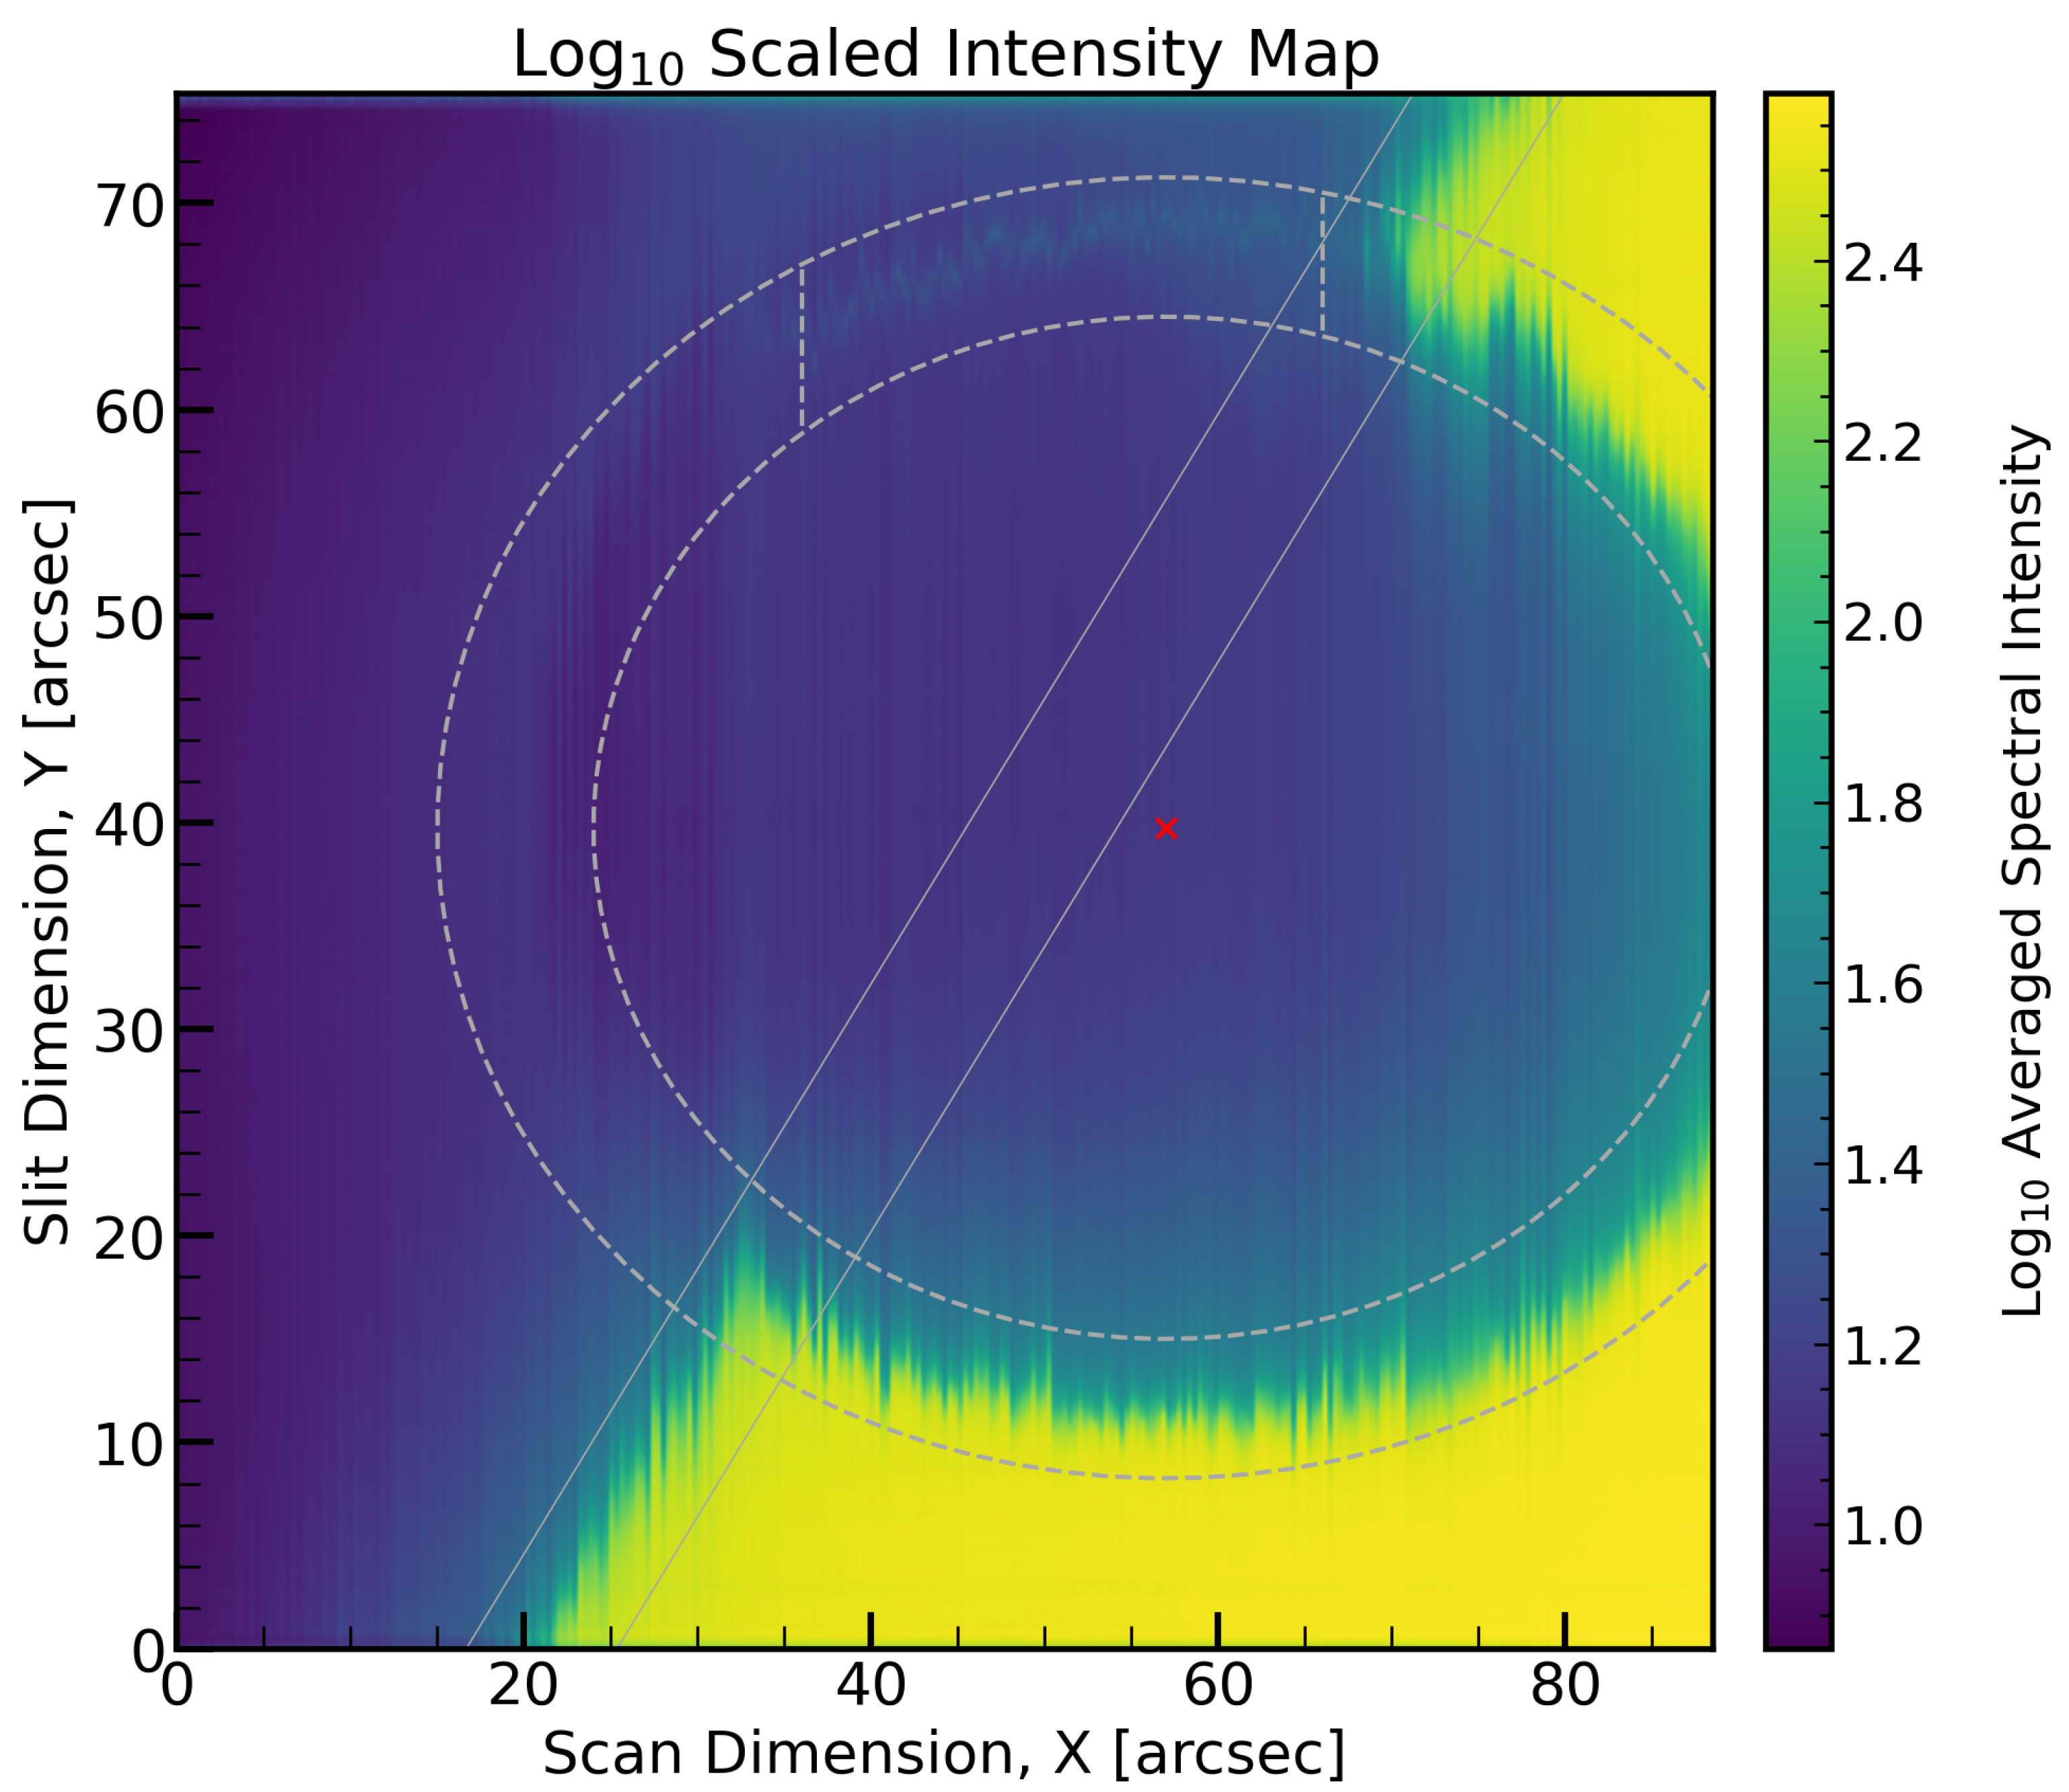
Figure 1. Intensity raster map with averaged spectral intensity represented in log-scale. Gray dashed lines delimit the region containing the planetary limb. These represent two concentric ellipses centered at (X, Y) = (57″, 39.75″), marked with a red cross. Two vertical dashed lines were included to outline the region of the limb where the atmospheric aureole is observed. Two solid gray lines delimit the location of the solar limb.
Atmosphere 15 01431 g001
Figure 2. Intensity raster map of the aureole region aligned by the highest intensity pixel in each slice, with averaged spectral intensity represented in log-scale. The red dashed lines delimit a 4-pixel tall window of interest, defining the region of interest pertaining to the atmospheric aureole. The gray dashed line defines an out-of-interest area separated by 13 pixels from the top of our region of interest and spanning until the top of each slice. Out-of-interest spectra were used to correct for the presence of stray light in aureole spectra.
Atmosphere 15 01431 g002
Figure 3. Average transmission spectrum of Venus extracted from the atmospheric aureole as observed during the solar transit of 2012 (in gray). For each slice, an average spectrum of the Venus limb was calculated and divided by an average spectrum of the background contained in that same slice. The presented spectrum corresponds to the average of the division products over all slices after being continuum-corrected. Synthetic transmission spectra for CO2 and CO isotopologues were generated with petitRADTRANS and are shown for comparison. The absorption lines identified upon visual inspection of the observed spectrum have been marked: 12C16O2 (yellow), 13C16O2 (red), 12C16O (dark blue).
Atmosphere 15 01431 g003
Figure 4. Cross-correlation functions for (a) 12C16O2, (b) 13C16O2, (c) 12C16O (dark blue line). The best-fit Gaussian profiles are shown for each CCF (red dashed line). All panels show the CCFs resulting from the self cross-correlation of the templates (light orange area), which are scaled arbitrarily.
Atmosphere 15 01431 g004
Figure 5. Cross-correlation function for 16O3 (dark blue line) along with the best-fit Gaussian profile (red dashed line). The CCF resulting from the self cross-correlation of the template is shown as a light orange area, arbitrarily scaled for comparison.
Atmosphere 15 01431 g005
Table 1. Molecular abundances used in atmospheric transmission models.
MoleculeVolume Mixing RatioReferences
CO20.965 [19]
CO3.3 × 10−3 [19]
O310−6 [22]
Table 2. Summary of the Gaussian fit parameters for the central CCF peaks observed.
MoleculeAmplitude
[ppm]
Center RV
[km s−1]
FWHM
[km s−1]
S/N
[ σ ]
12C16O241,293 ± 5698−0.36 ± 0.375.52 ± 0.884.2
13C16O242,048 ± 7765−0.88 ± 0.566.2 ± 1.34.7
12C16O26,558 ± 37270.089 ± 0.4656.8 ± 1.13.9
16O34244 ± 5120.85 ± 0.549.2 ± 1.33.5
Disclaimer/Publisher’s Note: The statements, opinions and data contained in all publications are solely those of the individual author(s) and contributor(s) and not of MDPI and/or the editor(s). MDPI and/or the editor(s) disclaim responsibility for any injury to people or property resulting from any ideas, methods, instructions or products referred to in the content.