
Effects of Wind Shields on Pedestrian-Level Wind Environment around Outdoor Platforms of a Megatall Building
by
 ,
,
Zhao Liu
1,2,
Chaorong Zheng
1,3,*,
Dagang Lu
1,3,*,
Yijing Wang
4,
Yong Chen
5,
Zhao Jin
5 and
Zhiming Zhang
2 1
School of Civil Engineering, Harbin Institute of Technology, Harbin 150090, China
2
China Construction Second Engineering Bureau Co. Ltd., Beijing 101100, China
3
Key Lab of Structures Dynamic Behavior and Control of the Ministry of Education, Harbin Institute of Technology, Harbin 150090, China
4
East China Architectural Design & Research Institute Co. Ltd., Shanghai 200001, China
5
China Northeast Architectural Design & Research Institute Co. Ltd., Shenyang 110006, China
*
Authors to whom correspondence should be addressed.
Atmosphere 2024, 15(2), 171; https://doi.org/10.3390/atmos15020171
Submission received: 21 November 2023
/
Revised: 12 January 2024
/
Accepted: 23 January 2024
/
Published: 29 January 2024
(This article belongs to the Section Meteorology)
Abstract
:A thousand-meter-high megatall building, which consists of three tear-drop-shaped towers arranged in an equilateral triangle and a central circular tower, has ten outdoor platforms along the height at an interval of 100 m to connect the four towers. As the pedestrian-level wind environment around the outdoor platforms of high-rise buildings has been less studied for higher incoming wind speeds than those of the ground wind, it is necessary to conduct the related research and evaluations of the pedestrian-level wind environment around outdoor platforms to ensure pedestrian comfort and safety. First, based on the flow field analysis of the megatall building model, potential aerodynamic measures are proposed to improve the pedestrian-level wind environment of outdoor platforms. Then, the wind tunnel test and CFD simulation of outdoor platforms are conducted with five aerodynamic measures, and an averaged adjustment coefficient is put forward to establish the link between the full model and the sub-configuration model for the wind speed amplification factor, Ri, greater than 1.0, so the data obtained from the wind tunnel test can be transformed for further assessment of the pedestrian-level wind environment. Finally, the Lawson criterion was used to quantitatively analyze and compare the effects of five aerodynamic measures to improve the wind environment, thus providing a design that satisfies the requirements of “wind comfort” and “wind safety” for the thousand-meter-high megatall pedestrian platform. This study contributes to the further understanding of pedestrian-level wind environment characteristics of outdoor platforms and the potential aerodynamic measures to improve wind comfort and wind danger.
1. Introduction
The urban wind environment is an inter-discipline of aerodynamics and atmospheric science for analyzing the interaction between urban buildings and their surrounding wind field. A good urban wind environment is a prerequisite for ensuring the comfort and safety of urban residents. During the past few decades, with the development of urbanization together with the advances in construction techniques, more and more high-rise buildings have emerged. High-rise buildings can generate high wind speeds at the pedestrian level because the building or group of buildings will significantly change the wind field structure in urban areas and deflect the upper-level high-speed wind flows to the ground. Generally, strong winds would appear at the gates, corners, passageways, and platforms of high-rise buildings, which could lead to discomfort or even dangerous conditions. And many such incidents have been reported owing to strong winds. Wise [1] informed that shops were left untenanted as the bad wind environment discouraged shoppers. Lawson and Penwarden [2] published that the dangerous wind environment was responsible for the death of two old ladies after being blown over by a sudden street wind near a tall building. Therefore, urban construction authorities currently recognize the importance of the assessment of the pedestrian-level wind comfort or wind safety and thus require such studies before granting planning permits for new buildings or urban areas.
The assessment of the pedestrian-level wind comfort and wind safety at a specific location requires the combination of the statistical analysis of the local meteorological data, the detailed aerodynamic information, and a reasonable comfort criterion [3]. Meteorological data comprise long-term wind speed and wind direction statistics from local meteorological stations in open terrain aeras. The aerodynamic information of the pedestrian-level wind speed is needed to transfer the statistical meteorological data from local meteorological stations to the building site where the pedestrian-level wind environment is to be assessed. Once this link is established, providing us with the wind statistics at the building site, a reasonable comfort criterion is adopted to evaluate the pedestrian-level wind comfort and wind safety. The wind comfort criterion describes the survey statistics of people’s perception and feelings on different imposed wind strengths, distinguishing among various pedestrian activities, such as long-period and short-period sitting, strolling, and walking fast. Since the 1970s, a large number of scholars have proposed several wind comfort and wind danger criteria to evaluate the pedestrian-level wind environment, such as the Isyumov and Davenport criterion [4], the Lawson and Penwarden criterion [2], the Hunt criterion [5], the Lawson criterion [6], the Melbourne criterion [7], the Soligo criterion [8,9], the UB and UWO criterion [10,11,12], the Building Research Establishment (BRE) criterion [12], the Centre Scientifique et Technique du Bâtiment (CSTB) criterion [12], the FORCE Technology–DMI criterion [12], and the NEN 8100 criterion [13,14,15]. The aerodynamic information of the pedestrian-level wind speed generally consists of two contributing parts, i.e., the terrain-related contribution and the design-related contribution. The former takes into account the terrain roughness and height differences between the local meteorological stations and the building site, and the latter is related to the planning design of the target buildings and their surroundings, such as the building geometry, building orientation, and arrangement of the buildings and surroundings. And the design-related contribution can be determined via three kinds of research methods according to the measurement techniques for the pedestrian-level wind speeds and directions: field measurements, wind tunnel tests, and CFD numerical simulations [15,16].
Based on the above research methods, many studies have been conducted to investigate the pedestrian-level wind environments of high-rise buildings or groups of high-rise buildings. Sasaki et al. [17] used infrared thermography technology to study the effects of the relative positions and spacings of two high-rise buildings on the pedestrian-level wind comfort. Tsang et al. [18] studied the effects of the size and spacing of buildings and the existence of a podium on the pedestrian-level wind environments around several tall buildings. The above investigations mainly focused on the pedestrian-level wind environment characteristics and wind comfort assessments. However, until now, there have been only a few studies to propose new, feasible, and effective measures to improve uncomfortable or unsafe pedestrian-level wind environments, and it is believed that the optimization analysis of urban wind environments has also been of great significance for improving the urban habitat quality and building a sustainably developed urban spaces. Youssef [19] reported that the overpass, wind shield, and ceiling could effectively reduce the pedestrian-level wind speed on streets. Blocken et al. [20] proposed to install an automatic control door in the passage of Silvertop Towers to improve their pedestrian-level wind comfort. Mohan et al. [21] suggested that the trees or perforated fences around high-rise buildings could effectively reduce the pedestrian-level wind speed. Furthermore, different shelter designs and wind breaks have also been studied [22,23].
Another aspect related to the pedestrian-level wind environment, which has been less studied, is the pedestrian-level wind environment around the outdoor platforms, balconies, and corridors high up on high-rise buildings. This is usually a very tough and challenging issue for architectural designers because the incoming wind speeds at these places are usually much higher than those near the ground. And the quality of the pedestrian-level wind comfort and wind safety is usually very poor for this kind of issue. Thus, much more attention should be paid to it. In the study by Zheng et al. [24], based on wind tunnel tests and CFD simulations, the pedestrian-level wind comfort and wind safety of the outdoor platforms of a thousand-meter-high megatall building were assessed using the Lawson criterion and NEN 8100 criterion. The megatall building is composed of three equilateral-triangle-arranged tear-drop-shaped towers and a central circular tower, together with ten outdoor platforms at an interval of 100 m along the height to connect the four towers. Figure 1 shows the rendering of this megatall building, and the terrain roughness of the building site can be determined as Category B in the Chinese Load Code. According to reference [24], the results showed that the pedestrian-level wind comfort was very poor in many zones of the most unfavorable outdoor platform with 3 m high wind shields, especially in the passageways of adjacent towers, owing to “funneling effects”. And some potential aerodynamic measures should be studied to improve the wind environmental quality of outdoor platforms to serve as emergency passageways for evacuation or sightseeing platforms.
In view of the unsatisfactory pedestrian-level wind comfort around the most unfavorable outdoor platform of the thousand-meter-high megatall building, several potential aerodynamic measures are proposed, and their effects are investigated in this study. Section 2 is mainly concerned about the flow field around the platforms of the megatall building, and some potential measures to improve the wind environment are proposed. Section 3 introduces the setup of the wind tunnel measurement. In Section 4, based on the validation of the CFD simulation method, the adjustment coefficient of the wind speed amplification factors to link the sub-configuration model and the full model is studied via CFD simulations, and the pedestrian-level wind comfort and wind danger of the outdoor platform of the thousand-meter-high megatall building is finally assessed using the threshold exceedance probability approach. Section 5 summarizes the main conclusions.
2. Characteristics of Wind Field around the Outdoor Platforms of the Baseline Model
As mentioned above, the pedestrian-level wind comfort on the most unfavorable outdoor platform of the thousand-meter-high megatall building, for which the wind shield height is 3 m (regarded as the baseline model hereafter), was very poor. A detailed discussion can be found in reference [24]. Therefore, in this section, the wind field characteristics of the outdoor platform of the baseline model will be analyzed via CFD simulations, and some potential aerodynamic measures to improve the pedestrian-level wind environment will be discussed.
The computational model of the baseline model is a full model, including a podium, four towers, and ten outdoor platforms, together with several 3 m high wind shields on the edge of the towers. It should be noted that to establish the model more conveniently and ensure a better mesh quality, the full model was established based on some minor simplifications of the prototype building (see Figure 2), especially for the configurations at the bottom and top parts. Considering a lower incoming wind speed below Platform 1 and a significant three-dimensional flow effect at top of the full model, the pedestrian-level wind speeds on Platforms 1 and 10 are believed to be much lower than those on other outdoor platforms; thus, the above simplifications on the configurations can be acceptable. So, the pedestrian-level wind environment characteristics of Platforms 2–9 will be analyzed in the following research.
The dimensions of the prototype building model are shown in Figure 2. It can be seen that the height (H) is 1050 m; the maximum distance between the exterior edges of the tear-drop-shaped towers is 205 m, and the maximum distance between each tear-drop tower and the outer edge of the outdoor platform is 165.6 m. To describe the planar dimensions of the full model more conveniently, we use the characteristic size, which is the diameter of an equivalent circle with a same area as that of the cross-section of the model, and its value is determined as 150 m. The diameter of the central circular tower is 48 m.
According to Revuz et al.’s [25] suggestion, the computational domain is determined with the dimensions of 7650 m in length (20B + D + 30B), 7950 m in width (26B + B + 26B), and 5250 m in height (H + 4H), with a blockage ratio of 0.38%. The computational domain is discretized using the hybrid grids, with a total of 7.18 million grids.
The velocity inlet is employed as the inlet boundary condition of the computational domain. The incoming wind speed is determined by Equation (1) as follows:
where U10 = 34.64 m/s is the wind speed at the 10 m height, α is the power-law exponent, and zG is the gradient wind height. According to the terrain roughness of Category B in the Chinese Load Code [26], α and zG are determined as 0.15 and 350 m, respectively. Therefore, the gradient wind speed at the zG height is 59.05 m/s. The incoming wind speed above zG is determined as a constant with a same value as that at zG. The Reynolds number of the prototype building model is about 6.112 × 10⁸, which is in the post-critical zone.
The outflow is used for the outlet boundary condition of the computational domain, and the symmetry is adopted to simulate the side and top wall boundary conditions of the computational domain. In addition, the no-slip wall is used for the bottom wall boundary condition of the computational domain and all the surfaces of the computational model.
The realizable k-ε turbulence model, which was developed by Shih et al. [27] in 1995, is employed to solve the 3D incompressible governing equations. The SIMPLE algorithm is employed to solve the coupled pressure and velocity equations, and the second-order upwind scheme is employed to discretize the turbulent kinetic energy and dissipation rate terms, respectively. The non-equilibrium wall function is adopted to simulate the complex flows near the walls. For more detailed information about the computational model, grids discretization, and boundary conditions of the computational domain and the solution strategies, please see reference [24]. The reference height in the numerical simulation is set as znr = 1050 m, and the reference wind speed is set as Unr = 59.05 m/s.
According to reference [24], the pedestrian-level wind environment above Platform 4 is the most unfavorable. Figure 3 shows the contours of the wind speed amplification factor, Rni, acquired by numerical simulations, and the path lines on two typical planes of Platform 4 (i.e., the plane 2 m above Platform 4 and the vertical symmetric plane) in the 0° wind direction. Rni is defined as the ratio of the wind speed, Ui, to the reference wind speed, Unr, to describe the influence of aerodynamic information.
As shown in Figure 3a, when the incoming flow passes into the passage of two upstream towers, it will be contracted gradually, accompanied by a significant acceleration in wind speed due to the “funneling effects”, and the maximum Rni occurs at the narrowest passage. Downstream of the passage, the flow is extended gradually, accompanied by a deceleration in wind speed. Therefore, Rni is greater than 1.0 in the passage zones, with a maximum Rni of 1.6 at the narrowest passage, and is less than 1.0 in the other zones of the platform. To avoid the significant “funneling effects”, extra wind shields could be placed near the narrow passages. In view of this point, a similar measure called a “divider screen” was adopted to improve the wind environment for the outdoor platforms of the Burj Khalifa Tower in Dubai [28]. Moreover, some roadside trees could be planted near the narrow passages to reduce the wind speed for practical considerations.
Besides the contraction of incoming flows in the passages, the acceleration of the pedestrian-level wind speeds can also be attributed to the separated flows induced by the wind shields and the downwash flows due to the blockage by the central tower, as shown in Figure 3b. The incoming flows, denoted as “1”, will move upward or downward when blocked by the platform and will separate at the top of the wind shield, resulting in the acceleration of the pedestrian-level wind speeds in the wake. Therefore, if the wind shield height is increased, a guide plate is added at the top of each wind shield, or extra wind shields are placed downstream of the existing wind shields, the vortex shedding will be delayed and then the downstream zones with low pedestrian-level wind speeds will be enlarged. The incoming flows denoted as “2” are blocked by the central tower, a part of the flows will separate and shed to the downstream zones in the horizontal plane, while most of the flows will move downward to generate the downwash flows, thus bringing the upper-level high kinetic energy to the wind speed at the pedestrian level. Therefore, if a transversal shelter or screen is placed above the platform at a suitable height (e.g., 5 m, the same height as that of each floor), the downwash flows or the reattached flows of upstream wind shields will be obstructed; the vortex generation will be restrained, and the pedestrian-level wind speeds will be significantly reduced.
To sum up, some potential aerodynamic measures, such as extra wind shields; roadside trees; the increased height of wind shields; and added guide plates, shelters, or screens higher than the pedestrian level, could be proposed to improve the pedestrian-level wind environment on outdoor platforms. The following study will focus on the quantitative analysis of the improvement of the pedestrian-level wind comfort using these measures to provide a feasible design proposal for the wind environment around the outdoor platforms of the thousand-meter-high megatall building.
3. Setup of Wind Tunnel Test
3.1. Test Models
The wind tunnel test was conducted in the Joint Laboratory of the Wind Tunnel and Wave Flume located at Harbin Institute of Technology, China. The dimensions of the small test section are 4.0 m in width, 25.0 m in length, and 3.0 m in height. Owing to the restraint of the blockage ratio, less than 5%, and the requirement of sufficient probes, a three-platform sectional model (also called the “sub-configuration”, see Figure 4) with a length scale of 1:300 was employed as the test model. And Platform 2 was selected as the research object to investigate the pedestrian-level wind environment. For more information about the determination of the test model, please refer to reference [24].
The dimensions of the three-platform sectional model in the vertical direction are shown in Figure 4. It can be seen that every two outdoor platforms were placed at a distance of 334 mm (corresponding to 100 m for the full model), and the distance from Platform 1 to the ground was lengthened to 525 mm to avoid the ground’s disturbance. Figure 5 shows the dimensions of the cross-section of the sub-configuration model and the locations of 18 simplified wind-speed probes on Platform 2. The simplified wind-speed probes, which were developed based on the omni-directional pressure sensor principle [29], were adopted to measure the pedestrian-level wind speeds (at 6.7 mm height above Platform 2). For more detailed information about the simplified wind-speed probes, please see reference [24].
To improve the pedestrian-level wind environment on the outdoor platform of the baseline model, several aerodynamic measures of the wind shields, such as a 5 m high wind shield, a 5 m high wind shield plus a 1 m high wind deflector, a 5 m high wind shield plus a 1 m high wind suppressor, and double layers of the wind shield, were adopted, As shown in Table 1. The dimensions of the above wind shields are given in the prototype scale, and the corresponding length scale is 1:300 for the wind tunnel test models. The above aerodynamic measures are schematically depicted in Figure 6. To clearly show the configuration of each aerodynamic measure, Figure 6b−d removes the four towers. Therefore, the “5 m high wind shield plus 1 m high wind deflector” model refers to the addition of a 1 m high wind deflector based on a 5 m high shield, inclining the deflector to the platform at an angle of 30°. Correspondingly, the “5 m high wind shield plus 1 m high wind suppressor” model refers to the addition of a 1 m high wind suppressor based on a 5 m high wind shield, inclining the suppressor to the outside of the platform at an angle of 30°. The spacing, L, indicates the distance between the interior wind shield and exterior wind shield.
3.2. Generation of the Wind Field
According to reference [24], the pedestrian-level wind environment on Platform 2 was determined as the most unfavorable under the condition of the uniform inflow. Therefore, the uniform inflow condition is utilized as the velocity-inlet in the wind tunnel test, and the incoming wind speed is set at 13.5 m/s when considering that the simplified wind-speed probes have a higher measurement precision at higher wind speeds [29]. Thus, the reference wind speed, Uer, is 13.5 m/s, and the wind-speed scale is 1:4.374. So, the Reynolds number of the wind tunnel test model is about 4.658 × 10⁵. In addition, the turbulence intensity, Iu, of the generated wind flows is set at a constant with the value of 0.0821 according to the specification for the terrain roughness of Category B in the Chinese Load Code [26].
Several self-made wooden grids (see Figure 5) were adopted to simulate the target wind field and after several attempts and comparisons, the ideal blockage ratio was finally determined as 37.5%. Comparisons of the generated mean wind-speed profile and turbulence-intensity profile with the corresponding theoretical wind profiles, which are denoted by the dashed lines, are shown in Figure 7. It can be seen that the two wind profiles show good agreement with each other. And the pedestrian-level height above Platform 2, for which the height is 0.891 m, is in the main experimental height of the uniform flow. The instantaneous wind pressures of the simplified wind-speed probes were sampled using a DSM3400 pressure scanner at a sampling frequency of 625 Hz and a total measurement time of 60 s.
4. Results Analysis and Discussions
4.1. Characteristics of the Pedestrian-Level Wind Environment
Based on the wind tunnel test, the contours of the pedestrian-level wind-speed amplification factor, Rei, around Platform 2 with different aerodynamic measures of wind shields are compared with that of the baseline model in Figure 8, and the incoming wind direction angle is 0° (see Figure 5). It should be noted that we use the reference wind speed, Uer = 13.5 m/s, to calculate Rei.
It can be seen in Figure 8 that the distribution patterns of Rei are quite similar for Platform 2 with different wind shields: the Rei values are almost symmetrically distributed along the x-axis (see Figure 5); in front of the circular tower, Rei is relatively low owing to the obvious “shielding effects” induced by the upstream wind shields. Similarly, a low Rei is also observed behind the central circular tower; however, significant “funneling effects” can be observed in the passageways of two adjacent towers, and the wind speeds are significantly accelerated, with maximum values of Rei ranging from 1.228 to 1.469 in the middle of the two towers for different wind shields. Then, Rei decreases gradually in the downstream zones.
To quantitatively describe the influence of different wind shields, the following maximum wind-speed reduction factor, RFR, is defined by Equation (2) for the pedestrian-level wind-speed amplification factor, Rei, because wind discomfort and wind danger are mainly caused by high wind speeds:
where Rei,C and Rei,B are the pedestrian-level wind-speed amplification factor at point i around Platform 2 with different wind shields and with a 10 mm high wind shield (baseline model), respectively. Table 2 shows the maximum Rei and corresponding RFR for different wind shields in all the wind directions.
As shown in Table 2, the maximum Rei for the baseline model is 1.49 (also see reference [24]), and different aerodynamic measures can reduce the maximum pedestrian-level wind speed on Platform 2, resulting in a positive RFR. When the height of the wind shield is increased from 10 mm to 16.7 mm, the maximum Rei can be reduced to 1.40, with a reduction of 6.04%. And when a 3.3 mm high wind deflector or wind suppressor is added based on the 16.7 mm high wind shield (cases 2 and 3), the maximum Rei is further reduced, especially for the former one (with a reduction in the maximum Rei by 9.39%), which indicates that further increasing the wind shield height is very effective for reducing the pedestrian-level wind speed. For the double wind shield conditions, the maximum Rei and corresponding RFR are close to those in cases 2 and 3, and it can be inferred that the pedestrian-level wind speed will be significantly reduced in the areas between the double wind shields, so their effects will be better. Among all the aerodynamic measures, case 4, with an RFR of 16.11%, is the most effective aerodynamic measure to improve the pedestrian-level wind environment.
4.2. The Link between the Sub-Configuration Model and the Full Model
Because the three-platform sectional model was used in the wind tunnel test and the full model of the megatall building will be adopted in the assessment of the pedestrian-level wind environment (see Section 4.3), CFD simulations are described in this section to create a link between the sub-configuration and the megatall building. The main objectives are as follows: (1) to compare the CFD results of the pedestrian-level Rni on Platform 2 in the sub-configuration model with the corresponding experimental Rei data to validate the CFD simulation method; (2) to determine the adjustment coefficient, CR, for the pedestrian-level Rni on Platform 2 in the sub-configuration model with different aerodynamic measures and on the most unfavorable outdoor platform in the full models to create a link between them. Then, the pedestrian-level Ri based on the wind tunnel test and the adjustment coefficient, CR, could be used in the following assessment of the wind comfort of the megatall building.
4.2.1. Validation of the CFD Simulation
The feasibility of the CFD simulation method is validated by comparing the experimental data and corresponding CFD results. Owing to the limited space, only the pedestrian-level Ri values of 18 simplified wind-speed probes on Platform 2 in the sub-configuration with different aerodynamic measures in the 0° and 60° wind directions, including the Rei values acquired by the wind tunnel test and the Rni values acquired by the CFD simulation, are compared in Figure 9. It can be seen that the CFD results are almost consistent with the corresponding experimental data, though there are some errors for some specific probes behind the wind shields (e.g., probe 10# in the 0° wind direction) or the towers (e.g., probes 1#−3#, 17#, and 18# behind the central circular tower in the 0° wind direction; probes 3#−5# behind the central circular tower in the 60° wind direction; and probes 12# and 14# behind Tower 3 in the 60° wind direction). Fortunately, the pedestrian-level Ri values of the above individual probes with large discrepancies are usually less than 1.0 and may not contribute much to the following assessment of the wind comfort because wind discomfort is mainly caused by high Ri values.
To further analyze the errors between the experimental data and CFD results, Table 3 shows the relative errors of the wind-speed probes for which the experimental data, Rei, are greater than 1.0 (focusing on the accelerated wind-speed zones) in the 0° and 60° wind directions. It can be seen that the maximum error is 27.71% (located at probe 7# in test case 5) in the 0° wind direction, and the average error for these probes is only 21.64%; however, in the 60° wind direction, the discrepancies are relatively smaller than those in the 0° wind direction, with a maximum discrepancy of 14.57% (located at probe 7# in test case 5) and an average discrepancy of 12.52%, indicating good agreement between the experimental data and CFD results. The reason for the discrepancies can be attributed to two aspects: First, there are some errors in the processes of model manufacturing and measuring in the wind tunnel test; second the realizable k-ε turbulence model used in this paper has some defects in simulating complex flows, such as the flow separation, vortex shedding, and wake flows around bluff bodies with complicated configurations. In general, the CFD numerical simulation based on the RANS approach can more accurately predict the wind-speed distribution. In addition, the relative errors of test cases 4 and 5 are generally higher than those of the other aerodynamic measures, and the possible reason can be attributed to the flow field for the cases with double wind shields, which are more complex.
4.2.2. Link between the Sub-Configuration and Full Model
The three quartile and maximum values of the pedestrian-level amplification factor, Ri, on Platform 2 in the sub-configuration and each platform in the full model are compared in Figure 10.
As shown in Figure 10, the pedestrian-level Ri distributions in the full model are basically the same, and the Ri distributions from Platform 2 to Platform 9 first increase and then decrease. Figure 10a shows the box plot of Ri on outdoor platforms in the full and sub-configuration models of the 5 m wind shield +1 m wind deflector. It can be seen that the three quartiles of the pedestrian-level wind speed around Platforms 2–8 are relatively close, and the values are about 0.27, 0.48, and 0.81, respectively. By comprehensively comparing the quartiles and maximum values of the pedestrian-level wind speed ratio, Ri, it was found that Ri has the highest values on Platform 4; thus, the pedestrian-level wind environment around Platform 4 is the most unfavorable. The corresponding values on Platform 2 in the sub-configuration model are lower than those of Platform 4 in the full model. Figure 10b shows the box plot of Ri on the outdoor platforms in the full model and the sub-configuration of the 5 m + 5 m double wind shields. It can be seen that in addition to Platform 5, the three quartiles of the pedestrian-level wind speed from Platform 2 to Platform 8 are relatively close, and the values are about 0.13, 0.40, and 0.76, respectively. The quartiles of Platform 5 are greater than those of the other platforms, so Platform 5 is determined as the most unfavorable wind environment platform. The corresponding values on Platform 2 in the sub-configuration model are lower than those on Platform 5 in the full model. And the reason can be attributed to the large number of downward air flows below the stagnation point of the windward tower in the full model, which is beneficial to increase the pedestrian-level wind speed above Platform 3–Platform 5.
The wind-speed adjustment coefficient, CR, is defined as the ratio between the pedestrian-level Ri on the most unfavorable wind environment platform in the full model and those on Platform 2 in the sub-configuration model. Figure 11 shows the variations in the CR values for the pedestrian-level Ri in the sub-configuration model. The results show that the change in CR is very large (from 0.05 to 5.85) for Ri < 1.0, and when the Ri values are greater than 1.0, the CR values gradually converge to a constant. Considering that the wind discomfort and wind danger are mainly caused by high wind speeds, the Ri values greater than 1.0 are retained to calculate the average CR. Therefore, the average CR is determined as 1.15 and 1.1 for the 5 m wind shield +1 m deflector and 5 m + 5 m double wind shield models, respectively. The Ri values acquired by the wind tunnel test should be multiplied by CR to be used in the wind-comfort assessment.
According to the above analysis, the link is established between the pedestrian-level Ri values in the sub-configuration model and the full model. A related research method that combines wind tunnel tests and CFD simulations and research objects that combine the sub-configuration and full models to study the wind environments of complex building structures can provide a useful reference for similar studies in the future.
4.3. Assessment of the Pedestrian-Level Wind Environment
According to several previous studies [3,4,18,19], mainly three kinds of approaches have been utilized to assess the wind comfort and wind danger, i.e., the wind-speed amplification factor approach, the Beaufort scale approach, and the threshold exceedance probability approach.
Among them, the wind-speed amplification factor approach is the simplest method, and it assesses the wind environment using the wind-speed amplification factor, which is defined by the ratio between the pedestrian-level wind speed and incoming wind speed. This method does not consider the absolute wind-speed value and cannot reflect people’s feelings and wind comfort. The Beaufort scale approach defines the relative comfort and regulates the maximum number of times that it can exceed the allowable wind speed. But it cannot consider the occurrence frequency of wind speeds in different wind directions. The threshold exceedance probability approach takes the wind comfort and wind safety requirements into account, combines the detailed aerodynamic information and local meteorological data, and introduces the wind-speed threshold value and its exceedance probability to construct the comfort criterion [3,12,15]. The threshold exceedance probability approach is the most accurate method to assess wind environments and is widely used. Therefore, the threshold exceedance probability approach is employed in this paper.
A complete framework to assess the pedestrian-level wind comfort or wind danger of the outdoor platforms is shown in Figure 12 and consists of five steps in reference [24].
According to the Lawson criterion [10,11], the effects of various aerodynamic measures to improve the wind environment are quantitatively analyzed from the perspectives of the comfort and safety levels. Table 4 shows the threshold values for the hourly mean wind speed, Uthr,M, and their exceedance probabilities for different pedestrian activities. And the threshold values for the gust-equivalent hourly mean wind speed, Uthr,GEM, and their exceedance probabilities are the same as those in the table. Only the wind comfort levels for “strolling” and “walking fast” are analyzed in the following section.
The Lawson criterion has a wind-speed threshold of 8 m/s for “strolling” and a 5% exceedance probability limit. Figure 13 and Figure 14 show the results of “strolling” for the gust-equivalent hourly mean wind speed and the hourly mean wind speed. The dotted line in the figures shows the exceedance probability of 5%.
As shown in Figure 13, the exceedance probabilities of the gust-equivalent hourly mean wind speed higher than 8 m/s in the 3 m wind shield model (the baseline model) are almost less than 5%, except for probes 1#, 7#, 9#, and 13# for which the exceedance probabilities are slightly higher than 5%. In general, the pedestrian-level wind environment has been considerably improved under different aerodynamic measures.
It can be seen in Figure 14 that under different aerodynamic measures, most of the probes do not meet the requirement for “strolling”. The exceedance probability values of probes 1#, 7#, and 13# are significantly higher than the those of the remaining probes. Overall, the aerodynamic measures of the 5 m wind shield, 5 m wind shield + 1 m deflector (1 m suppressor), and 3 m (5 m) + 5 m double wind shields can reduce the probability of the hourly mean wind speed exceeding 8 m/s from 17% to 12%. Therefore, the comfort level of the pedestrian-level wind environment has slightly increased, but it is still far higher than the 5% limit of the Lawson evaluation criterion.
The Lawson criterion has a wind-speed threshold of 10 m/s for “walking fast” and a 5% exceedance probability limit. Figure 15 and Figure 16 show the results of “walking fast” for the gust-equivalent hourly mean wind speed and the hourly mean wind speed. The results show that when compared with the 3 m wind shield (the baseline model), the probability of the hourly mean wind speed exceeding 10 m/s is reduced by 10−40% owing to the aerodynamic measures, and the exceedance probabilities of almost half the probes are less than 5%. That means nearly 50% of the platform area meets the requirements of “directional walking”, and the pedestrian-level wind environmental quality of the connecting platform has been significantly improved.
According to the Lawson criterion, wind safety requirements are met when the probability for the hourly mean wind speed or gust-equivalent hourly mean wind speed exceeding 20 m/s is less than 0.022%. The wind-safety-exceedance probabilities of each probe under different test conditions are shown in Figure 17 and Figure 18.
Figure 17 indicates that the probabilities for the equivalent hourly mean wind speed exceeding 20 m/s under different aerodynamic measures are less than 0.022%, especially for the double wind shields for which the exceedance probabilities are close to 0. Figure 18 indicates that the aerodynamic measures significantly reduce the probability of an hourly mean wind speed above 20 m/s at the pedestrian-level compared to the 3 m wind shield. The maximum exceedance probability of the 18 probes decreased from 0.37% to 0.17–0.22%; the reduction was over 42%, and the wind environment has been significantly improved. Except for probes 1#, 3#, 7#, and 13#, the wind-speed threshold exceedance probabilities of all the probes are less than 0.022%. So, most areas of the platform satisfy the wind safety requirements.
According to the pedestrian-level wind environmental assessment of the most unfavorable outdoor platform using the wind-comfort criterion based on the hourly mean wind speed, the Kriging interpolation method is used to obtain the practical partition of the wind comfort and wind safety on the platform with different aerodynamic measures, as shown in Figure 19. The “strolling” and “walking fast” levels satisfy the pedestrian-level wind comfort and safety environmental requirements of the Lawson criterion, respectively. The “safety” level means that the wind environment in the area does not satisfy the comfort requirements, but pedestrians will not have safety hazards due to excessive wind speed. The “danger” level means that the wind environment does not satisfy the “safety level” requirements of the Lawson criterion, and supplementary measures should be considered to improve the pedestrian-level wind environment.
As shown in Figure 19a, most areas in the baseline model (3 m wind shield) outdoor platform cannot satisfy the wind comfort level, and many areas are at the “danger” level. It can be seen in Figure 19b–f that aerodynamic measures, such as increasing the height of the wind shield (from 3 m to 5 m), further adding a deflector or a suppressor, and using double wind shields, can effectively increase the area of the outdoor platform to satisfy the requirements of “walking fast” but cannot satisfy the requirements of “strolling”. Therefore, the “safety” level on the platform is effectively improved after adopting different aerodynamic measures. The “danger” area is reduced, and many areas are gradually transformed to the “safety” or “walking fast” areas. That is, more areas on the outdoor platform can satisfy the requirements for safe evacuation in an emergency.
It should be noted that more optimal aerodynamic measures to improve the wind environmental performance in bad cases can be explored in future studies.
5. Conclusions
The pedestrian-level wind environment around the outdoor platforms high up on a thousand-meter-high megatall building was studied via wind tunnel tests and CFD simulations, and the wind comfort and wind danger of the most unfavorable outdoor platform in the full model was assessed using the threshold exceedance probability approach based on the Lawson criterion. The main conclusions are summarized as follows:
- The distributions of the pedestrian-level wind-speed ratio, Ri, for the outdoor platform with different aerodynamic measures are similar. Owing to the “funneling effects”, pedestrian-level Ri values in the area between the outer tower and the central tower are significantly higher, and the maximum Ri value is present in this area;
- The pedestrian-level wind-speed distributions of two typical aerodynamic measures (5 m wind shield + 1 m deflector and 5 m + 5 m double wind shields) are similar on the outdoor platform in the full model, and the wind-speed-adjustment coefficients, CR, of the most unfavorable wind environment platform in the full model are 1.15 and 1.1, respectively;
- The evaluation results based on the Lawson criterion show that different aerodynamic measures can effectively reduce the pedestrian-level wind speed and improve the wind environment, but a part of the platform cannot satisfy the requirements of the wind comfort and wind safety. Therefore, more aerodynamic measures, such as roadside trees or high-up shelters, should be further investigated to improve the wind environmental quality in the “wind danger” region;
- This study contributes to the provision of a new research method to study the wind environments of complex building structures by combining wind tunnel tests and CFD simulations with sub-configuration and full models. In addition, it should be noted that the pedestrian-level wind environments around outdoor platforms that are high up on high-rise buildings have been less investigated in previous studies, and this study contributes to the further understanding of the pedestrian-level wind environmental characteristics of outdoor platforms. For poorly performing wind comfort and wind safety on outdoor platforms, the aerodynamic measures proposed in this study can provide important references to improve the pedestrian-level wind environment in future studies and engineering applications.
Author Contributions
Conceptualization, C.Z. and D.L.; methodology, C.Z.; software, Z.L., Y.W. and Z.Z.; validation, Y.W.; formal analysis, Z.L., Y.W., Y.C. and Z.J.; investigation, Z.L. and Z.Z.; resources, C.Z. and D.L.; data curation, Y.C. and Z.J.; writing—original draft preparation, Z.L. and Y.W.; writing—review and editing, C.Z.; project administration, D.L.; funding acquisition, C.Z., Y.C. and Z.J. All authors have read and agreed to the published version of the manuscript.
Funding
The research was funded by the China State Construction Engineering Corporation (No. CSCEC-2023-Z-11).
Institutional Review Board Statement
Not applicable.
Informed Consent Statement
Not applicable.
Data Availability Statement
The data presented in this study are available on request from the corresponding author.
Conflicts of Interest
Zhao Liu, Yijing Wang, Yong Chen, Zhao Jin, Zhiming Zhang are employees of China Construction Second Engineering Bureau Ltd.; China Northeast Architectural Design & Research Institute Co. Ltd., and East China Architectural Design & Research Institute Co., Ltd. The research was funded by the China State Construction Engineering Corporation. The companies had no roles in the design of the study; in the collection, analysis, or interpretation of data; in the writing of the manuscript, or in the decision to publish the articles. The paper reflects the views of the scientists and not the company.
References
- Wise, A.F.E. Wind effects due to groups of buildings. In Proceedings of the Royal Society Symposium Architectural Aerodynamics Session 3: Effect of Buildings on the Local Wind, London, UK, July 1970; pp. 26–27. Available online: https://www.aivc.org/sites/default/files/members_area/medias/pdf/Airbase/airbase_00136.pdf (accessed on 11 January 2024).
- Lawson, T.V.; Penwarden, A.D. The effects of wind on people in the vicinity of buildings. Proceedings of 4th International Conference on Wind Effects on Buildings and Structures, September 1975; Cambridge University Press: Heathrow, UK, 1975; pp. 605–622. Available online: https://pascal-francis.inist.fr/vibad/index.php?action=getRecordDetail&idt=PASCAL7780305984 (accessed on 11 January 2024).
- Blocken, B.; Carmeliet, J. Pedestrian wind environment around buildings: Literature review and practical examples. Therm. Env. Build. Sci. 2004, 28, 107–159. [Google Scholar] [CrossRef]
- Isyumov, N.; Davenport, A.G. The ground level wind environment in built-up areas. Proceedings of Fourth International Conference on Wind Effects on Buildings and Structures, September 1975; Cambridge University Press: Heathrow, UK, 1975; pp. 403–422. Available online: https://books.google.com/books?hl=hu&lr=&id=pRY9AAAAIAAJ&oi=fnd&pg=RA7-PA43&ots=4kW40o_jDb&sig=sDebM4eWlSfdpi2t196qIlck0Aw (accessed on 11 January 2024).
- Hunt, J.C.R.; Poulton, E.C.; Mumford, J.C. The effects of wind on people; new criteria based on wind tunnel experiments. Build. Environ. 1976, 11, 15–28. [Google Scholar] [CrossRef]
- Lawson, T.V. The wind content of the built environment. J. Wind Eng. Ind. Aerod. 1978, 3, 93–105. [Google Scholar] [CrossRef]
- Melbourne, W.H. Criteria for environmental wind conditions. J. Wind Eng. Ind. Aerod. 1978, 3, 241–249. [Google Scholar] [CrossRef]
- Williams, C.J.; Soligo, M.J.; Cote, J. A discussion of the components for a comprehensive pedestrian level comfort criterion. J. Wind Eng. Ind. Aerod. 1992, 44, 2389–2390. [Google Scholar] [CrossRef]
- Soligo, M.J.; Irwin, P.A.; Williams, C.J.; Schuyler, G.D. A comprehensive assessment of pedestrian comfort including thermal effects. J. Wind Eng. Ind. Aerod. 1998, 77, 753–766. [Google Scholar] [CrossRef]
- Lawson, T.V. The Determination of the Wind Environment of a Building Complex before Construction; Department of Aerospace Engineering, University of Bristol: Bristol, UK, 1990; Report Number TVL9025. [Google Scholar]
- Lawson, T.V. Building Aerodynamics; Imperial College Press: London, UK, 2001. [Google Scholar]
- Koss, H.H. On differences and similarities of applied wind comfort criteria. J. Wind Eng. Ind. Aerod. 2006, 94, 781–797. [Google Scholar] [CrossRef]
- NEN 8100: 2006; Wind Comfort and Wind Danger in the Built Environment. Dutch Standard: Amsterdam, The Netherlands, 2006. (In Dutch)
- NPR 6097: 2006; Application of Mean Hourly Wind Velocity Statistics for the Netherlands. Dutch Practice Guideline: Amsterdam, The Netherlands, 2006. (In Dutch)
- Janssen, W.D.; Blocken, B.; Hooff, T.V. Pedestrian wind comfort around buildings: Comparison of wind comfort criteria based on whole-flow field data for a complex case study. Build. Environ. 2013, 59, 547–562. [Google Scholar] [CrossRef]
- Blocken, B.; Janssen, W.D.; Hooff, T.V. CFD simulation for pedestrian wind comfort and wind safety in urban areas: General decision framework and case study for the Eindhoven University campus. Environ. Modell. Softw. 2012, 30, 15–34. [Google Scholar] [CrossRef]
- Sasaki, R.; Uematsu, Y.; Yamada, M.; Saeki, H. Application of infrared thermography and a knowledge-based system to the evaluation of the pedestrian-level wind environment around buildings. J. Wind Eng. Ind. Aerod. 1997, 67–68, 873–883. [Google Scholar] [CrossRef]
- Tsang, C.W.; Kwok, K.C.S.; Hitchcock, P.A. Wind tunnel study of pedestrian level wind environment around tall buildings: Effects of building dimensions, separation and podium. Build. Environ. 2012, 49, 167–181. [Google Scholar] [CrossRef]
- Youssef, S.W. Experimental Evaluation of Pedestrian-Level Winds; University of Minnesota: Minneapolis, MN, USA, 1998. [Google Scholar]
- Blocken, B.; Roels, S.; Carmeliet, J. Modification of pedestrian wind comfort in the Silvertop Tower passages by an automatic control system. J. Wind Eng. Ind. Aerod. 2004, 92, 849–873. [Google Scholar] [CrossRef]
- Mohan, K.; Flay, R.G.J.; Gairola, A.; Mukherjee, M. Role of landscape elements in ameliorating adverse pedestrian level winds in the vicinity of tall buildings. Bonfring Int. J. Ind. Eng. Manag. Sci. 2012, 2, 41–50. [Google Scholar]
- Kaijima, S.; Bouffanais, R.; Willcox, K. Computational fluid dynamics for architectural design. In Proceedings of the 18th International Conference of Association of Computer-Aided Architectural Design Research in Asia, Hong Kong, China, November 2013; Available online: https://onlinelibrary.wiley.com/doi/10.1002/ad.1566 (accessed on 11 January 2024).
- Moya, R.; Prohasky, D.; Watkins, S.; Ding, Y.; Burry, J.; Burry, M. Aerodynamic strategy applied in an urban shelter design: Simulation and analysis of aerodynamic phenomena in an urban context. In Proceedings of the 32nd eCAADe Conference, Newcastle upon Tyne, UK, 10–12 September 2014; pp. 137–144. [Google Scholar]
- Zheng, C.R.; Li, Y.S.; Wu, Y. Pedestrian-level wind environment on outdoor platforms of a thousand-meter-scale megatall building: Sub-configuration experiment and wind comfort assessment. Build. Environ. 2016, 106, 313–326. [Google Scholar] [CrossRef]
- Revuz, J.; Hargreaves, D.M.; Owen, J.S. On the domain size for the steady-state CFD modelling of a tall building. Wind Struct. 2012, 15, 313–329. [Google Scholar] [CrossRef]
- GB 50009-2012; Load Code for the Design of Building Structures. China Architecture and Building Press: Beijing, China, 2012. (In Chinese)
- Shih, T.H.; Liou, W.W.; Shabbir, A.; Yang, Z.; Zhu, J. A new k-ε eddy-viscosity model for high Reynolds number turbulent flows: Model development and validation. Comput. Fluids 1995, 24, 227–238. [Google Scholar] [CrossRef]
- Irwin, P.A.; Baker, W.F.; Korista, S.; Weismantle, P.A.; Novak, L.C. The BURJ DUBAI TOWER wind tunnel testing of cladding and pedestrian level. Struct. Mag. 2006, 11, 47–51. [Google Scholar]
- Irwin, H. A simple omnidirectional sensor for wind-tunnel studies of pedestrian-level winds. J. Wind Eng. Ind. Aerod. 1981, 7, 219–239. [Google Scholar] [CrossRef]
Figure 1.
Rendering of the thousand-meter-high megatall building.
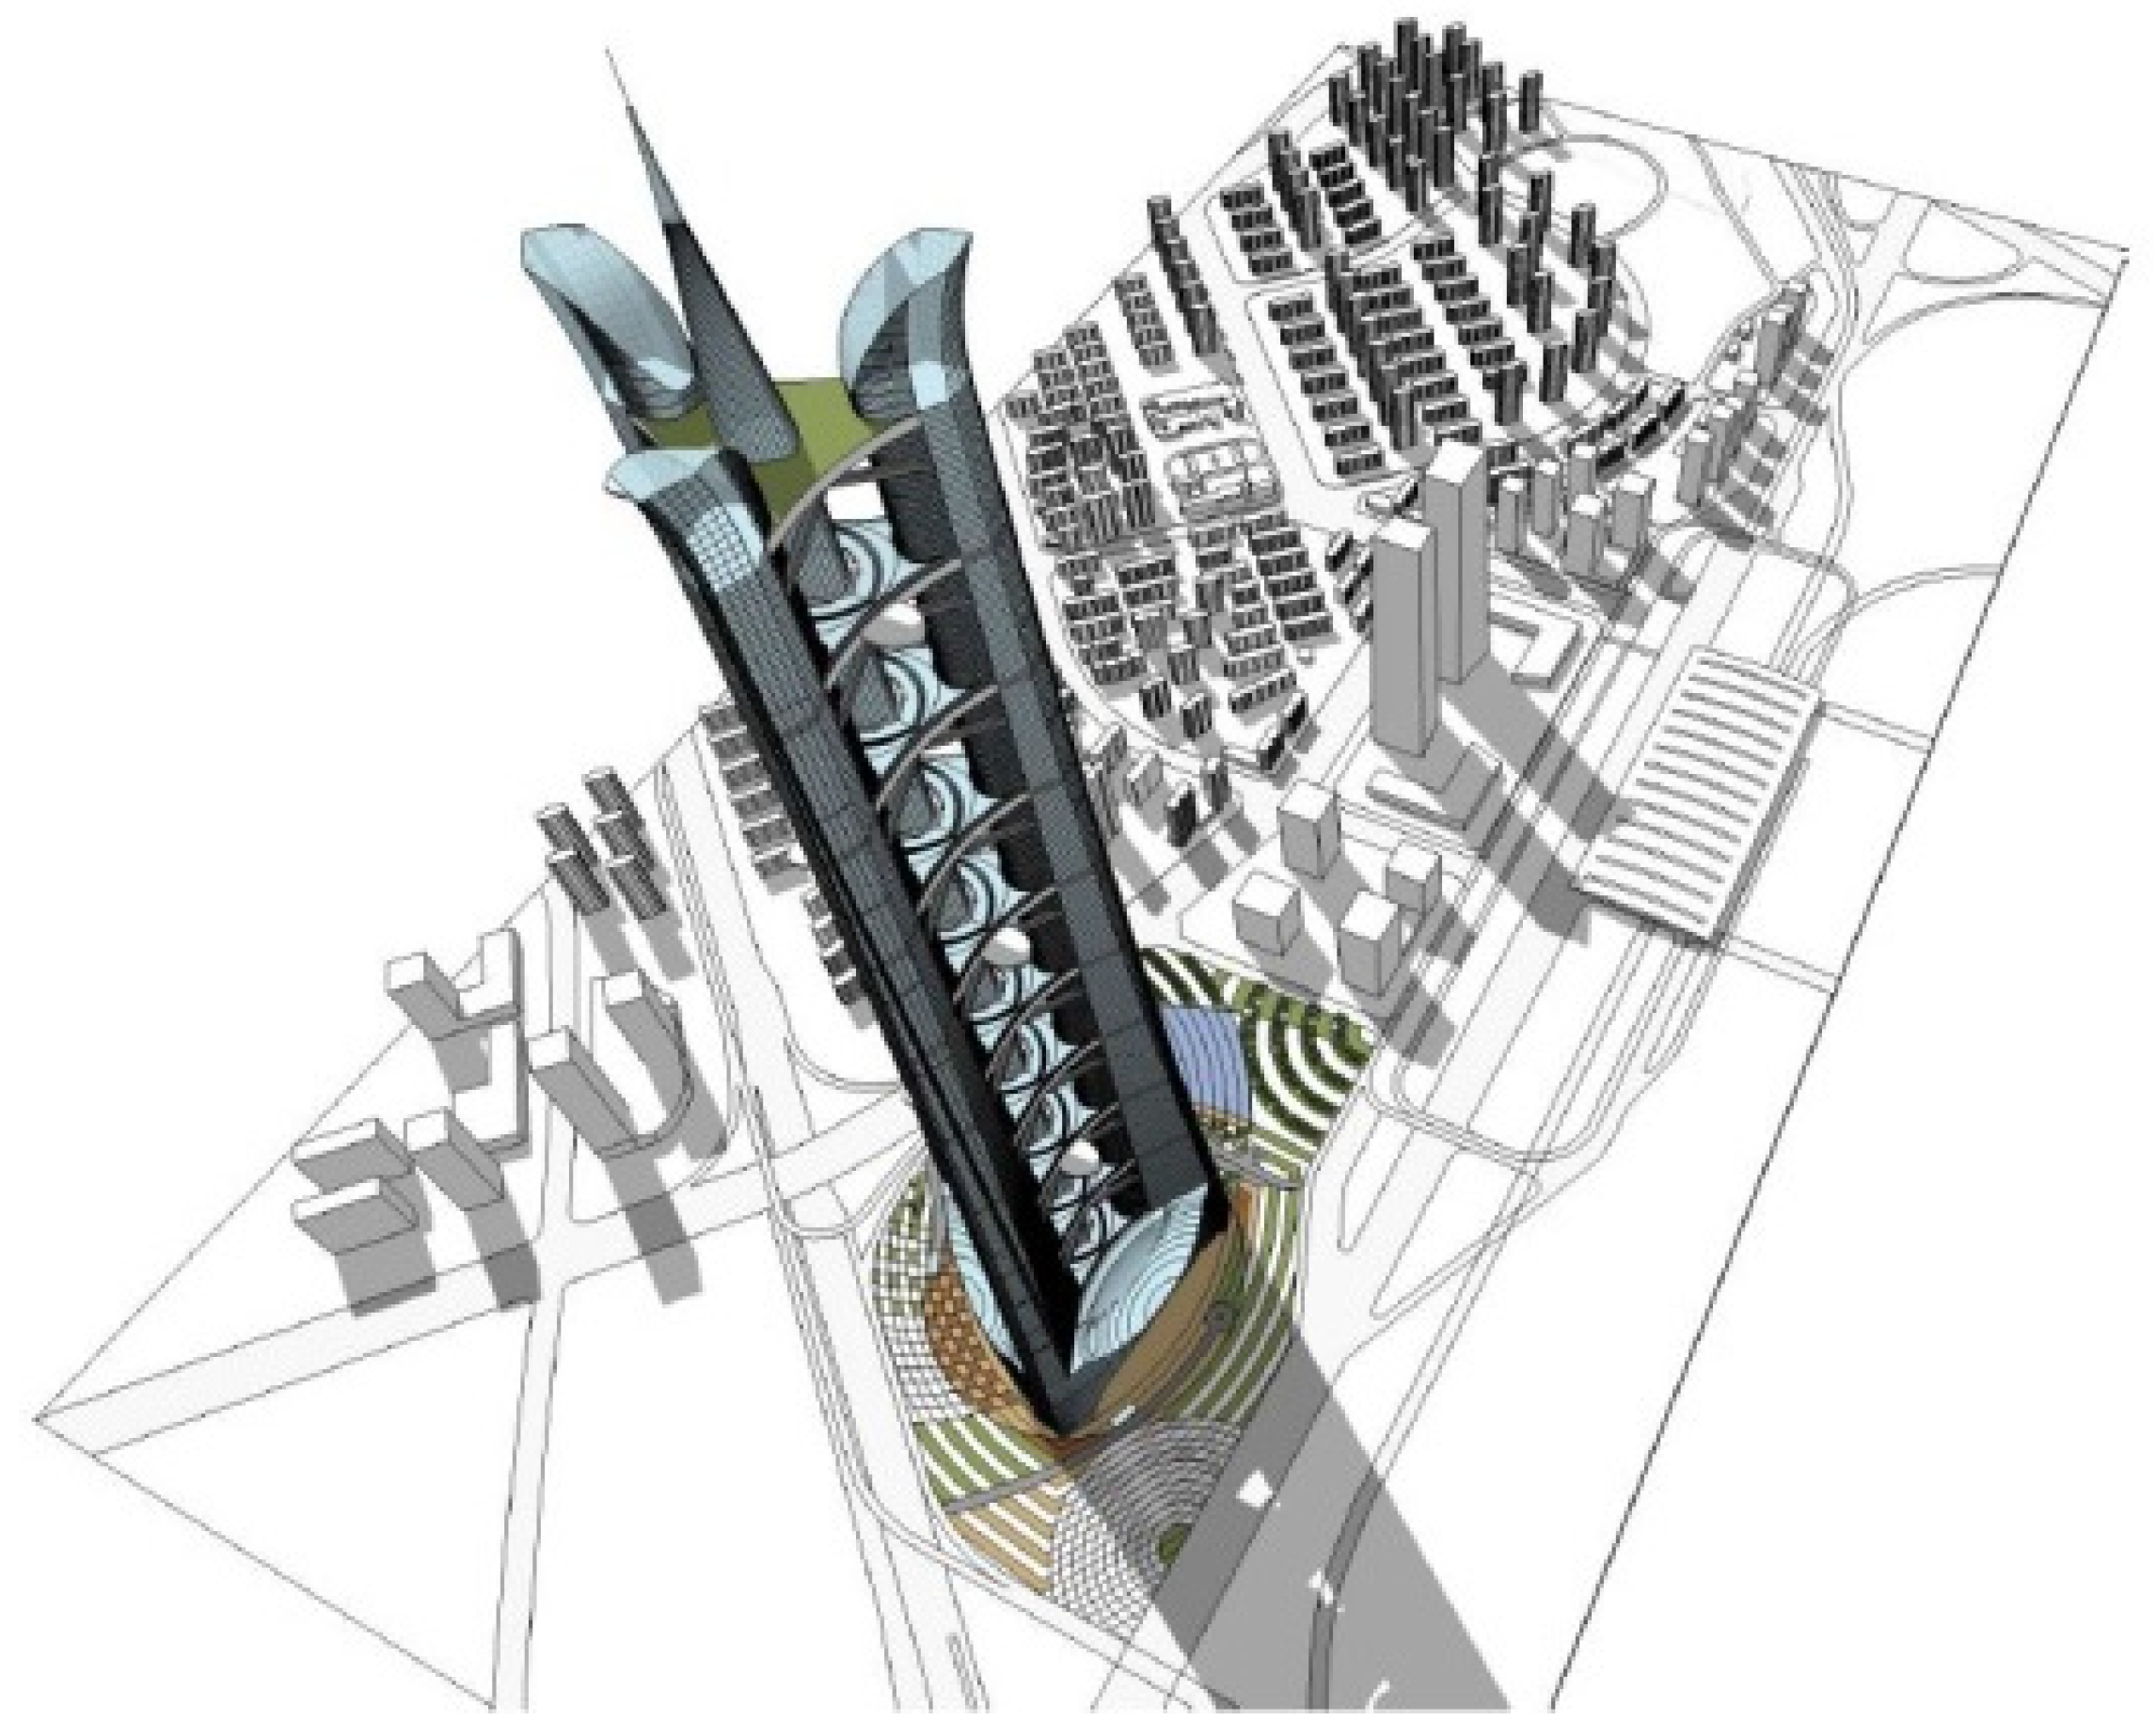
Figure 2.
Sketch of the full model in the (a) elevation and (b) floor plan (Unit: m).


Figure 3.
Contours of Ri and path lines on the (a) pedestrian-level plane and (b) vertical symmetric plane around Platform 4 in the 0° wind direction.
Figure 3.
Contours of Ri and path lines on the (a) pedestrian-level plane and (b) vertical symmetric plane around Platform 4 in the 0° wind direction.

Figure 4.
Sketch of the three-platform sectional model (Unit: mm).

Figure 5.
Location of the simplified wind-speed probes on Platform 2 (Unit: mm).

Figure 6.
Schematic diagrams of different aerodynamic measures for wind shields: (a) 16.7 mm high wind shield; (b) 16.7 mm high wind shield plus 3.3 mm high wind deflector; (c) 16.7 mm high wind shield plus 3.3 mm high wind suppressor; (d) double wind shields.
Figure 6.
Schematic diagrams of different aerodynamic measures for wind shields: (a) 16.7 mm high wind shield; (b) 16.7 mm high wind shield plus 3.3 mm high wind deflector; (c) 16.7 mm high wind shield plus 3.3 mm high wind suppressor; (d) double wind shields.

Figure 7.
Mean wind-speed and turbulence-intensity profiles.

Figure 8.
Contours of the pedestrian-level wind-speed amplification factor, Rei, around Platform 2 with different aerodynamic measures based on the wind tunnel test in the 0° wind direction. (a) Baseline model and (b−f) test cases 1−5.
Figure 8.
Contours of the pedestrian-level wind-speed amplification factor, Rei, around Platform 2 with different aerodynamic measures based on the wind tunnel test in the 0° wind direction. (a) Baseline model and (b−f) test cases 1−5.

Figure 9.
Comparisons of the experimental data and corresponding CFD results of pedestrian-level Ri values on Platform 2 with different aerodynamic measures of wind shields in wind directions of (1) 0° and (2) 60°; (a−e) test cases 1−5. (e.g., (a2) denotes test case 1 in the 60° wind direction).
Figure 9.
Comparisons of the experimental data and corresponding CFD results of pedestrian-level Ri values on Platform 2 with different aerodynamic measures of wind shields in wind directions of (1) 0° and (2) 60°; (a−e) test cases 1−5. (e.g., (a2) denotes test case 1 in the 60° wind direction).


Figure 10.
Box plot of Ri on outdoor platforms in the full and sub-configuration models: (a) 5 m wind shield +1 m wind deflector; (b) 5 m + 5 m double wind shields, L = 9 m.
Figure 10.
Box plot of Ri on outdoor platforms in the full and sub-configuration models: (a) 5 m wind shield +1 m wind deflector; (b) 5 m + 5 m double wind shields, L = 9 m.

Figure 11.
Adjustment coefficient, CR, of the pedestrian-level wind speed amplification factor, Ri: (a) 5 m wind shield +1 m wind deflector; (b) 5 m + 5 m double wind shields, L = 9 m.
Figure 11.
Adjustment coefficient, CR, of the pedestrian-level wind speed amplification factor, Ri: (a) 5 m wind shield +1 m wind deflector; (b) 5 m + 5 m double wind shields, L = 9 m.

Figure 12.
Framework of the wind comfort or wind danger assessment.

Figure 13.
Probability of gust-equivalent hourly mean wind speed exceeding 8 m/s.

Figure 14.
Probability of hourly mean wind speed exceeding 8 m/s.

Figure 15.
Probability of gust-equivalent hourly mean wind speed exceeding 10 m/s.

Figure 16.
Probability of hourly mean wind speed exceeding 10 m/s.

Figure 17.
Probability of gust-equivalent hourly mean wind speed exceeding 20 m/s.

Figure 18.
Probability of hourly mean wind speed exceeding 20 m/s.

Figure 19.
Partitions of pedestrian-level wind comfort and wind safety of the most unfavorable platforms with different aerodynamic measures: (a) 3 m wind shield, (b) 5 m wind shield, (c) 5 m wind shield + 1 m deflector, (d) 5 m wind shield +1 m suppressor, (e) 3 m + 5 m double wind shields, and (f) 5 m + 5 m double wind shields.


Table 1.
Setup for the test cases in the wind tunnel test.
| Case No. | Different Aerodynamic Measures of Wind Shields | Wind Direction θ (°) |
|---|---|---|
| 1 | 5 m high wind shield | 0; 15; 30; 45; 60 |
| 2 | 5 m high wind shield plus 1 m high wind deflector | 0; 15; 30; 45; 60 |
| 3 | 5 m high wind shield plus 1 m high wind suppressor | 0; 15; 30; 45; 60 |
| 4 | 3 m high exterior wind shield plus 5 m high interior wind shield at a spacing of L = 9 m | 0; 15; 30; 45; 60 |
| 5 | 5 m high double wind shields at a spacing of L = 9 m | 0; 15; 30; 45; 60 |
Table 2.
The maximum Rei and corresponding reduction factor, RFR, for different wind shields in all the wind directions.
Table 2.
The maximum Rei and corresponding reduction factor, RFR, for different wind shields in all the wind directions.
| No. of Test Cases | 0 | 1 | 2 | 3 | 4 | 5 |
|---|---|---|---|---|---|---|
| maximum Rei | 1.49 | 1.40 | 1.26 | 1.28 | 1.25 | 1.29 |
| RFR | — | 6.04% | 15.43% | 14.09% | 16.11% | 13.42% |
Table 3.
Error analysis of the CFD results and experimental data for Rei greater than 1.0.
| Test Case No. | 0° Wind Direction | 60° Wind Direction | ||||
|---|---|---|---|---|---|---|
| Maximum Error | Minimum Error | Average Error | Maximum Error | Minimum Error | Average Error | |
| 1 | 19.92% | 1.65% | 6.86% | 5.95% | 1.15% | 3.80% |
| 2 | 22.35% | 0.39% | 8.95% | 6.47% | 0.80% | 2.95% |
| 3 | 22.35% | 0.39% | 8.94% | 5.14% | 0.23% | 3.18% |
| 4 | 26.26% | 2.12% | 9.72% | 9.90% | 5.69% | 7.80% |
| 5 | 27.71% | 13.54% | 21.64% | 14.57% | 10.48% | 12.52% |
Table 4.
Wind comfort and wind danger according to the Lawson criterion.
| Pedestrian Activity | Uthr (m/s) | Pmax (U > Uthr) | |
|---|---|---|---|
| Wind comfort | Sitting long | 4 | 5% |
| Sitting short | 6 | 5% | |
| Strolling | 8 | 5% | |
| Walking fast | 10 | 5% | |
| Wind danger | 20 | 0.022% | |
Disclaimer/Publisher’s Note: The statements, opinions and data contained in all publications are solely those of the individual author(s) and contributor(s) and not of MDPI and/or the editor(s). MDPI and/or the editor(s) disclaim responsibility for any injury to people or property resulting from any ideas, methods, instructions or products referred to in the content. |
© 2024 by the authors. Licensee MDPI, Basel, Switzerland. This article is an open access article distributed under the terms and conditions of the Creative Commons Attribution (CC BY) license (https://creativecommons.org/licenses/by/4.0/).
Share and Cite
MDPI and ACS Style
Liu, Z.; Zheng, C.; Lu, D.; Wang, Y.; Chen, Y.; Jin, Z.; Zhang, Z. Effects of Wind Shields on Pedestrian-Level Wind Environment around Outdoor Platforms of a Megatall Building. Atmosphere 2024, 15, 171. https://doi.org/10.3390/atmos15020171
AMA Style
Liu Z, Zheng C, Lu D, Wang Y, Chen Y, Jin Z, Zhang Z. Effects of Wind Shields on Pedestrian-Level Wind Environment around Outdoor Platforms of a Megatall Building. Atmosphere. 2024; 15(2):171. https://doi.org/10.3390/atmos15020171
Chicago/Turabian StyleLiu, Zhao, Chaorong Zheng, Dagang Lu, Yijing Wang, Yong Chen, Zhao Jin, and Zhiming Zhang. 2024. "Effects of Wind Shields on Pedestrian-Level Wind Environment around Outdoor Platforms of a Megatall Building" Atmosphere 15, no. 2: 171. https://doi.org/10.3390/atmos15020171
Note that from the first issue of 2016, this journal uses article numbers instead of page numbers. See further details here.