Article

Long-Term Trends and Variability of Hydroclimate Variables and Their Linkages with Climate Indices in the Songhua River

1
College of Geographical Science and Tourism, Jilin Normal University, Siping 136000, China
2
CSIRO Environment, Perth, WA 6014, Australia
*
Authors to whom correspondence should be addressed.
Atmosphere 2024, 15(2), 174; https://doi.org/10.3390/atmos15020174
Submission received: 18 December 2023 / Revised: 20 January 2024 / Accepted: 23 January 2024 / Published: 30 January 2024

Abstract

:
The long-term trends and variability of hydroclimate variables are critical for water resource management, as well as adaptation to climate change. Three popular methods were used in this study to explore the trends and variability of hydroclimate variables during last 122 years in the Songhua River (SHR), one of most important river systems in China. Results show the followings: (1) There was an obvious pattern of decadal oscillations, with three positive and three negative precipitation and streamflow anomalies. The lengths of these phases vary from 11 to 36 years. (2) Annual temperature demonstrated a statistically significant increasing trend in the last 122 years, and the trend magnitude was 0.30 °C/10 years in the last 50–60 years, being larger than that of the global surface temperature. It has increased much faster since 1970. (3) Monthly precipitation in the winter season in recent years was almost the same as that in earlier periods, but a significantly increasing monthly streamflow was observed due to snowmelt under a warming climate. (4) A statistically significant correlation between hydroclimate variables and climate indices can be determined. These results could be used to make better water resource management decisions in the SHR, especially under future climate change scenarios.

1. Introduction

The global surface temperature in 2011–2020 has reached about 1.1 °C above the 1850–1900 period due to human activities, principally through emissions of greenhouse gases [1]. There is no doubt that a warm temperature will accelerate the global hydrological cycle, resulting in changes in global and regional hydrological regimes, as well as the spatial and temporal distributions of water variability [2]. The long-term trends and variability of hydroclimate variables and their linkages with climate indices are therefore not only essential for global and regional water resource management, but also for adapting to the impacts of climate change and variability on water availability.
There are numerous studies in the literature to investigate the trend and variability of hydroclimate variables in the Songhua River (SHR), the largest and the most important river systems in the northeast of China, where 20% of the grain yield in China is produced. For example, Li et al. [2] have assessed spatiotemporal variability and trends of temperature, precipitation, and streamflow, with 37 meteorological stations and 33 river gauges, for the 1960–2009 period. The results showed an increase in temperature, a fluctuation in precipitation with a declining trend since the 1980s, and a declining trend in annual streamflow. From 1955 to 2004, the annual streamflow in the mainstream of the SHR displayed an overall declining trend, but its temporal variability followed a wet–dry–wet–dry pattern. Both climate (precipitation and temperature) and human activity contributed to the decline in streamflow, with the latter becoming more and more important in recent years [3]. The annual streamflow during 1955–2010 at the mainstream of the SHR showed a clear temporal variability pattern: a decline from 1955 to 1980, an increasing trend during the 1980s, and an annual streamflow in the 2000s that was lower than that in the 1990s [4]. The magnitude of human activity’s impacts on streamflow increased, and reached its maximum in the 1990s, and then decreased as a result of water-saving irrigation, wetland conservation and restoration, and reforestation [4]. Yin et al. [5] investigated the changes in water and sediment loads in six major rivers in China, including the SHR, from the mid-1950s to 2020 and showed a statistically significant (p < 0.05) decreasing trend of streamflow in the SHR, with land surface changes being the dominant contributor (>70%) to this decline. Khan et al. [6] investigated the spatial and temporal variability of precipitation in the SHR for 1964–2013 using sample entropy theory and found that the decadal precipitation variability has increased from 1964–1973 to 1994–2003. However, precipitation trends showed mixed positive and negative signs among stations within the SHR. Faiz et al. [7] evaluated similarity, complexity, and trends of the snow cover, temperature, precipitation, and streamflow during 1988–2013 in the SHR. The results showed that the complexity values have increased due to population growth and urbanization, and a statistically significant declining trend of streamflow (p < 0.05) was found, which mainly resulted from upstream human activity, rather than precipitation and snow cover. The long-term (1961–2010) annual and seasonal streamflow trends and their relationships with climate variables were investigated by Su et al. [8]. The results indicated that 25 out of 26 gauges showed a declining trend of annual streamflow, and 19 of them were statistically significant at the α = 0.05 level with the classical Mann–Kendall test. The streamflow generally followed the temporal pattern of precipitation. However, the optimal predictors for annual streamflow vary from upstream (precipitation + potential evapotranspiration, PET) to downstream (precipitation + the number of rainy days (RD) or monthly temperature). The annual streamflow during 1956–2018 at the mainstream of the SHR showed a declining trend, with 1998 as a changing point. The annual stream in the latter period was 28.2% lower than that in the former period, while climate change and water use contributed to this decline, with 77.0% and 23.0%, respectively [9].
Northeast China has also been regarded as one of the most important warming regions in China [10] against the background of global warming. However, recent studies indicate that the hiatus phenomenon was detected in this region, and there was a cooling trend in the spring season in recent years [11]. The surface of the Earth seemed hardly to warm during 1998 and 2012, which is often termed as the ‘global warming hiatus’ [12]. However, it is a scientific question under debate. For example, Yan et al. [12] argued that it represented a redistribution of energy within the Earth system and evidence that the natural and decadal variability of climate played a crucial role in the rate of global surface warming.
While a general decreasing trend of streamflow and an increasing trend of temperature have been reported by the above-mentioned studies, the magnitudes of these trends and their relative contributions vary from study to study. Part of the reason for this is that different study periods were used, generally with a length of 50–70 years. This study will extend these existing studies with a much longer study period, i.e., 122 years, from 1901 to 2022. This will present a full picture of temporal variability. In addition, the relationships between hydroclimate variables and several climate indices are also investigated. The outcomes of this study could be used for better water resource management and planning under future climate change scenarios, as greenhouse gas emissions have continued and will continue to increase, leading to a warmer climate and presenting a challenge for agriculture, industry, urban communities, and the overall global and regional environment and development [1].

2. Materials and Methods
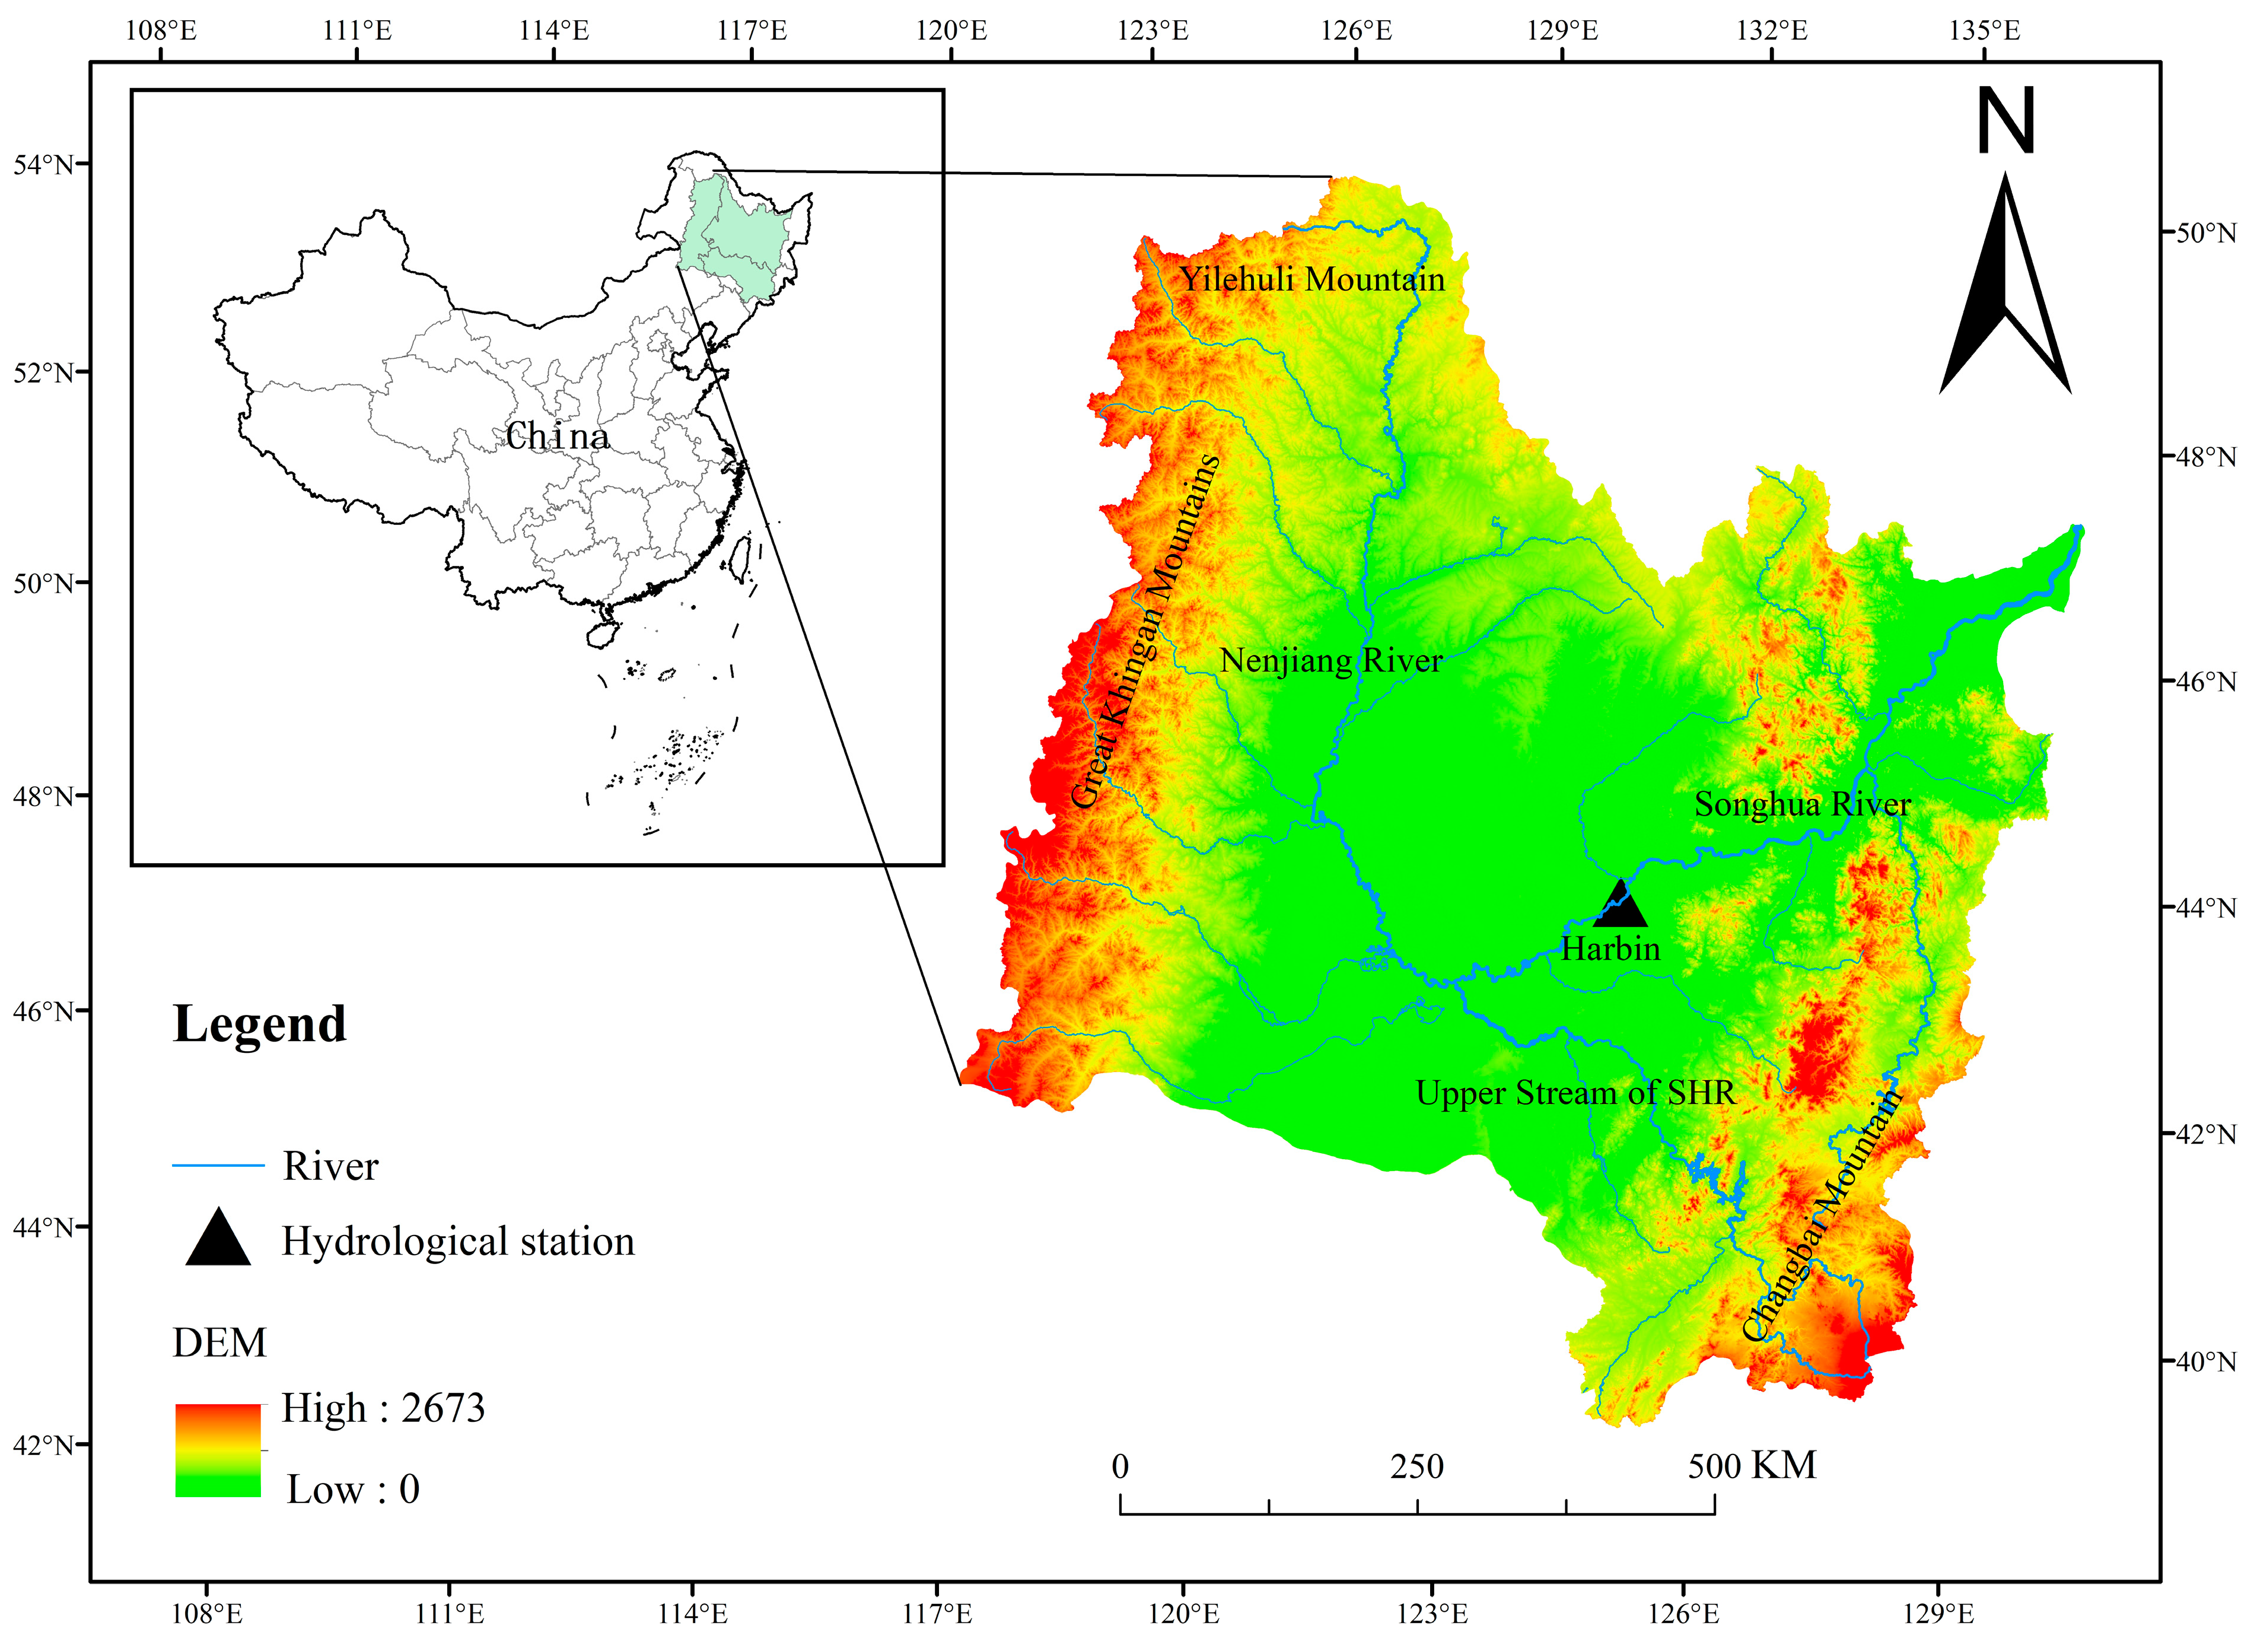
2.1. Study Region

The Songhua River (SHR), located in the northeast of China (Figure 1), is chosen as our study region because of two reasons. (1) It is the largest and the most important river systems in the northeast of China, where 20% of the grain yield in China is produced. (2) The Harbin streamflow gauge (Figure 1) is one of the oldest stations in China, as well as in the world, with streamflow observations since 1898, which is ideal for the long-term trend and variability investigation of hydroclimate variables.
The SHR has two main sources (Figure 1): one in the north, called Nenjiang River, and another source in the south, referred to as the Upper Stream of the SHR or the Second SHR. The Nenjiang River in the north originates from the Yilehuli Mountain in the Great Khingan Mountains with a length of about 1370 km, running from northwest to south then southeast, and a catchment area of 297,000 km2 [2]. The Upper Stream of the SHR (the Second SHR) in the south originates from Tianchi Lake in the Changbai Mountain with a length of 958 km from southeast to northwest and a catchment area of 73,400 km2 [2]. The two sources merge near the Sancha River and then form the mainstream SHR (Figure 1).
Harbin streamflow gauge is located in the mainstream of the SHR (Figure 1) with a catchment area of about 390,000 km2 and represents the overall hydroclimate conditions of the SHR. The elevations of the SHR range from 0 to 2673 m above sea level with three high-elevation centers (Figure 1). The long-term (1901–2022) mean annual total precipitation is 513 mm/year (catchment above Harbin station), with June-September receiving 78% of the annual total precipitation. The long-term (1901–2022) mean annual temperature is 1.9 °C, but ranges from −19.9 °C in January to 21.0 °C in July.

2.2. Datasets

2.2.1. Climate Data

The 1 km resolution datasets of monthly precipitation and temperature developed by Peng et al. [13] are used in this study. This dataset was spatially downscaled from the 30′ Climatic Research Unit (CRU) time series dataset [14,15] with the climatology dataset of WorldClim (https://www.worldclim.org/, accessed on 20 January 2024) using the delta spatial downscaling method. It was then evaluated by using observations at 496 weather stations across China [13]. The datasets are publicly available at the Network Common Data Form (NetCDF) https://doi.org/10.5281/zenodo.3114194 (accessed on 20 January 2024) [13] for precipitation and https://doi.org/10.5281/zenodo.3185722 (accessed on 20 January 2024) [13] for temperatures.

2.2.2. Streamflow Data

The 1901–1987 monthly streamflow data were downloaded from the Global Runoff Data Centre (GRDC, http://grdc.bafg.de/, accessed on 20 January 2024), which is an international data center under the auspices of the World Meteorological Organization (WMO). It was established in 1988 to support research on global climate change and integrated water resource management. It currently contains time series of daily and monthly river discharge data over 10,000 stations worldwide. This service is published by the German Federal Institute of Hydrology (BfG).
The annual streamflow 1988–2001 and monthly streamflow 2002–2022 were extracted from the annual reports of sediment in China, which are published by the Ministry of Water Resource of the People’s Republic of China (http://www.mwr.gov.cn/sj/tjgb/zghlnsgb/, accessed on 20 January 2024).

2.2.3. Climate Indices

Three climate indices, i.e., Southern Oscillation Index (SOI), Pacific Decadal Oscillation (PDO), and Interdecadal Pacific Oscillation (IPO), were used in this study to explore the temporal linkages between them and hydroclimate variables (precipitation and streamflow). Climate indices are usually simple diagnostic quantities that represent an aspect of a geophysical system, such as a circulation pattern, which could potentially link with global and regional climate and weather types.
The SOI is a measure of the intensity or strength of the Walker Circulation, which is one of the key atmospheric indices for gauging the strength of El Niño and La Niña events (http://www.bom.gov.au/climate/enso/history/ln-2010-12/SOI-what.shtml, accessed on 20 January 2024). This index is chosen based on the previous conclusion that El Niño–Southern Oscillation (ENSO) is an important climate driver and index influencing the interannual climate variability in China [16]. The SOI is calculated from the monthly or seasonal fluctuations in the air pressure difference between Tahiti and Darwin of Australia (http://www.bom.gov.au/climate/glossary/soi.shtml, accessed on 20 January 2024). Sustained negative values of the SOI often indicate El Niño episodes. These negative values are usually accompanied by sustained warming of the central and eastern tropical Pacific Ocean and a decrease in the strength of the Pacific trade winds (http://www.bom.gov.au/climate/glossary/soi.shtml, accessed on 20 January 2024).
The PDO is a climatic event which is often described as a long-lived El Niño-like pattern of Pacific climate variability [17]. It covers vast areas of the Pacific Ocean and shifts phases usually on an at least 20–30-year inter-decadal timescale [18]. The PDO has positive and negative phases; positive phases are associated with periods of more rapid global warming, whilst cold phases are linked to severe and long-period drought events in the southwestern USA, as well as increased rainfall over eastern Australia. It should be noted that the multi-decade positive and negative phases could sometimes include a few years in length of opposite phases [16]. The National Centers for Environmental Information (NCEI) PDO index, which is based on NOAA’s extended reconstruction of SSTs (https://www.ncei.noaa.gov/pub/data/cmb/ersst/v5/index/ersst.v5.pdo.dat, accessed on 20 January 2024), was used in this study.
The IPO, similar to the PDO, is also a large-scale and long-period oscillation that influences climate variability over the Pacific Ocean. However, it occurs in a wider area than PDO, stretching from the southern hemisphere into the northern hemisphere for IPO and happening at mid-latitudes of the Pacific Ocean in the northern hemisphere for PDO [19]. The period of the IPO is roughly 15–30 years, with a warmer-than-average tropical Pacific and a cooler-than-average northern Pacific for its positive phases, and an inversion of this pattern, i.e., a cooler tropic and a warmer northern region, for its negative phase [19]. During the positive phase of the IPO, precipitation is generally higher than normal northeast of the South Pacific Convergence Zone and lower than normal southwest of the SPCZ. The TPI Tripole Index for the IPO, which is based on the difference between the SSTA averaged over the central equatorial Pacific (10° S–10° N, 170° E–90° W) and the average of the SSTA in the Northwest (25° N–45° N, 140° E–145° W) and Southwest (50° S–15° S, 150° E–160° W) Pacific [20], is used in this study. The datasets are available at https://psl.noaa.gov/data/timeseries/IPOTPI/ (accessed on 20 January 2024).

2.3. Trend Methods

Three trend analysis methods [21] were used in this study to explore the trends of precipitation, temperature, and streamflow. These methods were chosen because they are the most three popular trend analysis methods in the literature with different theories and assumptions.

2.3.1. Linear Trend Method

It basically builds a linear regression model between a time series of hydroclimate variables (precipitation, temperature, and streamflow in this study) with the time [21]. The significance level α = 0.05 (which corresponds to a p < 0.025 with a two-sided test) is used in this study to detect whether a linear regression slope is statistically significant.

2.3.2. Mann–Kendall (MK) Test

The nonparametric Mann–Kendall test is probably the most popular method in the literature to identify trends of various hydroclimate and water quality variables. This method was first adopted by Hirsch et al. [22] and was modified from the Mann–Kendall test [23]. The advantages of this method include but are not limited to the followings: (1) It can handle non-normality, censoring, or data reported as values “less than”, missing values, and seasonality; (2) it has a high asymptotic efficiency [22].
The two-sided hypothesis was chosen because it is possible that an increasing or decreasing trend of hydroclimate variables could be detected [24]. The same significance level α = 0.05 as the linear trend analysis was used to test whether a trend was statistically significant.
In addition to detecting whether a trend exists, it is also important to explore the trend magnitude. The trend magnitude β (beta magnitude), which was developed by Hirsch et al. [22] based on [25], is used in this study.

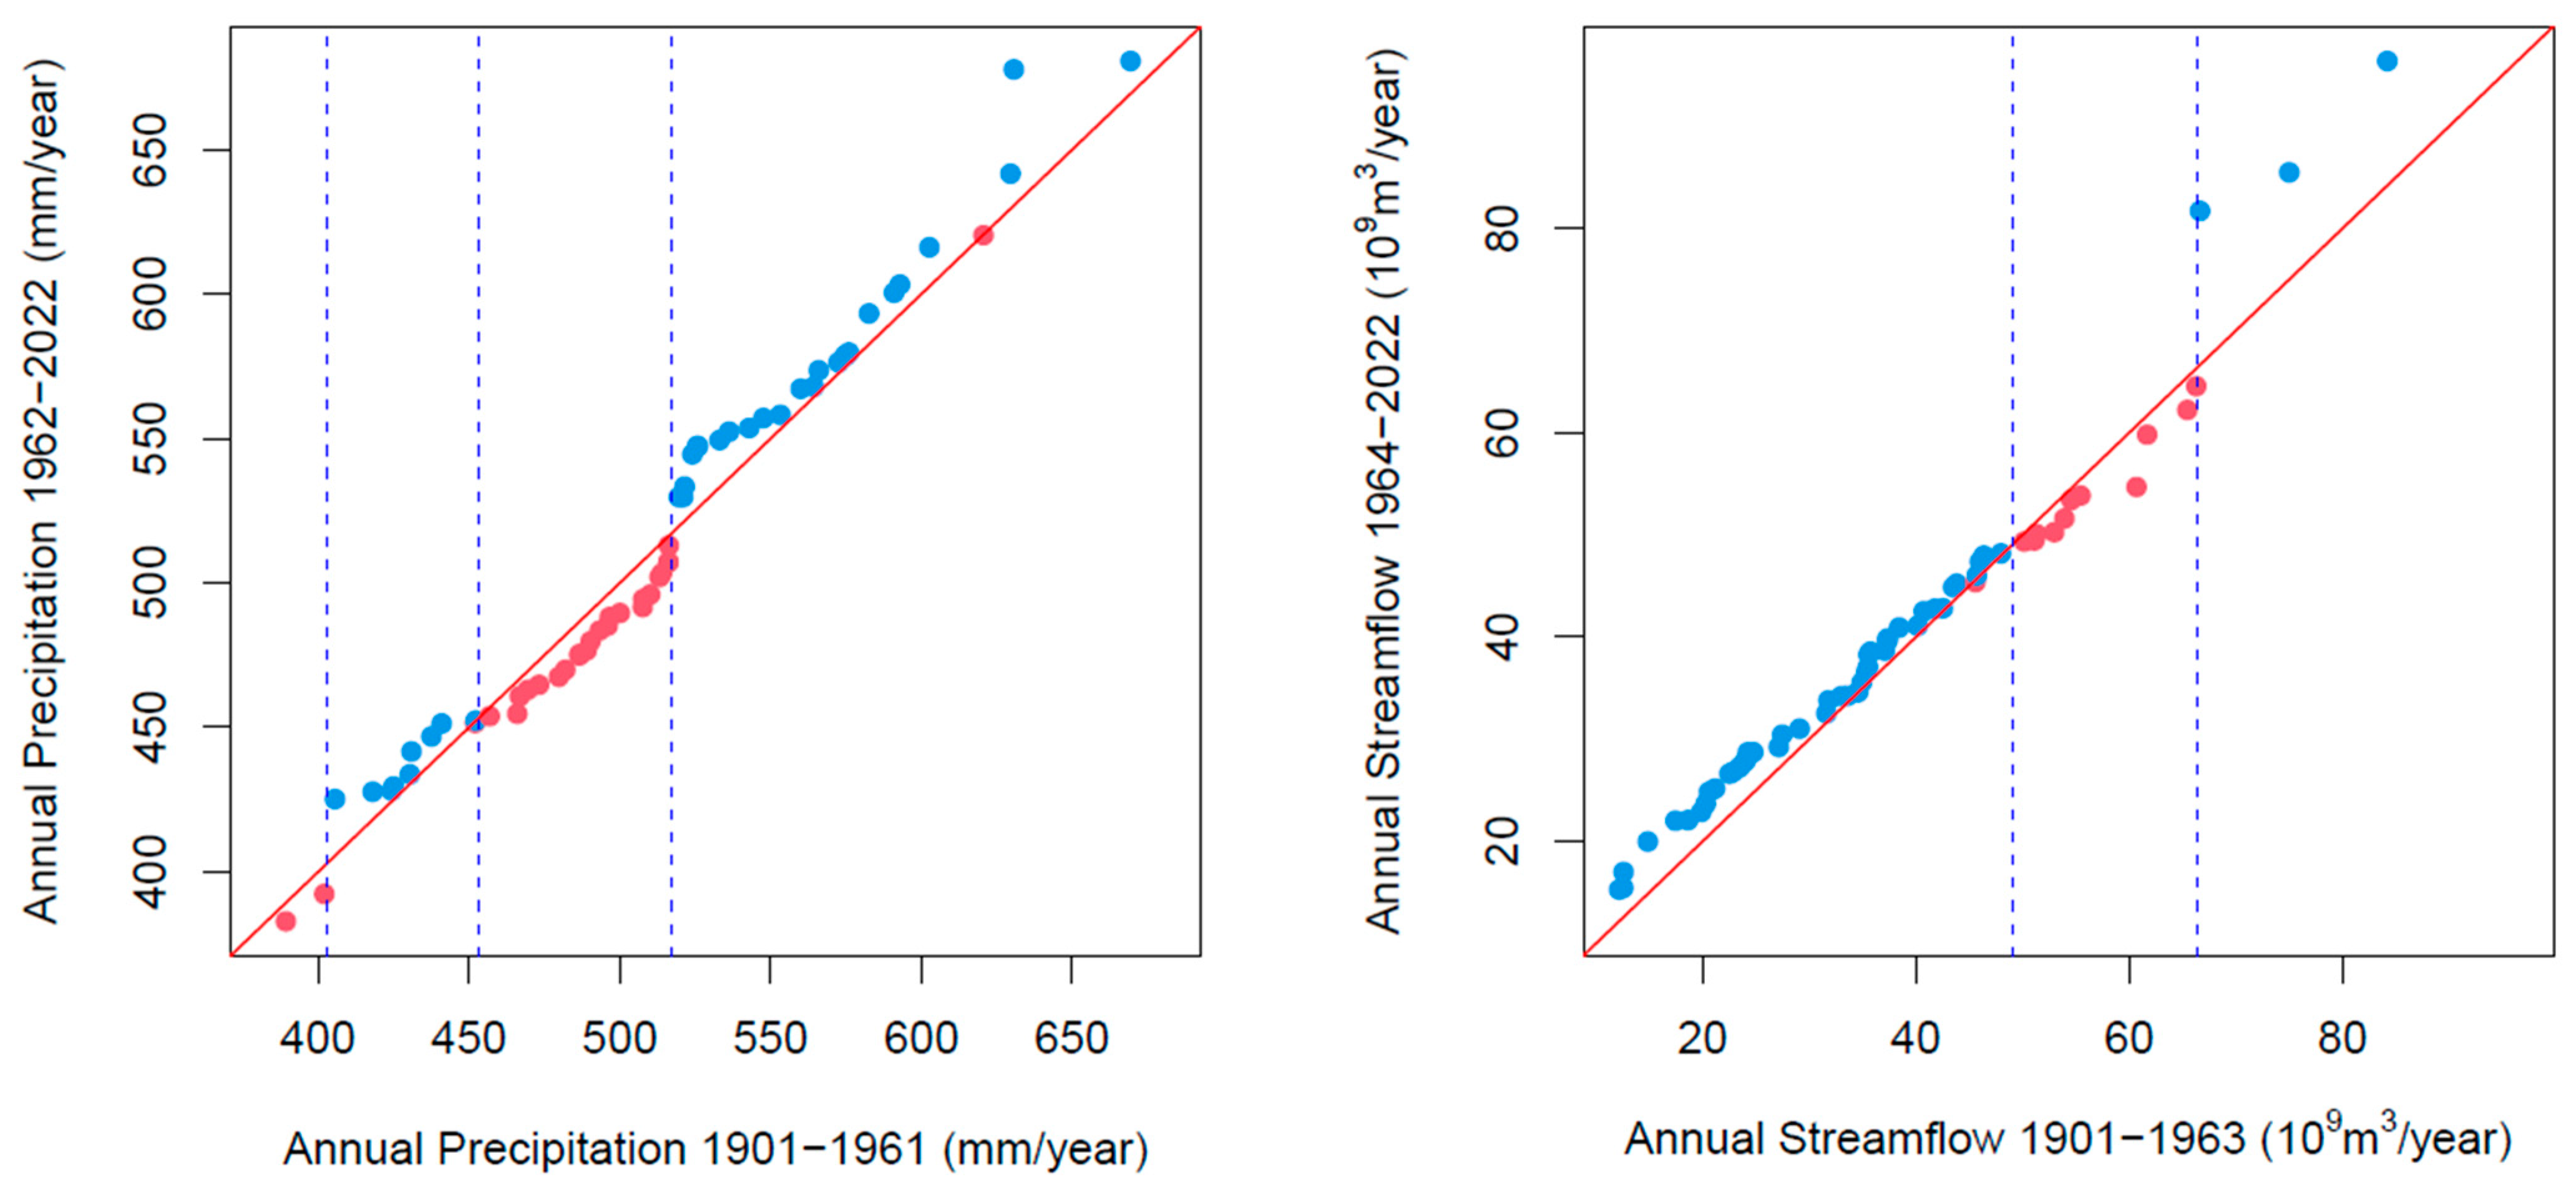
2.3.3. Two-Period Method and Innovative Trend Analysis (ITA)

The two-period method simply compares the mean values of hydroclimate variables in two time periods. To further explore the trends at different quantiles of hydroclimate variables, equal lengths for these two periods are required by using the ITA method [21,26].
The advantage of extending a simple two-period method into the ITA technique is that it can present different trend directions and magnitudes for different quantiles of the hydroclimate variables. For example, it can display the trends for lower values of hydroclimate variables being different in both directions and magnitudes from those at higher values. This provides further insights into the likely processes driving the observed trends of hydroclimate variables.

3. Results

3.1. Long-Term Variability and Trends of Annual Precipitatiion, Temperature, and Streamflow

Figure 2 shows the long-term anomalies of annual precipitation, temperature, and streamflow in the SHR during 1901–2022. The anomaly of catchment average annual total precipitation displays clear annual and decadal variability. The 9-year moving average values (solid black line) exhibit an obvious pattern of decadal oscillations with positive and negative anomalies, i.e., three dry periods in 1901–1927 (27 years), 1964–1982 (19 years), and 2012–2022 (11 years, but could be longer) and three wet periods in 1928–1963 (36 years with two half-cycles), 1983–1998 (16 years), and 1999–2011 (13 years). It should be noted that a dry/wet period can sometimes contain a few years of wet/dry, such as 1944 and 1950 being dry years within the wet period of 1928–1963.
Given the 27-year dry period from 1901 to 1927, it is not surprising that an overall increasing trend of annual total precipitation is detected for the entire study period (Table 1). However, this trend of annual total precipitation is not statistically significant at the α = 0.05 level because of the annual and decadal fluctuations (Table 1). If the starting year of the trend analysis was a wet year, such as 1931–2022, 1941–2022, and 1951–2022, then a decreasing trend of annual total precipitation would be detected (Table 1 and Table 2).
The trends of different study period lengths from 32 years (1991–2022) to 122 years (1901–2022) are all statistically insignificant at the α = 0.05 level and these trend results are also consistent with different trend analysis methods (Table 1). These insignificant trends mainly resulted from the annual and decadal variability of annual total precipitation (Figure 2). This conclusion implies that some trend studies in the literature with a shorter study period that conclude a statistically significant trend might not be robust for practical applications. It is an advantage of this study to have a much longer study period to present a full picture of temporal variability of annual total precipitation.
The linear regression model and the non-parametric MK test usually show similar trend magnitudes of annual total precipitation, but they are different from those of the two-period ITA method (Table 2). A general recommendation would be that all different methods should be used for trend analysis of hydroclimate variables. The consistent results of multiple model analyses can enhance our confidence in the trend results. However, attention should also be paid to those periods, variables, and locations where different analysis methods showed different trend signs and magnitudes, such as 1941–2022 trend magnitudes of annual total precipitation in Table 2.
The anomaly of catchment average temperature demonstrates a clear increasing trend in the last 122 years (Figure 2). It is consistent with the global warming trend due to the increase in greenhouse concentration [1]. Almost all of these trends of annual temperature with different study periods are statistically significant at the α = 0.01 level except that in the recent 30 years (1991–2022) (Table 1). The increasing trend magnitudes of annual mean temperatures in the SHR are about 0.16 °C/10 years in the last 122 years and about 0.30 °C/10 years in the last 50–60 years (Table 2), whose values are larger than that of global mean surface temperature [1].
The annual mean temperature has increased much faster since 1970 than in any other 40–50-year period, with a trend magnitude of 0.53–0.58 °C/10 years (Table 2). It is also consistent with the global mean temperature trend that it has been faster in the recent 50 years since 1970 than in any other 50-year period over at least the last 2000 years [1].
The anomaly of annual total streamflow displays a similar annual and decadal variability as annual total precipitation (Figure 2) with three positive and three negative periods of anomalies.
However, a few differences can be observed. (1) The anomaly range of annual streamflow is much larger than that of annual precipitation. For example, the anomalies of annual total precipitation have varied from −25% to 29% during the last 122 years, but it ranges from −69% to 147% for annual total streamflow (Figure 2). (2) The lengths of three dry and three wet periods of annual total streamflow could be slightly different from those of annual total precipitation. For example, the second dry period runs from 1964 to 1982 for annual total precipitation but from 1967 to 1982 for the annual total streamflow.
Figure 3 shows the temporal variations in the coefficients of variance (CVs) over the 30-year time period of annual total precipitation, mean temperature, and total streamflow in the SHR. The first point of the curves is the coefficient of variance for the 1901–1930 (30 years) period, the second point is then the CV for the 1902–1931 period, and so on until 1993–2022. The first impression is that annual total precipitation has a much smaller variability than annual streamflow and temperature in terms of the CV at 30 years; it ranges from 0.10 to 0.16 for the 30-year annual total precipitation time series, but they vary from 0.19 to 0.44 for annual mean temperature and from 0.26 to 0.53 for annual total streamflow.
The CV values of the 30-year window for the annual total precipitation and annual total streamflow show a similar temporal pattern, i.e., a decreasing period, a stable phase, and then an increasing stage since around 1970, even with different magnitudes. The CV values of the 30-year window for the annual mean temperature, on the other hand, are relatively stable before 1970, but show a decreasing trend since 1970 (Figure 3).

3.2. Relationship between Streamflow and Precipitation

Figure 4 shows the time series of runoff coefficient, i.e., ratio of the annual total streamflow to the annual total precipitation. The long-term (1901–2022) average runoff coefficient is about 0.19, i.e., 19% of the annual total precipitation converts into streamflow. However, it displays a clear year-to-year and decadal variability with a higher value in a wet year and a lower value in a dry year (Figure 5). The correlation between the runoff coefficient and the annual total precipitation is statistically significant at the α = 0.001 significance level.
It is a little surprising to note that the time series of the runoff coefficient does not show a declining trend due to the regional development of more water usage and population growth. It could partly contribute to the lower rainfall and smaller runoff coefficients during the 1901–1930 period. It could also potentially result from other reasons [27], such as a warmer climate resulting in more streamflow from snowmelt given the decreasing trend of snow cover and duration [28], changes in rainfall characteristics, and the used water flowing back to the river channel. It is a complicated scientific question and further investigation is needed to draw a solid conclusion.
However, the correlation between the annual precipitation and streamflow does vary with time. For example, the elasticity of streamflow to precipitation [29] was 4.4 for the wet period 1929–1966 and 4.5 for the dry period 1901–1928 (Table 3). It indicates that the streamflow–precipitation correlation was relatively stable for both positive and negative precipitation anomalies during 1901–1966 and that every 10% change in precipitation could result in a 44–45% change in the streamflow. In contrast, it was only 2.1 for the dry period 1967–1982 and 3.2 for the recent wet period 2013–2022. This implies that the complicated hydrological processes in recent years are due to the impacts of climate change and variability, as well as human activities.

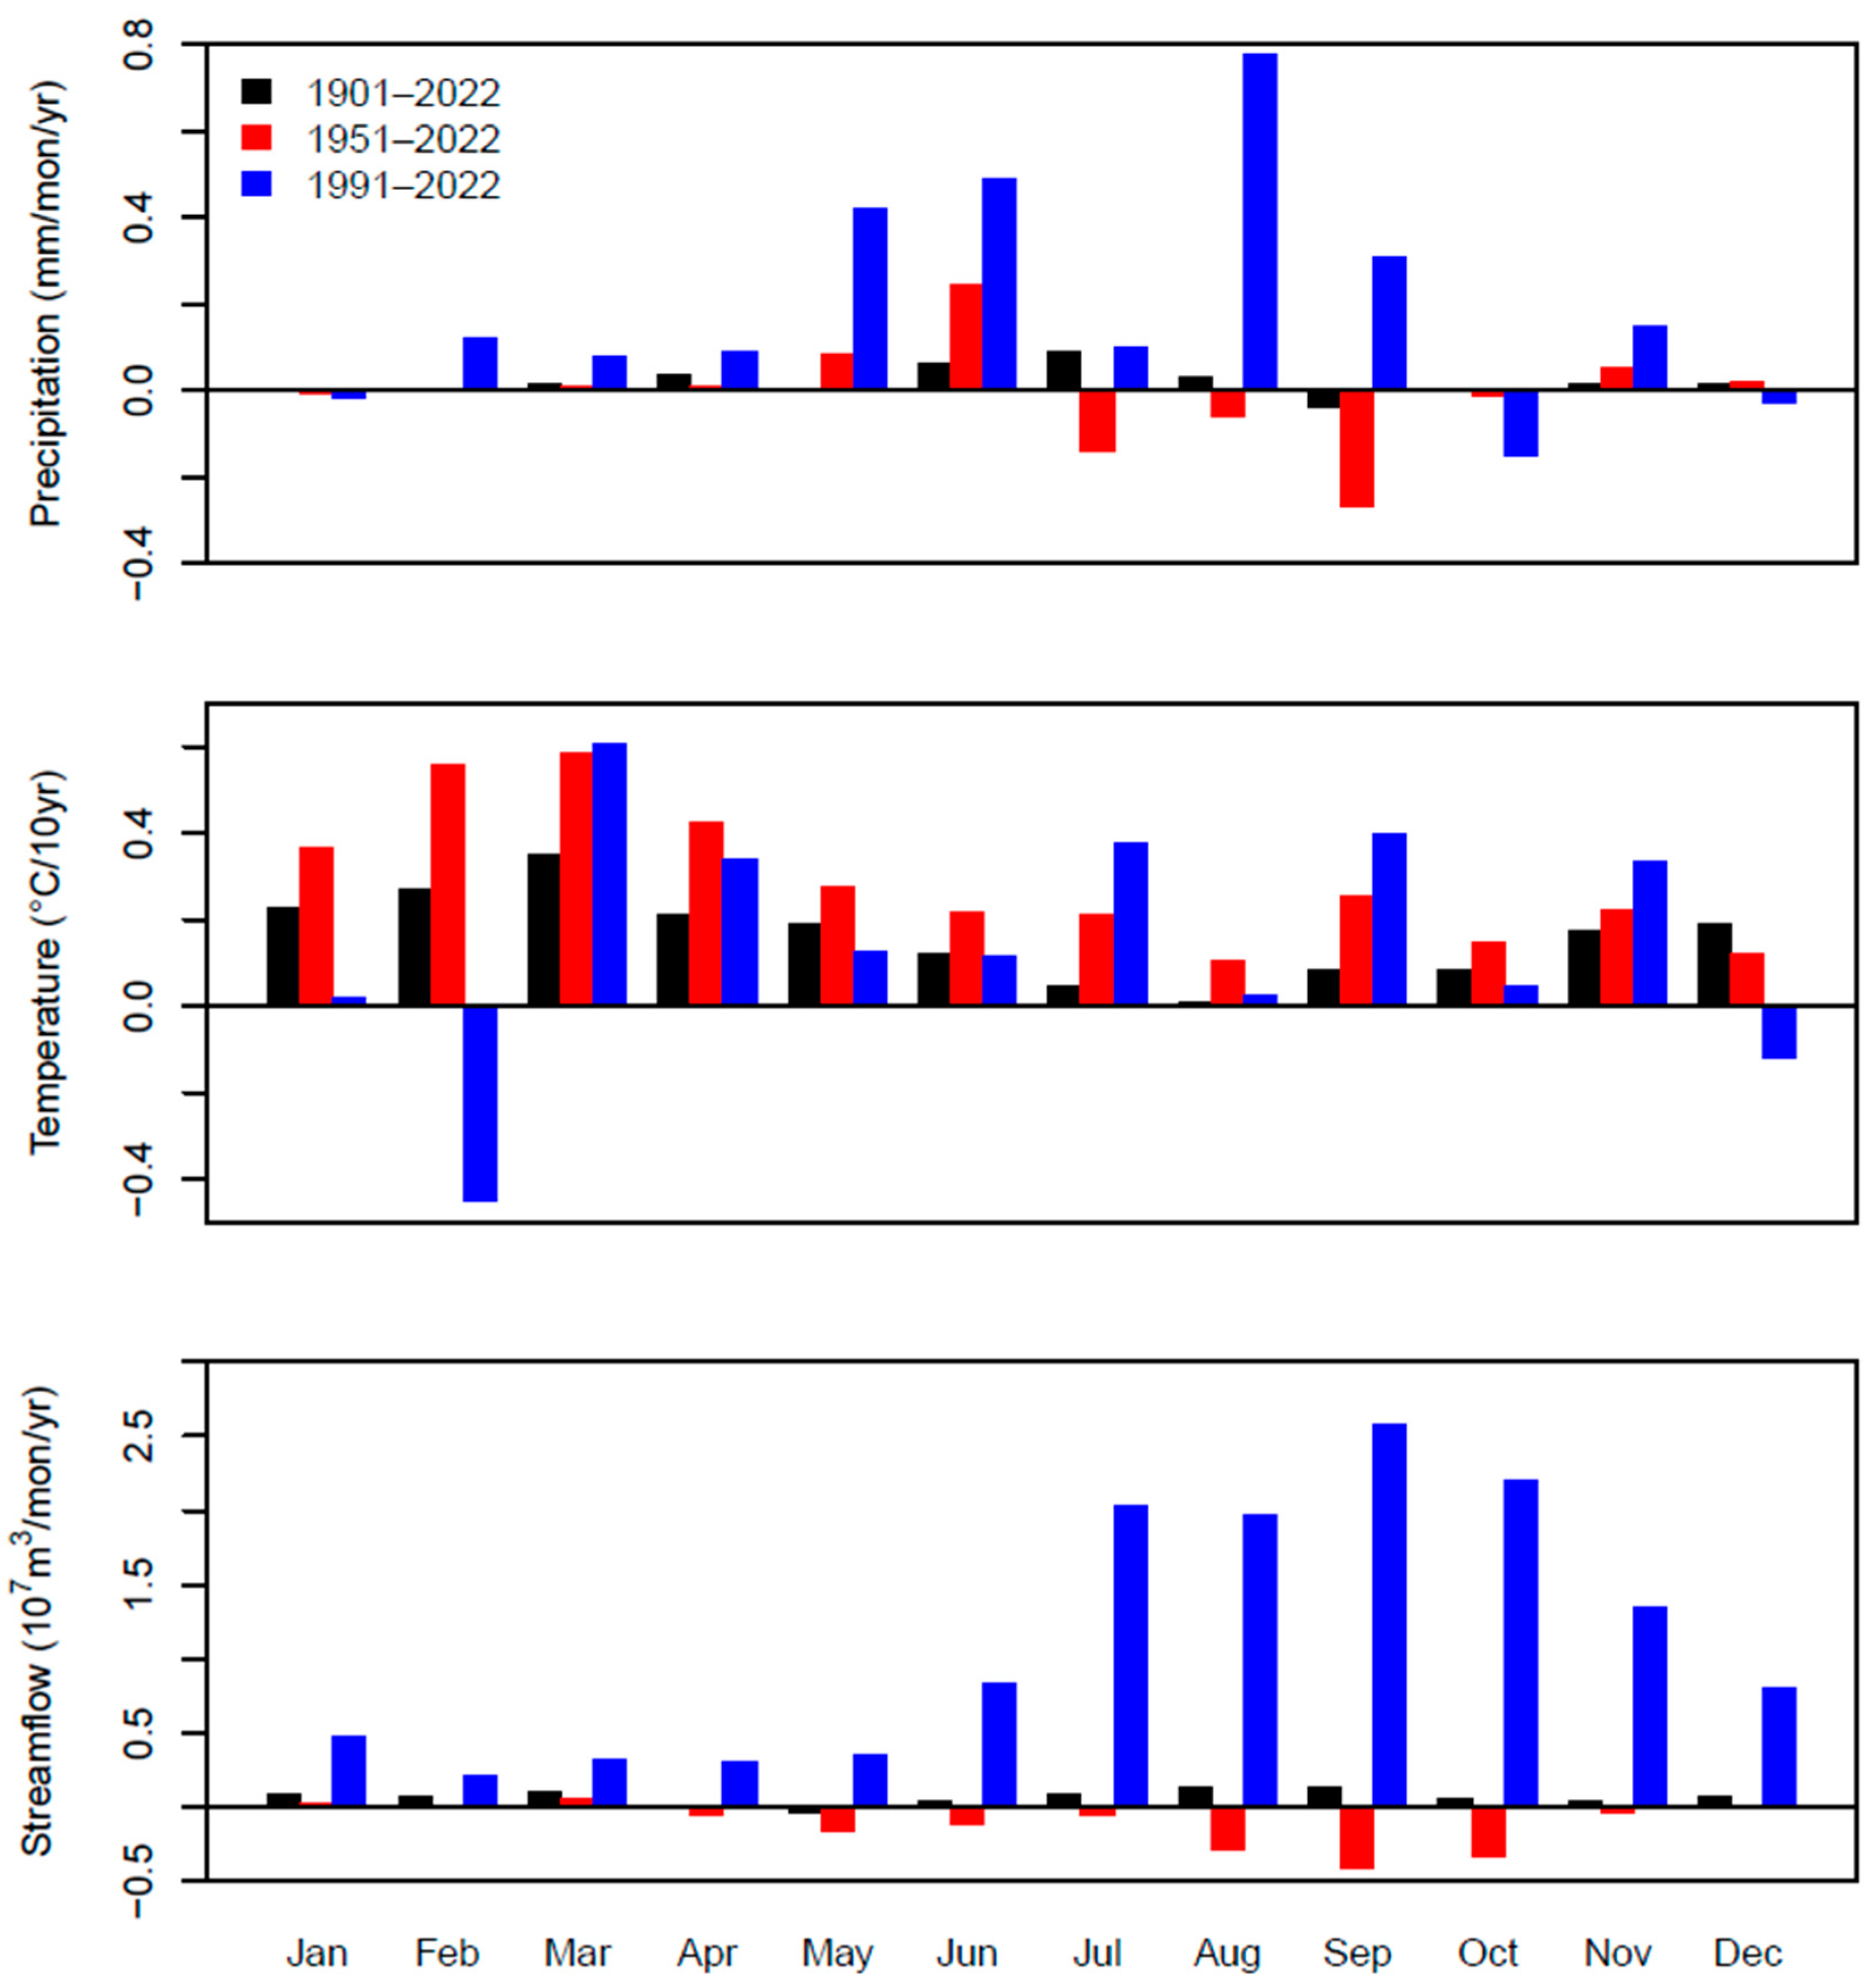
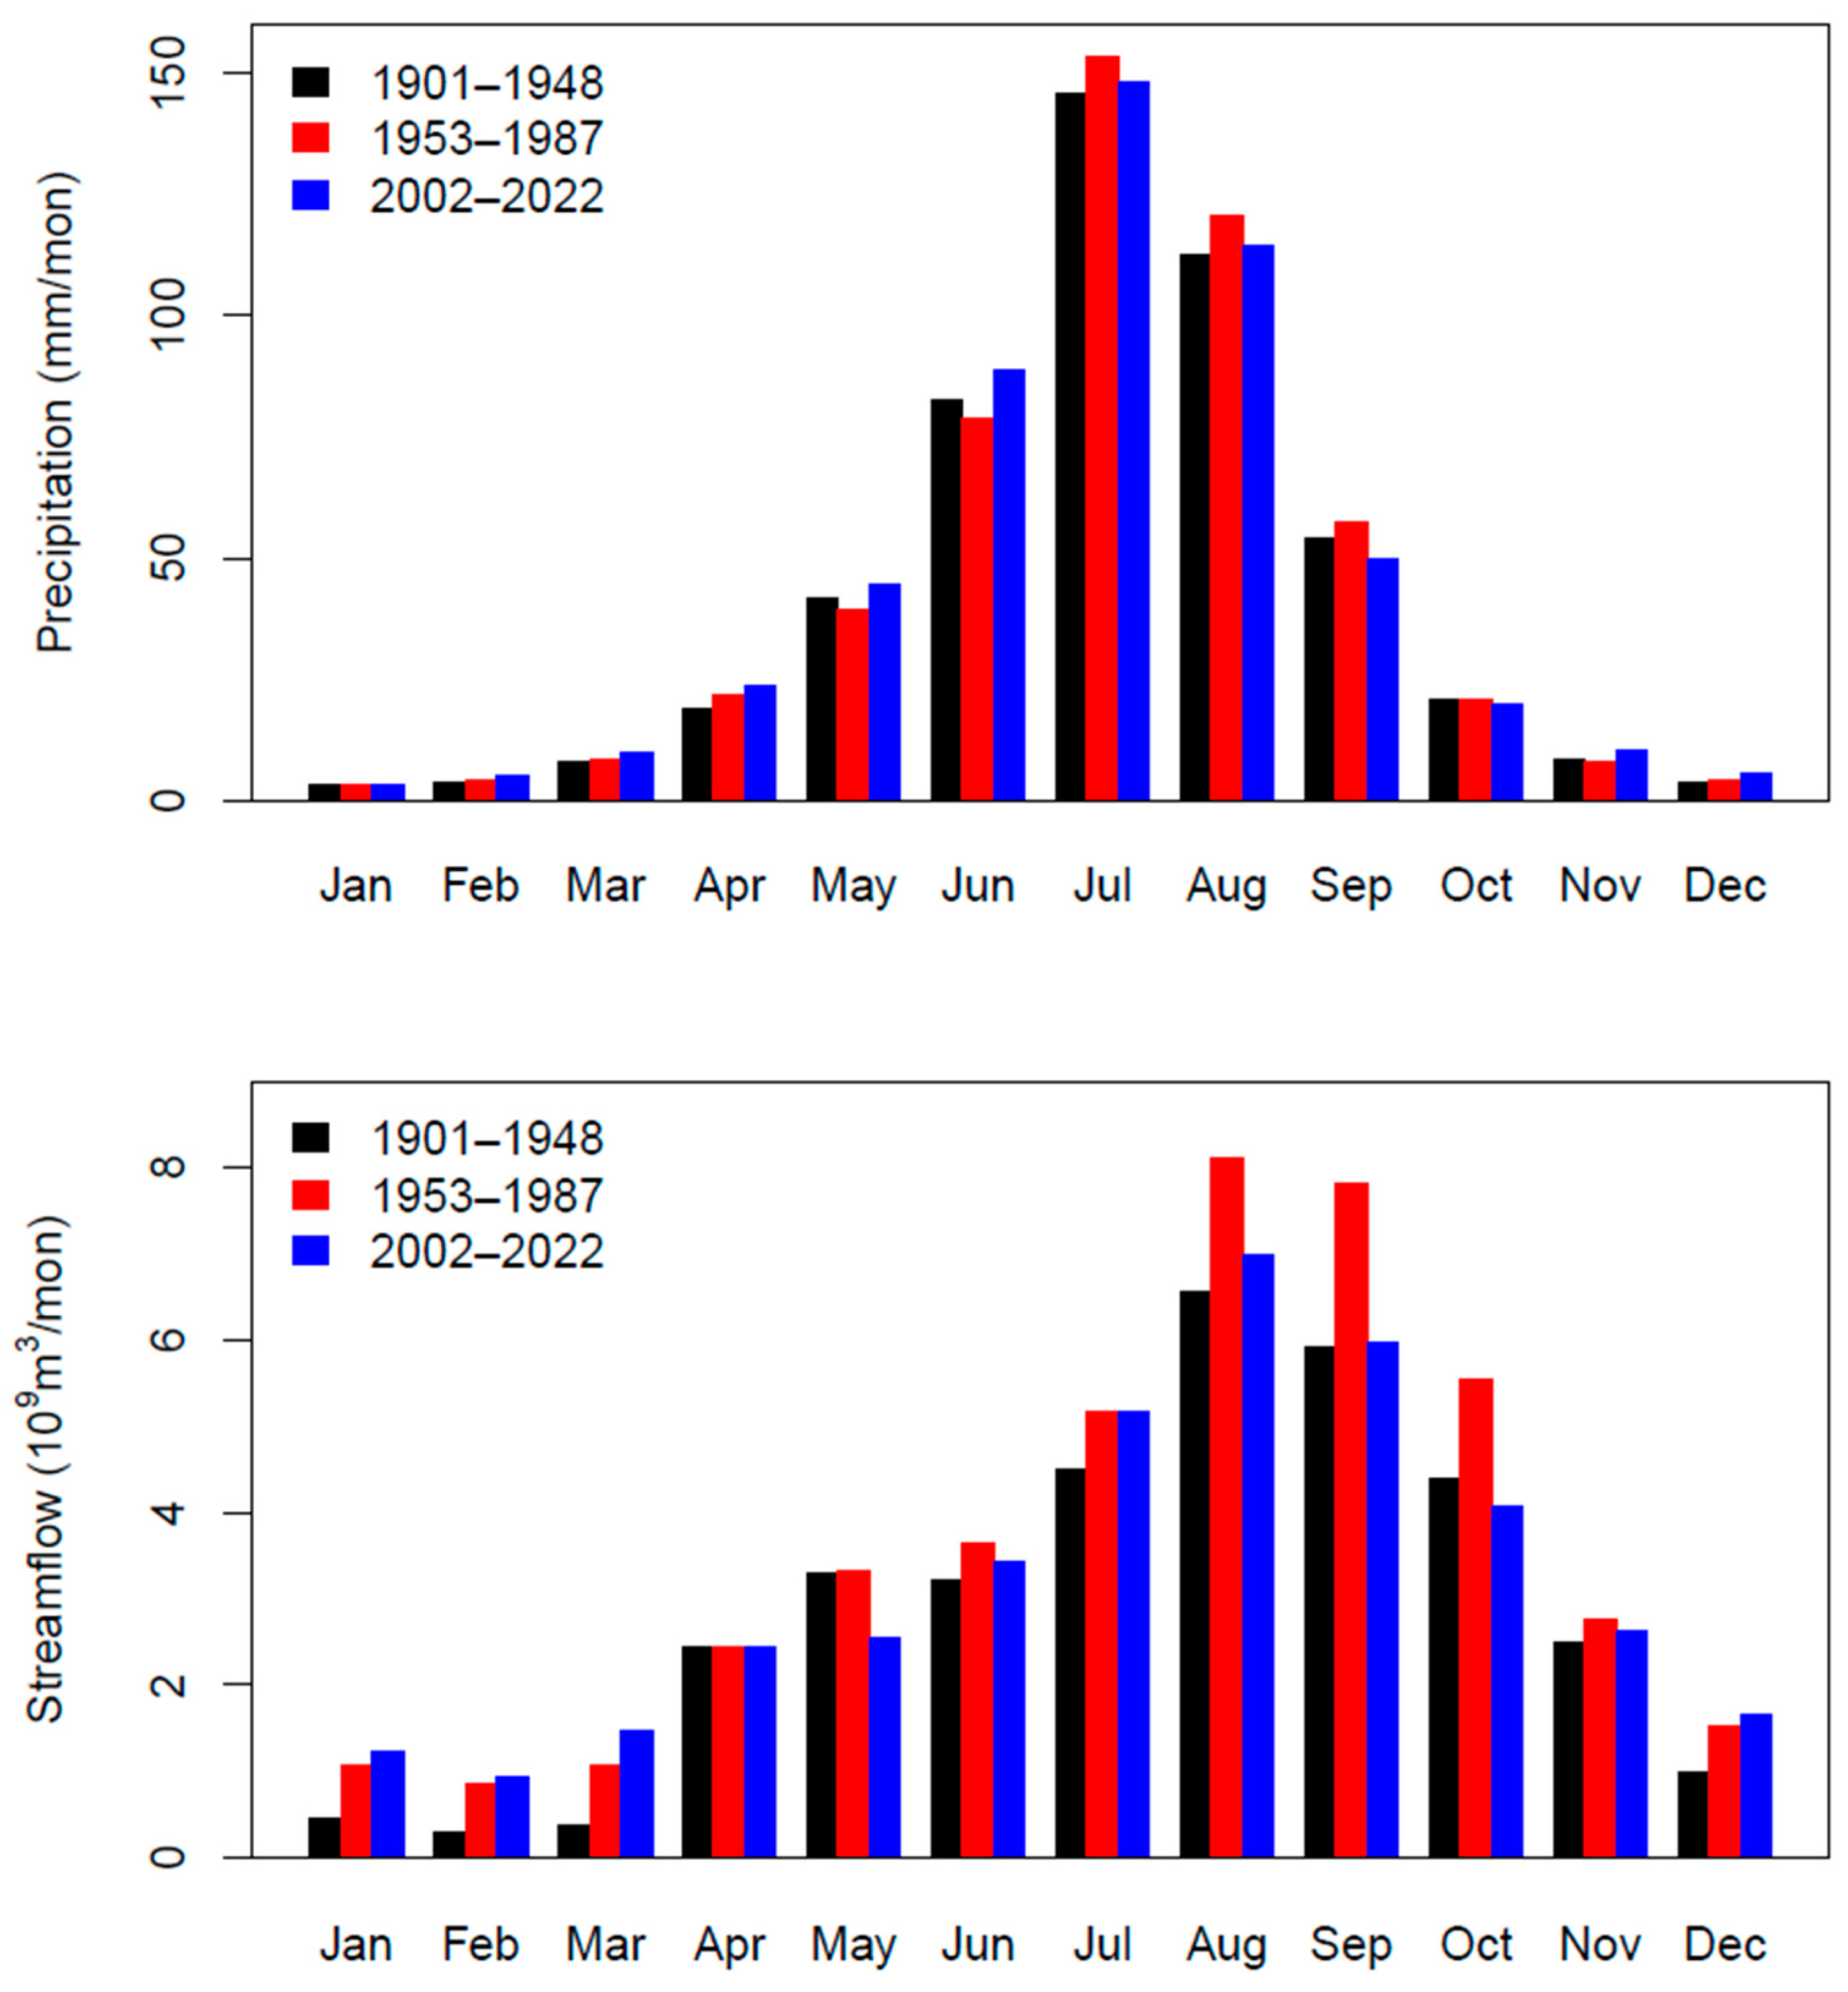
3.3. Monthly Trends of Precipitation, Temperature, and Streamflow

Figure 6 shows the trend magnitudes of monthly precipitation, temperature, and streamflow for three study periods, i.e., the long-term 1901–2022, an intermediate 1951–2022, and the recent 1991–2022 period. It is not surprising that a shorter study period generally leads to a higher trend magnitude, especially for monthly precipitation and streamflow (Figure 6).
For the long-term 1901–2022 monthly precipitation, all months except September show a statistically insignificant trend of increasing monthly precipitation. The trend magnitudes range within 0.1 mm/mon/year (Figure 6, black color bars) and September is the only month showing a decline in monthly precipitation over the 1901–2022 period, with a trend magnitude of −0.04 mm/mon/year.
Monthly precipitation during the 1951–2022 period display a mixed pattern of increasing and decreasing trends. The months in the later summer to the early autumn (July–October) show a decreasing trend of monthly precipitation and other months an increasing trend of monthly precipitation. The trend magnitudes in this period vary from −0.25 to 0.25 mm/mon/year (Figure 6, red color bars).
The monthly precipitation trend magnitudes in the recent 30 years (1991–2022) could be as high as 0.8 mm/mon/year in August (Figure 6, blue color bars). The trend magnitudes in May and June are also larger than 0.4 mm/mon/year. In contrast, the trend magnitude in October falls between −0.2 and −0.1 mm/mon/year.
The monthly mean temperatures exhibit an overall increasing trend regardless of months and study periods except February and December in the recent 30 years (Figure 6). However, different monthly trend patterns can be observed. (1) For the long-term 1901–2022 monthly temperatures, the trend magnitudes in the winter months are larger than those in the summer months. For example, it is about 0.4 °C/10 years in March but almost zero in August (Figure 6, black color bars). (2) The trend magnitudes of monthly temperature during the 1951–2022 period follow the same monthly pattern as those in the 1901–2022 period, with higher magnitudes in the winter months. But these trend magnitudes are larger than those in the 1901–2022 period, including the summer months. It is because the monthly temperature has increased at a much faster rate since 1970. (3) The recent 30 years from 1991 to 2022 present an interesting pattern of monthly temperature trend magnitude with the winter months (especially December and February), showing a decreasing trend of monthly temperature.
Trends of monthly streamflow generally follow the same patterns as monthly precipitation because precipitation is the most important factor for streamflow generation. For example, almost all months show a statistically insignificant trend of increasing monthly streamflow during the 1901–2022 period, mirroring monthly precipitation (Figure 6, black color bars), even though a small difference exists for May and September, when the monthly precipitation and streamflow demonstrated opposite signs of trend magnitudes.
However, trends of monthly streamflow do show some differences from those of monthly precipitation, especially for the 1951–2022 and 1991–2022 study periods. For example, there were more months showing a decreasing trend of monthly streamflow than monthly precipitation for the 1951–2022 period. It could be a result of human activity because many dams and reservoirs within the SHR were built in this period. The increasing magnitudes of monthly streamflow in the recent 1991–2022 period were also much larger than those in the two previous periods. It may be a result of a combination of wet climate in recent years and the green-for-grain program to protect the environment.
It is also interesting to note that monthly precipitation in the winter season (December, January, and February) in recent years (2002–2022) was almost the same as in earlier periods (1901–1948 and 1953–1987) (Figure 7), but a significant increasing monthly streamflow was observed (Figure 7). It implies the contributions of snowmelt to the streamflow in this season due to a warming climate [28].
There was also an intra-annual lag between monthly streamflow and monthly precipitation (Figure 7). For example, July received the largest monthly precipitation, but August produced the largest monthly streamflow (Figure 7). It could potentially result from two reasons: the movement of water through river channel from the upstream to the downstream and the impacts of dams and reservoirs on monthly streamflow.

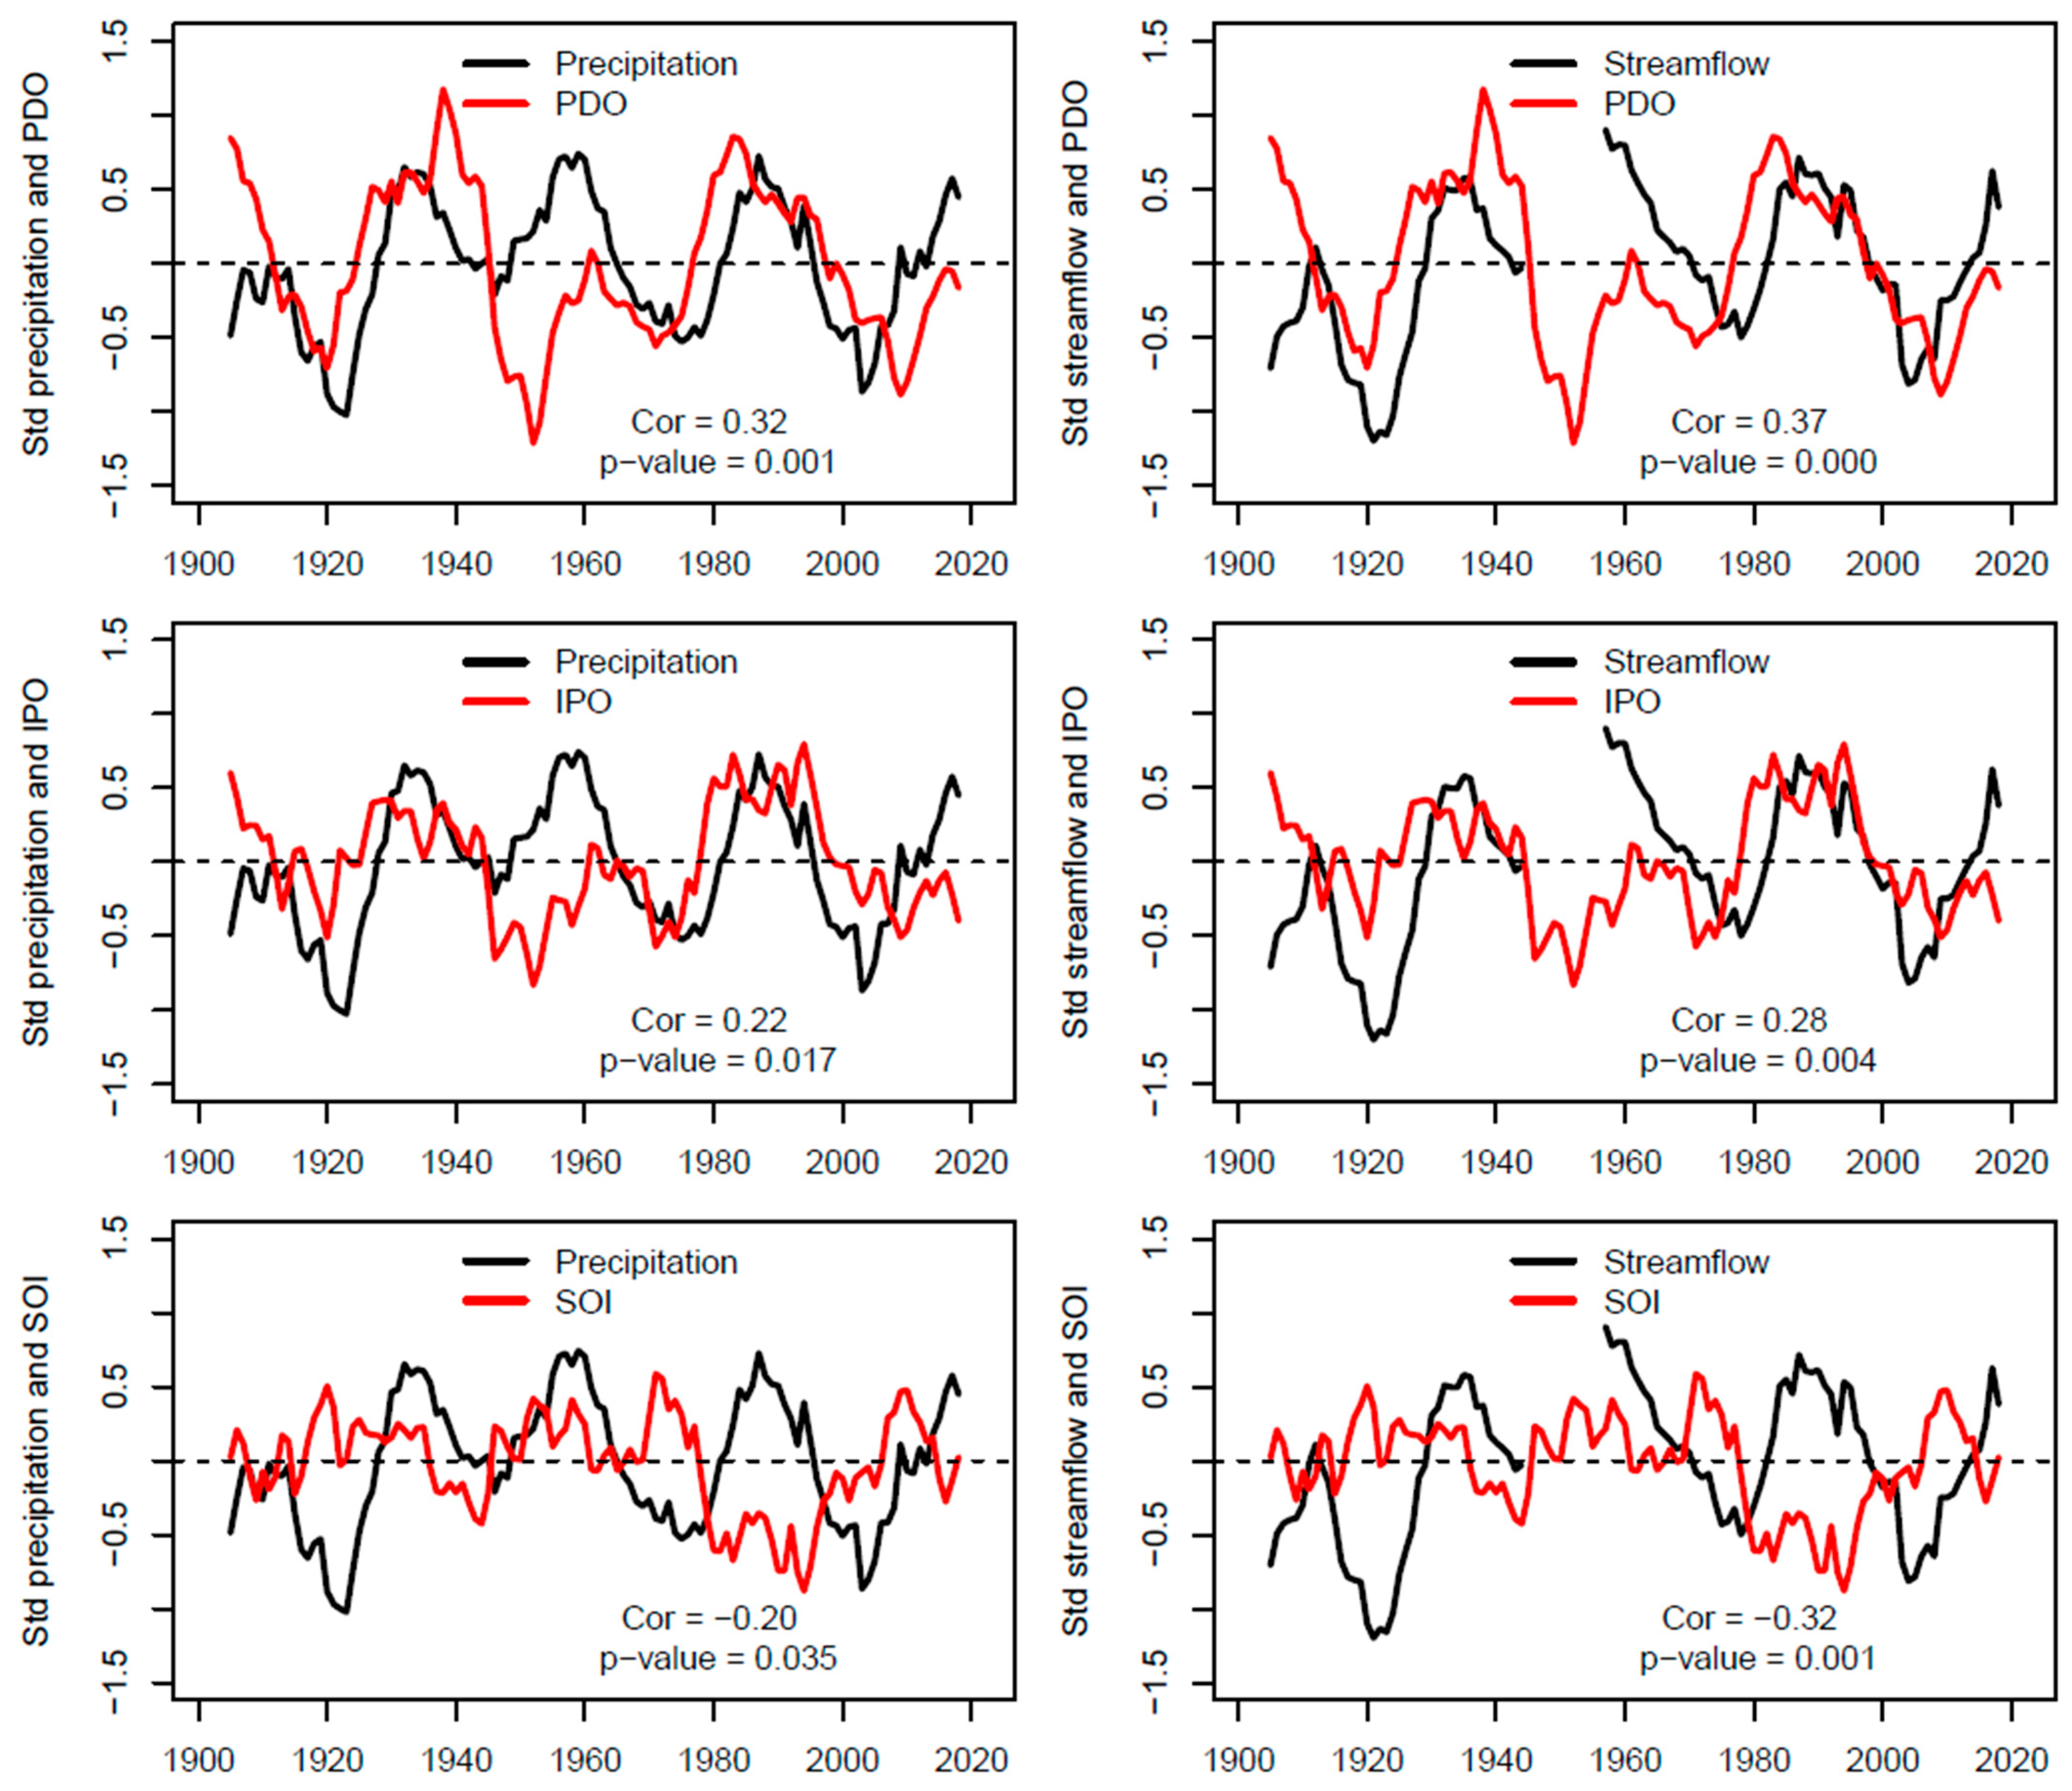
3.4. Linkages between Hydroclimate Variability and Climate Indices

Figure 8 shows the time series of the standardized annual total precipitation and annual total streamflow, as well as the annual standardized SOI, PDO, and IPO. A 9-year moving average was applied to remove the noise, because both the PDO and IPO are decadal climate indices with a period of 15–30 years. Overall, statistically significant correlations between hydroclimate variables (precipitation and streamflow) and three climate indices (PDO, IPO, and SOI) can be determined, because all p-values are less than the α = 0.05 significance level.
The PDO and IPO show similar positive correlations with annual precipitation and streamflow. Two time series generally follow the similar temporal patterns, except for two time periods during 1901–1910 and 1940–1950, when the hydroclimate variables and climate indices showed opposite signs of anomalies. A slightly stronger correlation between annual streamflow and climate indices than annual precipitation could partially result from missing values of annual streamflow during 1949–1952. There were also lag effects between climate indices and hydroclimate variables, such as the shifted peaks in the early 1980s.
The SOI index shows a negative correlation with annual precipitation and streamflow. One potential caveat of this conclusion between the SOI and hydroclimate variables is that ENSO generally has a 2–7-year cycle and our 9-year moving average eliminated this period. The reason why a 9-year moving average was applied is due the fact that the decadal variability of annual precipitation and streamflow was detected in this study. In fact, if the raw annual time series of the SOI was used, then its correlations with annual precipitation and streamflow would be much weaker and then statistically insignificant at the α = 0.05 level.

4. Discussion

4.1. Comparison with Existing Studies

One major difference and advantage of this current research compared to those existing studies in the literature is that a much longer study period (e.g., 122 years from 1901 to 2022) was used. It presented a full picture of temporal variability of annual total precipitation, mean temperature, and total streamflow, such as an obvious pattern of decadal oscillations with positive and negative anomalies of annual total precipitation and streamflow, as well as a clear increasing trend of the annual mean temperature (Figure 2). It implies the potential caveats and limitations of the existing studies in the literature for trend analysis with a shorter study period. For example, an increasing or decreasing trend of annual total precipitation and streamflow might be identified with a 50-year study period, but this trend has limited practical applications for regional water resource management due to the long-term temporal variability.
The results of this study can not only be used for better water resource management decisions in the SHR, especially under future climate change and variability scenarios, but also have implications for other regions in the world for comparative analysis on the impacts of climate change with a 50–60-year study period vs. long-term variability on regional water availability for a better management planning and strategy.
In addition, an overall statistically significant correlation between hydroclimate variables (annual total precipitation and streamflow) and climate indices (PDO, IPO, and SOI) was determined at the α = 0.05 significant level (Figure 8). The main reason why these three climate indices were used in this study is based on a previous study that showed that they are important climate drivers influencing the interannual hydroclimate in China [16]. And our results confirm this conclusion that there is a statistically significant correlation between these indices and hydroclimate variables in our study region. Moreover, we did test more climate indices, such as the definition of El Niño and La Niña events by Trenberth [30] based on 5-month running means of sea temperature (SST) anomalies in the Niño 3.4 region (5° N–5° S, 120°–170° W). However, it did not show a statistically significant impact on hydroclimate variables in the SHR, so the associated results were not represented in this manuscript.

4.2. Spatial Heterogeneity

Given the size of the SHR and spatial elevation distributions, it is expected that the annual precipitation, temperature, and streamflow would display spatially heterogenous distributions [2]. This study was limited to the catchment average precipitation and temperature because only one streamflow gauge had a long-term observation. It is a clear caveat of this study due to the streamflow data availability. Future research could be extended into this topic with paleoclimatology data that were derived from sources such as tree rings, ice cores, corals, and lake sediments within the SHR.

4.3. Regional vs. Global Warming

It is interesting to note that the SHR experienced a warming trend in the last 122 years, especially since 1970, which displayed a similar warming trend as the global land surface (Figure 9). However, differences could be observed. (1) Annual mean temperature anomaly at the catchment scale usually has a larger variation than that at the global scale. (2) The global land surface mean temperature has kept on increasing in the recent 10–15 years but not for the SHR. The top-eight hottest years for the global land surface were all after 2015, being, in order, 2020, 2016, 2017, 2019, 2022, 2021, 2015, and 2018. But the hottest year in the SHR was 2007. Moreover, it had a negative anomaly of annual mean temperature for 2010 and 2012 (Figure 9). The possible reasons and potential impacts of these differences need further investigations.

4.4. Trend Methods

The three most popular trend methods in the literature were used in this study to detect trends in the annual and monthly precipitation, temperature, and streamflow. Overall, results from different methods, especially the non-parametric MK test and the liner regression method, were similar. A general recommendation would be that all three methods should be used for trend analysis, because consistent results from different methods could enhance our confidence in the trend results. The inconsistent results should be further investigated to uncover potential unforeseen climatic, biophysical, and hydrological processes.
In general, the linear regression and the MK test show similar results, unlike than the ITA method. But it is not the case for groundwater level trend analysis [21]. It could imply that the ITA may not be as robust as the linear regression and the MK for trend analysis if oscillations with positive and negative anomalies occur within the data.
However, the ITA method does provide the trends at different percentiles (Figure 10). For example, trends of annual total precipitation can be classified into four groups depending on precipitation amount: a decreasing trend for the annual precipitation being less than 400 mm/year, but an increasing trend for the annual rainfall being larger than 515 mm/year. The trends of annual streamflow can be classified into three groups: a decreasing trend for the middle percentiles, but an increasing trend for both lower and upper percentiles of the annual streamflow. The difference between annual precipitation and streamflow also implies changes in the streamflow–precipitation relationship due to climate change and variability, as well as human activity.

5. Conclusions

Three popular trend analysis methods were used in this study to explore the trends and variability of hydroclimate variables during the last 122 years (1901–2022) in the Songhua River (SHR), one of the most important river systems in China. Three climate indices (SOI, PDO, and IPO) were also used to explore their potential linkages with the temporal variability of hydroclimate variables. The main conclusions of this investigation can be summarized as follows:
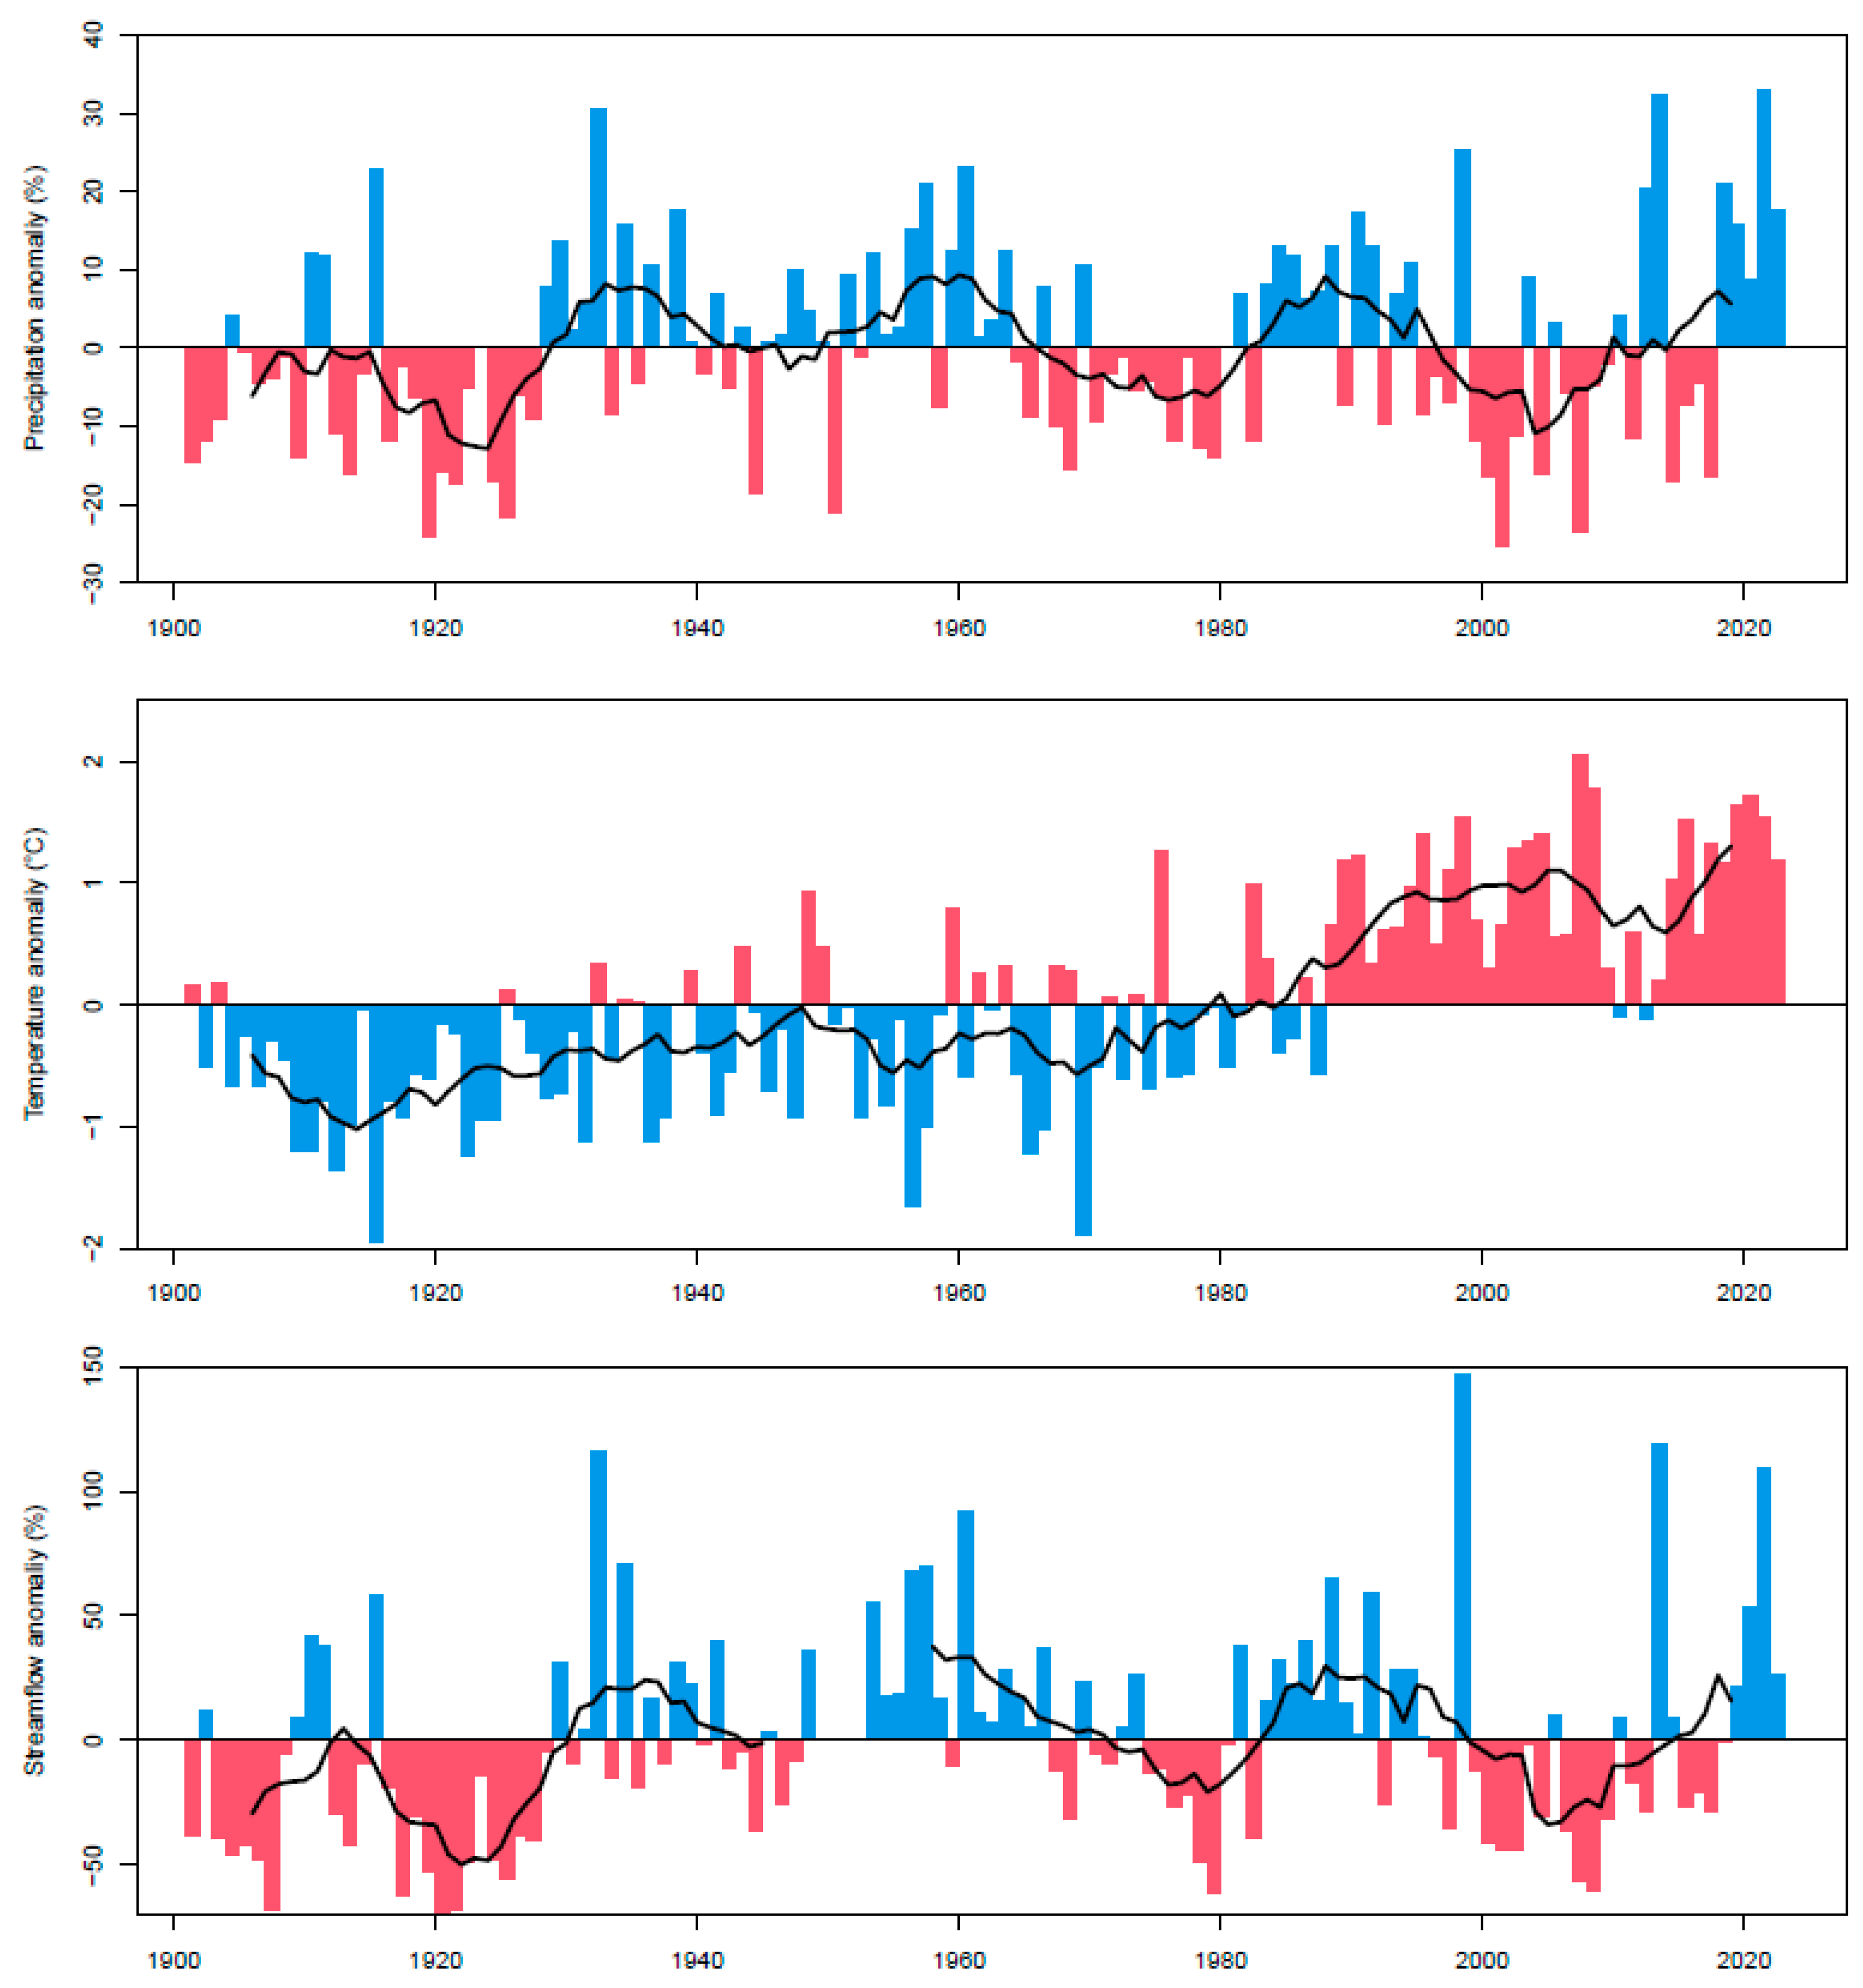
  • There was an obvious pattern of decadal oscillations for the annual total precipitation and streamflow, with three positive and three negative anomalies in the last 122 years (Figure 2).
  • Annual mean temperature demonstrated a statistically significant increasing trend in the last 122 years and the trend magnitude was 0.30 °C/10 years in the last 50–60 years, being larger than that of the global land surface temperature. It has increased much faster since 1970.
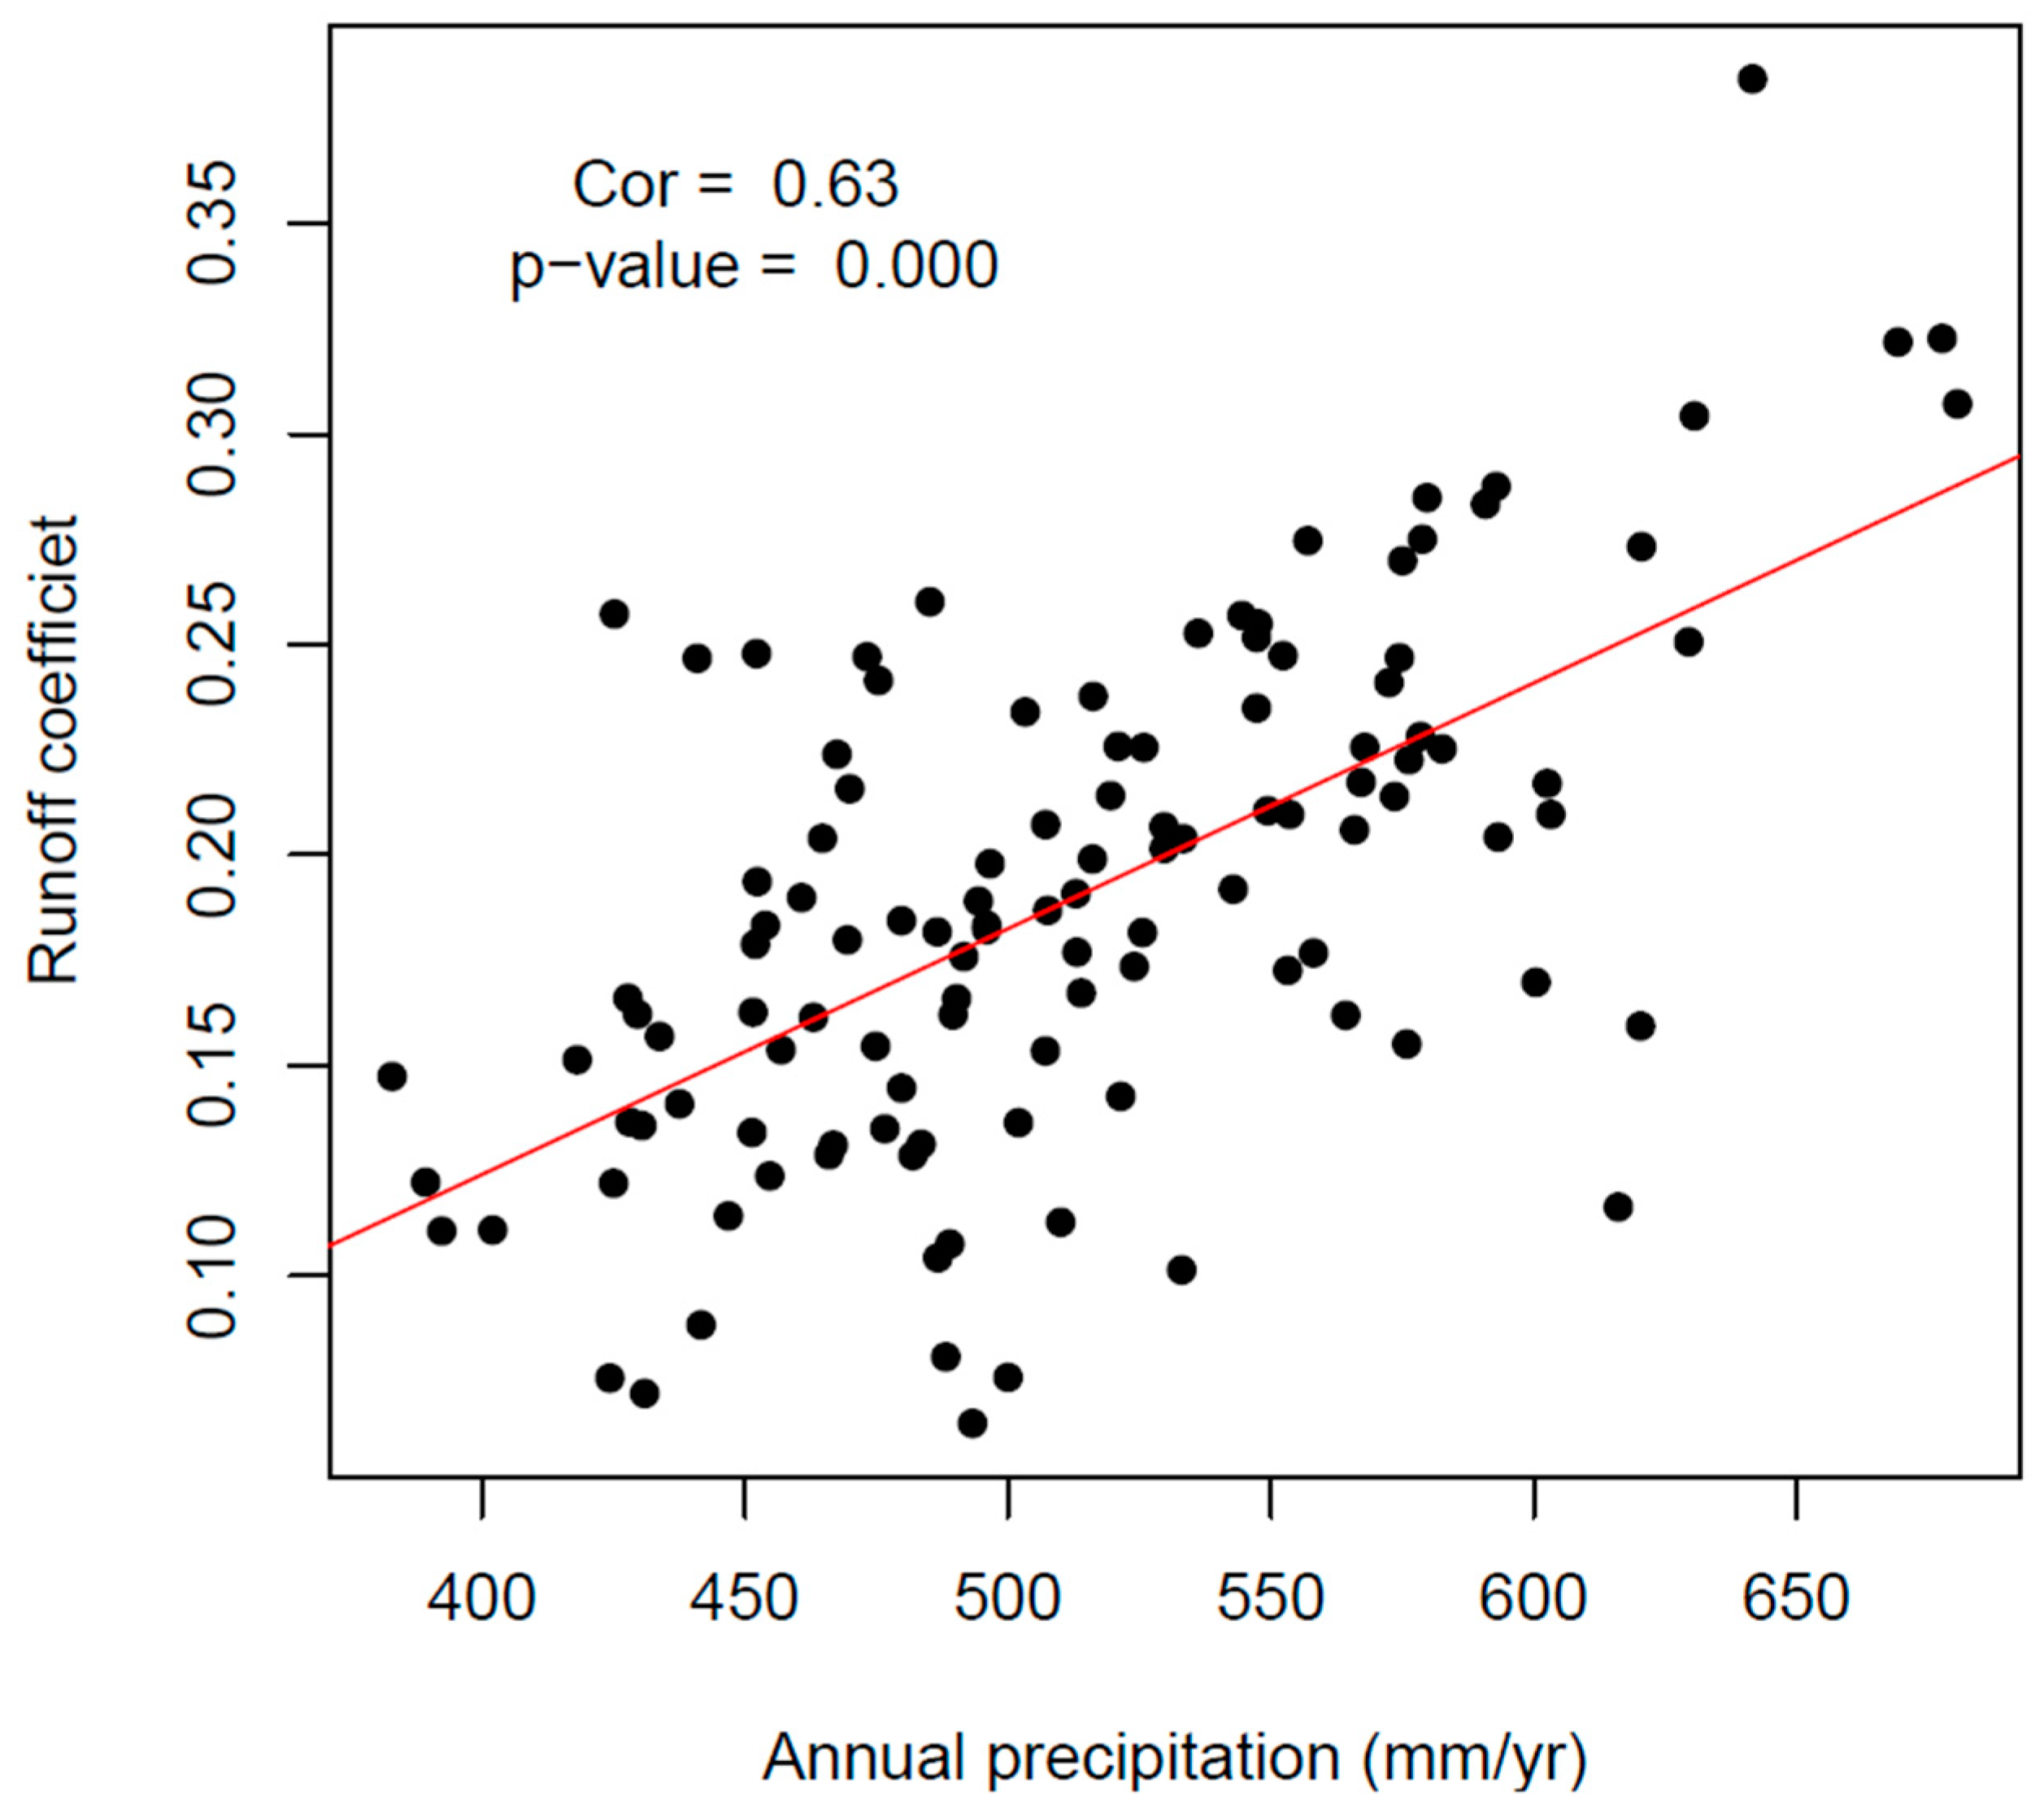
  • Time series of the annual runoff coefficient did not show a declining trend given the regional development of more water usage and population growth. However, the correlations between annual total precipitation and streamflow did vary with time. It could partly contribute to the lower rainfall and smaller runoff coefficients during the 1901–1930 period, but also potentially resulted from other reasons, such as a warmer climate resulting in more streamflow from snowmelt.
  • Winter monthly precipitation in recent years was almost the same as in the earlier periods, but an increasing monthly streamflow was observed. It was a result of more snowmelt under a warming climate.
  • A statistically significant correlation between the hydroclimate variables (annual total precipitation and streamflow) and climate indices (SOI, PDO, and IPO) was determined.
  • The SHR displayed a similar warming trend to the global land surface, especially since 1970. However, the global land surface mean temperature has been increasing in the recent 10–15 years but not for the SHR. The top-eight hottest years for the global land surface were all after 2015, but the hottest year in the SHR was the 2007.
  • Three trend methods employed in this study showed similar results, but differences were also observed. A general conclusion would be that all models should be used to quantify the uncertainty, and consistent results certainly enhance our confidence in the results and conclusions.
  • The ITA method is less robust and popular than the non-parametric MK test and the linear regression, but it can provide additional information on the trends at different percentiles (Figure 10).
  • One major difference and advantage of this current research compared to those existing studies is that a much longer study period was used. It presented a full picture of temporal variability of hydroclimate variables, such as the decadal oscillations with positive and negative anomalies of annual precipitation and streamflow. It implies the potential caveats and limitations of existing studies with a shorter study period. For example, an increasing or decreasing trend of annual total precipitation and streamflow might be identified with a 50-year study period, but this trend has limited practical applications for regional water resource management given the long-term temporal variability.
  • The results of this study can not only be used for better water resource management decisions in the SHR, but also have implications for other regions in the world for comparative analysis.
  • There are some uncertainties and caveats associated with the results of this study which need further investigation to draw a solid conclusion.

Author Contributions

Conceptualization, C.M., J.L. and G.F.; methodology, C.M. and G.F.; software, G.F.; validation, C.M., W.P., J.L. and G.F.; formal analysis, C.M., W.P., J.L. and G.F.; investigation, C.M., W.P., J.L. and G.F.; resources, J.L.; data curation, W.P. and G.F.; writing—original draft preparation, C.M., J.L. and G.F.; writing—review and editing, C.M., W.P., J.L. and G.F.; visualization, W.P. and G.F.; supervision, J.L. and G.F.; project administration, C.M.; funding acquisition, C.M. and J.L. All authors have read and agreed to the published version of the manuscript.

Funding

This research was funded by Jilin Province Foreign Expert Project (L202322) and Jilin Provincial Science & Technology Department (20230508029RC).

Institutional Review Board Statement

Not applicable.

Informed Consent Statement

Not applicable.

Data Availability Statement

Monthly precipitation data at: https://doi.org/10.5281/zenodo.3114194 (accessed on 18 December 2023). Monthly temperature at: https://doi.org/10.5281/zenodo.3185722 (accessed on 18 December 2023). The 1901–1987 monthly streamflow data at: http://grdc.bafg.de/ (accessed on 18 December 2023). The annual streamflow 1988–2001 and monthly streamflow 2002–2022 at: http://www.mwr.gov.cn/sj/tjgb/zghlnsgb/ (accessed on 18 December 2023). SOI index at: http://www.bom.gov.au/climate/glossary/soi.shtml (accessed on 18 December 2023). PDO data at: https://www.ncei.noaa.gov/pub/data/cmb/ersst/v5/index/ersst.v5.pdo.dat) (accessed on 18 December 2023). IPO data at: https://psl.noaa.gov/data/timeseries/IPOTPI/ (accessed on 18 December 2023).

Acknowledgments

We would like to thank three anonymous reviewers for their invaluable comments and constructive suggestions used to improve the quality of the manuscript.

Conflicts of Interest

The authors declare no conflicts of interest.

References

  1. IPCC. Summary for Policymakers. In Climate Change 2023: Synthesis Report. Contribution of Working Groups I, II and III to the Sixth Assessment Report of the Intergovernmental Panel on Climate Change; Core Writing Team, Lee, H., Romero, J., Eds.; IPCC: Geneva, Switzerland, 2023; p. 34. [Google Scholar]
  2. Li, F.P.; Zhang, G.X.; Xu, Y.J. Spatiotemporal variability of climate and streamflow in the Songhua River. Basin, northeast China. J. Hydrol. 2014, 514, 53–64. [Google Scholar] [CrossRef]
  3. Miao, C.Y.; Yang, L.; Liu, B.Y.; Gao, Y.; Li, S.L. Streamflow changes and its influencing factors in the mainstream of the Songhua River basin, Northeast China over the past 50 years. Environ. Earth Sci. 2011, 63, 489–499. [Google Scholar] [CrossRef]
  4. Wang, S.J.; Wang, Y.J.; Ran, L.S.; Su, T. Climatic and anthropogenic impacts on runoff changes in the Songhua River basin over the last 56 years (1955–2010), Northeastern China. Catena 2015, 127, 258–269. [Google Scholar] [CrossRef]
  5. Yin, S.H.; Gao, G.Y.; Huang, A.Q.; Li, D.F.; Ran, L.S.; Nawaz, M.; Xu, Y.J.; Fu, B.J. Streamflow and sediment load changes from China’s large rivers: Quantitative contributions of climate and human activity factors. Sci. Total Environ. 2023, 876, 162758. [Google Scholar] [CrossRef] [PubMed]
  6. Khan, M.I.; Liu, D.; Fu, Q.; Azmat, M.; Luo, M.J.; Hu, Y.X.; Zhang, Y.J.; Abrar, F.M. Precipitation variability assessment of northeast China: Songhua River basin. J. Earth Syst. Sci. 2016, 125, 957–968. [Google Scholar] [CrossRef]
  7. Faiz, M.A.; Liu, D.; Fu, Q.; Qamar, M.U.; Dong, S.; Khan, M.I.; Li, T. Complexity and trends analysis of hydrometeorological time series for a river streamflow: A case study of Songhua River Basin, China. River Res. Appl. 2018, 34, 101–111. [Google Scholar] [CrossRef]
  8. Su, L.; Miao, C.Y.; Gou, J.J. Long-term trends in Songhua River Basin streamflow and its multivariate relationships with meteorological factors. Environ. Sci. Pollut. Res. 2021, 28, 64206–64219. [Google Scholar] [CrossRef]
  9. Liu, S.Q.; Zhou, Z.H.; Liu, J.J.; Li, J.; Wang, P.X.; Li, C.M.; Xie, X.M.; Jia, Y.W.; Wang, H. Analysis of the Runoff Component Variation Mechanisms in the Cold Region of Northeastern China under Climate Change. Water 2022, 14, 3170. [Google Scholar] [CrossRef]
  10. Ren, G.Y.; Ding, Y.H.; Zhao, Z.C.; Zheng, J.Y.; Wu, T.W.; Tang, G.L.; Xu, Y. Recent progress in studies of climate change in China. Adv. Atmos. Sci. 2012, 29, 958–977. [Google Scholar] [CrossRef]
  11. Zhou, Z.; Shi, H.; Fu, Q.; Li, T.; Gan, T.Y.; Liu, S.; Liu, K. Is the cold region in Northeast China still getting warmer under climate change impact? Atmos. Res. 2020, 237, 104864. [Google Scholar] [CrossRef]
  12. Yan, X.H.; Boyer, T.; Trenberth, K.; Karl, T.R.; Xie, S.P.; Nieves, V.; Tung, K.K.; Roemmich, D. The global warming hiatus: Slowdown or redistribution? Earths Future 2016, 4, 472–482. [Google Scholar] [CrossRef]
  13. Peng, S.Z.; Ding, Y.X.; Liu, W.Z.; Li, Z. 1 km monthly temperature and precipitation dataset for China from 1901 to 2017. Earth Syst. Sci. Data 2019, 11, 1931–1946. [Google Scholar] [CrossRef]
  14. Harris, I.; Jones, P.D.; Osborn, T.J.; Lister, D.H. Updated high-resolution grids of monthly climatic observations—The CRU TS3.10 Dataset. Int. J. Climatol. 2014, 34, 623–642. [Google Scholar] [CrossRef]
  15. Harris, I.; Osborn, T.J.; Jones, P.; Lister, D. Version 4 of the CRU TS monthly high-resolution gridded multivariate climate dataset. Sci. Data 2020, 7, 109. [Google Scholar] [CrossRef]
  16. Ouyang, R.; Liu, W.; Fu, G.; Liu, C.; Hu, L.; Wang, H. Linkages between ENSO/PDO signals and precipitation, streamflow in China during the last 100 years. Hydrol. Earth Syst. Sci. 2014, 18, 3651–3661. [Google Scholar] [CrossRef]
  17. Zhang, Y.; Wallace, J.M.; Battisti, D.S. ENSO-like interdecadal variability: 1900–93. J. Clim. 1997, 10, 1004–1020. [Google Scholar] [CrossRef]
  18. Mantua, N.J.; Hare, S.R.; Zhang, Y.; Wallace, J.M.; Francis, R.C. A Pacific interdecadal climate oscillation with impacts on salmon production. Bull. Am. Meteorol. Soc. 1997, 78, 1069–1079. [Google Scholar] [CrossRef]
  19. Salinger, M.J.; Renwick, J.A.; Mullan, A.B. Interdecadal Pacific Oscillation and South Pacific climate. Int. J. Climatol. 2001, 21, 1705–1721. [Google Scholar] [CrossRef]
  20. Henley, B.J.; Gergis, J.; Karoly, D.J.; Power, S.; Kennedy, J.; Folland, C.K. A Tripole Index for the Interdecadal Pacific Oscillation. Clim. Dyn. 2015, 45, 3077–3090. [Google Scholar] [CrossRef]
  21. Fu, G.B.; Rojas, R.; Gonzalez, D. Trends in Groundwater Levels in Alluvial Aquifers of the Murray-Darling Basin and Their Attributions. Water 2022, 14, 1808. [Google Scholar] [CrossRef]
  22. Hirsch, R.M.; Slack, J.R.; Smith, R.A. Techniques of Trend Analysis for Monthly Water-Quality Data. Water Resour. Res. 1982, 18, 107–121. [Google Scholar] [CrossRef]
  23. Kendall, M.G. Rank Correlation Methods, 4th ed.; Charles Griffin: London, UK, 1975. [Google Scholar]
  24. Fu, G.B.; Chen, S.L.; Liu, C.M.; Shepard, D. Hydro-climatic trends of the Yellow River basin for the last 50 years. Clim. Chang. 2004, 65, 149–178. [Google Scholar] [CrossRef]
  25. Sen, P.K. Estimates of Regression Coefficient Based on Kendalls Tau. J. Am. Stat. Assoc. 1968, 63, 1379–1389. [Google Scholar] [CrossRef]
  26. Sen, Z. Innovative Trend Analysis Methodology. J. Hydrol. Eng. 2012, 17, 1042–1046. [Google Scholar] [CrossRef]
  27. Li, Z.; Wu, Y.; Li, J.; Qi, P.; Sun, J.; Sun, Y. Attribution Analysis of Runoff Variation in the Second Songhua River Based on the Non-Steady Budyko Framework. Water 2023, 15, 451. [Google Scholar] [CrossRef]
  28. Wei, Y.L.; Li, X.F.; Gu, L.J.; Zheng, Z.J.; Zheng, X.M.; Jiang, T. Significant decreasing trends in snow cover and duration in Northeast China during the past 40 years from 1980 to 2020. J. Hydrol. 2023, 626, 130318. [Google Scholar] [CrossRef]
  29. Fu, G.B.; Charles, S.P.; Chiew, F.H.S. A two-parameter climate elasticity of streamflow index to assess climate change effects on annual streamflow. Water Resour. Res. 2007, 43, W11419. [Google Scholar] [CrossRef]
  30. Trenberth, K.E. The definition of El Nino. Bull. Am. Meteorol. Soc. 1997, 78, 2771–2777. [Google Scholar] [CrossRef]
Figure 1. Map of the Songhua River (SHR) and the location of Harbin streamflow gauge.
Atmosphere 15 00174 g001
Figure 2. Anomalies of annual total precipitation, mean temperature, and total streamflow in the SHR during 1901–2022. The solid black lines are the 9-year moving average values. The blue bars represent the positive anomalies and red bars the negative anomalies for precipitation and streamflow, and the opposite colors for temperature.
Atmosphere 15 00174 g002
Figure 3. Temporal variations in 30-year coefficients of variance (CVs) of the annual total precipitation, mean temperature, and total streamflow in the SHR.
Atmosphere 15 00174 g003
Figure 4. Time series of runoff coefficient (grey line), i.e., the ratio of annual streamflow to annual precipitation. The solid black lines are the 5-year moving average values. The red dashed line represents the long-term average value.
Atmosphere 15 00174 g004
Figure 5. Correlation between the runoff coefficient and annual precipitation. The red line represents the linear regression model.
Atmosphere 15 00174 g005
Figure 6. Trend magnitudes of monthly precipitation, temperature, and streamflow for three study periods (1901–2022 in black color, 1951–2022 in red color, and 1991–2022 in blue color).
Atmosphere 15 00174 g006
Figure 7. Monthly precipitation (mm/month) and streamflow (109 m3/month) in three periods.
Atmosphere 15 00174 g007
Figure 8. Time series of the standardized annual total precipitation and streamflow, as well as the standardized PDO, IPO, and SOI. A 9-year moving average was applied.
Atmosphere 15 00174 g008
Figure 9. Time series of annual mean temperature in the SHR and global land surface.
Atmosphere 15 00174 g009
Figure 10. Trends of the annual total precipitation and streamflow with ITA method. Blue dots represent an increasing trend and red dots a decreasing trend.
Atmosphere 15 00174 g010
Table 1. The p-values of three trend tests for annual total precipitation, mean temperature, and total streamflow (bold fonts indicate they are statistically significant at α = 0.05 level).
PeriodPrecipitationTemperatureStreamflow
MKLinearITAMKLinearITAMKLinearITA
1901–20220.180.120.860.000.000.000.070.040.41
1911–20220.390.260.740.000.000.000.300.180.92
1921–20220.910.650.720.000.000.000.960.600.62
1931–20220.390.620.740.000.000.000.070.240.21
1941–20220.820.790.560.000.000.000.130.520.87
1951–20220.540.890.960.000.000.000.040.260.57
1961–20220.450.220.980.000.000.000.460.820.60
1971–20220.350.180.970.000.000.000.970.530.66
1981–20220.950.750.940.000.000.020.250.710.27
1991–20220.240.130.210.160.180.440.590.600.79
Table 2. The trend magnitudes of annual precipitation, temperature, and streamflow.
PeriodPrecipitation (mm/Year2)Temperature (°C/10 Year)Streamflow (108 m3/Year2)
MKLinearITAMKLinearITAMKLinearITA
1901–20220.250.260.030.160.160.150.720.860.41
1911–20220.200.22−0.070.180.180.180.490.65−0.06
1921–20220.040.10−0.090.190.190.200.030.29−0.31
1931–2022−0.28−0.13−0.100.200.200.22−1.07−0.75−0.91
1941–2022−0.090.080.200.240.230.27−1.11−0.50−0.14
1951–2022−0.29−0.05−0.020.290.290.33−1.83−1.09−0.61
1961–20220.440.59−0.010.300.300.33−0.760.27−0.68
1971–20220.690.87−0.030.310.300.29−0.161.01−0.82
1981–20220.090.310.080.250.230.21−2.22−0.88−2.95
1991–20222.152.352.250.180.150.102.492.031.21
1969–2008 0.550.530.58
Table 3. Anomalies of streamflow, precipitation, and their ratios (elasticities) in different time periods.
PeriodStreamflow
Anomaly (%)
Precipitation
Anomaly (%)
Elasticity
1901–1928−27.0−6.04.5
1929–196619.54.44.4
1967–1982−11.9−5.52.1
1983–199825.46.04.2
1999–2012−27.4−6.54.2
2013–202226.28.33.2
Disclaimer/Publisher’s Note: The statements, opinions and data contained in all publications are solely those of the individual author(s) and contributor(s) and not of MDPI and/or the editor(s). MDPI and/or the editor(s) disclaim responsibility for any injury to people or property resulting from any ideas, methods, instructions or products referred to in the content.

