Article

Radar, Lightning, and Synoptic Observations for a Thunderstorm on 7 January 2012 during the CHUVA-Vale Campaign

by
João Gabriel Martins Ribeiro
1,
Enrique Vieira Mattos
1,
Michelle Simões Reboita
1,*,
Diego Pereira Enoré
2,
Izabelly Carvalho da Costa
2,
Rachel Ifanger Albrecht
3,
Weber Andrade Gonçalves
4 and
Rômulo Augusto Jucá Oliveira
5
1
Institute of Natural Resources, Federal University of Itajubá, Avenida BPS 1303, Itajubá 37500-903, MG, Brazil
2
Center for Weather Forecasting and Climate Studies (CPTEC), National Institute for Space Research, Cachoeira Paulista 12630-000, SP, Brazil
3
Department of Atmospheric Sciences, Astronomy Institute, Atmospheric and Geophysical Sciences, University of São Paulo (USP), Sao Paulo 05508-090, SP, Brazil
4
Department of Atmospheric and Climatic Sciences, Federal University of Rio Grande do Norte, Av. Senador Salgado Filho 3000, Lagoa Nova, Natal 59078-970, RN, Brazil
5
Centre National de la Recherche Scientifique, Géosciences Environnement Toulouse (GET), 14 Av. Edouard Belin, Complexe Scientifique de Rangueil, 31400 Toulouse, France
*
Author to whom correspondence should be addressed.
Atmosphere 2024, 15(2), 182; https://doi.org/10.3390/atmos15020182
Submission received: 6 December 2023 / Revised: 16 January 2024 / Accepted: 25 January 2024 / Published: 31 January 2024
(This article belongs to the Special Issue Weather and Climate Extremes: Observations, Modeling, and Impacts)

Abstract

:
Thunderstorms can generate intense electrical activity, hail, and result in substantial economic and human losses. The development of very short-term forecasting tools (nowcasting) is essential to provide information to alert systems in order to mobilize most efficiently the population. However, the development of nowcasting tools depends on a better understanding of the physics and microphysics of clouds and lightning formation and evolution. In this context, the objectives of this study are: (a) to describe the environmental conditions that led to a genesis of a thunderstorm that produce hail on 7 January 2012, in the Metropolitan Area of São Paulo (MASP) during the CHUVA-Vale campaign, and (b) to evaluate the thunderstorm microphysical properties and vertical structure of electrical charge. Data from different sources were used: field campaign data, such as S-band radar, and 2- and 3-dimensional lightning networks, satellite data from the Geostationary Operational Environmental Satellite-13 (GOES-13), the Meteosat Second Generation (MSG), and reanalysis of the European Centre for Medium-Range Weather Forecasts Reanalysis v5 (ERA5). The thunderstorm developed in a region of low-pressure due to the presence of a near-surface inverted trough and moisture convergence, which favored convection. Convective Available Potential Energy (CAPE) of 1053.6 J kg−1 at the start of the thunderstorm indicated that strong convective energy was present. Microphysical variables such as Vertically Integrated Liquid water content (VIL) and Vertically Integrated Ice (VII) showed peaks of 140 and 130 kg m−2, respectively, before the hail reached the surface, followed by a decrease, indicating content removal from within the clouds to the ground surface. The thunderstorm charge structure evolved from a dipolar structure (with a negative center between 4 and 6 km and a positive center between 8 and 10 km) to a tripolar structure (negative center between 6 and 7.5 km) in the most intense phase. The first lightning peak (100 flashes in 5 min−1) before the hail showed that there had been a lightning jump. The maximum lightning occurred around 18:17 UTC, with approximately 350 flashes 5 min−1 with values higher than 4000 sources 500 m−1 in 5 min−1. Likewise, the vertical cross-sections indicated that the lightning occurred ahead of the thunderstorm’s displacement (maximum reflectivity), which could be useful in predicting these events.

1. Introduction

Severe thunderstorms are characterized by Cumulonimbus (Cb) cloud clusters that produce intense rates of precipitation, lightning, hail with diameters greater than 2 cm, intense winds with speeds greater than 26 m s−1, and sometimes tornadoes [1,2]. These thunderstorms can cause environmental and socio-economic damage, which in 2020 were responsible for losses of about $210 billion and 8200 deaths worldwide [3]. In Brazil, thunderstorm-related problems result in damage, especially in large cities. For instance, between 2000 and 2019, disturbances like flooding, roof damage, car damage, disruption of traffic routes, and destruction caused by falling trees added up to more than R$331.2 billion in losses and 12,600 human lives lost [4]. It is expected that these events will become more recurrent and disastrous with climate change, especially in large urban centers, like the Metropolitan Area of São Paulo (MASP) [5].
Hail can cause damage to society, such as damaging crops and thus affecting food production and biodiversity. In addition to causing destruction to property, including businesses and homes, and damages in electricity transmission networks [6,7,8,9]. Hail precipitation is characterized by irregularly shaped falling ice pellets during convective thunderstorms [10]. Hail formation occurs due to interactions between updrafts in convective clouds and supercooled liquid water [11].
The challenge is identifying thunderstorms that could potentially generate hail to reduce damage since these are usually short-lived local events. Furthermore, the absence of an integrated historical database of hail events and surface instruments capable of detecting hail, such as hail pads, in Brazil, makes predicting these events difficult. In this context, weather radar systems are important tools for estimating and tracking thunderstorms that could produce hail [12,13,14,15,16]. Radar can indicate the morphological characteristics of hydrometeors, such as size, shape, quantity, type (ice/water), orientation, and mixture degree, which can be used for generating relevant information that can be considered as parameters for decision-making and alerts (e.g., tracking the evolution of the storm’s life cycle and the possible areas to be reached).
Through radar observations and other thunderstorm identification systems, it has been shown that potentially severe thunderstorms with hail occur primarily in convective systems, multicellular, or supercell thunderclouds [8,17,18,19,20,21,22,23,24,25].
The southern and southeastern regions of South America experience the most intense hailstorms in the world [13,26,27]. Martins et al. [8] analyzed 22 years of hail-to-ground observations provided by the Brazilian Civil Defense and from satellite data. The authors observed a maximum occurrence of surface hail over southern Brazil during the spring. The most destructive events took place in September and October, during the transition between winter and spring in the Southern Hemisphere. Sperling [28], using information from satellites and numerical models, found that prefrontal conditions and northwest-southeast low-level flows promote warm and humid air entry into the region, favoring storm formation.
More recently, Hahn [27] used radar data to study hailstorms in the State of Rio Grande do Sul (southern Brazil) and identified that most events occurred during the southern spring, predominantly between 23 and 02 UTC. The study also indicated that these storms were associated with high values of Convective Available Potential Energy (CAPE) (>1400 J kg−1) and vertical wind shear (>20 m s−1). The radar information showed that the Vertically Integrated Liquid water content (VIL), Vertically Integrated Ice content (VII), and Severe Hail Index (SHII) parameters are good indicators of hail occurrence, which could be used as diagnostic tools.
De Abreu et al. [29] evaluated nine storms in the southeastern region of Brazil that produced hail. The authors observed a correlation between the Waldvogel Height parameter (WH, above 1.4 km) and the probability of hail, with a maximum 20 min before hail falling to the surface. The electrical activity showed maximum intra-cloud lightning (IC) and cloud-to-ground lightning (CG), with a peak close to the time of hail. Lopes [30], using data from hail pads, weather radar, and lightning sensors, documented that strong updrafts and hail in an extensive layer inside the cloud contributed to hail formation and growth, leading to destructive events in Campinas City, São Paulo state. Medina and Machado [14] used X-Band polarimetric radar to monitor hailstorms during the CHUVA-Vale Project in the MASP. A Lagrangian short-term prediction model was developed applying a total of 13 parameters, such as negative differential reflectivity (ZDR) and specific differential phase (KDP), low correlation coefficients (<0.9), and high reflectivity values (ZH > 35 dBZ).
A striking feature of these studies was the rapid increase in the amount of lightning before severe hailstorms (Lightning Jump—LJ, [31,32,33,34]). The LJ is triggered by large ice particles and raindrop interactions inside storms on the verge of precipitation [35]. Bechis et al. [36] used radar and remote sensing information to evaluate pre-convective storm behavior in Mendoza (Argentina) during the RELAMPAGO-CACTI field campaign. A supercell storm transition was identified, preceded by a significant increase in lightning rates (6 lightning per minute) and an increase in the probability of overshooting tops (above 75%). These results can be useful in predicting hail events, as severe hail of up to 4.5 cm in diameter was observed during this event (data from hail pads and ground measurements). In this context, the Lightning Mapping Array (LMA) network offered important ways of determining lightning occurrences and characteristics in three dimensions (3D). LMA networks detect radiation emitted by lightning sources in Very High Frequency (VHF) (30–300 MHz) and are essential for determining lightning frequency accurately, as well as determining the electrical charge structures of storms [37]. Several studies using LMA networks have shown that the electrical properties of lightning are related to the microphysics of clouds [38,39,40,41,42].
Metzger and Nutts [43] used lightning and radar information to divide thunderstorms into three categories: (i) strong wind, (ii) hail, and (iii) mixed combination. It was found that the ratio of CG:IC lightning changed in 25 of 34 LJ in hailstorms and in 18 of 20 LJ in storms with strong winds. For hailstorms, IC lightning rates increased, while CG lightning rates remained stable or decreased. On the other hand, storms with strong winds, an increase in CG lightning rates was observed, while IC lightning rates increased in 12 of the 18 cases analyzed or remained constant or decreased in 6 of the 18 cases. It is important to note that not all LJ resulted in severe weather reports; however, the characteristic behavior observed in lightning rates provides additional information to improve radar-based approaches to forecasting severe weather events.
The study conducted by Emersic et al. [44] investigated the relationship between lightning activity and dynamic kinematics in an intense storm that produced hail on 15 August 2006, using an LMA network in the state of Oklahoma. The research aimed to analyze the vertical charge structure present in the storm and identify its initial characteristics. It was observed that the aforementioned structure initially manifested as a positive tripole, characterized by the presence of a mid-level negative charge positioned between positive charges located above and below.
Preliminary works using LMA data in Brazil (i.e., Albrecht et al. [34]; Machado et al. [45]; Mattos et al. [46,47]) demonstrated that 3D lightning data can be useful for characterizing the electrical structure of thunderstorms and for understanding severe weather phenomena over the different regions of Brazil. However, there is still a lack of studies in Brazil using two- and three-dimensional lightning data, combined with several other meteorological dataset for understanding the properties of the hailstorms and characteristics of the formation environment. In this respect, this study provides an innovative analysis of the vertical structure of a thunderstorm that produced hail and lightning, using for the first time a large database of meteorological measurements in Brazil.
This study seeks to analyze the synoptic environmental pattern and to characterize the observed signatures of a thunderstorm that produced hail in the MASP on 7 January 2012. For this purpose, S-Band radar information, data for two-dimensional and three-dimensional lightning, as well as satellite data, reanalysis produced by ECMWF (ERA5 dataset), and thermodynamic profile information on the day of the event were used. The main motivation for this work is the lack of comprehensive analyses of thunderstorms that produce hail in the MASP using different types of data.
This paper is organized as follows. Section 2 describes the data used in this work, the CHUVA-Vale field campaign, and the model, satellites, and methodology used here. Section 3 presents the results for the event descriptions, the synoptic characteristics, and the thunderstorm life cycle. Finally, the conclusions are presented in Section 4.

2. Materials and Methods

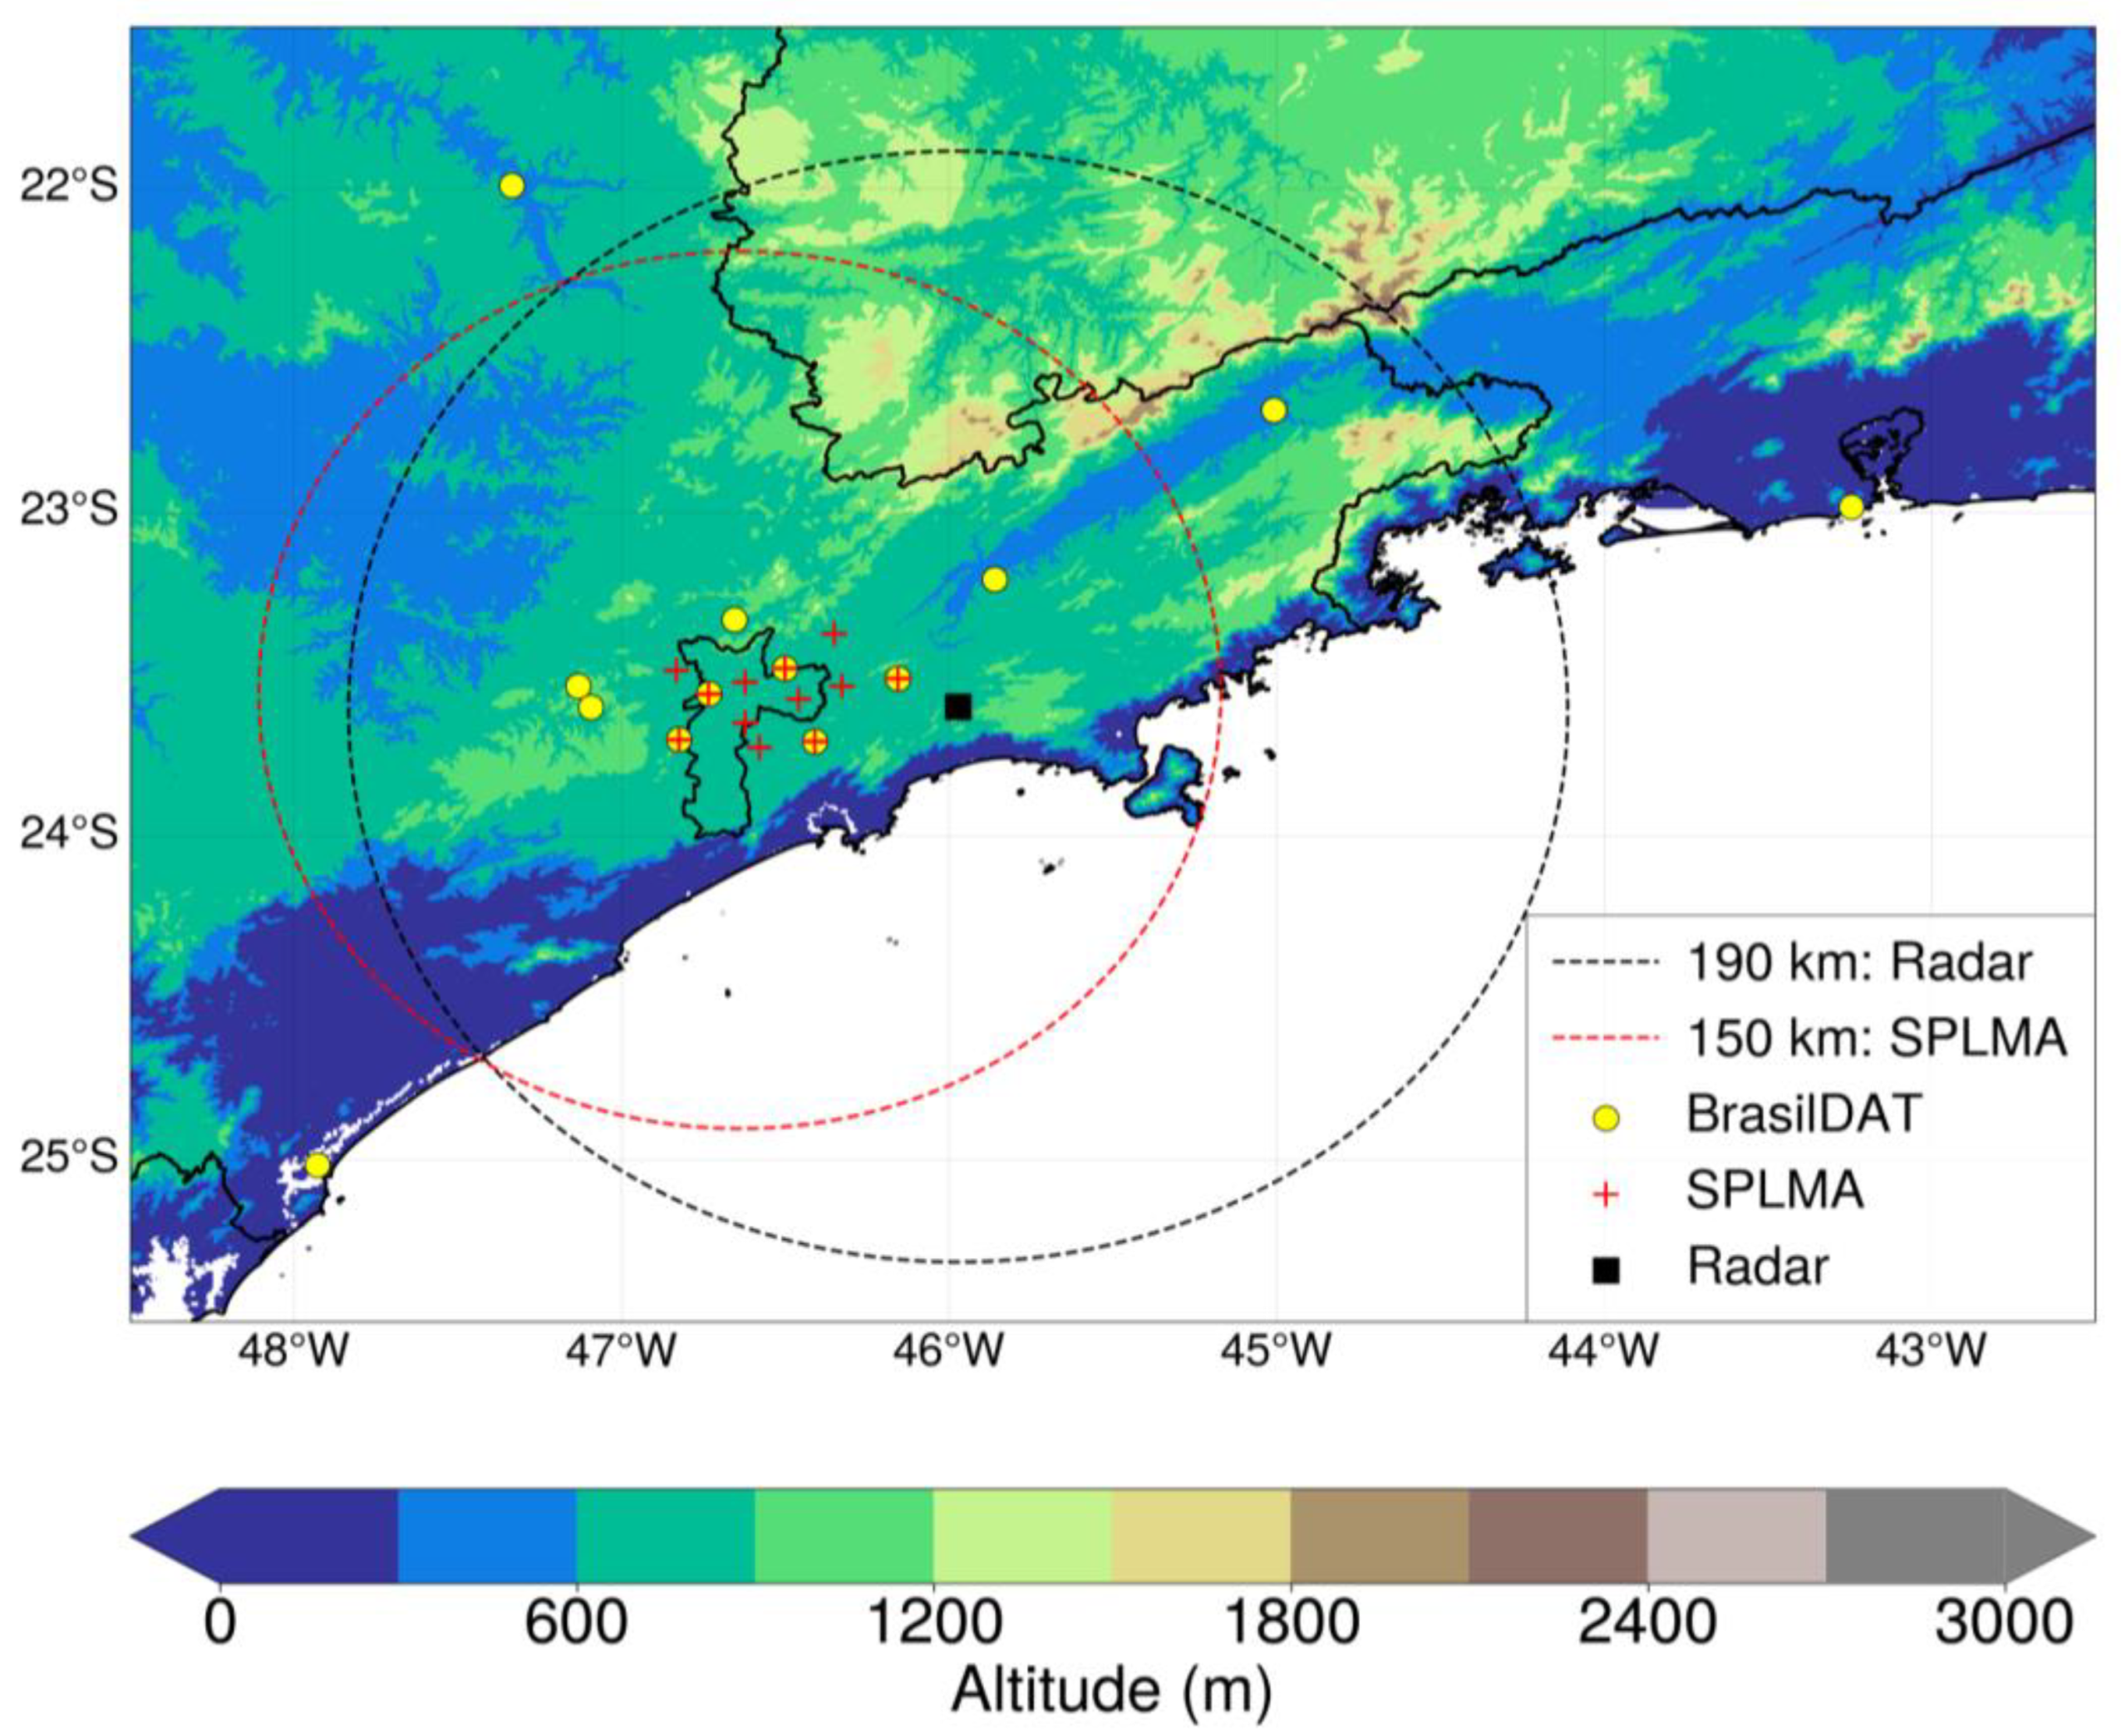
2.1. CHUVA-Vale Field Campaign

The CHUVA-Vale campaign was the fourth experiment of the CHUVA project (Cloud Processes of the Main Precipitation Systems in Brazil: A Contribution to Cloud Resolving Modeling and to the Global Precipitation Measurement) [45]. CHUVA project consisted of six field campaigns carried out in various regions (Alcântara, Fortaleza, Belém, Vale do Paraíba, Santa Maria and Manaus) of Brazil from 2010 to 2014, with the aim of describing and understanding the atmospheric processes that result in the formation of precipitation in the country’s main precipitation regimes. Several instruments were available during the project: weather radar, lightning network, disdrometer, microwave radiometer, rain gauge, vertical-pointing radar, Lidar, GPS and surface tower. The data generated is freely accessible and can be obtained from the official CHUVA project website (http://chuvaproject.cptec.inpe.br, accessed on 11 January 2023).
In particular, the CHUVA-Vale campaign aimed to understand storm evolution and lightning occurrence. The campaign took place between November 2011 and March 2012, covering the MASP and neighboring cities (Figure 1). The MASP is located in the Southeastern portion of Brazil and is an important population, economic, and distribution center for the country. The study area is situated in a valley between the Serra da Mantiqueira and the Serra do Mar, approximately 100 km from the Atlantic Ocean. As indicated by Albrecht et al. [34], this region is prone to high electrical storm activity, with an average annual flash rate density of over 30 flashes per km2 per year, especially due to afternoon storms in the summer months (December to February).
The MASP has around 22.04 million people and is responsible for about 12% of the national Gross Domestic Product (GDP) [5]. The MASP has an average annual precipitation of 1412.3 mm and average temperatures of 16.3 °C [48]. These values are consistent with the climatic characterization of a Wet Subtropical Altitude (Cwb), Wet Subtropical Climate (Cfa), and Subtropical Climate (Cwa), according to the Köppen-Geiger classification [49]. The region experiences warm and rainy summers, and cold dry winters. These characteristics arise from transient event occurrences during dry periods, where precipitation occurs mainly due to cold front incursions [50]. In the rainy season, however, precipitation is predominantly characterized by the South Atlantic Convergence Zone (SACZ), squall-lines, sea breezes, front incursions, MCS, and the South American monsoon system (SAMS, [51,52]).
This study used data from (i) S-Band Radar from the Hydraulic Technological Center Foundation (FCTH, Portuguese acronym) (data available at: (http://ftp.cptec.inpe.br/chuva/glm_vale_paraiba/experimental/level_2/eq_radar/esp_banda_s/st_cth, accessed on 11 January 2023); (ii) Return strokes from the Brazilian Atmospheric Discharge Detection Network (BrasilDAT) (data available at: http://ftp.cptec.inpe.br/chuva/glm_vale_paraiba/experimental/level_1/eq_lightning_detector/esp_brasildat/, accessed on 11 January 2023); and (iii) VHF sources from the São Paulo Lightning Mapper Array (SPLMA) (data available at: http://ftp.cptec.inpe.br/chuva/glm_vale_paraiba/experimental/level_2/eq_lightning_detector/esp_splma/, accessed on 11 January 2023). Additionally, data from reanalysis models, satellites, and synoptic data were used, which are accordingly described in the next sections.

2.2. S-Band Weather Radar and Methodology

The FCTH radar is an S-band radar (Wavelength~10 cm), located in the municipality of Salesópolis at coordinates latitude 23°36’0.000″ south, longitude 45°58’20″ west, and altitude 916 m. It has a temporal resolution of 5 min and a range of 190 km. There were 20 Plan Position Indicators (PPI) for each volumetric scan, comprising elevation angles between 1.0° and 30.8°. The radial resolution was 0.5 km (<60 km), 1.0 km (60–120 km), and 2.0 km (>120 km), and the azimuthal resolution was fixed at 1°. Reflectivity was obtained using the Constant Altitude Plan Position Indicator (CAPPI) from an altitude of 3 to 15 km, with both horizontal and vertical spatial resolutions of 1 km. This data was used to identify and monitor the thunderstorm and to determine cloud microphysical parameters. Noise filtering was applied to the radar reflectivity data, since the original data had terrain echoes that could affect the analyses.

2.3. Lightning Observations and Methodology

The BrasilDAT IC and CG return strokes data were used. The BrasilDAT network is an integrated IC and CG lightning detection network that was implemented in Brazil in 2011 by the Atmospheric Electricity Group (ELAT) from the National Institute for Space Research (INPE), developed by Earth Networks [53,54]. During the CHUVA-Vale campaign period, the network had 56 ground sensors operating in the frequency range between 1 Hz and 12 MHz.
Data from VHF lightning sources from SPLMA with a total of 12 sensors (operating on TV channels 8 (180–186 MHz) and 10 (192–198 MHz)) were used for the study region. This network was developed by the New Mexico Institute of Mining and Technology (NMT), with the National Aeronautics and Space Administration (NASA), the University of Alabama at Huntsville (UAH), INPE, and the University of São Paulo (USP). The network was installed in the MASP region and in neighboring cities during the CHUVA-Vale Campaign [45]. By detecting the sources of electromagnetic radiation emitted by lightning at frequencies between 30–300 MHz, the network can identify the main lightning channel propagations in three dimensions up to 150 km away [37,55]. Data from VHF sources refer to processing level 2, which consists of sources grouped into flashes with noise filtering [56,57]. To minimize noise effects and lightning misclassification, only SPLMA lightning with more than 10 sources were used [57,58,59,60].

2.4. Synoptic Analysis

The synoptic environment that leads the storm formation was analyzed using synoptic charts at the surface, mid-level (500 hPa), and upper-level (250 hPa) provided by the Center for Weather Forecasting and Climate Studies (CPTEC) (http://img0.cptec.inpe.br/~rgptimg/Produtos-Pagina/Carta-Sinotica/Analise/, accessed on 11 January 2023). Data from the European Centre for Medium-Range Weather Forecasts (ECMWF)—ERA5 reanalysis ([61,62], https://cds.climate.copernicus.eu/cdsapp#!/dataset/reanalysis-era5-land?tab=form, accessed on 11 January 2023) were used. The ERA-5 database used consists of hourly data for the zonal and meridional wind components (m s−1), vertical wind speed (Pa s−1), geopotential (m2 s−2), Convective Available Potential Energy (CAPE) (J kg−1), relative humidity (%), and mean sea-level pressure (Pa) from 12 to 18 UTC.
The analyzed atmospheric fields are: (a) integrated column moisture flux convergence between 1000 and 100 hPa to indicate regions of moisture convergence and divergence; (b) vertical wind shear between 500 and 1000 hPa, and mass divergence and geopotential height at 250 hPa to show troughs and regions with potential to upward motion in the atmosphere; (c) vertical velocity at 500 hPa, relative humidity between 850 and 500 hPa, and geopotential height at 500 hPa, indicating upward motion and moisture concentration; (d) vertical wind shear between 500 and 1000 hPa and CAPE, indicating the potential for storm occurrence.

2.5. Identifying and Analyzing Thunderstorms

Storms were identified and monitored using the Eulerian method, which involves fixing the storm observation at the MASP (Figure 1). The following parameters were determined for each stage of the life cycle: (i) graupel mass at the −10 °C isotherm [63]; (ii) ice crystal mass above −40 °C [64]; (iii) 20 dBZ EchoTop; (iv) Waldvogel height [65]: A parameter that uses the height (in km) of the 45 dBZ radar echo level above the 0 °C layer, serving as an indication for the presence of hail within the cloud (WH = Height (45 dBZ)—Height (0 °C)); (v) Vertically Integrated Liquid (VIL) [66]; and (vi) VII, between −10 °C and −40 °C [63,67]. For storm identification, brightness temperature (BT) data (in °C) from the infrared (IR) channel (10.7 µm) of the Meteosat Second Generation (MSG) satellite were also used.
Lightning data from BrasilDAT (return stroke) and SPLMA (flashes) were accumulated over a 5-min time interval (the same temporal resolution as the weather radar) and on the same regular Cartesian grid of reflectivity from the CAPPI. This allowed for synchronizing the radar data with information from both networks, facilitating the temporal monitoring of storm electrical activity with precipitation physical characteristics. In the analysis of the vertical distribution of sources, preferred lightning formation regions from SPLMA were determined for each stage of the storm’s life cycle. This step identifies the initiation of lightning as the average location calculated considering 10% of all first lightning sources.
For the storm life cycle analysis, three distinct moments were adopted: (i) moment before hail time on the ground: this corresponds to the last radar scan before reports of hail on the ground at 17:37 UTC; three hail moments: (ii) correspond to the start (Hail 1: 17:42 UTC), (iii) intermediate (Hail 2: 17:52 UTC), and (iv) end (Hail 3: 18:02 UTC) times of hailfall in the radar scans, and (v) moment after hailfall: the first radar scan after the hail interval at 18:07 UTC. These distinct moments will be used to compare reflectivity fields, radar subproducts, and the storm’s electrical behavior to understand the physical mechanisms involved. In the figures that contain the hail stages, the hail moment information is shown through vertical lines: pre-hail moments (gray dashed line), first (red solid line), second (red dotted line), and third (red dashed line and dotted line) hail moments, and the post-hail moment (black dashed line). A summary of the methodology is presented in the Supplementary Material.

3. Results

3.1. Event Description

Several significantly important events that characterized the thunderstorm were recorded from local media reports of heavy rain at 17:15 UTC (15:15 local time) in MASP. As a result, according to the Emergency Management Center (EMC) in São Paulo, the southern, southeastern, and western zones, and Marginal Pinheiros were all placed on alert at 17:30 UTC (15:30 local time). At approximately 17:45 UTC (15:45 local time), the northern zone, the central zone, and Marginal Tietê were also placed on alert.
The thunderstorm produced daily accumulated rainfall of 50.6 mm at Guarulhos airport, where rain was accompanied by lightning, thunderstorms, and wind gusts. At 18:00 UTC (16:00 local time), wind gusts reached 47 km h−1, causing trees to fall. The hailstorm occurred between 17:42 and 18:02 UTC (15:42 and 16:02 local time), with estimated hail diameters of approximately 3 cm (Figure 2) [15]. Simultaneously, a 9 °C drop in temperature occurred in some neighborhoods in the northern zone, southern zone, and in the eastern zone, like Mooca, Penha, Tucuruvi, and in the northern MASP zone [68].

3.2. Synoptic Environment

On a synoptic scale, the fields that characterized the thunderstorm on 7 January 2012, are shown in Figure 3. At 18:00 UTC (Figure 3a), a Moisture Convergence Zone (MCZ) (in light blue), which is a band of clouds generally oriented towards the northwestern-southeastern direction (as shown in the satellite image, Figure 3b). The MCZ is intense and typically lasts for three days [69]. Furthermore, one can see an inverted trough on the surface, located in the center of the São Paulo region. Figure 3b shows the brightness temperature (BT, 10.7 µm, in °C), corresponding to the GOES-13 satellite infrared channel, indicating the presence of clouds associated with the MCZ. The cloud band presented convective cells with BT of about −50 °C. This low temperature is commonly found in systems that may have severe weather characteristics, such as strong wind gusts, intense precipitation, and hail [70].
In the 250 hPa (Figure 3c), the atmospheric flow of high levels at 18:00 UTC is characterized by an anticyclone in the central-west region of South America, corresponding to the Bolivian High, and a trough in the northeastern region of Brazil, which supports the surface MCZ system [71,72]. There was also a low amplitude upper-level trough above the São Paulo and southern Minas Gerais state, where the eastern sector of this system is favorable to mass divergence, inducing upward movement and, consequently, surface convergence [73]. A trough over southeastern Brazil is also configured at 500 hPa (Figure 3d).
Analyzing the spatial pattern of CAPE with vertical wind shear (Figure 4), it is possible to observe values above 2000 J kg−1 with vertical wind shear of 10 m s−1 during the periods from 15:00 to 16:00 UTC (Figure 4a,b), indicating favorable conditions for storm formation. Studies such as Joe et al. [74] have indicated that storms with pulse severity may develop when CAPE > 1000 and vertical wind shear > 10 m s−1. At 17:00 and 18:00 UTC (Figure 4c,d), a decrease in CAPE below 1800 J kg−1 is observed, indicating that the storm has moved away from the study region and the energy for convection has dissipated.
In the case in study, there was moisture transport from the Amazon to the southeastern region of Brazil, as well as from the tropical Atlantic through the westward winds of the South Atlantic Subtropical Anticyclone, as shown by the trajectory of the vectors in Figure 5. This characteristic indicated surface wind convergence and moisture availability for storm formation.
Upper-level mass divergence since 15:00 UTC is another field that shows favorable conditions for storm formation on the event day (Figure 6). There is also a trough at 250 hPa over the study region and moderate [74] wind shear (red colors: ~15 m s−1). Similarly, Figure 7 shows that upward motions in the atmosphere (omega less than −0.2 Pa s−1) were present in the southeastern region of Brazil, including the MASP (Metropolitan Area of São Paulo). Furthermore, the available moisture exceeded 80% in the MASP, thus indicating favorable conditions for the storms that occurred on the given day. Therefore, it can be seen that the storm was triggered by channeling moisture into the study region, added to the available heat that generated strong upward movements in the atmosphere.
Reanalysis data from the ERA5 at 17:00 UTC were used to evaluate the physical aspects of the atmosphere relative to the dynamic and thermodynamic aspects. Figure 8 shows the Skew-T and Log-P thermodynamic diagrams for the MASP location, with information on the vertical pressure, temperature, humidity, wind direction, and speed variations. The diagram shows surface CAPE values of 1053.6 J kg−1, values above 1200 J kg−1 in the mixed layer, and greater than 1500 J kg−1 for the most unstable layer, representing instability. K index (39 °C) values indicate available moisture and heat on the surface, and the Severe Weather Threat (SWEAT) index, which assesses the potential for severe weather, indicated moderate severity, while the total index TT at 53 °C indicated atmospheric conditions favorable to storm formation. Regarding the Showalter Index (SHW), the atmosphere showed very unstable conditions for storm formation. Furthermore, the air temperature lines (black line in °C), and dew point temperatures (blue line in °C), showed similar values from the surface to 600 mb, indicating a very humid atmosphere [75]. This behavior added to a dry middle troposphere are conditions for the development of thunderstorms.
The thunderstorm instability relative to the vertical wind shear was also analyzed (Diagram CAPE vs. Vertical Wind Shear, Figure 9). In the diagram, it is observed that the wind shear remained between 10 and 15 m s−1, and maximum CAPE values were between 2000 and 3000 J kg−1. During the initial phase of the thunderstorm, the CAPE values remained high (above 1500 J kg−1), with shear below 15 m s−1, configuring a favorable environment for localized multicellular storm formation [76].

3.3. Lifecycle Evolution of Radar and Satellite Properties

To analyze the evolution of the cloud-top temperature, the brightness temperature (BT) of the infrared (IR) channel of the MSG satellite was used (Figure 10). At the beginning of the thunderstorm, temperatures close to −25 °C are observed in the southern portion of the MASP between 15:00 and 15:45 UTC (Figure 10a–d). At times close to the hailstorm, between 17:30 and 18:30 UTC (Figure 10j–l), the BT reached values close to −60 °C in the northeast region of MASP and neighboring cities. In Figure 10k,l, a cold core (red tones, approximately −60 °C) can be observed, which can be related to hail and intense precipitation, as also evidenced in the radar reflectivity images (Figure 11j–p). Thunderstorm propagation after 18:30 UTC was irrelevant, as the thunderstorm was outside the study region. However, it should be noted that the storm continued to develop vertically.
Thunderstorm monitoring based on radar images is shown in Figure 11 (reflectivity evolution at 3 km height). The gray rectangle represents the northernmost region of the MASP, with the radar information for further analysis of the microphysical parameters applied to the Eulerian detection method [77,78,79]. The thunderstorm started at the southern end of MASP, with reflectivity around 45 dBZ, without registering any electrical activity (at 14:52 UTC, Figure 12a), reaching higher reflectivity (above 60 dBZ) and lightning values (244 of BrasilDAT lightning and 265 of SPLMA strokes) near 17:42 UTC (Figure 12j, time of hail) in the northern region of MASP. From 18:32 UTC (Figure 11p), the thunderstorm began to move out of the study region, but still showed high reflectivity (values above 60 dBZ).

3.4. Lifecycle Evolution of Lightning and Radar Signatures

For each radar temporal interval, lightning data from the two networks were accumulated (every 5 min) and plotted (blue crosses for BrasilDAT and black circles for the SPLMA network). Thus, Figure 12 shows the monitoring of the thunderstorm based on lightning data from the BrasilDAT and SPLMA networks. At the beginning of the thunderstorm, lightning from both networks is observed in the south of the MASP (Figure 12c at 15:27 UTC, with 39 lightning from SPLMA and 133 from BrasilDAT). The evolution and increase in lightning can be observed until the moment of hail, which recorded values of 399 from BrasilDAT and 373 from SPLMA lightning (at 18:02 UTC, Figure 12n). The increase in lightning near the hail moment is because, at this moment of the storm, the updrafts are more intense, promoting the collision of hydrometeors and inducing the charging and separation of charges within the storm clouds [80,81,82].
Figure 13 shows that during the initial phases of the thunderstorm, reflectivity was between 30 and 40 dBZ below the isotherm at −10 °C (approximately 6 km). From 16:12 UTC, it is observed that reflectivity is above 50 dBZ between −10 and −40 °C, indicating that the thunderstorm had the potential for severe weather right from the beginning. From 17:37 UTC, between the surface and the −40 °C level, there is reflectivity above 60 dBZ. These high reflectivity values suggest the existence of large droplets within the cloud and/or the presence of hail inside the cloud, with the potential for severe events such as heavy rain and lightning [59,83,84,85].
Furthermore, the reflectivity above 45 dBZ exceeds the −40 °C level close to 17:37 UTC. At that time, the thunderstorm reached altitudes above 10 km, showing strong vertical development. It is possible to infer that most hydrometeors in the cloud were frozen, as either soft hail or ice crystals. Maximum reflectivity was close to 70 dBZ at 18:17 UTC, indicating a core containing hail and/or large droplets.
Comparing the moments related to hail, it is possible to verify that the height of reflectivity exceeding 60 dBZ remained below the −10 °C isotherm. From the first moment of hail, this reflectivity exceeds the −10 °C level, reaching a height of approximately 8 km at the second moment of hail. After this moment, the maximum reflectivity continued to increase due to the continued passage of the storm. In this context, Figure 14 shows the temporal evolution of lightning from the SPLMA network. The lightning (Figure 14a, black curve) showed a rapid increase following the thunderstorm development. Three distinct lightning rate peaks were observed: the first with values above 100 flashes per 5 min (16:57 UTC), and the other two at approximately 250 (17:17 UTC) and 330 flashes per 5 min (17:57 UTC), close to when hail was reported on the ground (region with blue hatch). It can be noticed that the recorded lightning rate peak at 16:57 UTC occurred approximately 30 min before the hail, despite the existence of two other more pronounced peaks at the time of the hail. This mainly occurs due to the intensification of updrafts within the clouds moments before hail, promoting a greater collision of hydrometeors and, consequently, an increased occurrence of lightning [80,86]. The increase in lightning rates before the hail event has been described in the literature as the Lightning Jump [31,32,33], thus serving as a promising tool for severe event forecasting. After the hail, lightning rates decrease again over the region. The behavior of the sources (gray curve) followed the same lightning pattern, with maximum sources during the hail, at approximately 3700 sources per 5 min, showing heavy lightning.
The duration and length (blue and orange curves, respectively) of lightning showed some peaks before the hail (approximately 0.4 and 0.5 s and 5 and 10 km, respectively), but with increased lightning rates during the hailstorm, these properties remained below 0.3 s and 5 km, respectively. After the hail, the duration and length increase again, reaching maximum values at 0.6 s and 20 km, respectively. It can be seen an almost inverse pattern between the lightning rate and its properties (duration and length), as previously documented by Zhang et al. [40] and Mecikalski et al. [39]. This pattern occurs due to charges within the clouds and the relationship between updrafts and the centers of electrical charges.
Figure 14b shows the temporal evolution of the microphysical properties of the studied thunderstorm. The graupel mass at −10 °C and ice crystal mass (both in kg m−2) (Figure 14b) indicate that these variables increased with smaller peaks around 17:17 UTC (0.02 and 0.015 kg m−2, respectively). Maximum values occurred before the hail, around 17:37 UTC (0.06 and 0.02 kg m−2, respectively), and decreased after hail was first recorded. This indicates that the thunderstorm ice content at the time of the hail evolved by removing glacial hydrometeors from the cloud to the ground [28].
Furthermore, there is a positive correlation between the graupel mass and the lightning rate close to the moment of the hail, suggesting a strong influence of ice particles on lightning rates [63]. Hail generates higher lightning rates due to a loading process during the hydrometeor descent [83,87]. The behavior patterns of the VIL and VII follow the same identified patterns for the soft hail and ice crystal masses (Figure 14b). Maximum values at approximately 140 and 130 kg m−2 occurred at the time of the hail, respectively. There was a second higher microphysical variable peak around 18:17 UTC. These peaks, and the subsequent variable decays, however, indicate that there was more hail on the ground, but could not obtain further records of these occurrences.
The maximum reflectivity, the Waldvogel Height, and the EchoTop in 20 dBZ showed similar behavior for the properties in Figure 14c, i.e., the highest values were found at the most intense moment of the thunderstorm (moment of hail—blue, orange, and gray hatch). Maximum reflectivity (exceeded 70 dBZ), and the Waldvogel height (greater than 9 km) were observed. The EchoTop at 20 dBZ showed variations during the thunderstorm’s life cycle, oscillating between 12 and 15 km, maintaining a maximum 15 km during the hailstorm period.
Figure 15 shows the vertical distribution of VHF sources for all flash sources (Figure 15a) and 10% first flash sources (that represents the initiation point of flash, which it is calculated determining the mean location of 10% of first sources from flash, Figure 15b). Before 17:37 UTC, the sources showed an isolated peak around 8–11 km. After that, close to the hail (between 17:37 and 18:02 UTC), most sources occurred at 8 to 10 km (−30 and −40 °C isotherms), with the second region of maximum sources around 5–6 km (around 16:30 UTC), indicating two positive charge centers. As shown in other studies, this result suggests a tripolar charge structure in the cloud [38,86,88]. The lightning behavior (solid black lines) indicates that, during the first peak (approximately 260 flashes per 5 min), at 17:37 UTC, there was a maximum VHF source at −10 °C (3000 sources per 500 m−1 per 5 min), contrasting with the second peak (approximately 350 flashes per 5 min), at 18:17 UTC, where the highest concentrations of charges occurred around −40 °C (above 4000 sources per 500 m−1 per 5 min). This configuration was observed by Williams [86] and Carey et al. [89], showing the tripolar configuration of electrical charges at this stage.
The temporal evolution of the height of the 10% first VHF sources (Figure 15b) indicates that lightning initiation occurs predominantly in a range between 7.5 and 10 km for the onset of the thunderstorm (between 16:32 and 17:17 UTC with 200 sources per 500 m−1 per 5 min). During the hail, two regions with the highest source concentrations were observed, one close to 5 km (about 400 sources per 500 m−1 per 5 min), and one with more sources between 7.5 and 10 km (values above 500 sources per 500 m−1 per 5 min). This region between 7.5 and 10 km is described as the mixed phase of the thunderstorm (between −10 and −40 °C), has soft hail and large droplets, and it is more susceptible to hydrometeor collision, making it more electrically charged [90,91]. The configuration for the 10% first sources shows a region of lightning initiation within the center of negative charges (between 6 and 7.5 km), which is preferentially directed towards the region of positive charges above between 7.5 and 10 km, confirming that most lightning in the thunderstorm was IC.
To better understand the spatial structure of the VHF sources of lightning detected by the SPLMA network, the moments before hail (Figure 16), moments 1, 2, and 3 during hail (Figure 17, Figure 18 and Figure 19), and after hail (Figure 20) were chosen. At the moment before hail, a peak of sources (approximately, 3500 sources) can be observed near 5 km (Figure 16). Figure 17 shows that during the first moment of hail, there is a configuration of two peaks in the number of sources, one at 5 km and another at 10 km. In the intermediate moment of hail, it can be observed that the largest number of sources migrates from 5 km to 10 km, and this configuration prevails until the post-hail moment. This configuration represents a tripolar structure, where the peaks of the VHF sources are the positive charge centers, as described by Lang and Rutledge [58] and Lund et al. [59]. These regions form due to strong convection and the collision of large hydrometeors [92,93].
Figure 21 shows the horizontal 3 km CAPPI reflectivity (first column of Figure 21), along with the latitudinal sections (second column) and longitudinal sections (third column of Figure 21), as well as the atmospheric discharges from the SPLMA network (black circles) and BrasilDAT network (blue crosses) for the moments before hail (first row), during hail (rows 2, 3, and 4), and after hail (row 5), centered on the storm’s highest reflectivity.
At the moment before hail (Figure 21a–c), surface reflectivities above 65 dBZ can be observed in a southern portion of the MASP (Metropolitan Area of São Paulo). It was also observed that the electrical activity of the storm was ahead of the storm (in the northern region of the maximum reflectivity), and in the center of the maximum reflectivity, there was no electrical activity (BrasilDAT and SPLMA lightning). Figure 14c shows lightning starting between 4 and 6 km and between 8 and 10 km. Forty-two flashes from SPLMA and sixty-eight lightning from BrasilDAT were detected further east of the center of highest reflectivity (above 65 dBZ).
At the first moment of the hailstorm, it can be seen that the center of maximum reflectivity above 65 dBZ is more compact in the horizontal field (Figure 21d), with this maximum reflectivity reaching heights above 6 km. From the second moment of hail, the maximum reflectivity shifts to heights below 6 km (vertical sections in Figure 21h,k,n). This is due to the removal of hydrometeors from the cloud to the ground (as seen in behavior of the graupel and ice crystals mass—Figure 14b). The lightning in the SPLMA network is located above and ahead of the maximum reflectivities, reaching a maximum altitude of 12 km. With the vertical section, it is possible to see that the storm was moving northeast, since the locations of the lightning bolts can be seen ahead of the storm. This corroborates the fact that the lightning peaks must have occurred before the hail [33,34].

4. Conclusions

This study analyzed a thunderstorm that produced hail in the MASP region on 7 January 2012, during the CHUVA-Vale study campaign. Several datasets were used: two and three-dimensional lightning networks, weather radar, meteorological satellite and data from the weather numeric model. The thunderstorm had genesis over the southern portion of the MASP around 14:52 UTC and moved to the northeastern portion of the region, causing floods and hailfall, which caused a lot of damages for the population.
The synoptic-scale analysis indicated that the thunderstorm developed embedded in a region of MCZ. Moreover, the presence of a near-surface inverted trough and a trough at mid-upper levels over São Paulo and south of Minas Gerais state were important to organize the upward movement and, consequently, to increase the instability in the region of the storm. Indeed, CAPE high was observed (~2500 J kg−1). Instability indices indicated conditions for severe events in the region, as the synoptic fields showed conditions for convection: high moisture convergence, mass divergence above 0.5 × 10⁻⁵ s−1, and vertical velocity less than −0.2 Pa s−1. This is confirmed by the values indicated in the CAPE × Shear diagram, showing that the wind shear remained between 10 and 15 m s−1, with maximum CAPE values between 2000 and 3000 J kg−1. This configuration confirms a favorable atmosphere for the formation of multicellular storms. In consequence, the thunderstorm caused 50.6 mm of rainfall and wind gusts of up to 47 km h−1.
At the time of the hail, VIL and VII showed a decrease in the liquid water and ice content in the thunderstorm cloud at the time of the hail damage. This displacement of mass, and consequently of electrical charges, made hydrometeor collision possible. During the hailstorm, it was observed microphysical variable peaks, graupel and ice crystal mass (0.06 and 0.02 kg m−2), VIL and VII (140 and 130 kg m−2), the Waldvogel height (values above 8 km), and the EchoTop 20 dBZ (15 km). The maximum reflectivity at the time of hail was close to 70 dBZ. The length and rate of lightning were inversely related. The results also showed positive correlations between graupel mass and CG lightning rates, close to the time of the hail. Furthermore, in the more electrically intense phase of the thunderstorm, the morphological and electrical parameters of the thunderstorm showed a rapid increase in lightning. These results suggest the feasibility of using algorithms to predict the effects of these storms on society, both to avoid the loss of life and material damage.
Comparing the moments of hail, it was possible to verify that the storm changed from a dipolar configuration to a tripolar electric structure, with one positive center close to 7.5–10 km, and a second positive center close to 4–6 km. In contrast, lightning peaked between 7.5 and 10 km, where there were higher concentrations of positive charges. The first 10% of VHF sources show that lightning originated at the center of the negative charges (6 to 7.5 km) and was directed preferentially towards the region with the highest positive charges between 7.5 and 10 km. This confirms that most lightning in a thunderstorm is IC. This structure is seen in the VHF source peaks close to 10 and 5 km at the time of the hail. An evolution pattern for the VHF source structure is seen from the bipolar structure at the beginning of the thunderstorm to the tripolar configuration in the period of greater electrical intensity. At the moment of the hail, the vertical structure of the thunderstorm showed that the lightning was ahead of the convective region (maximum reflectivity), following the thunderstorm’s displacement. This is interesting for predicting these events, i.e., observing the tripolar structure evolution. For nowcasting predictions, the high lightning rates in front of the maximum reflectivity can be used as an indicator for hailstorms.
It is important to emphasize that these results are from a case study conducted in the MASP, an area where storms may behave differently depending on the presence or absence of MCZ. These limitations, combined with data availability during the campaign, make the conclusions somewhat specific to this event. Generalizing these results would require incorporating additional radar information and synoptic conditions from other storm events in the region.
For future studies, it is recommended to conduct thorough analyses focusing on a broader range of thunderstorms. Emphasizing the need for investigating various thunderstorm scenarios is essential to validate the primary features outlined in this study. Furthermore, researchers should use polarimetric radar information, additional lightning networks such as the Lightning Network (LINET), Geostationary Lightning Mapper (GLM), and a more robust storm detection method, like Forecasting and Tracking of Active Cloud Clusters (ForTrACC), for example. All the future information getting in case studies can significantly contribute to improving nowcasting tools. This, in turn, provides valuable and rapid information for alert systems, ultimately benefiting society.

Supplementary Materials

The following supporting information can be downloaded at: https://www.mdpi.com/2073-4433/15/2/182/s1. Figure S1: Summary of the methodology; Table S1: Abbreviation Table.

Author Contributions

Conceptualization, J.G.M.R., E.V.M., M.S.R., I.C.d.C. and R.A.J.O.; methodology, J.G.M.R., E.V.M., I.C.d.C., D.P.E. and R.A.J.O.; analysis, J.G.M.R., E.V.M., M.S.R., I.C.d.C. and R.I.A.; writing—original draft preparation, J.G.M.R., E.V.M., M.S.R. and W.A.G.; and writing—review and editing, E.V.M., M.S.R., I.C.d.C., R.I.A., W.A.G. and R.A.J.O. All authors have read and agreed to the published version of the manuscript.

Funding

This research was funded by National Council for Scientific and Technological Development (CNPq) (grant 427673/2018-6 and 402506/2023-5), Coordination for the Improvement of Higher Level Personnel (CAPES) (grant 001), Research Supporting Foundation of Minas Gerais State (FAPEMIG) (without number), and The CHUVA Project was supported by São Paulo State Research Foundation (FAPESP) (grant 2009/15235-8). The APC was funded by MDPI through a grant to M.S.R.

Data Availability Statement

The CHUVA-Vale dataset is available at: http://ftp.cptec.inpe.br/chuva/glm_vale_paraiba/ (accessed on 11 January 2023), and the Data from the European Centre for Medium-Range Weather Forecasts (ECMWF)—ERA5 reanalysis is available at https://cds.climate.copernicus.eu/cdsapp#!/dataset/reanalysis-era5-land?tab=form (accessed on 11 January 2023).

Acknowledgments

We would like to thank the CHUVA Project, for providing the radar and lightning dataset; the Center for Weather Forecasting and Climate Studies (CPTEC) at the National Institute for Space Research (INPE) for providing the synoptic and satellite data, and the European Center for Medium-Range Weather Forecasts (ECMWF), for providing data from the ERA5 reanalysis. We also thank Thiago Biscaro for reprocessing the radar data.

Conflicts of Interest

The authors declare no conflict of interest.

References

  1. Johns, R.H.; Doswell, C.A. Severe local storms forecasting. Weather Forecast. 1992, 7, 588–612. [Google Scholar] [CrossRef]
  2. Moller, A.R. Severe local storms forecasting. In Severe Convective Storms; Doswell, C.A., III, Eds.; American Meteorological Society, Monograph: Boston, MA, USA, 2001; Volume 28, pp. 433–480. [Google Scholar]
  3. Re, M. Münchener Rückversicherungs-Gesellschaft, Geo Risks Research. NatCatSERVICE. Record Hurricane Season and Major Wildfires—The Natural Disaster Figures for 2020. 2013. Available online: https://www.munichre.com/en/company/media-relations/media-information-and-corporate-news/media-information/2021/2020-natural-disasters-balance.html (accessed on 14 March 2021).
  4. CEPED. Atlas Brasileiro de Desastres Naturais Online. 2020. Available online: https://s2id.mi.gov.br/paginas/atlas/ (accessed on 21 April 2020).
  5. Marengo, J.A.; Alves, L.M.; Ambrizzi, T.; Young, A.; Barreto, N.J.C.; Ramos, A.M. Trends in extreme rainfall and hydrogeometeorological disasters in the Metropolitan Area of São Paulo: A review. Ann. N. Y. Acad. Sci. 2020, 1472, 5–20. [Google Scholar] [CrossRef] [PubMed]
  6. Silva, G.M.F.; Caramori, P.H.; Ricce, W.S. O Jornal Como Fonte de Informação Sobre Precipitações de Granizo no Estado do Paraná. Rev. GeoNorte 2012, 1, 1079–1090. Available online: https://www.periodicos.ufam.edu.br/index.php/revista-geonorte/article/view/2465 (accessed on 12 January 2023).
  7. Mohr, S.; Kunz, M.; Keuler, K. Development and application of a logistic model to estimate the past and future hail potential in Germany. J. Geophys. Res. Atmos. 2015, 120, 3939–3956. [Google Scholar] [CrossRef]
  8. Martins, J.A.; Brand, V.S.; Capucim, M.N.; Felix, R.R.; Martins, L.D.; Freitas, E.D.; Gonçalves, F.L.T.; Hallak, R.; Silva, M.A.F.D.; Cecil, D.J. Climatology of destructive hailstorms in Brazil. Atmos. Res. 2017, 184, 126–138. [Google Scholar] [CrossRef]
  9. Prein, A.F.; Holland, G.J. Global estimates of damaging hail hazard. Weather Clim. Extrem. 2018, 22, 10–23. [Google Scholar] [CrossRef]
  10. Martinez, J.F. Compositional heterogeneity of hailstones: Atmospheric conditions and possible environmental implications. Ambio 2001, 30, 452–454. [Google Scholar] [CrossRef]
  11. Houze, R.A. Cloud Dynamics; International Geophysics Series; Academic Press: San Diego, CA, USA, 2014; Volume 104. [Google Scholar]
  12. Rinehart, R.E. Radar for Meteorologists; Rinehart Publications: Grand Forks, ND, USA, 2004. [Google Scholar]
  13. Cecil, D.J.; Blankenship, C.B. Toward a global climatology of severe hailstorms as estimated by satellite passive microwave imagers. J. Clim. 2012, 25, 687–703. [Google Scholar] [CrossRef]
  14. Medina, B.L.; Machado, L.A.T. Dual Polarization Radar Lagrangian Parameters: A Statistics-Based Probabilistic Nowcasting Model. Nat. Hazards J. Int. Soc. Prev. Mitig. Nat. Hazards 2017, 89, 705–721. [Google Scholar] [CrossRef]
  15. Beltrán, R.P. Características da Precipitação e Atividade Elétrica de Tempestades Severas da Região Metropolitana de São Paulo. Master’s Thesis, Programa de Pós-graduação em Meteorologia, Universidade de São Paulo, São Paulo, Brazil, 2017; p. 113. [Google Scholar]
  16. Bruick, Z.S.; Rasmussen, K.L.; Cecil, D.J. Subtropical South American hailstorm characteristics and environments. Mon. Weather Rev. 2019, 147, 4289–4304. [Google Scholar] [CrossRef]
  17. Niall, S.; Walsh, K. The impact of climate change on hailstorms in southeastern Australia. Int. J. Climatol. A J. R. Meteorol. Soc. 2005, 25, 1933–1952. [Google Scholar] [CrossRef]
  18. Viana, D.R.; Aquino, F.E.; Munõz, V.A. Avaliação de desastres no Rio Grande do Sul associados a complexos convectivos de mesoescala. Rev. Soc. Nat. 2009, 21, 91–105. [Google Scholar] [CrossRef]
  19. Hand, W.H.; Cappelluti, G. A global hail climatology using the UK Met Office convection diagnosis procedure (CDP) and model analyses. Meteorol. Appl. 2011, 18, 446–458. [Google Scholar] [CrossRef]
  20. Dolati, S.H.; Fereidoon, A.; Sabet, A.R. Hail impact damage behaviors of glass fiber reinforced epoxy filled with nanoclay. J. Compos. Mater. 2014, 48, 1241–1249. [Google Scholar] [CrossRef]
  21. Punge, H.J.; Kunz, M. Hail observations and hailstorm characteristics in Europe: A review. Atmos. Res. 2016, 176, 159–184. [Google Scholar] [CrossRef]
  22. Punge, H.J.; Bedka, K.M.; Kunz, M.; Reinbold, A. Hail frequency estimation across Europe based on a combination of overshooting top detections and the ERA INTERIM reanalysis. Atmos. Res. 2017, 198, 34–43. [Google Scholar] [CrossRef]
  23. Capozzi, V.; Picciotti, E.; Mazzarella, V.; Marzano, F.S.; Budillon, G. Fuzzy-logic detection and probability of hail exploiting short-range X band weather radar. Atmos. Res. 2018, 201, 17–33. [Google Scholar] [CrossRef]
  24. Trefalt, S.; Martynov, A.; Barras, H.; Besic, N.; Hering, A.M.; Lenggenhager, S.; Noti, P.; Röthlisberger, M.; Schemm, S.; Germann, U.; et al. A Severe Hail Storm in Complex Topography in Switzerl and Observations and Processes. Atmos. Res. 2018, 209, 76–94. [Google Scholar] [CrossRef]
  25. Caldana, N.F.S.; Martelócio, A.; Rudke, A.; Nitsche, P.; Caramori, P. Frequência, Intensidade e Variabilidade Pluviométrica na Mesorregião Sudoeste Paranaense. Rev. Bras. Climatol. 2019, 25, 161–181. [Google Scholar] [CrossRef]
  26. Bang, S.D.; Cecil, D.J. Constructing a multifrequency passive microwave hail retrieval and climatology in the GPM domain. J. Appl. Meteorol. Climatol. 2019, 58, 1889–1904. [Google Scholar] [CrossRef]
  27. Hahn, R. Estimativa da Ocorrência e Severidade de Granizo no Rio Grande do Sul Baseado em Observações de Radar Meteorológico; Instituto de Astronomia, Geofísica e Ciências Atmosféricas, Universidade de São Paulo: São Paulo, Brazil, 2021. [Google Scholar]
  28. Sperling, V.B. Processos Físicos e Elétricos das Tempestades de Granizo na Região sul do Brasil. Ph.D. Thesis, Instituto Nacional de Pesquisas Espaciais, São José dos Campos, Brazil, 2018; p. 211. [Google Scholar]
  29. De Abreu, X.; Mattos, E.V.; Sperling, V.B. Caracterização das Assinaturas de Radar e da Atividade Elétrica de Relâmpagos de Tempestades com Granizo no Estado de São Paulo. Anu. Inst. Geociên. 2020, 43, 173–188. [Google Scholar] [CrossRef]
  30. Lopes, C.C. Microfísica, Cinemática e Eletrificação em Tempestades Tropicais que Geraram Granizo durante o Projeto SOS-CHUVA. Master’s Thesis, Instituto de Astronomia, Geofísica e Ciências Atmosféricas—USP, Sao Paulo, SP, Brazil, 2019; p. 107. [Google Scholar]
  31. Schultz, C.J.; Petersen, W.A.; Carey, L.D. Preliminary development and evaluation of lightning jump algorithms for the real-time detection of severe weather. J. Appl. Meteor. Climatol. 2009, 48, 2543–2563. [Google Scholar] [CrossRef]
  32. Gatlin, P.N.; Goodman, S.J. A Total Lightning Trending Algorithm to Identify Severe Thunderstorms. J. Atmos. Oceanic Technol. 2010, 27, 3–22. [Google Scholar] [CrossRef]
  33. Schultz, C.J.; Petersen, W.A.; Carey, L.D. Lightning and Severe Weather: A Comparison between Total and Cloud-to-Ground Lightning Trends. Weather Forecast. 2011, 26, 744–755. [Google Scholar] [CrossRef]
  34. Albrecht, R.I.; Morales, C.A.; Anselmo, E.M.; Neves, J.R.; Mattos, E.V.; Biscaro, T.; Machado, L.A.T. Thunderstorm Characteristics of Summer Precipitating Systems during CHUVA-GLM Vale do Paraiba Field Campaign. In Proceedings of the 16th International Conference on Clouds and Precipitation, Leipzig, Germany, 30 July–3 August 2012. [Google Scholar]
  35. Williams, E.R.; Boldi, B.; Matlin, A.; Weber, M.; Hodanish, S.; Sharp, D.; Goodman, S.; Raghavan, R.; Buechler, D. The behavior of total lightning activity in severe Florida thunderstorms. Atmos. Res. 1999, 51, 245–265. [Google Scholar] [CrossRef]
  36. Bechis, H.; Galligani, V.; Imaz, M.A.; Cancelada, M.; Simone, I.; Piscitelli, F.; Maldonado, P.; Salio, P.; Nesbitt, S.W. A case study of a severe hailstorm in Mendoza, Argentina, during the RELAMPAGO-CACTI field campaign. Atmos. Res. 2022, 271, 106127. [Google Scholar] [CrossRef]
  37. Rison, W.; Krehbiel, P.R.; Thomas, R.J.; Brown, M.F. Observations of precursor breakdown prior to intracloud lightning discharges. In Proceedings of the American Geophysical Union Fall Meeting 2009, San Francisco, CA, USA, 14–18 December 2009. AE32A-02 2009. [Google Scholar]
  38. Bruning, E.C.; Weiss, S.A.; Calhoun, K.M. Continuous variability in thunderstorm primary electrification and an evaluation of inverted-polarity terminology. Atmos. Res. 2014, 135–136, 274–284. [Google Scholar] [CrossRef]
  39. Mecikalski, R.M.; Bain, A.L.; Carey, L.D. Radar and lightning observations of deep moist convection across Northern Alabama during DC3: 21 May 2012. Mon. Weather Rev. 2015, 143, 2774–2794. [Google Scholar] [CrossRef]
  40. Zhang, Z.; Zheng, D.; Zhang, Y.; Lu, G. Spatial–temporal characteristics of lightning flash size in a supercell storm. Atmos. Res. 2017, 197, 201–210. [Google Scholar] [CrossRef]
  41. Da Silva, M.V. Propriedades Físicas e Elétricas de Relâmpagos Estimadas por Lightning Mapping Array. Bachelor’s Thesis, Universidade Federal de Itajubá, Itajubá, MG, Brazil, 2018; p. 61. [Google Scholar]
  42. Salvador, A.; Pineda, N.; Montanyà, J.; López, J.A.; Solà, G. Thunderstorm charge structures favoring cloud-to-ground lightning. Atmos. Res. 2021, 257, 105577. [Google Scholar] [CrossRef]
  43. Metzger, E.; Nuss, W.A. The Relationship Between Total Cloud Lightning Behavior and Radar-derived Thunderstorm Structure. Weather Forecast. 2013, 1, 237–253. [Google Scholar] [CrossRef]
  44. Emersic, C.; Heinselman, P.L.; MacGorman, D.R.; Bruning, E.C. Lightning Activity in a Hail-producing Storm Observed with Phased-array Radar. Mon. Weather Rev. 2011, 6139, 1809–1825. [Google Scholar] [CrossRef]
  45. Machado, L.A.T.; Dias, M.A.F.S.; Morales, C.; Fisch, G.; Vila, D.; Albrecht, R.; Goodman, S.J.; Calheiros, A.J.P.; Biscaro, T.; Kummerow, C.; et al. The Chuva Project: How Does Convection Vary across Brazil? Bulletin of the American Meteorological Society. Am. Meteorol. Soc. 2014, 95, 1365–1380. [Google Scholar] [CrossRef]
  46. Mattos, E.V.; Machado, L.A.T.; Williams, E.; Albrecht, R.I. Polarimetric Radar Characteristics of Storms with and without Lightning Activity. J. Geophys. Res. Atmos. 2016, 121, 14,201–14,220. [Google Scholar] [CrossRef]
  47. Mattos, E.V.; Machado, L.A.T.; Williams, E.; Goodman, S.J.; Blakeslee, R.J.; Bailey, J.C. Electrification Life Cycle of Incipient Thunderstorms: Radar and Electrification Life Cycle. J. Geophys. Res. Atmos. 2017, 122, 4670–4697. [Google Scholar] [CrossRef]
  48. IAG-USP Instituto de Astronomia, Geofísica e Ciências Atmosféricas da Universidade de São Paulo. Boletim Climatológico Anual da Estação Meteorológica do IAG-USP; Seção Técnica do Serviço Meteorológico; IAG-USP: São Paulo, Brazil, 2017; p. 20. Available online: https://www.iag.usp.br/noticia/boletim-estacao-meteorologica-2017 (accessed on 20 February 2021).
  49. Alvares, C.A.; Stape, J.L.; Sentelhas, P.C.; Gonçalves, J.L.M.; Sparovek, G. Köppen’s climate classification map for Brazil. Meteorol. Z. 2014, 22, 711–728. [Google Scholar] [CrossRef]
  50. Lemos, C.F.; Calbete, N.O. Sistemas Frontais que Atuaram no Brasil de 1987 a 1995. Climanálise Especial, Edição Comemorativa de 10 anos, MCT/INPE-CPTEC; CLIMANÁLISE, SP. 1996.
  51. Raia, A.; Cavalcanti, I.F.A. The life cycle of the South American monsoon system. J. Clim. 2008, 21, 6227–6246. [Google Scholar] [CrossRef]
  52. Lima, K.C.; Satyamurti, P.; Fernández, J.P.R. Large-scale atmospheric conditions associated with heavy rainfall episodes in southeast brazil. Theor. Appl. Climatol. 2010, 101, 121–135. [Google Scholar] [CrossRef]
  53. Naccarato, K.P.; Saraiva, A.C.V.; Saba, M.M.F.; Schumann, C. First Performance Analysis of BrasilDAT Total Lightning Network in Southeastern Brazil. In Proceedings of the International Conference on Grounding and Earthing & 5th International Conference on Lightning Physics and Effects, Bonito, MS, Brazil, 25–30 November 2012. [Google Scholar]
  54. Naccarato, K.P.; Pinto Jr., O.; Sloop, C.D.; Heckman, S.; Liu, C. Evaluation of BrasilDAT relative detection efficiency based on LIS observations and a numeric model. In Proceedings of the 2014 International Conference on Lightning Protection (ICLP), Shanghai, China, 11–18 October 2014; Proceedings IEEE; pp. 1814–1819. [Google Scholar]
  55. Goodman, S.J.; Blakeslee, R.J.; Christian, H.J.; Koshak, W.J.; Bailey, J.C.; Hall, J.M.; McCaul, E.W.; Buechler, D.E.; Darden, C.; Burks, J.; et al. The North Alabama Lightning Mapping Array: Recent severe storm observations and future prospects. Atmos. Res. 2005, 76, 423–437. [Google Scholar] [CrossRef]
  56. Blakeslee, R.; Bailey, J.C.; Carey, L.D.; Goodman, S.J.; Rudlosky, S.D.; Albrecht, R.I.; Morales, C.A.; Anselmo, E.M.; Neves, J.R. São Paulo Lightning Mapping Array(SP-LMA): Network assessment and analyses for intercomparison studies and GOES-R proxy activities. In Proceedings of the CHUVA Workshop; São Paulo, SP, Brazil, 8–10 August 2013. Available online: https://ntrs.nasa.gov/api/citations/20140002963/downloads/20140002963.pdf (accessed on 11 January 2024).
  57. Bailey, J.C.; Blakeslee, R.J.; Carey, L.D.; Goodman, S.J.; Rudlosky, S.D.; Albrecht, R.I.; Morales, C.A.; Anselmo, E.M.; Neves, J.R.; Buechler, D.E. São Paulo Lightning Mapping Array (SP-LMA): Network assessment and analyses for intercomparison studies and GOES-R proxy activities. In Proceedings of the International Conference on Atmospheric Electricity (ICAE 2014); Norman, OK, USA, 15–20 June 2014. Potsdam: IUGG/IAMAS. Available online: https://ntrs.nasa.gov/api/citations/20140011703/downloads/20140011703.pdf (accessed on 11 January 2024).
  58. Lang, T.J.; Rutledge, S.A. Kinematic, microphysical, and electrical aspects of an asymmetric bow-echo mesoscale convective system observed during STEPS 2000. J. Geophys. Res. 2008, 113, D08213. [Google Scholar] [CrossRef]
  59. Lund, N.R.; MacGorman, D.R.; Schuur, T.J.; Biggerstaff, M.I.; Rust, W.D. Relationships between Lightning Location and Polarimetric Radar Signatures in a Small Mesoscale Convective System. Mon. Weather Rev. 2009, 137, 4151–4170. [Google Scholar] [CrossRef]
  60. Bruning, E.C.; MacGorman, D.R. Theory and observations of controls on lightning flash size spectra. J. Atmos. Sci. 2013, 70, 4012–4029. [Google Scholar] [CrossRef]
  61. Hersbach, H.; Dee, D. ERA5 Reanalysis is in Production. ECMWF Newsl. 2016, 7, 147. Available online: https://www.ecmwf.int/en/newsletter/147/news/era5-reanalysis-production (accessed on 3 September 2020).
  62. Hersbach, H.; Bell, B.; Berrisford, P.; Hirahara, S.; Horányi, Á.; Muñoz-Sabater, J.; Nicolas, J.P.; Peubey, C.; Radu, R.; Schepers, D.; et al. The ERA5 global reanalysis. Q. J. R. Meteorol. Soc. 2020, 146, 1999–2049. [Google Scholar] [CrossRef]
  63. Carey, L.D.; Rutledge, S.A. The Relationship between Precipitation and Lightning in Tropical Island Convection: A C-Band Polarimetric Radar Study. Mon. Weather Rev. 2000, 128, 2687–2710. [Google Scholar] [CrossRef]
  64. Heymsfield, A.J.; Palmer, A.G. Relations for deriving thunderstorm anvil mass of CCOPE storm water budget estimates. J. Appl. Meteorol. Climatol. 1986, 25, 691–702. [Google Scholar] [CrossRef]
  65. Waldvogel, A.; Federer, B.; Grimm, P. Criteria for the Detection of Hails Cells. J. Appl. Meteorol. 1979, 18, 1521–1525. [Google Scholar] [CrossRef]
  66. Greene, D.R.; Clark, R.A. Vertically Integrated Liquid Water—A New Analysis Tool. Mon. Weather Rev. 1972, 100, 548–552. [Google Scholar] [CrossRef]
  67. Mosier, R.M.; Schumacher, C.; Orville, R.E.; Carey, L.D. Radar Nowcasting of Cloud-to-Ground Lightning over Houston, Texas. Weather Forecast. 2011, 26, 199–212. [Google Scholar] [CrossRef]
  68. Globo Comunicação e Participações SA. Pancadas de Chuva Colocam SP em Estado de Atenção, diz CGE—g1. 2012. Available online: http://g1.globo.com/sao-paulo/noticia/2012/01/pancadas-de-chuva-colocam-sp-em-estado-de-atencao-diz-cge.html (accessed on 3 September 2020).
  69. Sacramento Neto, O.B.; Escobar, G.C.J.; Silva, P.E.D. Método objetivo para identificar episódios de Zonas de Convergência de Umidade (ZCOU) no ambiente operacional do Centro de Previsão de Tempo e Estudos Climáticos—CPTEC. In XVI Congresso de Meteorologia, Belém, PA; SBMET: Rio de Janeiro, RJ, Brazil, 2010. [Google Scholar]
  70. Thiel, K.C.; Calhoun, K.M.; Reinhart, A.E.; MacGorman, D.R. GLM and ABI characteristics of severe and convective storms. J. Geophys. Res. Atmos. 2020, 125, e2020JD032858. [Google Scholar] [CrossRef]
  71. Fernandes, K.A. Cavados Invertidos na Região Central da América do Sul. Master’s Thesis, INPE, São José dos Campos, SP, Brazil, 1996; p. 90. [Google Scholar]
  72. Carvalho, A.M.G. Conexões Entre a Circulação em Altitude e a Convecção Sobre a América do Sul. Master’s Thesis, INPE, São José dos Campos, SP, Brazil, 1989; p. 121. [Google Scholar]
  73. Reboita, M.S. Ciclones Extratropicais Sobre o Atlântico Sul: Simulação Climática e Experimentos de Sensibilidade. Ph.D. Thesis, Instituto de Astronomia, Geofísica e Ciências Atmosféricas—IAG—USP, Sao Paulo, SP, Brazil, 2008; p. 359. [Google Scholar]
  74. Joe, P.; Dance, S.; Lakshmanan, V.; Heizenreder, D.; James, P.K.; Lang, P.; Hengstebeck, T.; Feng, Y.; Li, P.W.; Yeung, H.; et al. Automated Processing of Doppler Radar Data for Severe Weather Warnings; [Internet]. InTech.: London, UK, 2012. [Google Scholar] [CrossRef]
  75. Henry, W. The Skew-T, Log P Diagram; National Weather Service Training Center, EUA: Kansas City, MO, USA, 1897; p. 68. [Google Scholar]
  76. Nascimento, E.L. Previsão de tempestades severas utilizando-se parâmetros convectivos e modelos de mesoescala: Uma estratégia operacional adotável no Brasil? Rev. Bras. Meteorol. 2005, 20, 121–140. [Google Scholar]
  77. Kuo, J.T.; Orville, H.D. A radar climatology of summertime convective clouds in the Black Hills. J. Appl. Meteor. 1973, 12, 359–368. [Google Scholar] [CrossRef]
  78. Wallace, J.M. Diurnal variations in precipitation and thunderstorm frequency over the conterminous United States. Mon. Weather Rev. 1975, 103, 406–419. [Google Scholar] [CrossRef]
  79. Court, A.; Griffiths, J.F. Thunderstorm climatology. In Thunderstorm Morphology and Dynamics; University of Oklahoma Press: Norman, OK, USA, 1981; pp. 9–39. [Google Scholar]
  80. Mattos, E.V.; Machado, L.A.T. Cloud-to-ground lightning and Mesoscale Convective Systems. Atmos. Res. 2011, 99, 377–399. [Google Scholar] [CrossRef]
  81. Makowski, J.A.; MacGorman, D.R.; Biggerstaff, M.I.; Beasley, W.H. Total lightning characteristics relative to radar and satellite observations of Oklahoma Mesoscale Convective Systems. Mon. Weather Rev. 2013, 141, 1593–1611. [Google Scholar] [CrossRef]
  82. Monteiro, J.R.; Mattos, E.V.; Lima, W. Propriedades Físicas e Elétricas de Tempestades na Região Sudeste do Brasil. Anu. Inst. Geociênc. 2021, 44, 41700. [Google Scholar] [CrossRef]
  83. Carey, L.D.; Rutledge, S.A. A multiparameter radar case study of the microphysical and kinematic evolution of a lightning producing storm. Meteorol. Atmos. Phys. 1996, 59, 33–64. [Google Scholar] [CrossRef]
  84. Visser, P. The Storm-Structure-Severity method for the identification of convective storm characteristics with conventional weather radar. Meteorol. Appl. 2001, 8, 1–10. [Google Scholar] [CrossRef]
  85. Wiens, K.C.; Rutledge, S.A.; Tessendorf, S.A. The 29 June 2000 supercell observed during STEPS. Part II: Lightning and charge structure. J. Atmos. Sci. 2005, 62, 4151–4177. [Google Scholar] [CrossRef]
  86. Williams, E.R. The tripole structure of thunderstorms. J. Geophys. Res. 1989, 94, 13151–13167. [Google Scholar] [CrossRef]
  87. Williams, E.R.; Weber, M.E.; Orville, E.E. The Relationship Between Lightning Type and Convective State of Thunderclouds. J. Geophys. Res. 1989, 94, 13213–13220. [Google Scholar] [CrossRef]
  88. Simpson, G.; Robinson, G.D. The distribution of electricity in thunderclouds, II. R. Soc. 1941, 177, 281–329. [Google Scholar] [CrossRef]
  89. Carey, L.D.; Murphy, M.J.; McCormick, T.L.; Demetriades, N. Lightning location relative to storm structure in a leading-line, trailing-stratiform mesoscale convective system. J. Geophys. Res. 2005, 110, 23. [Google Scholar] [CrossRef]
  90. Reynolds, S.E.; Brook, M.; Gourley, M.F. Thunderstorm charge separation. J. Meteorol. 1957, 14, 426–436. [Google Scholar] [CrossRef]
  91. Buser, O.; Aufdermaur, A.N. Electrification by collisions of ice particles on ice or metal targets. In Electrical Processes in Atmospheres; Dolezalek, H., Reiter, R., Eds.; Steinkopff: Darmstadt, Germany, 1977; p. 294. [Google Scholar] [CrossRef]
  92. MacGorman, D.R.; Burgess, D.W.; Mazur, V.; Rust, W.D.; Taylor, W.L.; Johnson, B.C. Lightning rates relative to tornadic storm evolution on 22 May 1981. J. Atmos. Sci. 1989, 46, 221–250. [Google Scholar] [CrossRef]
  93. Ziegler, C.L.; Macgorman, D.R. Observed lightning morphology relative to modeled space charge and electric field distributions in a tornadic storm. J. Atmos. Sci. 1994, 51, 833–851. [Google Scholar] [CrossRef]
Figure 1. Study region showing the elevation in meters, location, and radius (190 km), of the FCTH radar (black square), lightning sensors of the BrasilDAT (yellow filled circles), and localization, and radius (150 km), of the SPLMA (red cross) network. The black outline represents the MASP and the region in white color represents maritime regions.
Atmosphere 15 00182 g001
Figure 2. Reports of the severe event that occurred in the Metropolitan Area of São Paulo (MASP) on 7 January 2012: (a,b) record of hail in Jardim Lenize in the Guarulhos (SP state), neighborhood. Photos available at https://www.youtube.com/watch?v=Jl0qeiL08CU (accessed on 3 September 2020). (c,d) hail damage in the region of Guarulhos city. Photos available at https://www.youtube.com/watch?v=EBxoSX5_cF4 (accessed on 14 March 2018).
Atmosphere 15 00182 g002
Figure 3. Synoptic analysis for 7 January 2012, at 1800 UTC: (a) synoptic chart indicating the position of the Moisture Convergence Zone (MCZ, light blue line). The red dashed line indicates the position of the inverted trough, (b) infrared channel image (10.7 µm, in °C) from the GOES-13 satellite, (c) altitude synoptic chart corresponding to 250 hPa level, and (d) mid-level synoptic chart corresponding to 500 hPa. Source: CPTEC/INPE.
Atmosphere 15 00182 g003
Figure 4. Spatial distribution of Convective Available Potential Energy (CAPE, J kg−1, colored) and vertical wind shear between 500 and 1000 hPa (m s−1) with negative values represented by red lines and positive values by dark blue lines. Data from ERA5 reanalysis for the study region on 7 January 2012, for the times: (a) 15:00 UTC, (b) 16:00 UTC, (c) 17:00 UTC, and (d) 18:00 UTC. The red rectangle in the figure indicates the MASP region.
Atmosphere 15 00182 g004
Figure 5. Vertical integrated moisture flux divergence (kg m−2 s−1, shaded), and vectors of vertical integrated moisture flux (kg m s−1) from ERA5 reanalysis for the study region on 7 January 2012, for the times: (a) 15:00 UTC, (b) 16:00 UTC, (c) 17:00 UTC, and (d) 18:00 UTC. The red rectangle in the figure indicates the MASP region.
Atmosphere 15 00182 g005
Figure 6. Vertical wind shear (difference between wind speed at 500 hPa and 1000 hPa, in m s−1, represented by shading), mass divergence at 250 hPa greater than 0.5 × 10⁻⁵ s−1, represented by orange lines, and geopotential height at 250 hPa (gpm), represented by black lines. Data from ERA5 reanalysis for the study region on 7 January 2012, for the times: (a) 15:00 UTC, (b) 16:00 UTC, (c) 17:00 UTC, and (d) 18:00 UTC. The red rectangle in the figure indicates the MASP region.
Atmosphere 15 00182 g006
Figure 7. Average relative humidity between 850 and 500 hPa (%), geopotential height at 500 hPa (gpm), represented by red lines, and vertical velocity omega less than −0.2 Pa s−1, represented by blue lines. Data from ERA5 reanalysis for the study region on 7 January 2012, for the times: (a) 15:00 UTC, (b) 16:00 UTC, (c) 17:00 UTC, and (d) 18:00 UTC. The red rectangle in the figure indicates the MASP region.
Atmosphere 15 00182 g007
Figure 8. Skew-T diagram, Log-P (left figure), average for Guarulhos Airport (GRU) from data from the ERA-5 reanalysis closest to the Metropolitan Region of São Paulo at 18:00 UTC on 7 January 2012. In the diagram, the black line represents the air temperature (°C), the blue line indicates the dew point temperature, and the dashed red line represents the air parcel survey. The image on the right shows the position of the radiosonde up to an altitude of 5 km and various thermodynamic indices.
Atmosphere 15 00182 g008
Figure 9. CAPE versus vertical wind shear diagram on 7 January 2012, from 15:00 UTC to 20:00 UTC for MASP. Data from ERA5 reanalysis. The x-axis in the figure indicates the value of the CAPE index (J kg−1), the y-axis indicates the wind shear between 0 and 6 km height (m s−1) and the colored dots the time dimension. The average values were extracted from the purple rectangle on the map above. The continuous black lines indicate the Bulk Richardson number values.
Atmosphere 15 00182 g009
Figure 10. Brightness temperature (in °C) of the MSG satellite infrared channel (10.7 µm) for the 7 January 2012 storm between 15:00 UTC and 19:45 UTC (ap), centered over the MASP region.
Atmosphere 15 00182 g010
Figure 11. Constant Altitude Plan Position Indication (CAPPI), 3 km of reflectivity for the 7 January 2012, storm between 14:52 UTC and 18:32 UTC (ap), centered over the MASP region. The gray hatched rectangle represents the storm monitoring area. The red rectangles indicate the moments: (i) pre-hail, (j) first, (l) second, and (n) third hail moments, and the (o) post-hail moment.
Atmosphere 15 00182 g011
Figure 12. Location of lightning from BrasilDAT (blue cross) and SPLMA (black dots) for the 7 January 2012, storm between 14:52 UTC and 18:32 UTC (ap), centered over the MASP region. The gray hatched rectangle represents the storm monitoring area. The red rectangles indicate the moments: (i) pre-hail, (j) first, (l) second, and (n) third hail moments, and the (o) post-hail moment.
Atmosphere 15 00182 g012
Figure 13. Time evolution of maximum reflectivity (dBZ) per height (km) for the storm lifecycle from 14:52 to 20:22 UTC on 7 January 2012. The vertical lines represent the pre-hail moment (gray dashed line), first (red solid line), second (red dotted line), and third (red dashed and dotted line) hail moment, and the post-hail moment (black dashed line).
Atmosphere 15 00182 g013
Figure 14. Lifecycle of the storm that occurred on 7 January 2012. (a) SPLMA sources and flashes (occurrence every 5 min, solid gray and black line, respectively), duration of flash (s, blue line), and length (km, orange line). (b) Graupel mass (kg m−2, blue line), ice crystal mass (kg m−2, orange line), integrated total liquid water content (VIL) (kg m−2, black line), and integrated total ice content (VII) (kg m−2, gray line), and (c) the Waldvogel height (km, gray line), maximum reflectivity (dBZ, blue line), and Echo Top 20 dBZ (km, black line), obtained from FCTH S-band radar. The vertical lines represent the pre-hail moment (gray dashed line), first (red solid line), second (red dotted line), and third (red dashed and dotted line) hail moments, and the post-hail moment (black dashed line).
Atmosphere 15 00182 g014
Figure 15. Temporal evolution from 14:52 UTC to 23:57 UTC of VHF source density and total flashes from SPLMA network considering: (a) all VHF sources of flash, and (b) 10% first VHF sources from flash. The vertical lines represent the pre-hail moments (gray dashed line), first (red solid line), second (red dotted line), and third (red dashed and dotted line) hail moments, and the post-hail moment (black dashed line).
Atmosphere 15 00182 g015
Figure 16. LMA multi-panel plot for lightning that occurred at 17:37 UTC (last radar image before the hail reached the ground) on 7 January 2012. Colored dots (colored by time, from blue to red) represent the Very High Frequency (VHF) sources from the SPLMA network, and gray circles and black cross represent the intracloud (IC) and cloud-to-ground (CG) return strokes from BrasilDAT, respectively. (a) altitude above mean sea level (km) of VHF sources versus time (seconds), (b) altitude (km) versus longitude (°), (c) histogram of altitude (km) of VHF sources, (d) latitude (°) versus longitude (°) and (e) latitude versus altitude (km) of VHF sources.
Atmosphere 15 00182 g016
Figure 17. Similar to Figure 16 for 17:42 UTC, representing the time of the radar image closest to the first time that hail was recorded on the ground.
Atmosphere 15 00182 g017
Figure 18. Similar to Figure 16 for 17:52 UTC, representing the time of the radar image closest to the second time that hail was recorded on the ground.
Atmosphere 15 00182 g018
Figure 19. Similar to Figure 16 for 18:02 UTC, representing the time of the radar image closest to the third time that hail was recorded on the ground.
Atmosphere 15 00182 g019
Figure 20. Similar to Figure 16 for 18:07 UTC, representing the time of the radar image after the last record of hail on the ground.
Atmosphere 15 00182 g020
Figure 21. (a,d,g,j,m) Constant Altitude Plan Position Indicator (CAPPI) of reflectivity (dBZ) in 3 km height and lightning (black circles: SPLMA and blue cross: BrasilDAT), (b,e,h,k,n) vertical latitudinal and (c,f,i,l,o) longitudinal sections of reflectivity (in dBZ), and lightning occurrences (BrasilDAT and SPLMA) for the thunderstorm on 7 January 2012. The figures are related to the moments of hail: pre-hail at 17:37 UTC (the closest moment of pre-hail), first at 17:42 UTC, second at 17:52 UTC, and third hail moments at 18:02 UTC, and the post-hail moment at 18:07 UTC.
Atmosphere 15 00182 g021
Disclaimer/Publisher’s Note: The statements, opinions and data contained in all publications are solely those of the individual author(s) and contributor(s) and not of MDPI and/or the editor(s). MDPI and/or the editor(s) disclaim responsibility for any injury to people or property resulting from any ideas, methods, instructions or products referred to in the content.

