Article

Assessment of Regional Climate Effects of Urbanization around Subtropical City Wuhan in Summer Using Numerical Modeling

School of Remote Sensing and Information Engineering, Wuhan University, Wuhan 430072, China
Atmosphere 2024, 15(2), 185; https://doi.org/10.3390/atmos15020185
Submission received: 27 November 2023 / Revised: 6 January 2024 / Accepted: 23 January 2024 / Published: 31 January 2024
(This article belongs to the Section Climatology)

Abstract

:
China has experienced significant urbanization during the past 40 years, which exerts impacts on regional climates through changing land surface properties. Previous studies mainly focused on the Pearl River Delta, the Yangtze River Delta, and the Beijing-Tianjin-Hebei areas, while less attention has been paid to central China. In this paper, the regional climate effects of urbanization around the greater Wuhan area were investigated using the WRF model. High resolution, satellite-derived, impervious datasets were used to generate two realistic scenarios representing urban surface states of the years 1986 and 2018. By comparing the simulation results of two sensitivity experiments from 1 July 2015 to 12 July 2015, the spatial and diurnal changes in surface air temperature, surface skin temperature, and surface energy budget were analyzed. Our results reveal that urban expansion leads to 2 m air temperature and surface skin temperature increases by approximate 0.63 °C and 0.83 °C, respectively. Surface sensible heat flux increases, while latent heat flux decreases, with much greater effects in daytime than nighttime. The planetary boundary layer height (PBLH) increases with its maximum value over 100 m, and a 2 m water vapor mixing ratio decreases with a peak value around −2 g/kg. These findings provide knowledge to improve the understanding of land–atmospheric interactions and pave the way to studying urban expansion effects under future climate change scenarios.

1. Introduction

Urbanization, one of the most extreme and increasingly used aspects of land use and land cover change (LULCC), is considered to play an important role in local weather and regional climates. Through replacing green and natural surfaces by human-made structures and roads, it can change land surface physical properties (e.g., albedo, emissivity, vegetation fraction, roughness, thermal conductivity) and alters the exchange of energy, water, and momentum between the land surface and the atmosphere [1]. It has been reported that urbanization can result in perceivable alterations of atmospheric thermal structures and circulations [2,3], boundary layer dynamics [4], and precipitation [5].
Studies based on observation or numerical modeling demonstrated the possible effects of urbanization on temperature. Earlier studies based on partly homogenized temperature records of urban and rural stations indicated an urbanization-related warming of 0.1 °C per decade over China for the period 1951–2004 [6] and an 0.11 °C per decade warming trend over northern China for 1961–2000 [7]. Using the reanalysis minus observation method, a warming trend of 0.18 °C per decade was found in the United States [8], and a rate of 0.05 °C per decade was detected in southeastern China [9]. Meso-scale models were also employed to simulate urbanization effects on a single city [10,11,12,13,14] at regional and country scales [15,16,17,18,19] for historical effects as well as future projections [20,21].
Process-based numerical models are increasingly employed to investigate the climate effects of urbanization at local and regional scales due to their ability to provide spatial-temporal continuous information and represent the underlying physical mechanism. Many previous studies quantify the urbanization climate effects based on contrasting experiments with and without urbanity [22,23]. In these scenarios, an urban, impervious surface was entirely replaced with natural vegetation types, such as forest, cropland, and grassland. However, simulations using these ideal scenarios might exaggerate the magnitude of climate effects. Moreover, default land cover datasets in the Weather Research and Forecasting Model (WRF) model are derived from outdated satellite observations. They fail to represent the latest urban boundary and intensity [14,24]. It is necessary to incorporate high-resolution urban classification into models to represent realistic surface states.
In addition, numerous modeling studies on urbanization in China mainly focus on the whole country [15,18,25] and regions such as the Pearl River Delta [24,26], the Yangtze River Delta [27,28,29], and the Beijing-Tianjin-Hebei area [22,30]. However, less attention has been paid to regions such as central China, where dramatic urban expansion has also been ongoing since the 1980s. Ke et al. [31] investigated the climate change impacts of different urbanization patterns in the Wuhan metropolitan area; nevertheless, it is a future scenario analysis. To the best of our knowledge, there are limited publications on the regional climate effects of historical urbanization in central China using meso-scale modeling.
Therefore, the objective of our work is to quantify the historical regional climate effects of urbanization around the greater Wuhan area. Different from previous studies using ideal scenarios, in the present work, high-resolution urban classifications derived from satellite observations were incorporated into a WRF model to realistically represent an urban impervious area. The climate effects induced by urban expansion were isolated via comparing two contrasting numerical modeling experiments with surface states in the years 1986 and 2018. The spatial and diurnal variations of surface air temperature, surface skin temperature, and surface energy budget were examined.

2. Materials and Methods

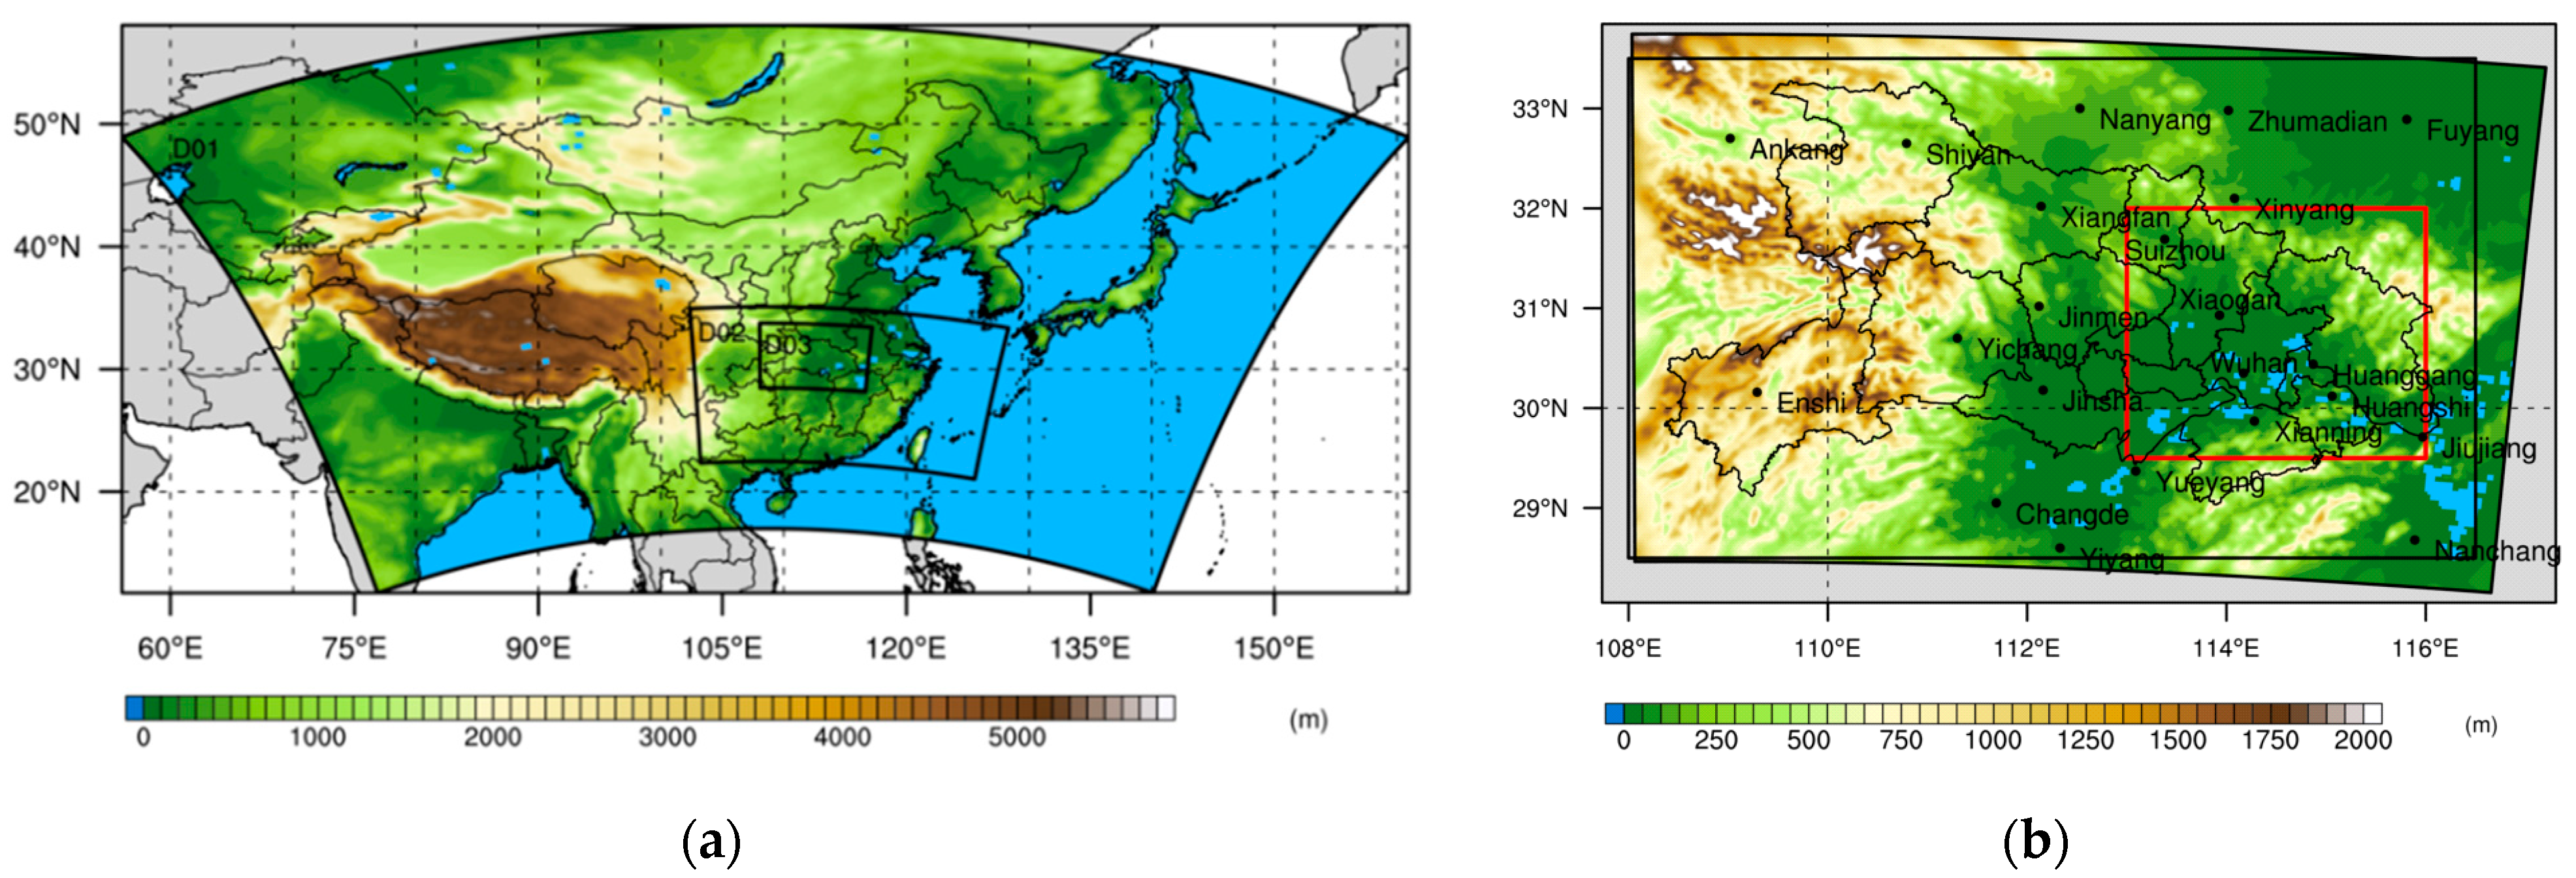
2.1. WRF-SLUCM Modelling System and Configurations

WRF is a sophisticated, three-dimensional compressible and non-hydrostatic numerical weather simulation and prediction model developed by the National Center for Atmospheric Research [32]. It is widely used for numerical weather prediction, regional climates, and air quality studies. As a key component of the WRF modeling system, the Advanced Research WRF (ARW) solver consists of several initialization programs for idealized and real data simulations. It has fully compressible Eulerian and non-hydrostatic equations with a run time hydrostatic option, which is conservative for scalar variables. The model uses terrain-following, hydrostatic pressure vertical coordinates with a constant pressure surface as the top of the model boundary.
In this study, version 4.0 of the WRF model with an ARW dynamics core is applied. Two-way nested triple domains are set: (1) an outer coarse domain with 27 km spatial grid spacing and 7452 km by 4698 km extent, covering the whole country and the surrounding area; (2) an inner domain with 9 km grid spacing and 2403 km by 1431 km extent, covering most of southern China; (3) an inner most domain with 3 km grid spacing and 855 km by 594 km extent, covering the Hubei province. The coverage of these three domains is illustrated in Figure 1.
The detailed WRF configuration of physical schemes and land surface models can be referred to in Table 1. The United States Geological Survey (USGS) classification is selected as land cover. In total, 33 vertical levels are set from the surface up to 50 hPa in a terrain following a sigma coordinate. The lateral boundary for the outer domain and the initial conditions for all domains are provided by ERA-Interim reanalysis [33] with a horizontal spatial resolution of 0.75° × 0.75° and a temporal interval of 6 h. The prescribed sea surface temperature from the ERA-Interim is updated every 6 h as lower boundary conditions for the portions of the domain over the ocean.
WRF is coupled to a single layer urban canopy model (SLUCM) [34,35], allowing for representation of the land–atmosphere interactions in urban areas. The SLUCM used in this study is a single layer model with some simplified urban geometry parameters and corresponding calculations, such as shadowing from buildings, reflection of shortwave and longwave radiation, wind profile in the canopy layer, and thermal conduction equations for roofs, walls, and road surfaces [34,35]. In the coupled modeling system, urban land cover is divided into three categories: low intensity residential (LIR), high intensity residential (HIR), and commercial/industry/transportation (CIT). Due to the lack of measurements and available urban datasets, default urban canopy parameters were utilized without modification, which are listed in Table 2.

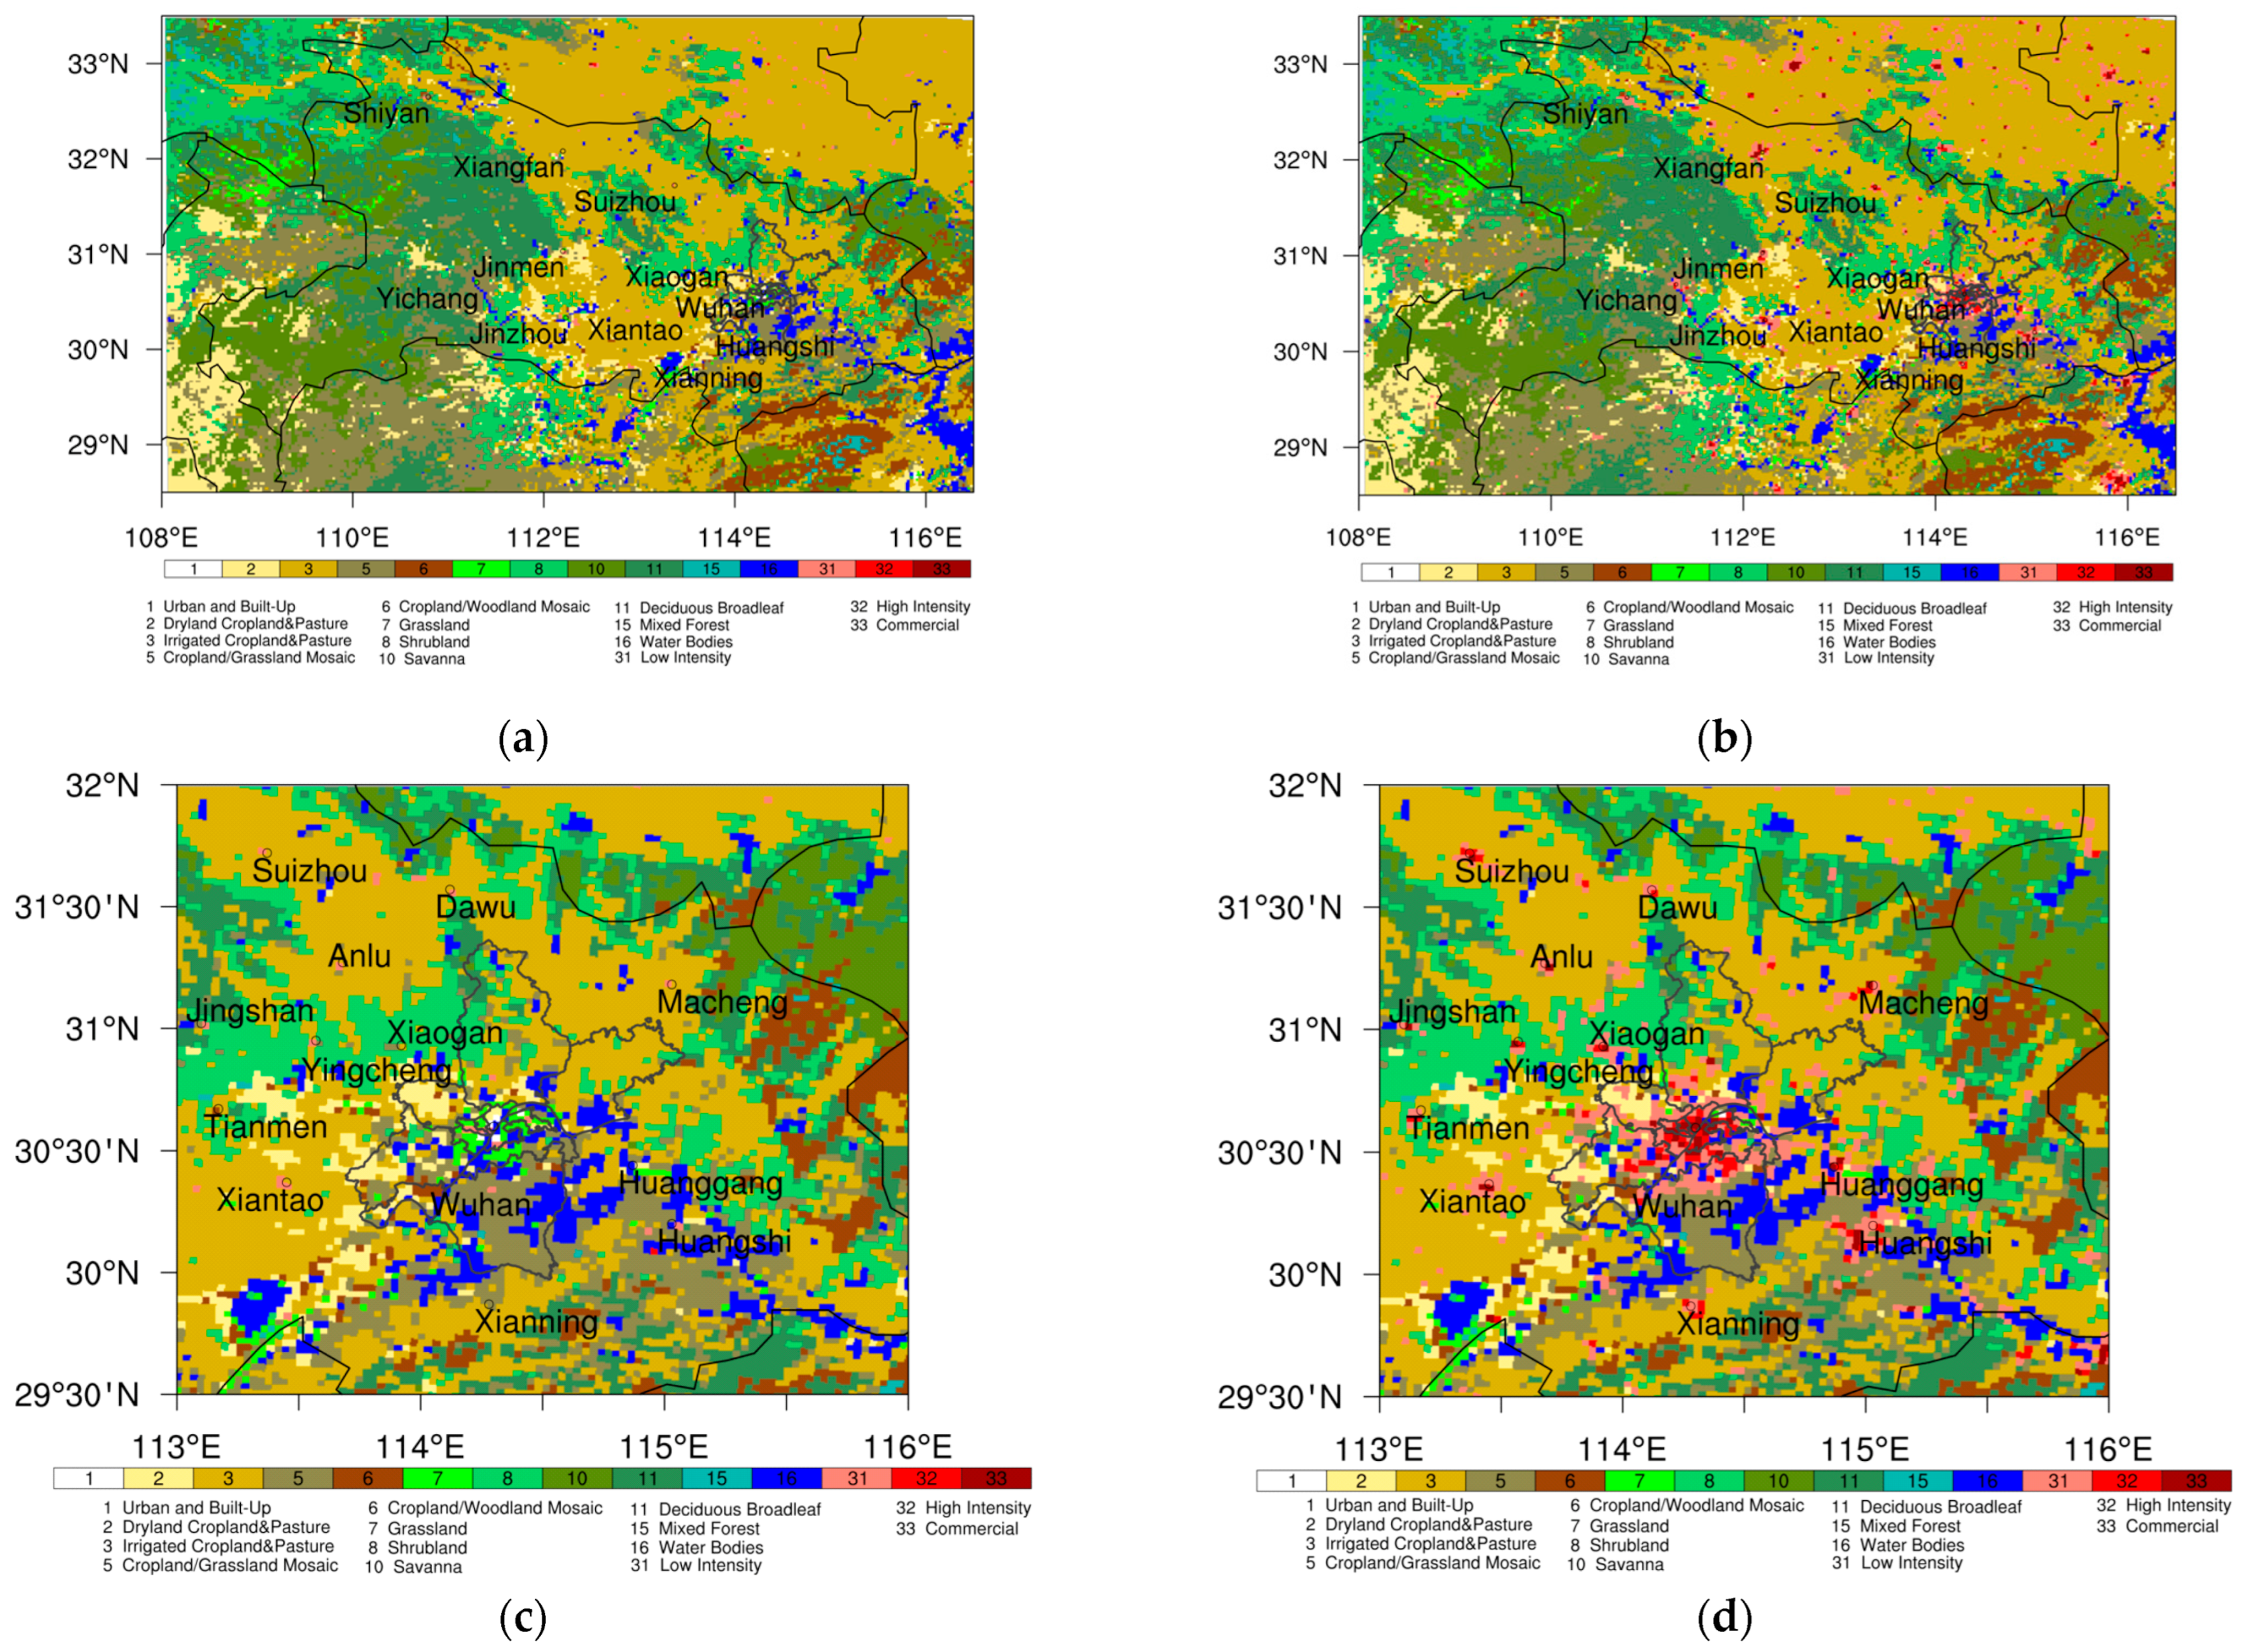
2.2. Urban Impervious Area Dataset

A global artificial impervious area (GAIA) dataset produced by Tsinghua University is used to generate urban classifications for SLUCM, which can be downloaded from http://data.ess.tsinghua.edu.cn/ (accessed on 5 May 2022). This 34-year long annual dataset was generated using the full archive of Landsat data from 1985 to 2018, which is reliable according to the validation accuracies and comparisons with other global urban products and settlement points [36]. In this dataset, impervious and non-impervious pixels at a 30 m scale are labeled as 1 and 0, respectively. It is further aggregated annually from 30 m to 1 km as a percentage of an impervious area to facilitate the usage for modeling. In other words, the percentage of an impervious area at a 1 km scale is calculated by accounting for the 30 m pixel number fraction within 1 km by 1 km extent. Three urban categories (LIR, HIR, and CIT) are generated from the aggregated percentage of the impervious area using the threshold values shown in Table 3.

2.3. Model Evaluation Data

To evaluate the performance of the simulations, the China Meteorological Forcing Dataset (CMFD) provided by National Tibetan Plateau Data Center (http://data.tpdc.ac.cn, accessed on 15 July 2022) is used as a reference observation. As a newly compiled and gridded daily meteorological dataset, it was developed at a 0.1° spatial resolution covering the period from 1979 to 2018 [37]. It was compiled based on gauge-observed data obtained from the China Meteorological Administration and other datasets, such as satellite precipitation data and Global Land Data Assimilation System data. High-resolution elevation data were introduced in the observed air temperature interpolation. The gridded observation dataset is re-projected and resampled to be consistent with the WRF model outputs. Variables as the daily maximum/minimum/average 2 m temperature and daily total precipitation are investigated.

2.4. Design of Experiments

The default land cover dataset utilized in the WRF, with either Moderate-Resolution Imaging Spectroradiometer (MODIS) or USGS classification, is a climatology derived from outdated one year satellite products. It fails to represent the newest realistic surface states, especially the rapidly growing urban areas. Toward this end, we replace the urban type within the inner most domain with the aforementioned GAIA-derived urban classification correspondingly while keeping the outer domains unchanged using default WRF static datasets. The land cover classification maps with updated urban extents and three classifications for the years 1986 and 2018 are illustrated in Figure 2.
Considerable changes in major land cover classifications, especially the urban types, can be discerned from Figure 3. Within the study area domain 03, the following dominant categories occupy area percentages of 35.29%, 14.01%, 10.09%, and 11.29%, respectively: Irrigated Cropland&Pasture, Cropland/Grassland Mosaic, Shrubland, Savanna, and Deciduous Broadleaf. The urban areas of LIR, HIR, and CIT increase from 0.25%, 0.01%, and 0.00% in 1986 to 2.30%, 0.30%, and 0.22% in 2018, respectively. Urban expanses occur mainly at the expanses of Dryland Cropland&Pasture, Irrigated Cropland&Pasture, Cropland/Grassland Mosaic, Grassland, and Shrubland.
Two sensitivity experiments, URBAN_1986 and URBAN_2018, were designed corresponding to realistic surface states in 1986 and 2018, respectively. Driven by identical atmospheric forcing, they were all carried out from 1 June 2015 to 12 July 2015 with the first month treated as a spin-up period (Table 4). Through comparing simulation results from these two experiments, the climate effects of urban expansion are expected to be isolated.
The WRF-simulated hourly near-surface air temperatures from the experiments URBAN_2018 and URBAN_1986 were aggregated to daily values. To facilitate the comparison, the WRF simulations were re-projected and interpolated bi-linearly to match the resolution of the observed gridded dataset.

3. Results

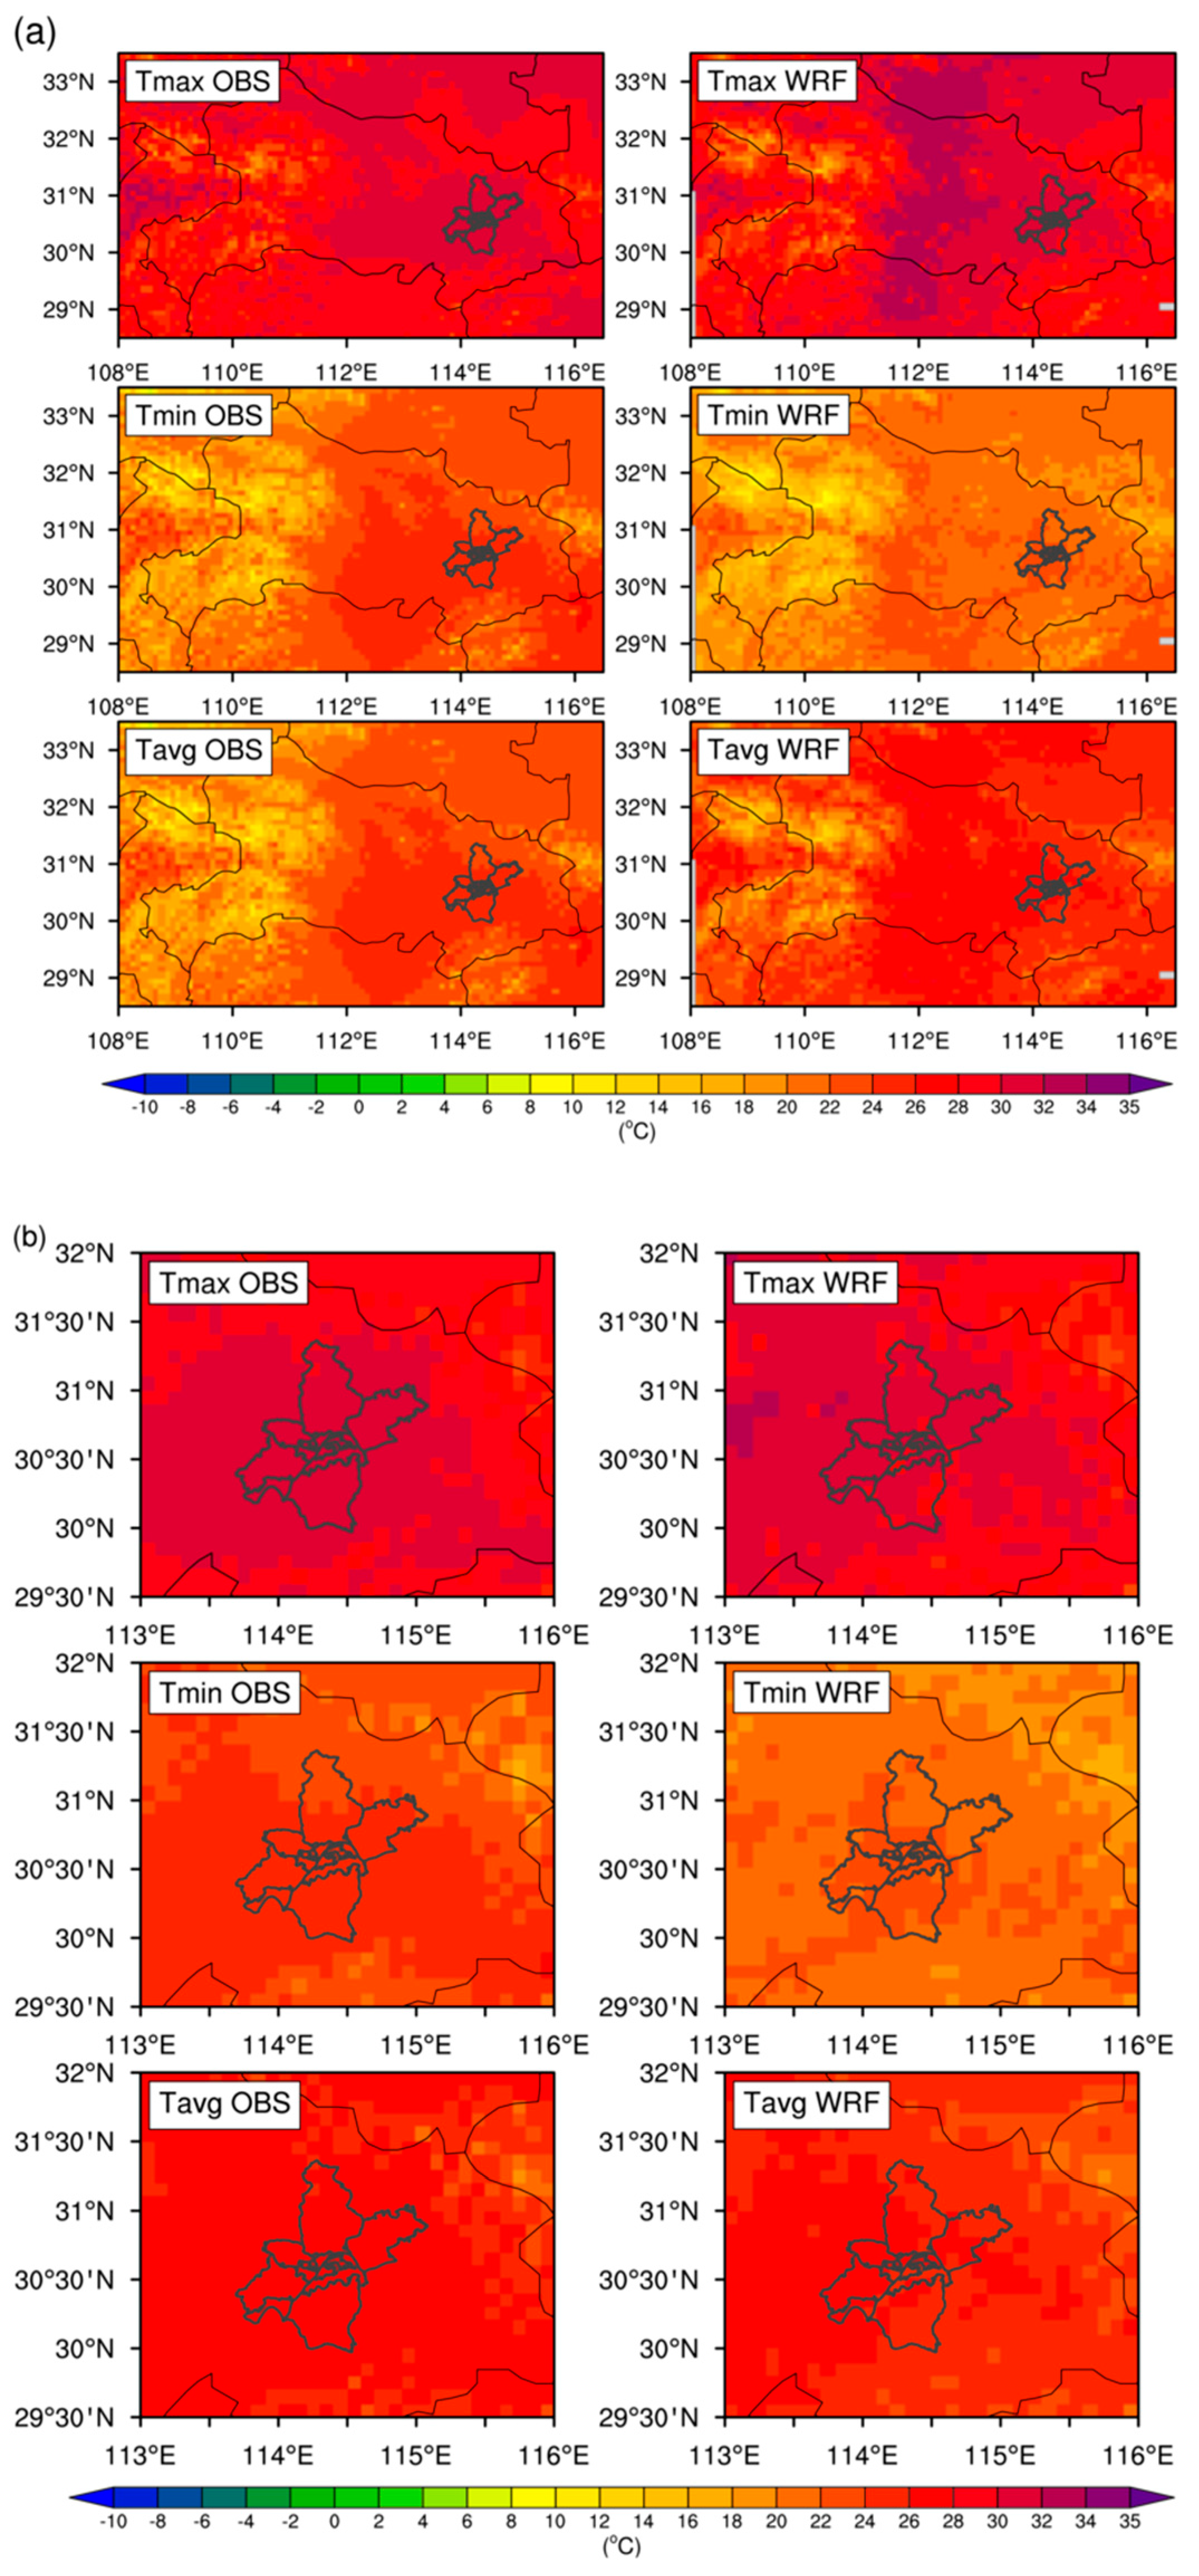
3.1. Evaluation of Model Performance with Gridded Observations

As shown in Figure 4, the WRF accurately reproduces the spatial pattern of the 2 m temperature across the whole domain D03 and within the analysis area. Nevertheless, a slight warm bias for the 2 m maximum temperature and a slight cool bias for the 2 m minimum temperature exist. The discrepancies between the WRF simulation and the gridded observations might attribute to the provided lateral and initial boundary conditions, horizontal resolution, internal variability, and the model’s physical approximation.

3.2. Impacts on Surface Air Temperature and Surface Skin Temperature

Figure 5 shows the spatial distribution of the simulated average 2 m air temperature (T2m) and surface skin temperature (Tskin) from both experiments, URBAN_2018 and URBAN_1986, as well as their differences. T2m and Tskin both exhibit prominent warming effects over the urban extent in 2018 with average increases in magnitude of 0.63 °C and 0.83 °C, respectively. Urbanization has strong local warming effects in the Wuhan core city area with maximum levels beyond 2.0 °C and 3.0 °C for T2m and Tskin, respectively. It should be noted that the local warming effect can extend to surrounding areas beyond the city extent.
The diurnal variations of surface air temperature and surface skin temperature from experiments URBAN_2018 and URBAN_1986 are compared for urban grid cells in 2018 in Figure 6. In this study, the local hours from 06:00 to 18:00 are defined as daytime, while the period from 19:00 to 05:00 is defined as nighttime. Urban expansion leads to daily mean increases by 0.63 °C and 0.83 °C for T2m and Tskin, respectively. Both T2m and Tskin present more pronounced warming during nighttime (with average magnitudes of 0.88 °C and 1.09 °C) than daytime (with average magnitudes of 0.42 °C and 0.62 °C). The increases in T2m and Tskin both peak at 03:00 with magnitudes of 1.19 °C and 1.34 °C, respectively.

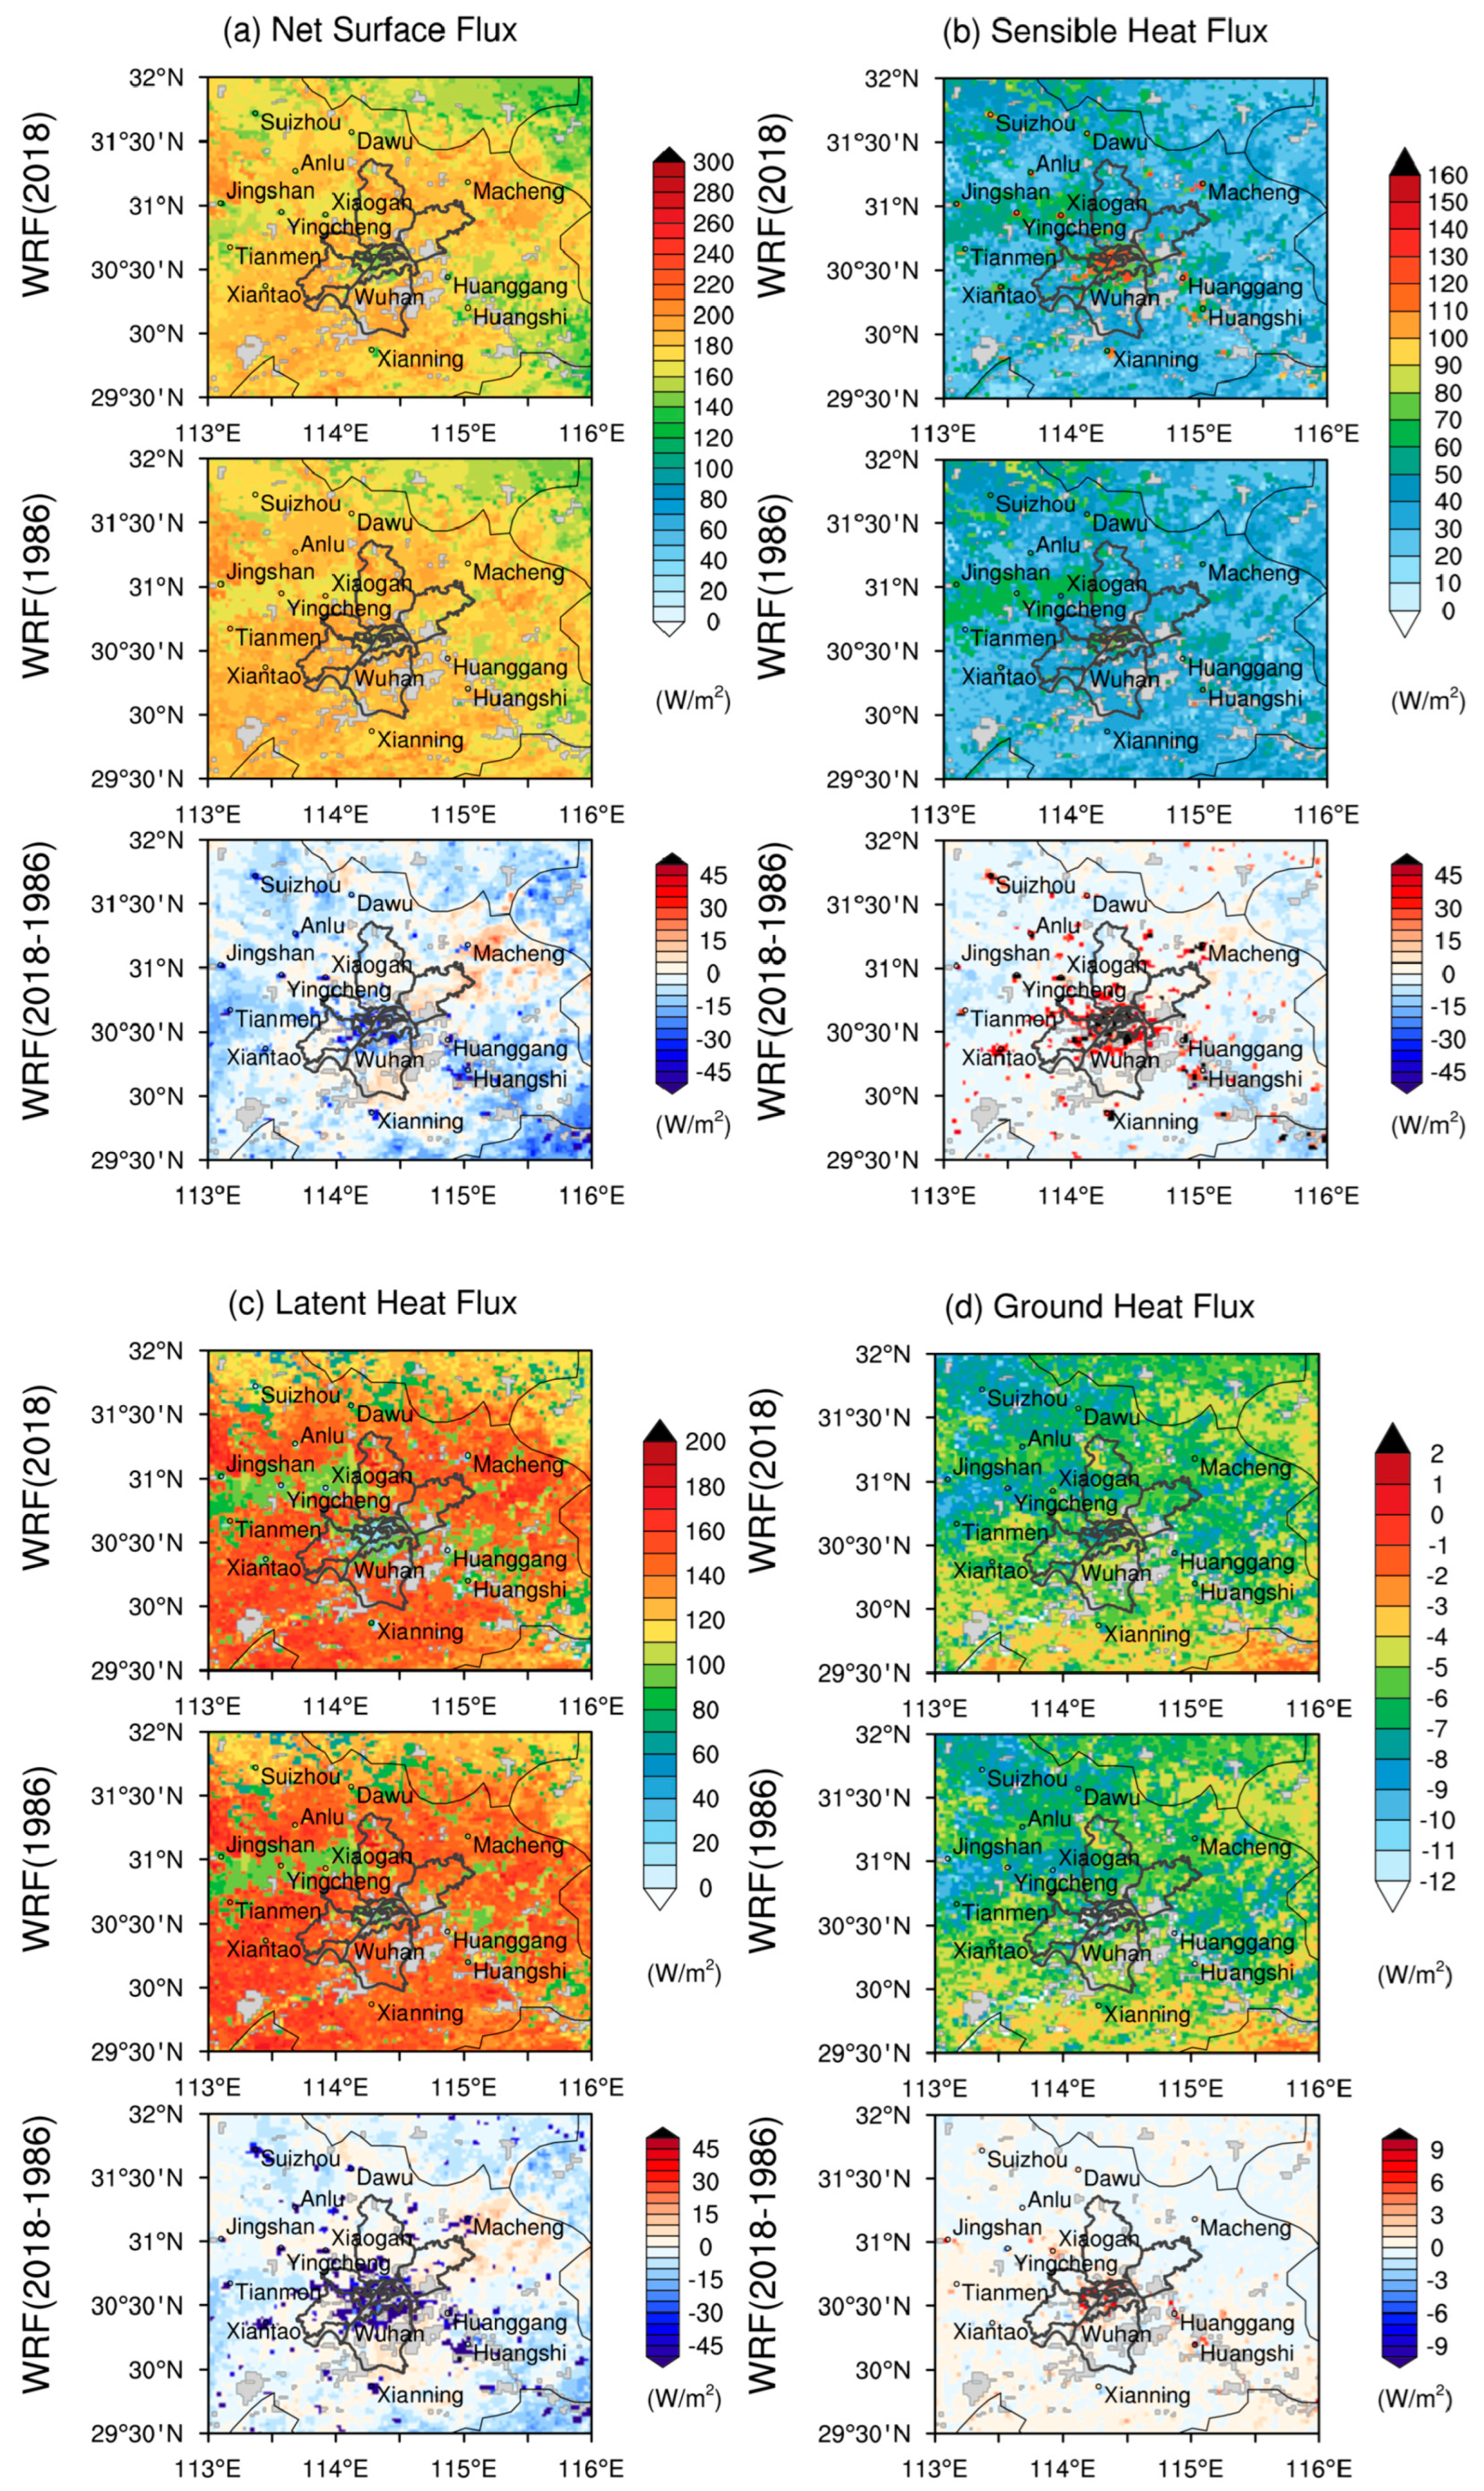
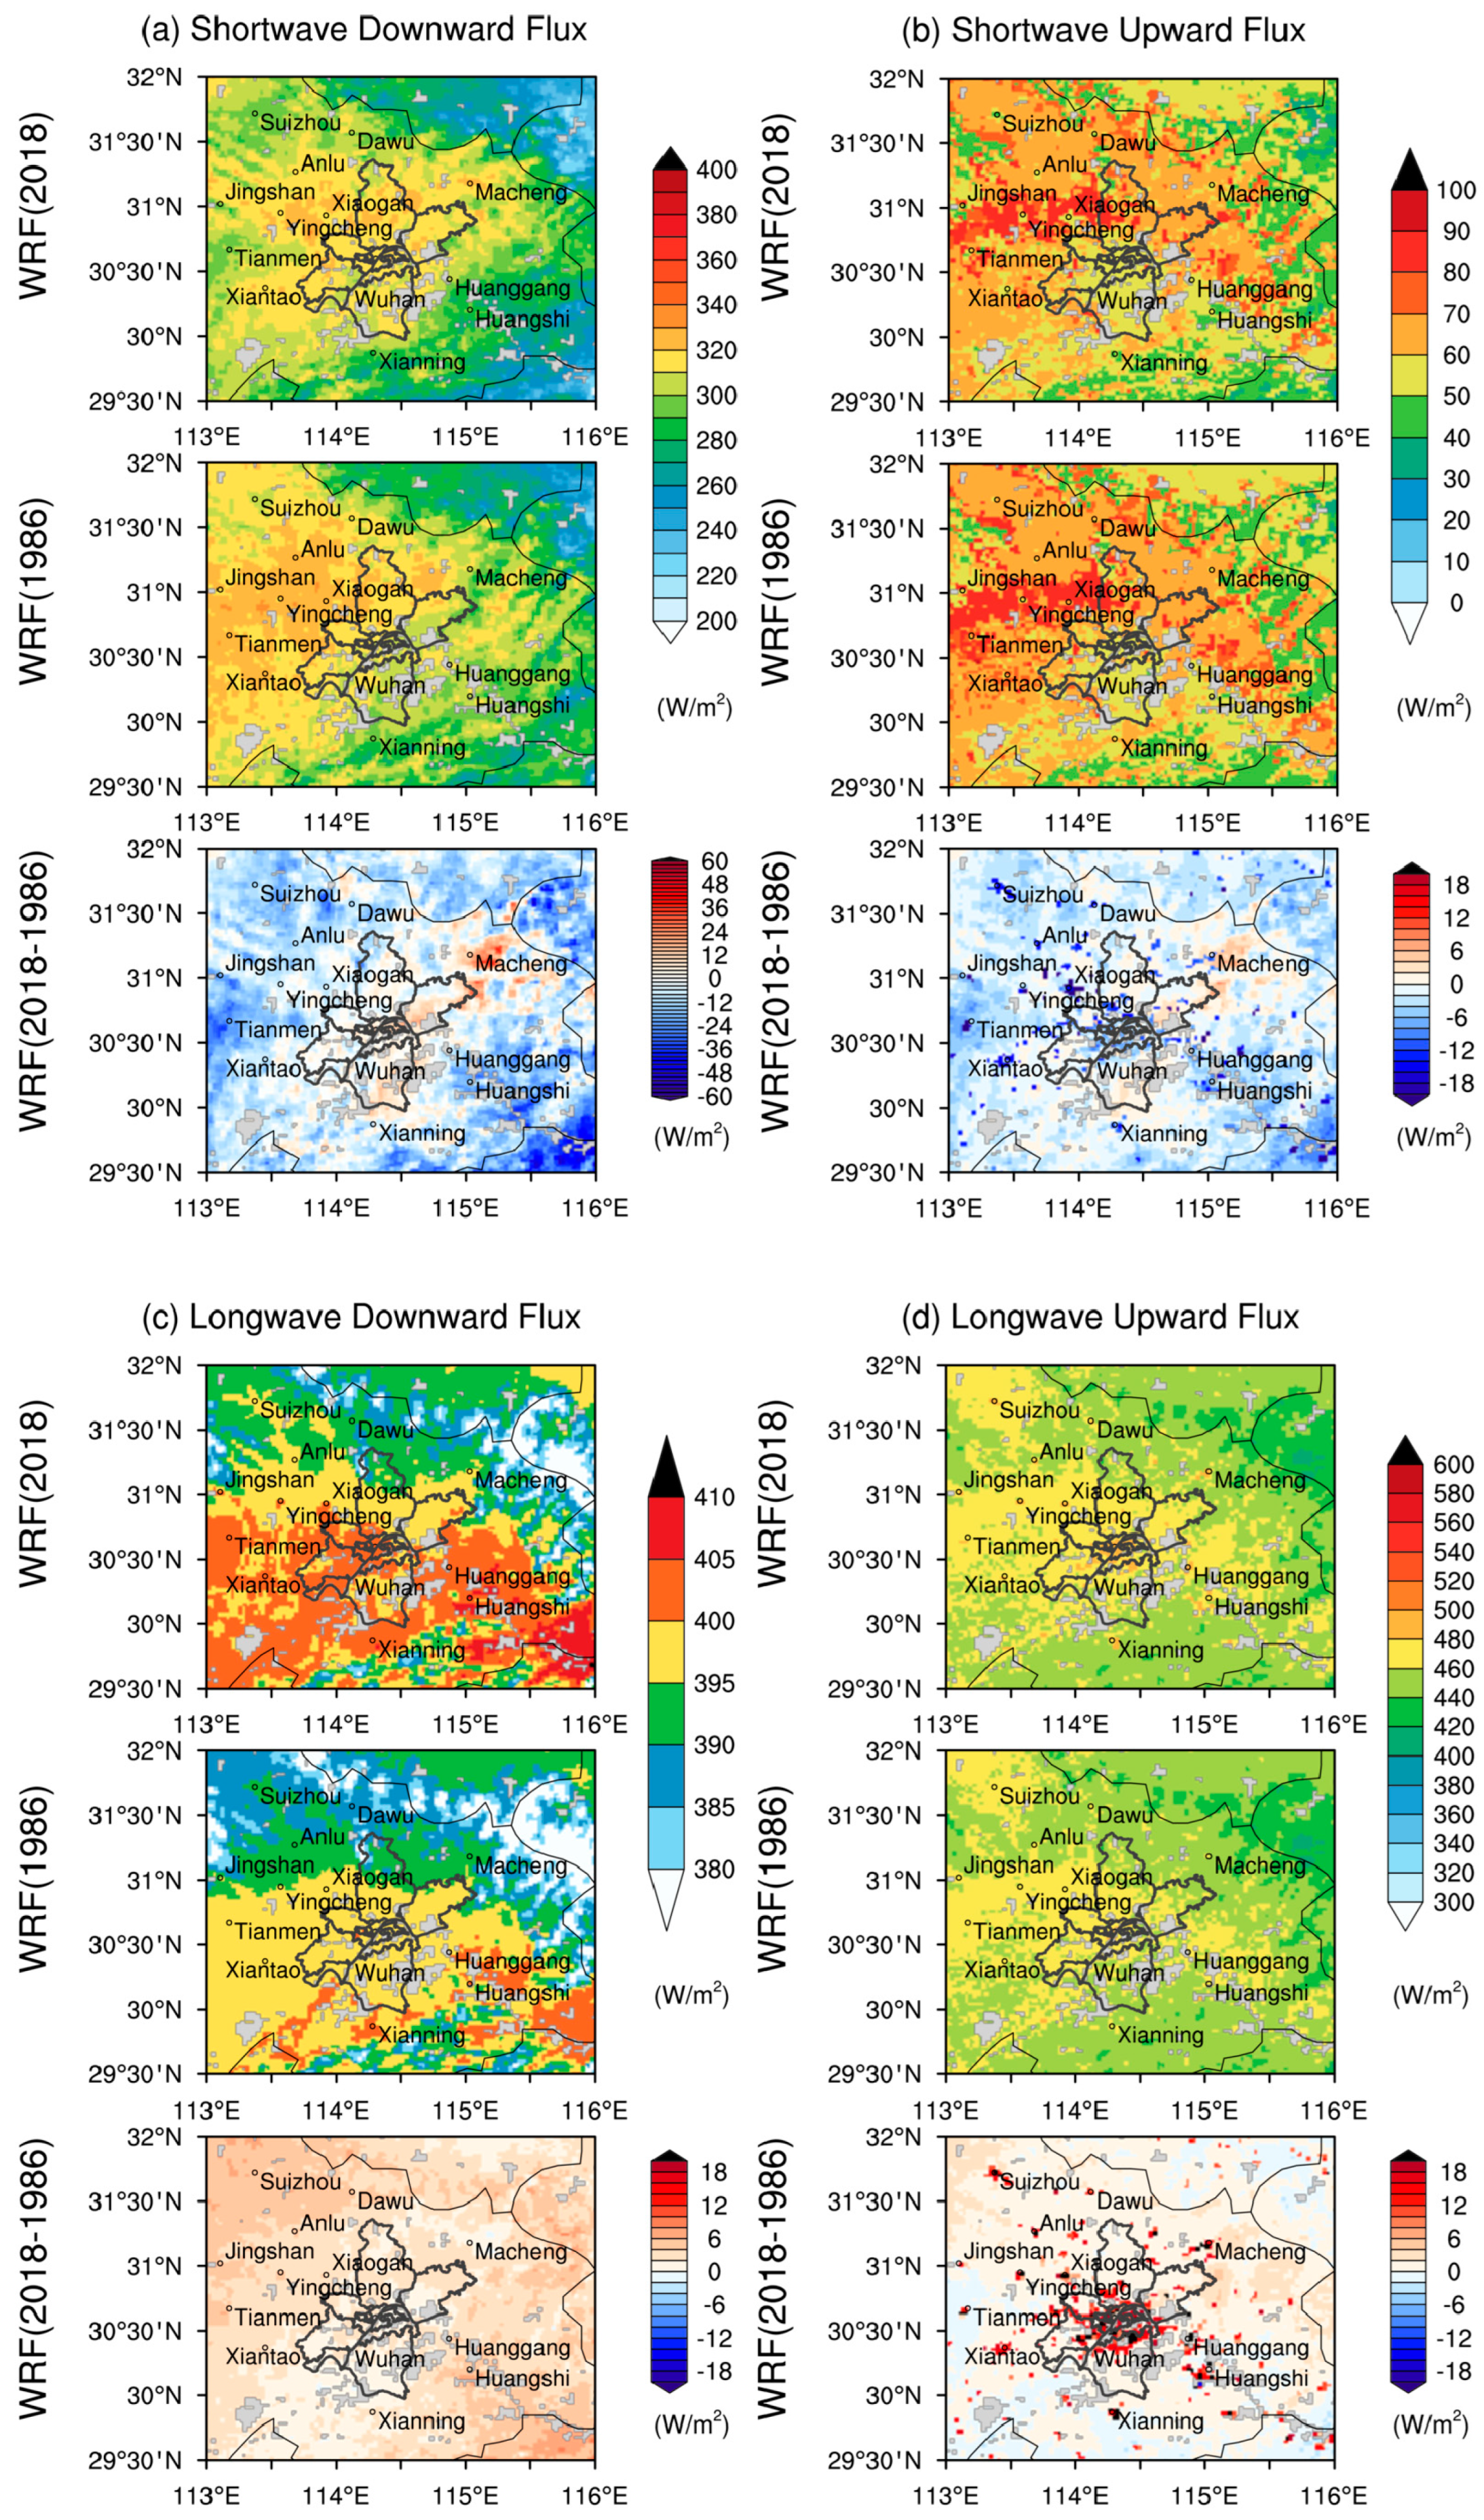
3.3. Impacts on Surface Energy Budget

The surface air temperature is influenced by several factors, such as incoming radiation, participation of sensible and latent heat flux, as well as advection. Therefore, examining the spatial and temporal variations in the components of surface energy balance would lead to further understanding of the physical mechanisms of climate change due to urban expansion.
The surface energy budget is further examined to improve the understanding of the physical drivers of surface temperature changes. Figure 7 illustrates the spatial distribution of net radiation flux (Rn), sensible heat flux (SH), latent heat flux (LH), and ground heat flux (GFX) differences between the experiments URBAN_2018 and URBAN_1986. Our results show an increase in sensible heat flux with a magnitude of 24.7 ± 20.0 W/m2 and a decrease in latent heat flux with a magnitude of −36.5 ± 34.5 W/m2 averaged over the urban grids in 2018. The magnitude of ground heat flux change is much lower than the aforementioned two components with an average value of 1.4 ± 2.5 W/m2. The surface net radiation changes with a magnitude of −5.1 ± 19.4 W/m2.
The diurnal variations of the surface energy components are compared between experiments URBAN_2018 and URBAN_1986 for the urban grid cells in 2018, as illustrated in Figure 8. When compared to URBAN_1986, the URBAN_2018 simulation results in small changes to the surface energy budget over urban areas. Our results show an increase in sensible heat flux with a magnitude of 5.1 W/m2 and a decrease in latent heat flux with a magnitude of −13.6 W/m2 averaged over the urban grids in 2018. These effects are much greater in daytime than in nighttime. Ground heat flux decreases with a magnitude of −3.2 W/m2 averaged over the urban grids in 2018. It decreases during the daytime (storage of absorbed solar energy), while it rises in the nighttime (release of the energy from the urban ground).
We further examined the spatial distribution of four energy components: shortwave downward flux (SWD), shortwave upward flux (SWU), longwave downward flux (LWD), and longwave upward flux (LWU). As shown in Figure 9, urbanization leads to decreased SWU with a magnitude of −11.4 ± 8.7 W/m2, which is in line with decreased albedo, and increased LWU with a magnitude of 11.8 ± 7.8 W/m2, corresponding to increased skin temperature in urban agglomeration. The SWD tends to decrease over most parts of the study area and more prominently over urban agglomerations with a magnitude of −8.7 ± 16.7 W/m2, which might be explained by cloud fraction changes. The LWD increase can be discerned over the entire region and is more pronounced over urbanized areas with a magnitude of 3.7 ± 1.7 W/m2.

3.4. Impacts on Planetary Boundary Layer Height and 2 m Water Vapor Content

The PBLH and humidity changes are further investigated. As shown in Figure 10, although there is a slight background decrease over the region, the PBLH increases prominently over the urbanized areas with its maximum value over 100 m. In contrast to the PBLH, the 2 m water vapor mixing ratio decreases over most urbanized areas, which can reach −2 g/kg. The higher surface roughness and sensible heat flux might explain the increase in the PBLH.

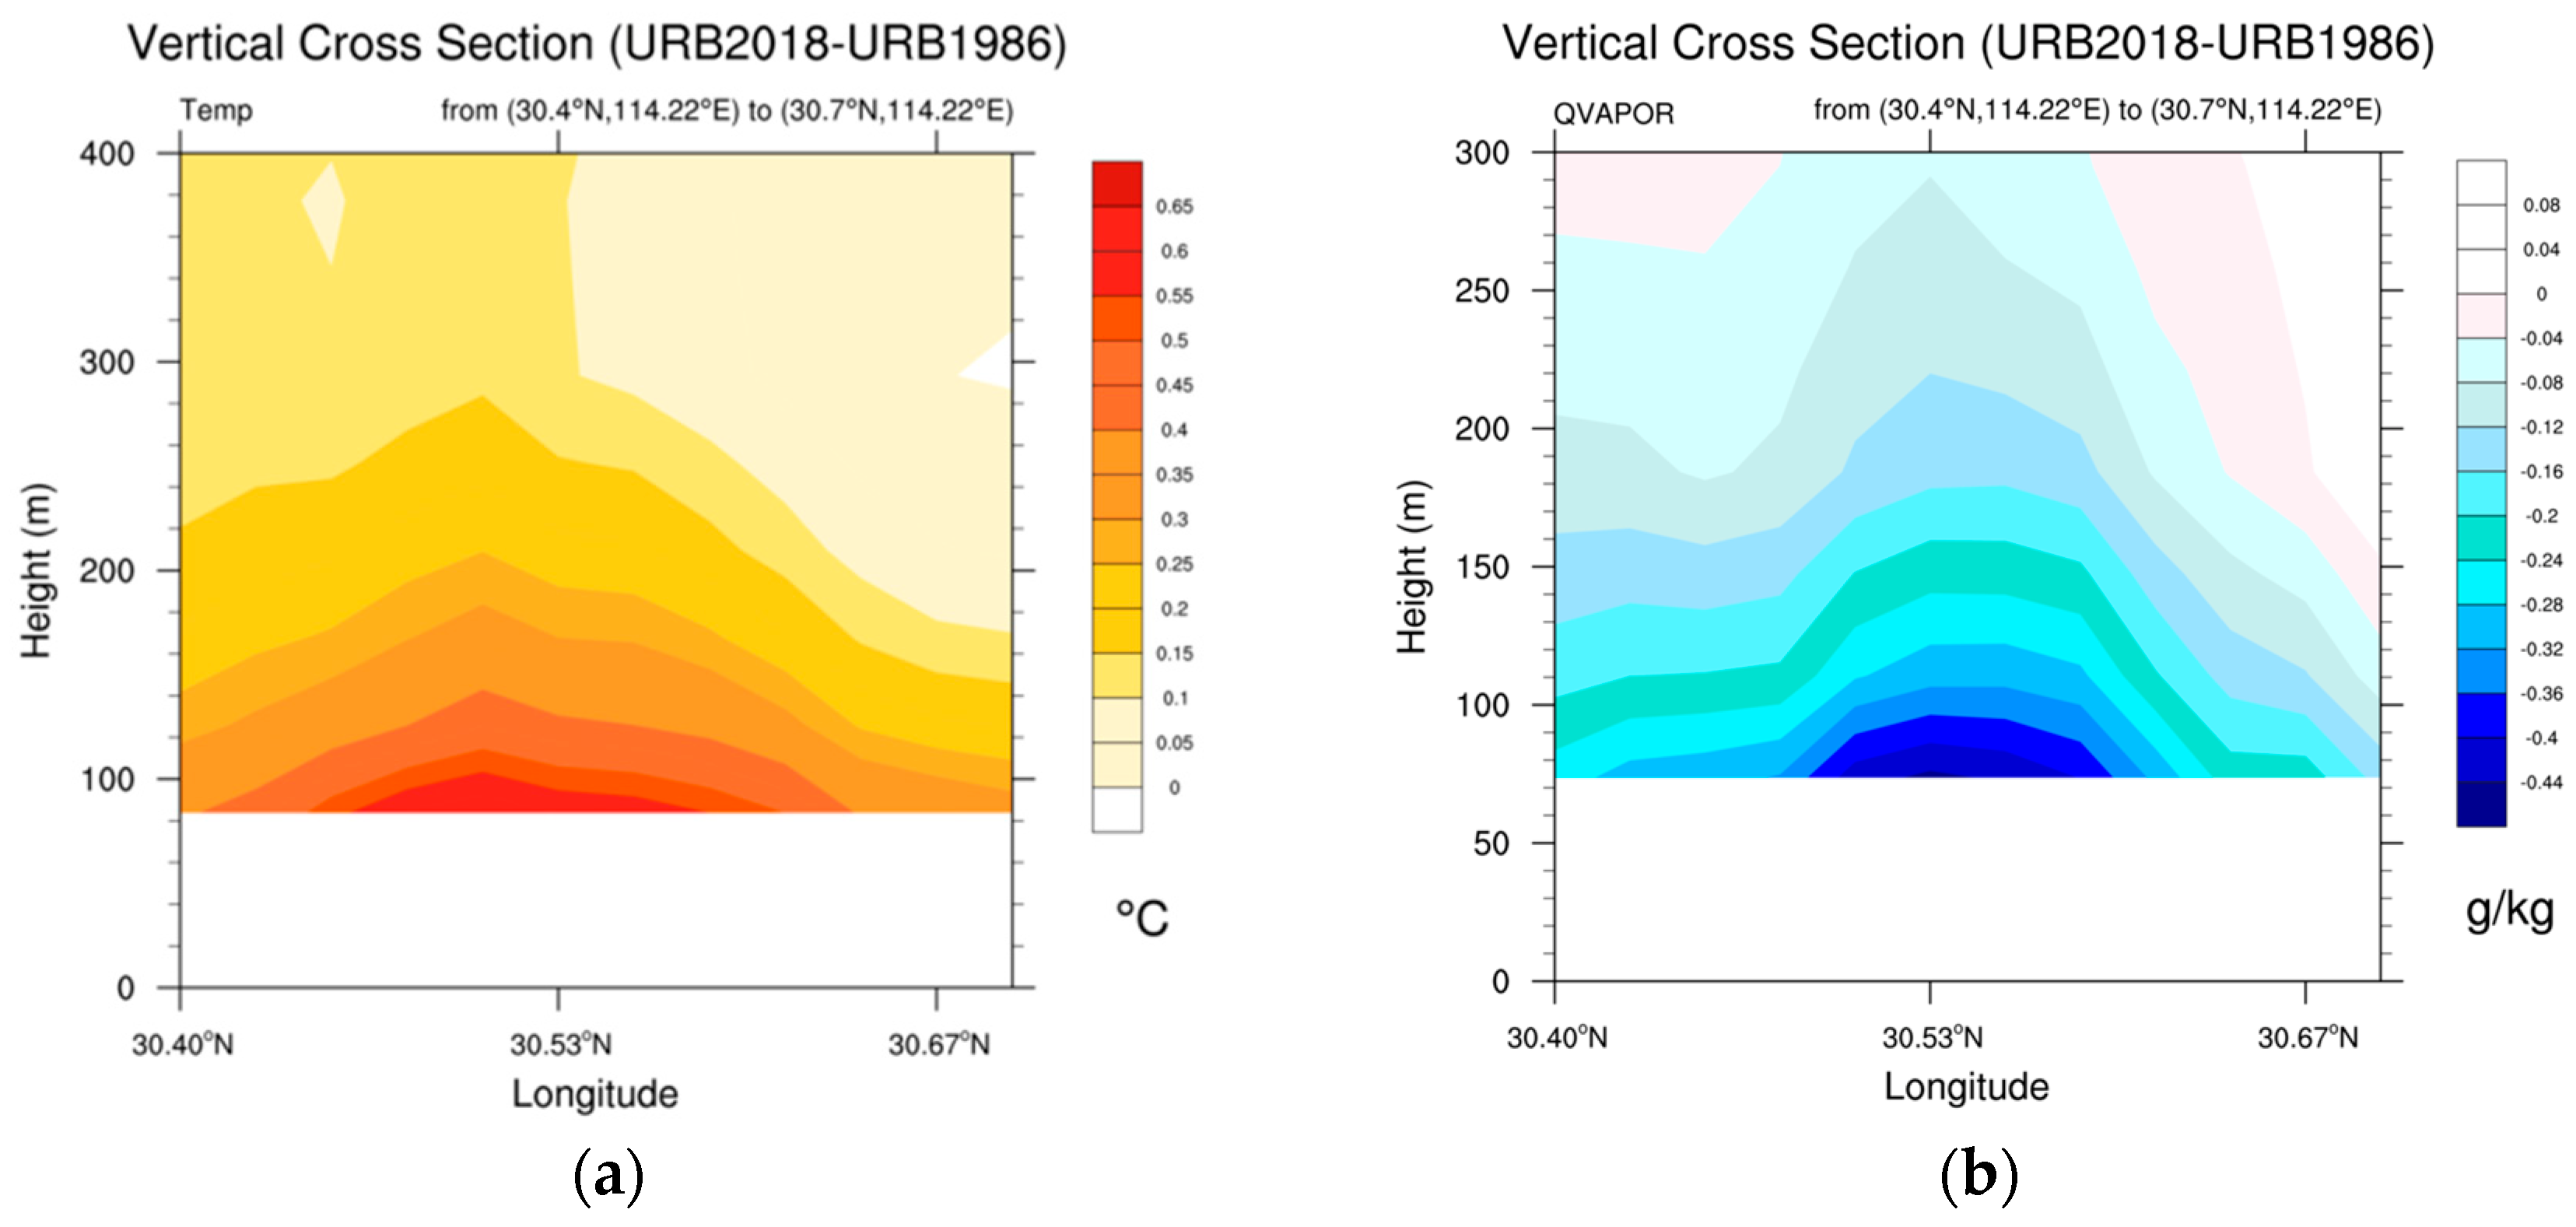
3.5. Vertical Distribution of Air Temprature and Water Vapor Mixing Ratio

In order to investigate how high the urbanization effect penetrated into the overlying atmosphere, the cross-section along the core city of Wuhan (along 114.22° E from 30.40 to 30.70° N) was selected to examine the effects of urbanization. Figure 11 illustrates the air temperature and the water vapor mixing ratio differences above the urban area between the experiments URBAN_2018 and URBAN_1986. It seems that urbanization increases the air temperature and that the heating effects of urbanization may extend to approximately 0.3 km above ground level with a maximum of 0.65 °C near the ground (Figure 11a). The decline of the water vapor mixing ratio also occurs below 0.3 km with its peak value beyond −0.44 g/kg near the ground (Figure 11b).

4. Discussion

Our results show that urban expansion-induced summer warming effects are around 0.63 °C throughout the urban areas in the greater Wuhan region. This magnitude is less than 1.42 °C, 1.74 °C, and 1.27 °C for three vast urban agglomerations of BTH, YRD, and PRD, as reported by a previous study using urban versus nonurban landscapes [15]. Another study focusing on BTH also adopted an ideal scenario via replacing urban lands with croplands, which showed warming effects of more than 1 °C in urban areas, and the maximum difference was almost 2 °C [22]. Our results are comparable to previous results [18] using realistic scenarios of 0.85 °C, 0.78 °C, and 0.57 °C for three vast urban agglomerations of BTH, YRD, and PRD.
The discrepancies between the present study and that of Cao et al. [18] can be summarized as the following aspects. Firstly, the two studies focus on different study regions. The urbanization extent, intensity, and form as well as the background climate of the greater Wuhan area are different from those of BTH, YRD, and PRD. In addition, they use distinct analysis periods. Finally, the methods of representing urban types are also different. In the present work, the urban land cover at the original 30 m resolution is utilized to calculate urban fraction, which is further converted into three urban types according to corresponding thresholds. In the study of Cao et al. [18], only one urban type (high-intensity) is used in an urban model, which is derived from the 1 km land classification of Ma et al. [38] with a 1 km resolution. Compared with their single category, the usage of three urban types is expected to better present the spatial heterogeneity.
Regarding the surface energy balance, results show that urbanization leads to higher sensible heat flux and lower latent heat flux over built environments. In this study, the absolute change magnitude in latent heat flux was slightly larger than that of sensible heat flux and much larger than ground heat flux and net radiation flux, which is in accordance with the physical principles and the previous modeling studies focusing on other cities or urban clusters [15,17,18,22,39]. Urbanization decreases the surface albedo, which leads to decreases in the upward shortwave radiation. It also generates a higher outgoing longwave radiation, which might be attributed to a higher land surface temperature in urban areas. This is in agreement with previous studies [30].
In the present study, the effects of urbanization on air temperature and water vapor mixing ratio could extend to the height of 0.5 km over the core city. These findings are similar with previous work throughout the Beijing area [22,40]. The simulated changes in the atmosphere imply that warming in urban areas may enhance convection over the city and make its boundary layer unstable.
There are several limitations in the present work. Since a single model was used, the simulation results have a dependence on the model characteristics and configuration. In this respect, multi-model and multi-physics ensembles could be applied in extended studies to constrain the uncertainty. Moreover, due to limited accessible computational resources, the current study only investigated surface states in 1986 and 2018 using 12-day simulation results. Future studies will perform continuous simulations on a climatic (~30 years) period and investigate climate effects at diurnal, daily, and seasonal time scales.
In addition, spatial resolution can affect regional climate modeling results. Numerous studies have addressed the numerical sensitivity to model grid spacing [41,42]. In future studies, a range of spatial resolutions to evaluate the sensitivity to horizontal and vertical grid spacing on simulated climate impacts of urban expansion should also be considered.
Model internal variability, which results from nonlinearities in the model physics and dynamics [43,44], is another factor worth discussing. A multi-member ensemble approach is commonly used by the regional climate modeling community to disentangle the reproducible and irreproducible components of climate variability [43,45]. Defined as the difference between realization members where the only differences are the initial conditions, internal variability within RCMs has been addressed by initial condition ensembles [43,46,47,48,49,50,51].
Anthropogenic heat (AH) release from vehicles, building sectors, industry, and human metabolisms [52] is also an important contributing factor for urban warming [16,25,52]. Although it varies spatially and temporally in reality, this factor has been often ignored or overly simplified in many urban climate modeling studies [53,54]. In the present work, an AH base value is fixed arbitrarily as the default in the WRF-SLUCM model due to the lake of observation datasets, which might not be suitable for the study area. Moreover, the diurnal variation curve is fixed without seasonal change. Recently, Chen et al. [55] developed a spatially heterogeneous AH database; their approach can be employed in future studies to achieve more realistic simulation results.
It should be noted that the present study mainly focuses on the biophysical impact induced by urban expansion, such as the albedo, vegetation fraction, roughness, and thermal properties alteration. Nevertheless, urbanization is a complex process also involving the chemical effects. For example, the air pollutants released would influence the atmosphere radiation process as well as clouds and precipitation over the urban areas [56,57,58]. Future studies may take these effects into consideration.
The greater Wuhan area belongs to a subtropical monsoon humid climate with abundant rainfall and sunshine. The results obtained from this study might be generalized to urban expansion cases in other regions with similar background climates. Although our focus is the greater Wuhan area, the modeling approach using realistic scenarios in this work will be extended to other rapidly expanding metropolitan areas.
Since urbanization is rapidly overtaking China as well as other developing countries and will continue to do so, it is necessary to understand the effects of these processes on the regional climates. The findings in the present study are helpful both in improving urban comfort level and in designing better disaster response plans for extreme events such as heat waves. The results will support policymakers in making decisions when dealing with climate-related issues occurring in highly urbanized areas.

5. Conclusions

The main objective of this paper is to quantify the regional climate impact of urbanization over the greater Wuhan area using numerical modeling. High resolution satellite-derived impervious datasets were incorporated into the WRF-SLUCM modeling system to describe urban surface heterogeneity. Simulated surface air temperatures were evaluated against the CMFD gridded observations, which show reasonable agreements.
Two sensitivity experiments were carried out with identical large-scale force with different urban surface states corresponding to the years 1986 and 2018, respectively. Through the comparison of these contrasting simulation results from 1 July 2015 to 12 July 2015, the biophysical climate effects due to urbanization were isolated. The spatial and diurnal variations in surface air temperature, surface skin temperature, and surface energy budget were analyzed. The main conclusions include the following:
(1)
Urban expansion leads to increases of 0.63 °C and 0.83 °C for an average 2 m air temperature and surface skin temperature over urban areas. Both T2m and Tskin present more pronounced warming in nighttime (with average magnitudes of 0.88 °C and 1.09 °C) than in daytime (with average magnitudes of 0.42 °C and 0.62 °C).
(2)
Urbanization leads to surface sensible heat flux increases of 24.7 ± 20.0 W/m2 and latent heat flux decreases of −36.5 ± 34.5 W/m2. These effects are much greater in daytime than in nighttime. Ground heat flux changes with a magnitude of 1.4 ± 2.5 W/m2. It decreases during the daytime but rises during the nighttime.
(3)
The PBLH increases over urbanized areas with its maximum value over 100 m. The 2 m water vapor mixing ratio decreases over most urbanized areas, which can reach −2 g/kg.
(4)
The urbanization effect can penetrate the overlying atmosphere. The cross-section around Wuhan city (along 114.22°E from 30.40 to 30.70°N) shows that urbanization increases air temperature and that the heating effect of urbanization may extend to approximately 0.3 km above ground level with a maximum of 0.65 °C near the ground. The decline of the water vapor mixing ratio also occurs below 0.3 km with its peak value beyond −0.44 g/kg near the ground.
Overall, the results of this study indicate that historical urban expansion has significant impacts on the regional climate of the study area. These findings provide critical knowledge that improves our understanding of land–atmospheric interactions. The current work may benefit studies on mitigation strategies in urban environments in regard to regional climate change.

Funding

This research received no external funding.

Institutional Review Board Statement

Not applicable.

Informed Consent Statement

Not applicable.

Data Availability Statement

Data is contained within the article. The data presented in this study are available in this article.

Acknowledgments

The authors would like to thank Werner at NCAR for her helpful advice on various technical issues relative to WRF simulation. The authors acknowledge support of Hubei Meteorological Service and China Meteorological Administration (CMA) for providing daily gridded and station meteorological datasets. All the simulations described in this study were carried out with the facilities of the Center for High Performance Computing at Wuhan University.

Conflicts of Interest

The author declares no conflicts of interest.

References

  1. Oke, T.R. The energetic basis of the urban heat island. Q. J. R. Meteorol. Soc. 1982, 108, 1–24. [Google Scholar] [CrossRef]
  2. de Foy, B.; Molina, L.T.; Molina, M.J. Satellite-derived land surface parameters for mesoscale modelling of the Mexico City basin. Atmos. Chem. Phys. 2006, 6, 1315–1330. [Google Scholar] [CrossRef]
  3. Li, M.M.; Song, Y.; Huang, X.; Li, J.F.; Mao, Y.; Zhu, T.; Cai, X.H.; Liu, B. Improving mesoscale modeling using satellite-derived land surface parameters in the Pearl River Delta region, China. J. Geophys. Res. Atmos. 2014, 119, 6325–6346. [Google Scholar] [CrossRef]
  4. Ludwig, F.L.; Dabberdt, W.F. Effects of urbanization on turbulent diffusion and mixing depth. Int. J. Biometeorol. 1973, 17, 1–11. [Google Scholar] [CrossRef]
  5. Yang, L.; Smith, J.A.; Baeck, M.L.; Bou-Zeid, E.; Jessup, S.M.; Tian, F.Q.; Hu, H.P. Impact of Urbanization on Heavy Convective Precipitation under Strong Large-Scale Forcing: A Case Study over the Milwaukee-Lake Michigan Region. J. Hydrometeorol. 2014, 15, 261–278. [Google Scholar] [CrossRef]
  6. Jones, P.D.; Lister, D.H.; Li, Q. Urbanization effects in large-scale temperature records, with an emphasis on China. J. Geophys. Res. Atmos. 2008, 113, 9916. [Google Scholar] [CrossRef]
  7. Ren, G.Y.; Zhou, Y.Q.; Chu, Z.Y.; Zhou, J.X.; Zhang, A.Y.; Guo, J.; Liu, X.F. Urbanization effects on observed surface air temperature trends in north China. J. Clim. 2008, 21, 1333–1348. [Google Scholar] [CrossRef]
  8. Kalnay, E.; Cai, M. Impact of urbanization and land-use change on climate. Nature 2003, 423, 528–531. [Google Scholar] [CrossRef]
  9. Zhou, L.; Dickinson, R.E.; Tian, Y.; Fang, J.; Li, Q.; Kaufmann, R.K.; Tucker, C.J.; Myneni, R.B. Evidence for a significant urbanization effect on climate in China. Proc. Natl. Acad. Sci. 2004, 101, 9540–9544. [Google Scholar] [CrossRef]
  10. Miao, S.; Chen, F.; Lemone, M.A.; Tewari, M.; Li, Q.; Wang, Y. An Observational and Modeling Study of Characteristics of Urban Heat Island and Boundary Layer Structures in Beijing. J. Appl. Meteorol. Climatol. 2009, 48, 484–501. [Google Scholar] [CrossRef]
  11. Chen, F.; Yang, X.; Zhu, W. WRF simulations of urban heat island under hot-weather synoptic conditions: The case study of Hangzhou City, China. Atmos. Res. 2014, 138, 364–377. [Google Scholar] [CrossRef]
  12. Yang, B.; Zhang, Y.C.; Qian, Y. Simulation of urban climate with high-resolution WRF model: A case study in Nanjing, China. Asia-Pac. J. Atmos. Sci. 2012, 48, 227–241. [Google Scholar] [CrossRef]
  13. Georgescu, M.; Moustaoui, M.; Mahalov, A.; Dudhia, J. Summer-time climate impacts of projected megapolitan expansion in Arizona. Nat. Clim. Change 2013, 3, 37–41. [Google Scholar] [CrossRef]
  14. Vahmani, P.; Ban-Weiss, G.A. Impact of remotely sensed albedo and vegetation fraction on simulation of urban climate in WRF-urban canopy model: A case study of the urban heat island in Los Angeles. J. Geophys. Res. Atmos. 2016, 121, 1511–1531. [Google Scholar] [CrossRef]
  15. Wang, J.; Feng, J.M.; Yan, Z.W.; Hu, Y.H.; Jia, G.S. Nested high-resolution modeling of the impact of urbanization on regional climate in three vast urban agglomerations in China. J. Geophys. Res. Atmos. 2012, 117. [Google Scholar] [CrossRef]
  16. Feng, J.M.; Wang, Y.L.; Ma, Z.G.; Liu, Y.H. Simulating the Regional Impacts of Urbanization and Anthropogenic Heat Release on Climate across China. J. Clim. 2012, 25, 7187–7203. [Google Scholar] [CrossRef]
  17. Lin, S.; Feng, J.; Wang, J.; Hu, Y. Modeling the contribution of long-term urbanization to temperature increase in three extensive urban agglomerations in China. J. Geophys. Res. Atmos. 2016, 121, 1683–1697. [Google Scholar] [CrossRef]
  18. Cao, Q.; Yu, D.Y.; Georgescu, M.; Wu, J.G. Impacts of urbanization on summer climate in China: An assessment with coupled land-atmospheric modeling. J. Geophys. Res. Atmos. 2016, 121, 10505–10521. [Google Scholar] [CrossRef]
  19. Bounoua, L.; Zhang, P.; Mostovoy, G.; Thome, K.; Masek, J.; Imhoff, M.; Shepherd, M.; Quattrochi, D.; Santanello, J.; Silva, J.; et al. Impact of urbanization on US surface climate. Environ. Res. Lett. 2015, 10, 84010. [Google Scholar] [CrossRef]
  20. Chen, L.; Frauenfeld, O.W. Impacts of urbanization on future climate in China. Clim. Dyn. 2016, 47, 345–357. [Google Scholar] [CrossRef]
  21. Argüeso, D.; Evans, J.P.; Fita, L.; Bormann, K.J. Temperature response to future urbanization and climate change. Clim. Dyn. 2014, 42, 2183–2199. [Google Scholar] [CrossRef]
  22. Wang, M.; Zhang, X.; Yan, X. Modeling the climatic effects of urbanization in the Beijing–Tianjin–Hebei metropolitan area. Theor. Appl. Climatol. 2013, 113, 377–385. [Google Scholar] [CrossRef]
  23. Goswami, P.; Shivappa, H.; Goud, B.S. Impact of urbanization on tropical mesoscale events: Investigation of three heavy rainfall events. Meteorol. Z. 2010, 19, 385–397. [Google Scholar] [CrossRef]
  24. Wang, X.M.; Liao, J.B.; Zhang, J.; Shen, C.; Chen, W.H.; Xia, B.C.; Wang, T.J. A Numeric Study of Regional Climate Change Induced by Urban Expansion in the Pearl River Delta, China. J. Appl. Meteorol. Climatol. 2014, 53, 346–362. [Google Scholar] [CrossRef]
  25. Feng, J.M.; Wang, Y.L.; Ma, Z.G. Long-term simulation of large-scale urbanization effect on the East Asian monsoon. Clim. Change 2015, 129, 511–523. [Google Scholar] [CrossRef]
  26. Lo, J.C.F.; Lau, A.K.H.; Chen, F.; Fung, J.C.H.; Leung, K.K.M. Urban modification in a mesoscale model and the effects on the local circulation in the Pearl River Delta region. J. Appl. Meteorol. Climatol. 2007, 46, 457–476. [Google Scholar] [CrossRef]
  27. Li, M.M.; Mao, Z.C.; Song, Y.; Liu, M.X.; Huang, X. Impacts of the Decadal Urbanization on Thermally Induced Circulations in Eastern China. J. Appl. Meteorol. Climatol. 2015, 54, 259–282. [Google Scholar] [CrossRef]
  28. Wang, M.N.; Xiong, Z.; Yan, X.D. Modeling the climatic effects of the land use/cover change in eastern China. Phys. Chem. Earth 2015, 87–88, 97–107. [Google Scholar] [CrossRef]
  29. Zhang, N.; Gao, Z.; Wang, X.; Chen, Y. Modeling the impact of urbanization on the local and regional climate in Yangtze River Delta, China. Theor. Appl. Climatol. 2010, 102, 331–342. [Google Scholar] [CrossRef]
  30. Zhao, G.; Dong, J.; Cui, Y.; Liu, J.; Zhai, J.; He, T.; Zhou, Y.; Xiao, X. Evapotranspiration-dominated biogeophysical warming effect of urbanization in the Beijing-Tianjin-Hebei region, China. Clim. Dyn. 2019, 52, 1231–1245. [Google Scholar] [CrossRef]
  31. Ke, X.L.; Wu, F.; Ma, C.X. Scenario Analysis on Climate Change Impacts of Urban Land Expansion under Different Urbanization Patterns: A Case Study of Wuhan Metropolitan. Adv. Meteorol. 2013, 2013, 293636. [Google Scholar] [CrossRef]
  32. Skamarock, W.C.; Klemp, J.B. A time-split nonhydrostatic atmospheric model for weather research and forecasting applications. J. Comput. Phys. 2008, 227, 3465–3485. [Google Scholar] [CrossRef]
  33. Dee, D.P.; Uppala, S.M.; Simmons, A.J.; Berrisford, P.; Poli, P.; Kobayashi, S.; Andrae, U.; Balmaseda, M.A.; Balsamo, G.; Bauer, P.; et al. The ERA-Interim reanalysis: Configuration and performance of the data assimilation system. Q. J. R. Meteorol. Soc. 2011, 137, 553–597. [Google Scholar] [CrossRef]
  34. Kusaka, H.; Kimura, F. Coupling a single-layer urban canopy model with a simple atmospheric model: Impact on urban heat island simulation for an idealized case. J. Meteorol. Soc. Jpn. 2004, 82, 67–80. [Google Scholar] [CrossRef]
  35. Kusaka, H.; Kondo, H.; Kikegawa, Y.; Kimura, F. A simple single-layer urban canopy model for atmospheric models: Comparison with multi-layer and slab models. Bound.-Layer Meteorol. 2001, 101, 329–358. [Google Scholar] [CrossRef]
  36. Gong, P.; Xuecao, L.; Wang, J.; Bai, Y.; Chen, B.; Ty, H.; Liu, X.; Xu, B.; Yang, J.; Zhang, W.; et al. Annual maps of global artificial impervious area (GAIA) between 1985 and 2018. Remote Sens. Environ. 2019, 236, 111510. [Google Scholar] [CrossRef]
  37. He, J.; Yang, K.; Tang, W.; Lu, H.; Qin, J.; Chen, Y.; Li, X. The first high-resolution meteorological forcing dataset for land process studies over China. Sci. Data 2020, 7, 25. [Google Scholar] [CrossRef]
  38. Ma, Q.; He, C.; Wu, J.; Liu, Z.; Zhang, Q.; Sun, Z. Quantifying spatiotemporal patterns of urban impervious surfaces in China: An improved assessment using nighttime light data. Landsc. Urban Plan. 2014, 130, 36–49. [Google Scholar] [CrossRef]
  39. Georgescu, M.; Miguez-Macho, G.; Steyaert, L.T.; Weaver, C.P. Climatic effects of 30 years of landscape change over the Greater Phoenix, Arizona, region: 1. Surface energy budget changes. J. Geophys. Res. Atmos. 2009, 114. [Google Scholar]
  40. Miao, S.; Li, Q.; Fan, S. Month-averaged impacts of urbanization on atmospheric boundary layer structure and precipitation in summer in Beijing area. Chin. J. Geophys. 2010, 53, 1580–1593. [Google Scholar]
  41. Stevens, B.; Ackerman, A.; Bretherton, C.; Chlond, A.; Roode, S.R.; Edwards, J.; Golaz, J.-C.; Khairoutdinov, M.; Kirkpatrick, M.; Lewellen, D.; et al. Evaluation of Large-Eddy Simulations via Observations of Nocturnal Marine Stratocumulus. Mon. Weather Rev. 2005, 133, 1443–1462. [Google Scholar] [CrossRef]
  42. Jung, S.-H.; Im, E.-S.; Han, S.-O. The effect of topography and sea surface temperature on heavy snowfall in the Yeongdong region: A case study with high resolution WRF simulation. Asia-Pac. J. Atmos. Sci. 2012, 48, 259–273. [Google Scholar] [CrossRef]
  43. Giorgi, F.; Bi, X. A study of internal variability of a regional climate model. J. Geophys. Res. Atmos. 2000, 105, 29503–29521. [Google Scholar] [CrossRef]
  44. Christensen, O.B.; Gaertner, M.A.; Prego, J.A.; Polcher, J. Internal variability of regional climate models. Clim. Dyn. 2001, 17, 875–887. [Google Scholar] [CrossRef]
  45. Separovic, L.; de Elía, R.; Laprise, R. Reproducible and Irreproducible Components in Ensemble Simulations with a Regional Climate Model. Mon. Weather Rev. 2008, 136, 4942–4961. [Google Scholar] [CrossRef]
  46. Bonekamp, P.N.J.; Collier, E.; Immerzeel, W.W. The Impact of Spatial Resolution, Land Use, and Spinup Time on Resolving Spatial Precipitation Patterns in the Himalayas. J. Hydrometeorol. 2018, 19, 1565–1581. [Google Scholar] [CrossRef]
  47. Crétat, J.; Macron, C.; Pohl, B.; Richard, Y. Quantifying internal variability in a regional climate model: A case study for Southern Africa. Clim. Dyn. 2011, 37, 1335–1356. [Google Scholar] [CrossRef]
  48. Fathalli, B.; Pohl, B.; Castel, T.; Safi, M.J. Errors and uncertainties in regional climate simulations of rainfall variability over Tunisia: A multi-model and multi-member approach. Clim. Dyn. 2019, 52, 335–361. [Google Scholar] [CrossRef]
  49. Laprise, R.; Kornic, D.; Rapaić, M.; Šeparović, L.; Leduc, M.; Nikiema, O.; Di Luca, A.; Diaconescu, E.; Alexandru, A.; Lucas-Picher, P.; et al. Considerations of Domain Size and Large-Scale Driving for Nested Regional Climate Models: Impact on Internal Variability and Ability at Developing Small-Scale Details. In Climate Change: Inferences from Paleoclimate and Regional Aspects; Springer: Vienna, Austria, 2012; pp. 181–199. [Google Scholar]
  50. Laux, P.; Nguyen, P.N.B.; Cullmann, J.; Van, T.P.; Kunstmann, H. How many RCM ensemble members provide confidence in the impact of land-use land cover change? Int. J. Climatol. 2017, 37, 2080–2100. [Google Scholar] [CrossRef]
  51. Lucas-Picher, P.; Caya, D.; Biner, S.; Laprise, R. Quantification of the Lateral Boundary Forcing of a Regional Climate Model Using an Aging Tracer. Mon. Weather Rev. 2008, 136, 4980–4996. [Google Scholar] [CrossRef]
  52. Sailor, D.J.; Lu, L. A top-down methodology for developing diurnal and seasonal anthropogenic heating profiles for urban areas. Atmos. Environ. 2004, 38, 2737–2748. [Google Scholar] [CrossRef]
  53. Sailor, D.J. A review of methods for estimating anthropogenic heat and moisture emissions in the urban environment. Int. J. Climatol. 2011, 31, 189–199. [Google Scholar] [CrossRef]
  54. Sailor, D.J.; Georgescu, M.; Milne, J.M.; Hart, M.A. Development of a national anthropogenic heating database with an extrapolation for international cities. Atmos. Environ. 2015, 118, 7–18. [Google Scholar] [CrossRef]
  55. Chen, F.; Yang, X.; Wu, J. Simulation of the urban climate in a Chinese megacity with spatially heterogeneous anthropogenic heat data. J. Geophys. Res. Atmos. 2016, 121, 5193–5212. [Google Scholar] [CrossRef]
  56. Rosenfeld, D. Suppression of Rain and Snow by Urban and Industrial Air Pollution. Science 2000, 287, 1793–1796. [Google Scholar] [CrossRef]
  57. van den Heever, S.C.; Cotton, W.R. Urban Aerosol Impacts on Downwind Convective Storms. J. Appl. Meteorol. Climatol. 2007, 46, 828–850. [Google Scholar] [CrossRef]
  58. Kaufmann, R.K.; Seto, K.C.; Schneider, A.; Liu, Z.; Zhou, L.; Wang, W. Climate Response to Rapid Urban Growth: Evidence of a Human-Induced Precipitation Deficit. J. Clim. 2007, 20, 2299–2306. [Google Scholar] [CrossRef]
Figure 1. Domains used in the WRF simulations: (a) first domain D01, (b) third domain D03. The rendered colormap denotes the elevation. Major cities are marked as black dots. The greater Wuhan area as analysis region is encircled by red rectangle.
Atmosphere 15 00185 g001
Figure 2. Land cover types of USGS classification for domain D03 in: (a) 1986 and (b) 2018 and for the greater Wuhan area in: (c) 1986 and (d) 2018.
Atmosphere 15 00185 g002
Figure 3. Percentage of major land cover types in Domain03 for URBAN_2018 and URBAN_1986.
Atmosphere 15 00185 g003
Figure 4. WRF simulated and CMFD observed daily maximum 2 m temperature, daily minimum 2 m temperature, and daily average 2 m temperature within (a) inner domain D03 and (b) analysis region. Values are averaged over the analysis period. The Wuhan metropolitan extent is outlined using gray lines.
Atmosphere 15 00185 g004
Figure 5. Differences of WRF simulated (a) average 2 m temperature and (b) average surface skin temperature between experiments URBAN_2018 and URBAN_1986.
Atmosphere 15 00185 g005
Figure 6. Simulated diurnal variations of (a) 2 m air temperature and (b) surface skin temperature from the experiments URBAN_2018 and URBAN_1986. Values are averages over all urban grid cells in 2018.
Atmosphere 15 00185 g006
Figure 7. Differences in WRF simulated (a) net surface radiation, (b) sensible heat flux, (c) latent heat flux, and (d) ground heat flux between experiments URBAN_2018 and URBAN_1986.
Atmosphere 15 00185 g007
Figure 8. Simulated diurnal variations of (a) surface net radiation flux, (b) sensible heat flux, (c) latent heat flux, and (d) ground heat flux from the experiments URBAN_2018 and URBAN_1986. Values are averages over all urban grid cells in 2018. Note that ground heat flux is positive downward.
Atmosphere 15 00185 g008
Figure 9. Differences of WRF simulated (a) downward shortwave flux, (b) upward shortwave flux, (c) downward longwave flux, and (d) upward longwave flux between experiments URBAN_2018 and URBAN_1986.
Atmosphere 15 00185 g009
Figure 10. Differences of WRF simulated (a) plenary boundary layer height and (b) 2 m water vapor mixing ratio between experiments URBAN_2018 and URBAN_1986.
Atmosphere 15 00185 g010
Figure 11. The distribution differences of time-averaged (a) air temperature and (b) water vapor mixing ratio between the experiments URBAN_2018 and URBAN_1986 perpendicular to the cross section along 114.22° E from 30.40 to 30.70° N.
Atmosphere 15 00185 g011
Table 1. Configurations of WRF model and input data.
Domain Setting/Boundary Condition/Physical SchemeOptions
Geographical Input1 km USGS land cover
dx, dy27 km, 9 km, 3 km
West–east (km)7452, 2403, 855
South–north (km)4698, 1431, 594
Vertical layers33
Boundary conditionsERA-Interim
MicrophysicsWSM6
LongwaveRRTMG
ShortwaveRRTMG
Land surface modelUnified Noah LSM
Cumulus schemeKF scheme 1
Boundary layerYSU scheme
1 The cumulus scheme KF is turned off for Domain 03.
Table 2. Urban parameters used in single layer urban climate model.
Urban ParameterLIRHIRCIT
Building height5.07.510.0
Road width8.39.410.0
Fraction of the urban landscape occupied by artificial materials0.50.90.95
Surface emissivity of roof/building wall/road0.90.90.9
Surface albedo of roof/building wall/road0.20.20.2
Anthropogenic heat205090
Hourly diurnal profile for anthropogenic heat (starting at 01:00 local time.)0.16 0.13 0.08 0.07 0.08 0.26 0.67 0.99 0.89 0.79 0.74 0.73 0.75 0.76 0.82 0.90 1.00 0.95 0.68 0.61 0.53 0.35 0.21 0.18
Table 3. Urban categories classified according to impervious percentage.
Urban CategoriesLabelImpervious Percentage
Low intensity residential3130–70%
High intensity residential3270–90%
Commercial/industrial/transportation3390–100%
Table 4. Design of experiments.
Experiment NameSpin-up PeriodAnalysis PeriodSummary
URBAN_19861 June 2015–30 June 20151 July–12 July 2015Urban state in 1986
URBAN_20181 June 2015–30 June 20151 July–12 July 2015Urban state in 2018
Disclaimer/Publisher’s Note: The statements, opinions and data contained in all publications are solely those of the individual author(s) and contributor(s) and not of MDPI and/or the editor(s). MDPI and/or the editor(s) disclaim responsibility for any injury to people or property resulting from any ideas, methods, instructions or products referred to in the content.

