Article

Potential Underestimate in Reported Bottom-up Methane Emissions from Oil and Gas Operations in the Delaware Basin

The Energy Institute, Colorado State University, Fort Collins, CO 80524, USA
*
Author to whom correspondence should be addressed.
Atmosphere 2024, 15(2), 202; https://doi.org/10.3390/atmos15020202
Submission received: 10 December 2023 / Revised: 12 January 2024 / Accepted: 29 January 2024 / Published: 5 February 2024
(This article belongs to the Section Atmospheric Techniques, Instruments, and Modeling)

Abstract

:
Methane is a greenhouse gas and identified as a key driver of near-term climate change. Bottom-up approaches estimate annual methane loss from US natural gas production and transport at 6 Tg, but recent studies suggest this may be an underestimate. To investigate this possibility, an equipment-based emissions inventory, using EPA emission factors, was developed to calculate methane emissions from oil and gas operations in the Delaware basin, USA. Emission factors and activity data were then updated using contemporary and region-specific measurement data. The original inventory estimated emissions at 315 Gg CH4 y−1 (gas production-normalized rate of 0.6% loss), while the updated inventory estimated emissions of 1500 Gg CH4 y−1 (2.8% loss). The largest changes resulted from large fugitive emissions from oil production (+430 Gg CH4 y−1), updating maintenance activity emissions (+214 Gg CH4 y−1), considering flaring inefficiency (+174 Gg CH4 y−1), and the inclusion of associated gas venting (+136 Gg CH4 y−1). This study suggests that a systematic underestimate probably exists in current bottom-up inventories and identifies sources currently missing or may be incorrect. We also strongly recommend that emission factors should be validated through direct comparison against measurement campaigns that include long-tail distributions typical of oil and gas activities.

1. Introduction

Methane (CH4) is a greenhouse gas with a 100-year warming potential 25 times higher than carbon dioxide [1,2] and is the largest constituent part of natural gas. Currently, bottom-up methods estimate that 6 Tg of methane is lost from producing, processing, transmitting, storing, and distributing natural gas in the US each year [3]. Recent studies have shown differences between top-down and bottom-up methane emission estimates [4,5,6,7,8], and studies suggest bottom up approaches may miss some sources [6] or that emission factors derived decades ago may now be unrepresentative of current emissions processes [7,9,10].
As part of the Paris Agreement [11], countries including the US report greenhouse gas emissions to the Intergovernmental Panel on Climate Change (IPCC) and the United Nations. Typically, greenhouse gas emissions including methane are derived using bottom-up methods which multiply process-specific emission factors by process activity levels [12,13,14]. Total methane emissions across all sectors of the economy in the US are typically calculated using US Environmental Protection Agency (EPA), Washington, DC, USA, approved emission factors [15] and are used to generate the annual Inventory of U.S. Greenhouse Gas Emissions and Sinks (GHGI). Complementary to the GHGI is the Greenhouse Gas Reporting Program (GHGRP) which collects emissions data from the facilities emitting more than 25,000 metric tons carbon dioxide equivalent (CO2e) annually [16]. The GHGI provides high level (national and state emissions) data over the past 25 years while the GHGRP compares individual facility emissions across sectors since 2010.
Oil and gas emission factors used in the GHGI were generated from studies funded by the EPA [17,18], some of which were conducted decades ago and are still in use today [7,19,20]. Recent studies suggest that these currently used emission factors may not accurately represent contemporary emissions or management/engineering practices, particularly in the oil and gas industry [7,8,9,21,22,23,24]. The EPA has updated some emission factors using field studies, such as those reported by [25] for gathering compressor stations. Therefore, it is suggested that emissions calculated from bottom-up inventories may significantly underestimate total area emissions [7,20,26]. Using IPCC emission factors, a recent study reported bottom-up CH4 emission estimates of 1.2 Tg CH4 y−1 from the Permian basin in Texas [20] while a top-down study estimated emissions from the same region at 3.7 Tg CH4 y−1 [27]. Overall, greenhouse gas emission estimates that are essential for climate modeling have the highest integrity when verified by direct, top-down atmospheric flux measurements [9,28,29,30,31].
Technological advances in instrumentation have been key to raising concerns over the veracity of bottom-up models’ emission estimates. Methane specific trace-gas analyzers, capable of measuring mixing ratios to ppb-level, are now routinely deployed as part of mobile surveys to detect and quantify methane emissions from point sources [8,32,33]. Mobile-survey platforms include cars [8,32], aircraft [34,35] and satellites [20,27,36]. Alternatively, ppb-level methane analyzers can be fixed to one location, observe mixing ratios in the boundary layer and used these measurements to infer landscape emission [26,37,38,39].
One continuous, fixed-location top-down regional quantification method is the tall tower approach, where towers are used to quantify methane concentrations in well mixed air in the boundary between 10 am and 5 pm local time [26,37,40,41]. Concentration data, an atmospheric transport model, and a prior emission estimate are combined through an atmospheric inversion to estimate methane emissions. For example, the approach described in Barkley et al. (2023) uses four tower sites in the Delaware basin, Texas, to continuously quantify methane emissions from oil and gas operations in the region between March 2020 and April 2022 at between 146 and 210 Mg CH4 h−1, corresponding to a gas-normalized rate of 2.5% to 3.5% [26].
Satellite based continuous top-down monitoring includes using the TROPOspheric Monitoring Instrument (TROPOMI) launched in 2017 that produces daily global coverage at 5.5 × 7 km2 pixel resolution of methane concentrations at regional scales, based on measurements made at ~13.30 local overpass time [42,43,44,45]. Varon et al. (2023) reported weekly methane emissions, between May 2018 to October 2020, at 25 × 25 km2 resolution from the Permian basin calculated using inverse analysis of satellite observations from TROPOMI [27]. The Permian basin comprises the Delaware basin and Midland basin, which were not disaggregated by this study [27]. Mean methane emissions, almost solely attributed to oil and gas operations in the basin, were estimated at 3.7 (±0.9) Tg CH4 y−1, corresponding to a gas-normalized rate of 4.6% (±1.3%). Varon et al. (2023) conclude that emissions inferred using methane concentration measurements made by the TROPOMI satellite are six times higher than the current GHGI bottom-up estimate. Note here that the non-O&G emissions were calculated using emission-factor, which have also not been updated for extended periods, but are largely based on biogeochemical process that are likely more stable than oil and gas related emissions.
Given the apparent discrepancy between bottom-up and top-down approaches (a factor of between 3 and 6), this study aims to investigate any uncertainty in bottom-up emission inventories from oil and gas production. Specifically, the study investigates how changes to emission factors could improve emission estimates by considering regional variation using: 1. Tier 1 IPCC emission factors; 2. Tier 2/3 EPA emission factors for the Permian basin; and 3. a mechanistic air emissions simulator (MAES) that can temporally resolve emissions. In each case we will review current emission factors, identify discrepancies between bottom-up estimates and top-down observations, and identify the largest sources of uncertainty. The overall aim of this study is to identify which emission sources are least well parameterized and where future measurement campaigns could be used to improve emission factors and potentially reduce discrepancies between top-down and bottom-up estimates.

2. Materials and Methods

2.1. Tier 1 Emissions Inventory—Production Based Inventory

Tier 1 methodologies are the simplest form of generating an emission inventory and require relatively little information about sources. For oil and gas production and midstream sectors, emissions can be calculated solely using gas and oil production rates as the activity factor. This study calculates Tier 1 methane emission estimates from oil and gas production in the Delaware basin using published oil and gas production values [46] and emission factors presented by the IPCC [12]. A range of emission factors and associated uncertainties are categorized as fugitive, vented, or flared emissions from gas production, oil production, servicing, gas transport, condensate transport, oil transport, and gas processing (Table S1) for three classifications of countries: developed, developing, and “economies in transition” [1,2,47].
Here, we calculate a Tier 1 emission estimate from the Delaware basin as a range with a ‘best-guess’ estimate, which is the average of the maximum and minimum emission factors (Table S1). Activity data to calculate the emissions was the 2020 production of natural gas and oil in the Delaware basin, at 3.7 × 10⁹ Mcf per year and 8.4 × 10⁸ bbls per year, respectively [46]. Methane content of natural gas in the Delaware basin has been taken as 80% [26,27]; this is an external estimate which may or may not reflect changes in production practices over the last decade. For the critical review of the bottom-up estimate using production values, we will critically assess the provenance of Tier 1 emissions factors and then compare the best-guess emission estimate against values presented in a range of peer-reviewed articles for each of the categories.

2.2. Tier 2/3 Emissions Inventory—Equipment Counts Based Inventory

A Tier 2/3-based bottom-up emission estimate for the Delaware basin can be calculated using emission factors and activity published by the EPA for petroleum systems and natural gas systems [14]. For each source type, an emission factor is presented typically in kg CH4 per source type. For some activities, a regional emission factor is presented, e.g., associated gas flaring, miscellaneous production flaring, associated gas venting, and for this study, we have used the values for the Permian basin (code 430) [14]. Similarly, partial activity data are also presented by basin and are calculated using region specific values of equipment numbers per well head. Collated emission factors and activity data are presented in Table S2 for petroleum systems and Table S3 for natural gas systems for the 45,686 oil (30,610) and gas (15,076) well heads in the Delaware basin, with location and production data taken for site in the Delaware basin in 2020 from the Enverus database [46]. Using these data, an oil well is defined as having a gas-to-oil ratio of less than 4000 cf bbl−1 [48]. As with the Tier 1 inventory, the Tier 2/3 emission estimate used the 2020 production of natural gas and oil in the Delaware basin at 3.7 × 10⁹ Mcf per year and 8.4 × 10⁸ bbls per year, respectively.

2.3. Mechanist Air Emissions Simulator (MAES)—Temporally Resolved Inventory Model

The MAES is an emissions simulation tool that has been developed at Colorado State University and has the capability to employ both traditional methods and mechanistic models for estimating emissions originating from oil and gas production and midstream sites. The tool utilizes the Monte Carlo method to incorporate variability in emissions and provides spatial and temporal resolution, with a 1 s interval.
Traditional methods rely on the multiplication of emission factors by activity factors to estimate emissions. In contrast, mechanistic models take into account chemical and physical processes occurring at the equipment level to simulate emissions. In this context, fluid flows, such as gas throughput, and the equipment’s state play a pivotal role in influencing the emissions.
To simulate emissions for the Delaware basin utilizing MAES, this study used two facility configurations, based on analyses from previous studies, which classified facilities into simple and complex sites [49]. Sites classified as simple include only well heads, separators, and other minor miscellaneous equipment on-site. Conversely, complex sites are facilities with equipment from simple sites plus any of the following: oil tanks, water tanks, and compressors. The Delaware basin extends over the southeast part of New Mexico and the north-western part of Texas. Out of the approximately 20,833 well sites estimated in the New Mexico section of the basin (calculated as 25,000 well heads divided by an average of 1.2 wells per site), 66.6% were classified as simple, and the rest as ‘complex. This classification was performed through human assessment using satellite imagery. In another study that aimed to quantify methane emissions with TROPOMI data [20], this prior assumption (67% simple and 33% complex) was employed in their analysis. This assumed that the same distribution applied uniformly across the entire Permian basin, without conducting additional analysis. Consequently, we extended this classification percentage (67% simple and 33% complex) to encompass the entire Delaware basin.
For the MAES analysis, we utilized the two sites’ configurations to represent simple (Figure 1A) and complex sites (Figure 1B). These site configurations represent prototypical sites developed in partnership with operators in the DJ basin as part of the Colorado Coordinated Campaign project. These configurations serve as representative models for a group of facilities with similar configurations. The simple site (Figure 1A) followed descriptions provided in Robertson et al. (2020), where tanks were not observed at the site and liquids were likely transported to other sites for processing. The complex site typically corresponds with newer sites, with large tank batteries and more stages of separation. One uncertainty here is that we do not have a complete understanding of where or how processing or storage takes place on simple sites. Robertson et al. (2020) states than simple sites only consist of a well head and we follow this definition. We must assume that separation and storage activities take place on nearby complex sites where separators and tanks are located and that emissions are accounted for in the complex emission calculations. The MAES model assumes such sites are composed of 2 continuous wells; 2× stage 1 separators operating at 118.65 psia, 1× stage 2 separator operating at 39.65 psia, and 1× VRT in the 3rd stage of separation at 16.79 psi; 1× water tank battery; 1× oil tank battery; 1× 1029 kW 4SLB driver for a reciprocating compressor operating as a gas lift; 1× 10⁸ kW 4SRB compressor at the second stage of separation operating as a VRU; 1× 70.8 kW 4SRB compressor at the third stage of separation operating as a VRU; and 2 flares: one connected to a water tank and the other to an oil tank.
As stated previously, the Delaware basin has a total of 45,686 active wells [46], producing 3.7 × 10⁹ Mscf of natural gas per year in 2020. The average of 1.2 wells per site estimated in a previous study [49] indicates 38,072 production sites. Keeping the assumption of 80% methane content for the natural gas produced in the basin, the total methane production in Delaware sums up to 5.5 × 10¹⁰ kg/year, which averages 1594 metric tons of methane per site per year. Assuming the same production for both site types, we estimate a well at a simple site produces an average of 7.7 barrels (bbl) of oil per day and a well at a complex site produces 6.8 bbl/day. This assumption is a source of uncertainty as the simple sites are likely older and vertical and probably produce more oil than the newer complex sites. The model also assumes that 1 bbl/day of water is produced for each site.
Due to the lack of publicly available data regarding failure rates and operating conditions, the following assumptions were made to simulate those sites. These assumptions, along with their respective sources are outlined below:
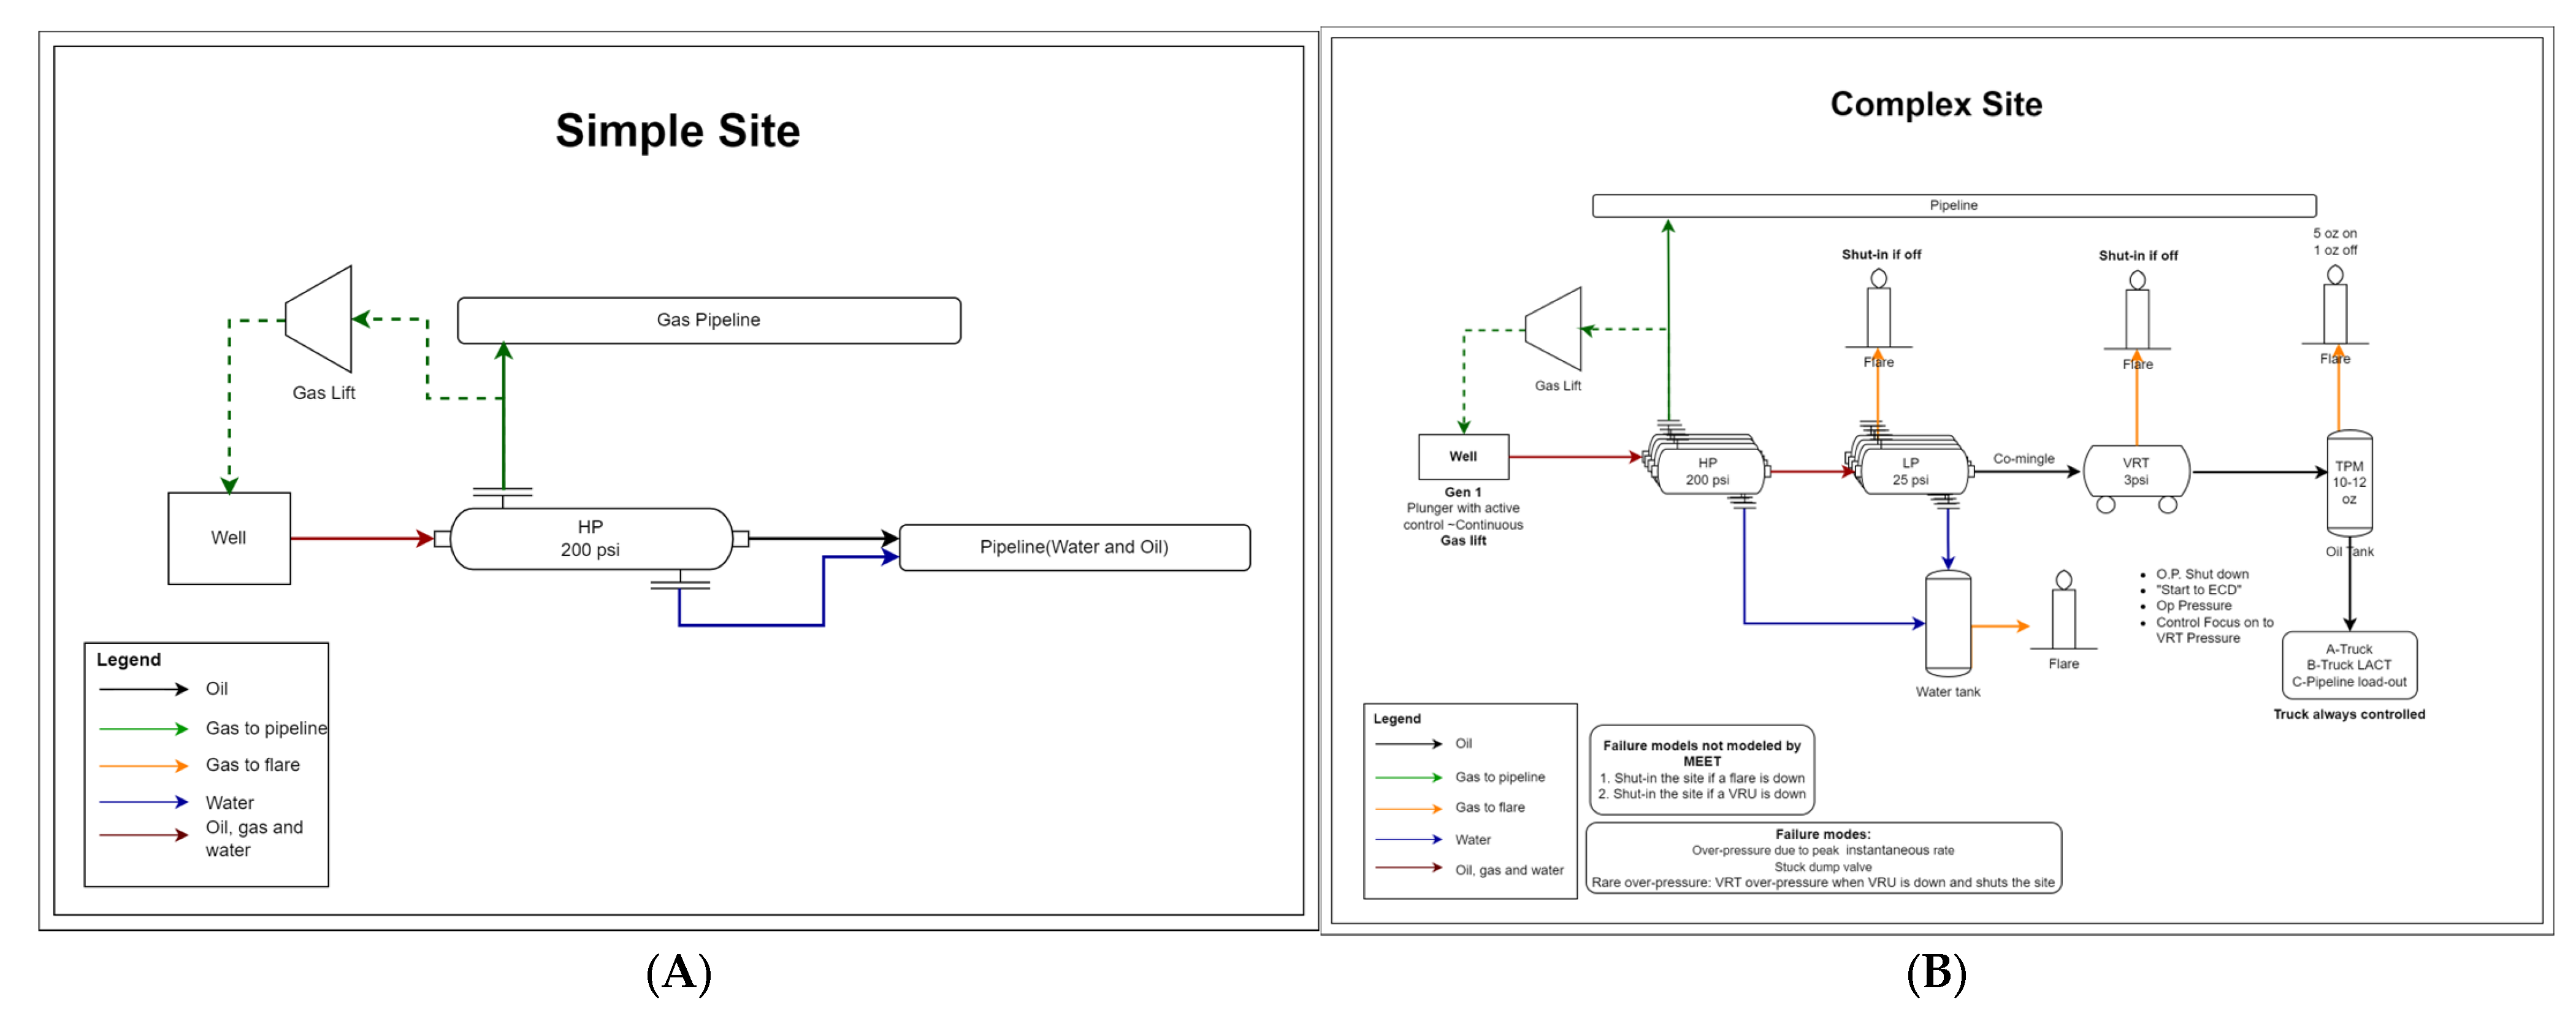
  • Stuck dump valve failure rate: provided by operators in the DJ basin.
  • The probability of component leaks (pLeak) in all major equipment was set to 0.1%. This value was derived by averaging the weighted probabilities of identifying a leaking component for each major equipment. The calculation incorporated pLeak numbers from [50].
  • All sites utilize gas pneumatics; emission factors were sourced from Allen et al. for the mid-continent region [51].
  • Flares combustion efficiency was set to 97.5% when operating, 81.9% when malfunctioning, and 0% when unlit [52].
  • All compressors were set to 100% load and operating fraction to 95%. Their emission factors were extracted from the national study on gathering and compressor stations and scaled by their throughput [53].
  • Each complex site was considered to have one water tank battery and one oil tank battery. The tank emissions were simulated mechanistically rather than using emission factors. That means that instead of multiplying activity factors by emission factors to estimate the emissions, these were estimated taking into account physical and chemical processes such as their fluid flows and operating state.
  • The pressure release valve at the tank is designed to open when the pressure exceeds three times the expected volume of gas resulting from flashing. Additionally, the maximum gas flow rate at the flare has been established at three times the expected flashed gas volume from the oil tank, supplemented by half of the gas flashed at stage three of separation. When the flare reaches its maximum flow, the gas flow rate at the tank is also set to three times the expected flash from the oil tank, along with the gas flashed at stage three of separation.

2.4. Uncertainty in Input Data

To understand how uncertainty in input data affects the emission calculated through bottom-up methods we conducted an uncertainty analysis on input variables. Methane content of the produced natural gas is a source of uncertainty in the calculations. The value used in our analysis was 80% following the data presented in the EPA guidelines, however, we recognize that the methane content may change either through basin-specific product or as the well ages. To address this, we put reasonable uncertainty bounds around the methane content of ±14%, based on a range of sources and calculate the effect on total emission as the emission factors.
Another source of uncertainty is the criterium by which gas well and oil well were defined, i.e., an oil well is defined as having a gas to oil ratio of less than 4000 cf bbl−1 [48]. From EPA emission factors [14], gas wells are considered larger emitters than oil wells and total emissions may be biased if more wells are considered to be gas wells. To investigate if the overall emission is strongly affected by this criterium, we conducted an uncertainty analysis by increasing and decreasing the split between the number of oil–gas wells by 10% while keeping the total number of wells constant.
Uncertainty in measurements used to provide data are also a source of uncertainty, specifically the measurements made of individual equipment at the ‘simple’ and ‘complex’ sites [49] and the data used to provide average emissions that account for super-emitters [54,55]. In the case of the ‘simple’ and ‘complex’ sites, the EPA OTM33A methods was used [49] and, while individual measurements have an associated uncertainty of ±46% [56], the bias of a number of measurements, as presented in [49], is ±4% [56]. The majority of measurements used to account for super emitters were taken using a tracer flux approach which has an associated uncertainty reported to be ±15% [54]. The overall uncertainty in the emission estimate was calculated as the root of all individual uncertainties squared.

3. Results

3.1. Production Based Inventory

3.1.1. Current Basin Emission Estimate

Using Tier 1 emission factors and associated uncertainties [12], the total methane loss calculated by the production-based bottom-up approach was estimated to be 607 Gg CH4 y−1 with an upper and lower range of 66 and 1966 CH4 y−1, respectively (Table S1). This corresponds to a loss of 1.1% (range: 0.15% to 4.33%) of production. The Tier 1 emission factors for production originate from reports and studies made around 20 years ago [15,57,58,59,60]; there can be orders of magnitude between the maximum and minimum emission factors. The following sections will present the emission calculated from each source and the veracity of the emission estimate made in each.

3.1.2. Venting and Fugitives during Natural Gas and Oil Production

The emission factors presented for fugitive and venting at natural gas oil production sites was based on measurements made at 334 facilities across the US [17,47,59,60]. Emissions were quantified either using the EPA Method-21 [61], where a measured concentration is converted to an emission rate using a correlation equation, a GRI Hi-Flow sampler or using tracer flux, where SF6 is released at the site and the CH4 emission rate inferred from the ratio of downwind measured CH4 and SF6 concentrations. Largest emissions were observed from gas-pneumatics, Kimray™ valves, and flashing from crude tanks and compressors (Table 1) [17,18,59]. To understand if the emission factors used to generate the Tier 1 emission factor were still representative, we compared individual equipment emissions to contemporary field-based measurements [20,49].
Measured methane emissions from 55 out of 48,600 complex and 38 out of 97,000 simple sites in the Permian basin were 40 and 5200 g CH4 h−1 (uncertainty of ±4%; [56]), respectively [20,49]. A simple site comprises a well head or pumpjack only while a complex site has other equipment: separators, heaters, tanks, dehydrators, and small compressors. Using emission data used to generate the IPCC Emission Factors [17,59,62], emissions from simple and complex sites are estimated at 29 and 2706 CH4 site−1 h−1, respectively. Assuming the Permian basin is a reasonable proxy for the Delaware basin, the more recently measured emissions were from vented and fugitive emissions only (Table 1) and scaling up for the basin, the ‘best-guess’ IPCC Tier1 emission factor for natural oil and gas production underestimates emissions from venting and fugitives by factors of 2.1 and 1.4, respectively. Specifically, the ‘fugitive’ factor (ff) is taken as the ratio between the contemporary (FESc = 40 g CH4 site−1 h−1) and historic facility emission (FESh = 29 g CH4 site−1 h−1) for simple sites (Equation (1)).
f f = F E S c F E S h
To derive the ‘vented’ factor (fv), the contemporary facility emission for complex sites (FECc = 5200 g CH4 site−1 h−1) was assumed to be the addition of the fugitive factor (ff = 1.4) multiplied by the sum of historic fugitive emission factors (fEFh = 625 g CH4 site−1 h−1) and fv multiplied by the sum of the historic vented emission factors (vEFh = 2205 g CH4 site−1 h−1) for equipment found at the complex site (Equation (2)).
F E C c = f f . f E F h + f v . v E F h

3.1.3. Flaring

Reported Amount of Natural Gas Flared during Production

Total methane emissions during production is estimated at 3.5 Gg CH4 y−1 using an assumed flare destruction efficiency emission factor of 0.98 [12,15,59]. Plant et al. (2022) reported methane emitted from non-functioning/partially functioning flares in the Permian resulted in a region-specific flaring destruction efficiency of 86.8% [52]. Here, we use this destruction efficiency (86.8%), which results in 6.6 times higher emissions, to re-evaluate the emission estimate.

3.1.4. Transport

Gas Transmission

The Tier 1 annual emission estimates for gas transmission for fugitives and venting, are estimated at 13 and 19 Gg CH4 y−1, respectively (Table S1). An aircraft-based study reported results of used two measurement campaigns in the Permian basin: Fall 2019 (50 sources detected over 19,900 km with total emissions 5900 kg h−1) and Fall 2021 (331 sources detected over 79,000 km with total emissions 90,000 kg h−1). These data resulted in the emission factors of 2.7 (+1.9/−1.8, 95% confidence interval) and 10.0 (+6.4/−6.2) Mg CH4 y−1 km−1 [34]. To generate a single emission factor we use the average of 6.4 Mg of CH4 year−1 km−1 and estimate the loss from the 11,520 km of gathering line in the Delaware basin [63] is estimated at 74 Gg CH4 y−1.

Oil and Condensate Transport

Methane emission from oil and condensate occurs as the liquid is brought to atmospheric pressure [59] and these emissions are typically characterized in either the vented or fugitive emissions. We were unable to identify the root of the emission factor used by the IPCC in the sources identified but assume this is a combination of venting of flash gas produced as the oil stabilizes in tanks, ‘working flash’, and gas emitted from truck unloading of the tank when liquid product is transported from the production site. At present, data on oil and condensate removal are unavailable, and in the absence of a better estimate we will continue to use the IPCC emission factor.

3.1.5. Maintenance

Tier 1 well servicing emissions are currently estimated at 15 Gg CH4 y−1. A recent study reported emissions from 432 well pads in the Denver–Julesburg basin between 2020 and 2022 finding that on average, emissions from a well pads measured between 11 am to 4 pm were 17% higher than emissions measured between 4 pm and 11 am. We assume these emissions are the result of maintenance activities [8]. As well, pad emissions have been reassessed to 781 Gg CH4 y−1 (Section 2.1 and Section 2.2); we now estimate maintenance emissions at 133 Gg CH4 y−1.

3.1.6. Large Fugitives

The major shortcoming in the methods used to determine the emission factors from fugitives is that they all use relatively time-consuming survey methods (high-flow sampling, tracer gas method, and direct flow method) which only observe emissions from a small sample size of the emission population and are likely to miss the very large emitters [15,34,57,58,59,64,65]. Therefore, we assume large emitters are current unaccounted for in the IPCC emission inventory.
Recent studies using aircraft and satellites have identified very large emissions from oil and gas production, transmission, and processing activities. Emissions observed and quantified by these methods have been estimated to account for 85% of the regional emissions [36,64,66,67]. At the altitudes flown by these platforms, it is impossible to distinguish between fugitive emissions and other sources already accounted for above (maintenance, flares and pipelines).
To disentangle emissions, we present data from the recent Colorado State University’s C3 campaign, where data from Aviris NG and context cameras flown at 17,000 feet were used to quantify emissions from the Denver–Julesburg basin in the summer and fall of 2020. The aircraft survey detected 188 large recurring methane plumes, 65 of which did not originate from an oil and gas facility, 29 were from midstream facilities, 30 were matched to a production maintenance event, and 11 may have been matched with a maintenance event. Removing of these plumes to generate an estimate for uncontrolled/undocumented emissions at production sites in the DJ basin, the remaining 24 plumes emit 5.0 Mg CH4 h−1. Assuming a gas production rate of 2500 MMscfd (1706 Mg CH4 h−1) in the survey area [68], large uncontrolled/undocumented emissions at production sites is estimated at 0.3% of natural gas production. If we assume similar emission behavior in the Delaware basin, we estimate large fugitive emissions from the gas production in the Delaware basin at 165 Gg CH4 y−1.

3.1.7. Measurement Informed 2020 Tier 1 Bottom-up Emission Estimate

Updating the EPA emission factors using measurement data, we estimate the 2020 emissions from the Delaware basin at 1.2 Tg CH4 y−1, which corresponds to a loss of 2.2% of CH4 produced in the basin (Table 1). The largest increases in emissions are the result of considering large emitters, i.e., the long tail of the emission distribution not currently considered. The next largest increases were emissions from flares and the gathering systems.

3.2. Equipment Based Emissions Inventory

3.2.1. Current Basin Emission Estimate

Current CH4 emissions from oil and gas operations in the Delaware basin generated using EPA Tier 2/3 emission factors and activity data [49,50] are estimated at 315 Gg CH4 y−1 (Table 2). The largest emissions are calculated from fugitives from the 8200 gas wells (146 Gg CH4 y−1) while emissions from the 37,486 oil wells are much smaller (83 Gg CH4 y−1). Maintenance is estimated at 1 Gg CH4 y−1, transmission at 57 Gg CH4 y−1, and processing at 27 Gg CH4 y−1. The current bottom-up emission estimate from the Delaware basin reported to the GHGI using EPA Tier2/3 emission factors is estimated at a gas normalized rate of 0.6%.

3.2.2. Flaring

As with the Tier 1 emission estimates from flaring, we assume that the current emissions are based on a flare destruction efficiency of 98%. Again, we adjust the emissions for a Permian basin based destruction efficiency of 86.8% [52] across all flaring activities. For oil production, this affects associated gas flaring, flaring from large and small tanks, and miscellaneous production flaring. For gas production sites, flare destruction efficiency affected tanks with flares. There were also some small changes to emissions from flaring in the gathering/boosting and processing activities. Considering a less efficient flare makes the most impact for emissions from associated gas flaring and ‘Miscellaneous Production Flaring’ activities, with an estimated additional 140 Gg CH4 yr−1 emitted from associated gas flaring alone. By considering flares less efficient than EPA values suggests that the EPA currently underestimates CH4 emissions from flaring activities by 186 Gg CH4 y−1 (Table 2).

3.2.3. Venting and Fugitives during Production

Current Emission Factors

Emission factors for high, intermittent, and low bleed pneumatic devices, as presented in the GHGI additional information [14], were based on measurements made in 1995 [18,59,62]. Emissions factors for produced water are not based on measurement and result from process simulation modeling conducted by the Energy Environmental Research Center, 1995 [59]. For uncontrolled tanks, the EPA Tier 2/3 emission factor is presented as 74 kg CH4 bbl−1 of crude oil [14], but there are no references given for the origin of this emission factor (Supplementary Materials Section S2). For controlled tanks, the reduction in emission is only based on the operator’s estimate of VRU recovery and amount of gas sent to flare.
Most of the other emission factors used for petroleum system production were taken from the API workbook [69], GRI/EPA report [60], a consensus of an industry review panel, or was assumed to be zero due to lack of data [14] (Table S4). In summary, the most reliable emission factors were based on measurements of equipment and industrial practices 27 years ago, while the least reliable are assumed to be zero as they had not been measured.

Suggested Changes to Emission Factors

To investigate if current (27-year-old) emission factors for petroleum systems (oil wells) are representative of emissions from equipment in present day, we compared the emission factors used to calculate operator’s GHGRP reports against measurements data. The key shortcoming of the 1996 datasets is the relatively small sample size and the unlikelihood of those sampling campaigns to encounter very large emitters. To account for very large emitters, we take data from a recent study that used a Monte Carlo simulation approach to aggregate production equipment’s missions in the Barnett Shale production region in Texas [55]. We assume given the proximity of the Barnett shale to the Delaware basin that there are common practices that could give an indication of how reliable the current EPA emission factor data are.
The equipment with the largest change in emission factor are the pneumatic devices (increase factor four) and the oil well heads (increase in factor of 10) (Table 3). Emission factors presented in Zavala-Araiza et al. (2017) for chemical injection pumps and compressors are very similar to those published in 1995. It is more difficult to tell how emission factors compare for produced liquids as data published by Zavala-Araiza et al., 2017 presents the units as kg CH4 MMbbl−1 of oil and produced water.

Current Activity Data

For the Delaware basin, activity data for petroleum systems (oil wells) are calculated as basin-specific values calculated from year-specific GHGRP subpart W data reported by operators [14].

Suggested Changes to Activity Data

Largest differences between the 2020 activity data derived using EPA methodology [49,50] were the number of pneumatic devices in the basin (Table 4). The current EPA approach suggests that there are only one pneumatic device per well head while a measurement study suggests 2.7 devices per well head [51]. Well pad equipment count estimates were based on Delaware basin-based field campaign equipment counts [20,49].

Updated Emission Estimate

By considering the changes to the emission factors and the activity data, we suggest that the EPA’s current approach underestimates emissions from fugitive and vented emissions from oil and gas production sites by a factor of four. We update the total emissions from gas (241 Gg CH4 y−1) and oil productions sites (484 Gg CH4 y−1) to 726 Gg CH4 y−1 with the largest emissions resulting from accounting for a larger number of pneumatic devices that emit more than previously estimated.

3.2.4. Flaring/Venting of Associated Gas

Following the Tier 1 approach, we estimate the destruction efficiency of flares in the Delaware basin at 86.4% [52]. The amount of associated gas that is vented in the Delaware basin is one of the largest uncertainties in the inventory. The EIA suggest that 2% of produced gas is either vented or sent to flare [70], while a recent study based on satellite observations suggest the up to 3.7% of gas is vented/flared [27]. Taking an integer middle-estimate of 3% of gas is either vented or flared, suggests that emissions from venting in the Delaware basin are 136 Gg Ch4 y−1, but this value is highly uncertain (+400%, −100%).

3.2.5. Maintenance

As with the Tier 1 approach and in the absence of direct studies on maintenance events, the contribution from maintenance was taken as 17% of the total emissions from a well pads, which results in emissions of 121 Gg Ch4 y−1 (Table 1).

3.2.6. Transport

Currently, it is estimated that 4 Gg CH4 y−1 is lost from the natural gas gathering system. As described in Section 3.1.4, an estimated 6.5 Mg of CH4 year−1 km−1 is lost from the 11,520 km of gathering line in the Delaware basin resulting in emissions of 74 Gg CH4 y−1 (Table 1). Adding this difference to the emissions to the compressor, tank, and engine emissions in the EPA estimate results in emissions of 127 Gg CH4 y−1 (Table 1).

3.2.7. Measurement Informed Tier 2/3 Bottom-up Emission Estimate of Oil and Gas Activities

Updating Tier 2/3 emission factors and activity data published by the EPA, we estimate the 2020 emissions from the Delaware basin at 1.5 Tg CH4 y−1, which corresponds to a loss of 2.8% of CH4 produced in the basin. The largest increases in emissions are the result of change in size of fugitives from oil production (+431 Gg CH4 y−1), maintenance (+214 Gg CH4 y−1), flared oil production (+174 Gg CH4 y−1), and vented gas from oil production (+136 Gg CH4 y−1). The change to emissions from fugitive gas from oil production results from changes to both the emission factor and the activity data, especially from gas pneumatics (+250 Gg CH4 y−1), chemical injection pumps (+49 Gg CH4 y−1), compressors (+34 Gg CH4 y−1), and controlled/uncontrolled tanks (+11 Gg CH4 y−1). The most speculative estimates presented by this study are the emissions from maintenance events and vented gas from oil production. At present we have no understanding of how uncertain the estimate from maintenance is but suggest the uncertainty in emissions from vented gas is between +400% and −100%.

3.3. MAES Inventory Model

MAES was run for 365 days with 300 Monte Carlo iterations for 25,381 simple sites and 12,691 complex sites. After accounting for 17% of emissions attributed to maintenance activities, the mean CH4 loss for the simple and complex sites was estimated at 0.19% (±0.40%) and 4.40% (±0.19%), respectively. The higher normalized loss in complex sites is mainly due to vented and combusted emissions from additional equipment on site such as compressors, tanks, and flares. For the Delaware basin, production sites are estimated to emit 0.88 Tg CH4 y−1 [0.83, 0.93].
While these estimates are based on the assumptions specified in Section 2.3, improving the accuracy of the estimate is contingent on collecting additional information from operators or public databases including: facility production rates, on-site equipment, maintenance activities, and the classification of facilities into prototypical sites. In addition to site-specific data, regional characteristics, including failure rates, duration, and size of large emissions, exert a significant influence on the basin-scale emission estimate. In 2022, an aerial survey measured methane emissions from 7474 production sites in the Permian basin [35]. However, this dataset could not be used as input to MAES as facility configuration and production rate information were not collected, and often times measured emissions are significantly higher than the average production set for a facility. This limitation underscores the need for more comprehensive information and collaboration with operators to achieve more robust results in a basin model.

3.4. Non-Oil and Gas Activities

Methane emissions from non-O&G anthropogenic sources within the Delaware basin are taken from the EPA’s 2012 Gridded Methane Emissions Inventory and estimated at 31 Gg CH4 y−1 with the majority of emissions (81%) from agricultural sources in New Mexico to the north and west of the basin and the remainder from the waste sector [19,20,26].

3.5. Uncertainty in Input Data

The uncertainty analysis strongly suggests that assumptions about the methane content of the produced natural gas affect the calculated emission the most. In every modeled scenario the root sum squared uncertainty in total emission was calculated as ±21% with methane composition being the key driver (Table S5). Methane composition affects nearly all emission factors as they are presented as the mass of methane emitted per unit activity and assumes a regionally fixed methane composition. Even when the individual uncertainties are accounted for, it remains clear that current bottom-up approaches significantly underestimate emissions from oil and gas production.

4. Discussion

This study presents the results of three approaches that can be used to generate a bottom-up emission inventory for oil and gas operations in the Delaware basin. The first method, a Tier 1 approach, used “developed world” emission factors that are based on oil and gas production rates to generate methane emissions. Using 2020 oil and gas production values [46] and IPCC emission factors [12], the total methane loss calculated by the production-based bottom-up approach was estimated to be 607 Gg CH4 y−1 with an upper and lower range of 66 and 1966 CH4 y−1, respectively. When the emission factors were changed to accommodate region-specific measurement studies [20,26,36,49,64,66,67] we estimate emissions at 1209 (range: 944, 1474) Gg CH4 y−1, corresponding to a loss of 2.25% (range: 1.71, 2.68%) of CH4 produced, and largest increases in emissions are a result of large emitters, emissions from flares, and emissions from gas transmission.
The second method used individual emission factors and activity data for major pieces of production, gathering, boosting, and processing equipment to make region specific (Permian basin), Tier 2/3, emission estimates. Both emission factors and activity data were taken from the EPA appendices for petroleum systems [14] and natural gas systems [14]. Using these data, the 2020 methane emission from oil and gas activities in the Delaware basin are estimated at 315 Gg CH4 y−1, or 0.6% of production. Incorporating measurement studies to make the emission factors both contemporary and regionally specific [27,34,49,51,52,55] results in an emission estimate of 1546 (range 1220, 1872) Gg CH4 y−1, 2.81% (range: 2.22%, 3.40%) of production, with the largest increases resulting from a change in size of fugitives from oil production (+430 Gg CH4 y−1), maintenance (+214 Gg CH4 y−1), flared oil production (+174 Gg CH4 y−1), and vented gas from oil production (+136 Gg CH4 y−1).
Even though some contemporary studies were used to update both Tier 1 and Tier 2/3 approaches [34,49,52], the methods for calculating the production based and equipment based inventory estimates are quite different but arrive at similar estimates. The Tier 1 emission estimate was most affected by the inclusion of large emitters based on observations of Zimmerle et al. (in review). Similarly, the Tier 2/3 estimate was most affected by accounting for super emitting production sites observed by Zavala-Araiza et al. (2017). The IPCC Tier 1 and EPA Tier 2/3 bottom-up inventories did not account for these emissions as both derived emission factors using data derived from measurement data published in 1996 which did not observe any super emitters on their relatively small (334 facilities across the US) measurement campaigns [18,62]. Realistic emission factors can only be derived by observing and accounting for the long tail distribution through simulation [55] or by observing thousands of sites at a time using aircraft or satellite-based platforms [36,64,66,67].
One important point of note is the uncertainty that comes with using a Tier 1-based approach. Using IPCC recommended data, the initial emission estimate bounds were 66 Gg CH4 h−1 to 1966 Gg CH4 h−1 with a ‘best-guess’ estimate of 607 (−89%, +223%) Gg CH4 h−1. Without additional measurements, this estimate range is almost meaningless, and any data reported to the IPCC using Tier 1 emission factors should be treated as highly uncertain. The main shortcoming of the EPA Tier 2/3 emission factors is that it comes without an uncertainty bound, which could be mistaken for an assertion of precision and accuracy. As our findings suggest, these emission factors are potentially wrong as they do not account for the long-tail emissions common to most oil and gas emissions distributions.
While we acknowledge that approaches used in this study are subject to large uncertainties and some data sources may not be exactly geo-located, the study illustrates that even a simple reassessment of bottom-up inventories using contemporary and near(er) region-specific observations will help close the gap between top-down and bottom-up inventory estimates.
The third method used—MAES—is a simulation tool that uses traditional and mechanistic models to estimate methane emissions at a facility and basin scale. The estimated CH4 emissions for production activities in the basin according to the MAES models is 880 Gg CH4 y−1. Even though more data are required to run MAES than Tier 1 (production rates) and Tier 2/3 (equipment on sites), methane (and other species’) emissions can be calculated across time frames, ranging from instantaneous emissions (easier for comparison against aerial survey measurements) to annual emissions (such as those documented in the GHGRP inventories). Additionally, this method provides a better estimate of the ethane–methane ratio of emitted gas, which varies substantially between source types, even within one site. Therefore, the cost of acquiring detailed information for MAES input is rewarded by the spatiotemporal variability of emission estimates that allows the bottom-up emissions to be compared by measurements made by a range of top-down methods.
The 2020 top-down estimates of oil and gas emissions in the Delaware include gas-normalized rates of 2.5% to 3.5% using tall tower measurements [26] and 4.6% using TROPOMI satellite data [27]. These top-down estimates are much nearer the adapted Tier 1 (2.2%) and Tier 2/3 (2.8%) estimates calculated in this study than emissions calculated using the stock emission factors provided by the IPCC and the EPA. Here, we strongly suggest that bottom-up inventories are better informed by measurement activities to generate more regionally representative emission factors/activity data that more closely account for regional changes in operational activities and conforming to regional emission regulations. We acknowledge that by reporting only the uncertainties in bottom-up approaches this may suggest that these fully account for bottom-up/top-down differences. However, we would like to highlight that top-down approaches may also use assumptions that are highly uncertain, such as gas methane content and representative observation periods/timeframes, which may cause bias in emission estimates and further investigation of current top-down methods should be conducted in the future.

5. Conclusions

To mitigate the gaps between bottom-up and top-down methods, we believe that the following topics deserve critical attention and further development:
  • Dynamic Emission Factors and Activity Data: current emission factors are often outdated and do not account for variations in gas composition, equipment throughput, and equipment operational states. Similarly, activity data can be out of date and not reflective current operational practices. It is crucial to update and expand the emission factor and activity data structure to accommodate these nuances.
  • Temporal Variability in Emissions: emissions vary significantly over time due to weather, seasonal patterns, timing of maintenance activities, and age of production activity. These fluctuations are often linked to human behavior such as the willingness to perform equipment repairs in cold weather, requests from government agencies to reduce maintenance during the summer to mitigate ozone formation from co-emitted VOCs, or the introduction of additional operating equipment during winter such as heaters. However, a deeper investigation is needed to understand and quantify the underlying causes. Reconciliation exercises must take this factor into consideration.
  • Data Collection Frequency, Latency, and Absence: temporal mismatches in data collection and use in models can lead to discrepancies in reconciling emissions. The more frequent top-down measurements are employed, the better the bottom-up model can be informed about failures/abnormal emissions. In some cases, emissions data are simply unavailable, e.g., emissions from the petroleum gathering system, and efforts should be made to identify and address the issues.
  • Granular Facility-level Data Collection: more data is needed regarding equipment count and ratings, performance, operating pressure and temperature, and oil and gas production for more accurate bottom-up models.
  • Data Quality/Reliability: in past projects, we have encountered challenges related to the quality and reliability of data. For instance, in aerial measurements, we observed significant fluctuations in methane rates over short time intervals (1 or 2 min) even when there were no substantial changes in facility operations. Such variations can often be attributed to factors like the facility’s topography, which can introduce biases in wind speed assumptions used for emission rate estimation, or inherently wide uncertainties in the aerial system’s estimation method. Additionally, inaccuracies can arise in bottom-up models when incorrect reporting numbers are employed, such as a common EF for 4SLB engines with and without pre-chambers, as still suggested by the EPA.
  • Customized Approach for Different Facilities in Basin-wide Models: while configuring specific settings for thousands of facilities may be challenging and often cost-prohibitive, we can categorize sites into distinct classes known as Prototypical Sites (PS). Each PS should represent a group of similar facilities, with differences that do not significantly impact their emissions profiles. This classification of all facilities from a basin into PS can improve model accuracy and reduce the computational efforts required for bottom-up simulation.
  • Collaboration and Data Sharing: the previous point highlights the critical need for collaboration between measurement studies and operators. Data sharing and collaboration involving government, academia, and industry stakeholders are indispensable to improving bottom-up and top-down models and addressing the reconciliation challenge.
  • Policy Updates: with advances in technology and site configuration, it is imperative to constantly update databases and guidelines through research, collaboration, and field measurements. Similarly, policies must evolve to align with recent trends and changes.

Supplementary Materials

The following supporting information can be downloaded at: https://www.mdpi.com/article/10.3390/atmos15020202/s1, Table S1—The 2020 bottom-up emission estimate for the Delaware basin, TX, calculated using Tier 1 emission factors; Table S2—Bottom-up inventory of petroleum systems in the Delaware basin; Table S3—Bottom-up inventory of natural gas systems in the Delaware basin; Table S4—Data source of 2020 GHGRP emission factors; Table S5—Effect of emission estimates caused by changing variables within reasonable uncertainty bounds. References [1,12,47,54,55,56] are cited in the supplementary materials.

Author Contributions

Conceptualization, S.N.R. and D.J.Z.; methodology, S.N.R., A.S. and D.J.Z.; formal analysis, S.N.R., M.M. and A.S.; investigation, S.N.R., M.M. and A.S.; writing—original draft preparation, S.N.R., M.M. and A.S.; writing—review and editing, S.N.R., M.M., A.S., W.H. and D.J.Z.; supervision, S.N.R. and D.J.Z.; project administration, W.H. and D.J.Z.; funding acquisition, W.H. and D.J.Z. All authors have read and agreed to the published version of the manuscript.

Funding

This TOPBOT project was sponsored by the Collaboratory to Advance Methane Science (“CAMS”), an industry-led research consortium administered by GTI ENERGY and funded under agreement as Project Number 605 23258.

Institutional Review Board Statement

Not applicable.

Informed Consent Statement

Not applicable.

Data Availability Statement

All data used in this publication are provided within the manuscript or in the Supplementary Information.

Acknowledgments

As part of the TOPBOT project we would like to acknowledge the assistance of Ken Davis and Zach Barkley at Pennsylvania State University, Daniel Jacob and Daniel Varon of Harvard University, Hon Xing Wong and Dylan Chandler at GTI Energy, the members of CAMS Technical Working Group members from Chevron, ExxonMobil, and Pioneer, and the support of the Collaboratory to Advance Methane Science.

Conflicts of Interest

The authors declare no conflicts of interest.

References

  1. IPCC Climate Change 2013—The Physical Science Basis: Working Group I Contribution to the Fifth Assessment Report of the Intergovernmental Panel on Climate Change; Cambridge University Press: Cambridge, UK, 2014; ISBN 978-1-107-41532-4.
  2. Pörtner, H.-O.; Roberts, D.C.; Tignor, M.; Poloczanska, E.S.; Mintenbeck, K.; Alegría, A.; Craig, M.; Langsdorf, S.; Löschke, S.; Möller, V.; et al. (Eds.) IPCC Climate Change 2022: Impacts, Adaptation and Vulnerability. Contribution of Working Group II to the Sixth Assessment Report of the Intergovernmental Panel on Climate Change; Cambridge University Press: Cambridge, UK; New York, NY, USA, 2022; ISBN 978-1-00-932584-4. [Google Scholar]
  3. EPA Inventory of U.S. Greenhouse Gas Emissions and Sinks: 1990–2016. US EPA. 2018. Available online: https://www.epa.gov/ghgemissions/inventory-us-greenhouse-gas-emissions-and-sinks-1990-2016 (accessed on 5 May 2023).
  4. Caulton, D.R.; Shepson, P.B.; Santoro, R.L.; Sparks, J.P.; Howarth, R.W.; Ingraffea, A.R.; Cambaliza, M.O.L.; Sweeney, C.; Karion, A.; Davis, K.J.; et al. Toward a Better Understanding and Quantification of Methane Emissions from Shale Gas Development. Proc. Natl. Acad. Sci. USA 2014, 111, 6237–6242. [Google Scholar] [CrossRef]
  5. Schwietzke, S.; Griffin, W.M.; Matthews, H.S.; Bruhwiler, L.M.P. Natural Gas Fugitive Emissions Rates Constrained by Global Atmospheric Methane and Ethane. Environ. Sci. Technol. 2014, 48, 7714–7722. [Google Scholar] [CrossRef] [PubMed]
  6. Zavala-Araiza, D.; Lyon, D.R.; Alvarez, R.A.; Davis, K.J.; Harriss, R.; Herndon, S.C.; Karion, A.; Kort, E.A.; Lamb, B.K.; Lan, X.; et al. Reconciling Divergent Estimates of Oil and Gas Methane Emissions. Proc. Natl. Acad. Sci. USA 2015, 112, 201522126. [Google Scholar] [CrossRef] [PubMed]
  7. Riddick, S.N.; Mauzerall, D.L. Likely Substantial Underestimation of Reported Methane Emissions from United Kingdom Upstream Oil and Gas Activities. Energy Environ. Sci. 2023, 16, 295–304. [Google Scholar] [CrossRef]
  8. Riddick, S.N.; Cheptonui, F.; Yuan, K.; Mbua, M.; Day, R.; Vaughn, T.L.; Duggan, A.; Bennett, K.E.; Zimmerle, D.J. Estimating Regional Methane Emission Factors from Energy and Agricultural Sector Sources Using a Portable Measurement System: Case Study of the Denver–Julesburg Basin. Sensors 2022, 22, 7410. [Google Scholar] [CrossRef] [PubMed]
  9. Nisbet, E.; Weiss, R. Top-Down Versus Bottom-Up. Science 2010, 328, 1241–1243. [Google Scholar] [CrossRef]
  10. Nisbet, E.G.; Manning, M.R.; Dlugokencky, E.J.; Fisher, R.E.; Lowry, D.; Michel, S.E.; Myhre, C.L.; Platt, S.M.; Allen, G.; Bousquet, P.; et al. Very Strong Atmospheric Methane Growth in the 4 Years 2014–2017: Implications for the Paris Agreement. Global Biogeochem. Cycles 2019, 33, 318–342. [Google Scholar] [CrossRef]
  11. UNFCCC Paris Agreement. United Nations Framework Convention on Climate Change. FCCC/CP/2015/L.9/Rev.1. 2022. Available online: https://unfccc.int/documents/9064 (accessed on 16 June 2023).
  12. IPCC Intergovernmental Panel on Climate Change. Emission Factor Database. 2023. Available online: https://www.ipcc-nggip.iges.or.jp/efdb/main.php (accessed on 15 June 2023).
  13. NAEI UK National Atmospheric Emissions Inventory (NAEI) Data—Defra, UK. 2021. Available online: http://naei.beis.gov.uk/data/ (accessed on 16 June 2023).
  14. US EPA United States Environmental Protection Agency. Natural Gas and Petroleum Systems in the GHG Inventory: Additional Information on the 1990–2021 GHG Inventory (Published April 2023). Available online: https://www.epa.gov/ghgemissions/natural-gas-and-petroleum-systems-ghg-inventory-additional-information-1990-2021-ghg (accessed on 4 January 2024).
  15. EPA US Environmental Protection Agency. Methane Emissions from the Natural Gas Industry, Volume 3: General Methodology. 1999. Available online: https://www.epa.gov/sites/default/files/2016-08/documents/3_generalmeth.pdf (accessed on 14 June 2023).
  16. US EPA. GHGRP Reported Data. Available online: https://www.epa.gov/ghgreporting/ghgrp-reported-data (accessed on 21 January 2020).
  17. Campbell, L.M.; Campbell, M.V.; Epperson, D.L. Methane Emissions from the Natural Gas Industry, Volume 2: Technical Report, Final Report, GRI-94/0257.1 and EPA-600/R-96-080b; Gas Research Institute: Des Plaines, IL, USA; U.S. Environmental Protection Agency: Washington, DC, USA, 1996. Available online: https://www.epa.gov/sites/default/files/2016-08/documents/9_underground.pdf (accessed on 12 January 2024).
  18. Shires, T.M.; Harrison, M.R. Methane Emissions from the Natural Gas Industry, Volume 12: Pneumatic Devices, Final Report, GRI 94/0257.29 and EPA-600/R-96-080l; Gas Research Institute: Des Plaines, IL, USA; U.S. Environmental Protection Agency: Washington, DC, USA, 1996. [Google Scholar]
  19. Maasakkers, J.D.; Jacob, D.J.; Sulprizio, M.P.; Turner, A.J.; Weitz, M.; Wirth, T.; Hight, C.; DeFigueiredo, M.; Desai, M.; Schmeltz, R.; et al. Gridded National Inventory of U.S. Methane Emissions. Environ. Sci. Technol. 2016, 50, 13123–13133. [Google Scholar] [CrossRef] [PubMed]
  20. Zhang, Y.; Gautam, R.; Pandey, S.; Omara, M.; Maasakkers, J.D.; Sadavarte, P.; Lyon, D.; Nesser, H.; Sulprizio, M.P.; Varon, D.J.; et al. Quantifying Methane Emissions from the Largest Oil-Producing Basin in the United States from Space. Sci. Adv. 2020, 6, eaaz5120. [Google Scholar] [CrossRef]
  21. Turner, D.A.; Williams, I.D.; Kemp, S. Greenhouse Gas Emission Factors for Recycling of Source-Segregated Waste Materials. Resour. Conserv. Recycl. 2015, 105, 186–197. [Google Scholar] [CrossRef]
  22. Cerri, C.E.P.; You, X.; Cherubin, M.R.; Moreira, C.S.; Raucci, G.S.; Castigioni, B.d.A.; Alves, P.A.; Cerri, D.G.P.; Mello, F.F.d.C.; Cerri, C.C. Assessing the Greenhouse Gas Emissions of Brazilian Soybean Biodiesel Production. PLoS ONE 2017, 12, e0176948. [Google Scholar] [CrossRef]
  23. Yang, W.-B.; Yuan, C.-S.; Chen, W.-H.; Yang, Y.-H.; Hung, C.-H. Diurnal Variation of Greenhouse Gas Emission from Petrochemical Wastewater Treatment Processes Using In-Situ Continuous Monitoring System and the Associated Effect on Emission Factor Estimation. Aerosol Air Qual. Res. 2017, 17, 2608–2623. [Google Scholar] [CrossRef]
  24. Nisbet, E.G.; Fisher, R.E.; Lowry, D.; France, J.L.; Allen, G.; Bakkaloglu, S.; Broderick, T.J.; Cain, M.; Coleman, M.; Fernandez, J.; et al. Methane Mitigation: Methods to Reduce Emissions, on the Path to the Paris Agreement. Rev. Geophys. 2020, 58, e2019RG000675. [Google Scholar] [CrossRef]
  25. Zimmerle, D.; Bennett, K.; Vaughn, T.; Luck, B.; Lauderdale, T.; Keen, K.; Harrison, M.; Marchese, A.; Williams, L.; Allen, D. Characterization of Methane Emissions from Gathering Compressor Stations: Final Report; Colorado State University: Fort Collins, CO, USA, 2019. [Google Scholar]
  26. Barkley, Z.; Davis, K.; Miles, N.; Richardson, S.; Deng, A.; Hmiel, B.; Lyon, D.; Lauvaux, T. Quantification of Oil and Gas Methane Emissions in the Delaware and Marcellus Basins Using a Network of Continuous Tower-Based Measurements. Atmos. Chem. Phys. 2023, 23, 6127–6144. [Google Scholar] [CrossRef]
  27. Varon, D.J.; Jacob, D.J.; Hmiel, B.; Gautam, R.; Lyon, D.R.; Omara, M.; Sulprizio, M.; Shen, L.; Pendergrass, D.; Nesser, H.; et al. Continuous Weekly Monitoring of Methane Emissions from the Permian Basin by Inversion of TROPOMI Satellite Observations. Atmos. Chem. Phys. 2023, 23, 7503–7520. [Google Scholar] [CrossRef]
  28. Riddick, S.N.; Hancock, B.R.; Robinson, A.D.; Connors, S.; Davies, S.; Allen, G.; Pitt, J.; Harris, N.R.P. Development of a Low-Maintenance Measurement Approach to Continuously Estimate Methane Emissions: A Case Study. Waste Manag. 2018, 73, 210–219. [Google Scholar] [CrossRef]
  29. Riddick, S.N.; Connors, S.; Robinson, A.D.; Manning, A.J.; Jones, P.S.D.; Lowry, D.; Nisbet, E.; Skelton, R.L.; Allen, G.; Pitt, J.; et al. Estimating the Size of a Methane Emission Point Source at Different Scales: From Local to Landscape. Atmos. Chem. Phys. 2017, 17, 7839–7851. [Google Scholar] [CrossRef]
  30. van der Gon, H.D.; Beevers, S.; D’Allura, A.; Finardi, S.; Honoré, C.; Kuenen, J.; Perrussel, O.; Radice, P.; Theloke, J.; Uzbasich, M.; et al. Discrepancies between Top-Down and Bottom-Up Emission Inventories of Megacities: The Causes and Relevance for Modeling Concentrations and Exposure. In Proceedings of the Air Pollution Modeling and Its Application XXI; Steyn, D.G., Trini Castelli, S., Eds.; Springer: Heidelberg, The Netherlands, 2012; pp. 199–204. [Google Scholar]
  31. Vaughn, T.L.; Bell, C.S.; Pickering, C.K.; Schwietzke, S.; Heath, G.A.; Pétron, G.; Zimmerle, D.J.; Schnell, R.C.; Nummedal, D. Temporal Variability Largely Explains Top-down/Bottom-up Difference in Methane Emission Estimates from a Natural Gas Production Region. Proc. Natl. Acad. Sci. USA 2018, 115, 11712–11717. [Google Scholar] [CrossRef]
  32. Caulton, D.R.; Li, Q.; Bou-Zeid, E.; Fitts, J.P.; Golston, L.M.; Pan, D.; Lu, J.; Lane, H.M.; Buchholz, B.; Guo, X.; et al. Quantifying Uncertainties from Mobile-Laboratory-Derived Emissions of Well Pads Using Inverse Gaussian Methods. Atmos. Chem. Phys. 2018, 18, 15145–15168. [Google Scholar] [CrossRef]
  33. Golston, L.M.; Pan, D.; Sun, K.; Tao, L.; Zondlo, M.A.; Eilerman, S.J.; Peischl, J.; Neuman, J.A.; Floerchinger, C. Variability of Ammonia and Methane Emissions from Animal Feeding Operations in Northeastern Colorado. Environ. Sci. Technol. 2020, 54, 11015–11024. [Google Scholar] [CrossRef]
  34. Yu, J.; Hmiel, B.; Lyon, D.R.; Warren, J.; Cusworth, D.H.; Duren, R.M.; Chen, Y.; Murphy, E.C.; Brandt, A.R. Methane Emissions from Natural Gas Gathering Pipelines in the Permian Basin. Environ. Sci. Technol. Lett. 2022, 9, 969–974. [Google Scholar] [CrossRef] [PubMed]
  35. Kunkel, W.M.; Carre-Burritt, A.E.; Aivazian, G.S.; Snow, N.C.; Harris, J.T.; Mueller, T.S.; Roos, P.A.; Thorpe, M.J. Extension of Methane Emission Rate Distribution for Permian Basin Oil and Gas Production Infrastructure by Aerial LiDAR. Environ. Sci. Technol. 2023, 57, 12234–12241. [Google Scholar] [CrossRef] [PubMed]
  36. Irakulis-Loitxate, I.; Guanter, L.; Liu, Y.-N.; Varon, D.J.; Maasakkers, J.D.; Zhang, Y.; Chulakadabba, A.; Wofsy, S.C.; Thorpe, A.K.; Duren, R.M.; et al. Satellite-Based Survey of Extreme Methane Emissions in the Permian Basin. Sci. Adv. 2021, 7, eabf4507. [Google Scholar] [CrossRef] [PubMed]
  37. Connors, S.; Manning, A.J.; Robinson, A.D.; Riddick, S.N.; Forster, G.L.; Ganesan, A.; Grant, A.; Humphrey, S.; O’Doherty, S.; Oram, D.E.; et al. Estimates of Sub-National Methane Emissions from Inversion Modelling. Atmos. Chem. Phys. Discuss. 2018, 1–19. [Google Scholar] [CrossRef]
  38. Karion, A.; Callahan, W.; Stock, M.; Prinzivalli, S.; Verhulst, K.R.; Kim, J.; Salameh, P.K.; Lopez-Coto, I.; Whetstone, J. Greenhouse Gas Observations from the Northeast Corridor Tower Network. Earth Syst. Sci. Data 2020, 12, 699–717. [Google Scholar] [CrossRef]
  39. Lopez-Coto, I.; Ghosh, S.; Prasad, K.; Whetstone, J. Tower-Based Greenhouse Gas Measurement Network Design—The National Institute of Standards and Technology North East Corridor Testbed. Adv. Atmos. Sci. 2017, 34, 1095–1105. [Google Scholar] [CrossRef] [PubMed]
  40. Sargent, M.; Barrera, Y.; Nehrkorn, T.; Hutyra, L.R.; Gately, C.K.; Jones, T.; McKain, K.; Sweeney, C.; Hegarty, J.; Hardiman, B.; et al. Anthropogenic and Biogenic CO2 Fluxes in the Boston Urban Region. Proc. Natl. Acad. Sci. USA 2018, 115, 7491–7496. [Google Scholar] [CrossRef]
  41. Monteiro, V.C.; Miles, N.L.; Richardson, S.J.; Barkley, Z.; Haupt, B.J.; Lyon, D.; Hmiel, B.; Davis, K.J. Methane, Carbon Dioxide, Hydrogen Sulfide, and Isotopic Ratios of Methane Observations from the Permian Basin Tower Network. Earth Syst. Sci. Data 2022, 14, 2401–2417. [Google Scholar] [CrossRef]
  42. De Gouw, J.A.; Veefkind, J.P.; Roosenbrand, E.; Dix, B.; Lin, J.C.; Landgraf, J.; Levelt, P.F. Daily Satellite Observations of Methane from Oil and Gas Production Regions in the United States. Sci. Rep. 2020, 10, 1379. [Google Scholar] [CrossRef]
  43. Hu, H.; Landgraf, J.; Detmers, R.; Borsdorff, T.; Aan De Brugh, J.; Aben, I.; Butz, A.; Hasekamp, O. Toward Global Mapping of Methane With TROPOMI: First Results and Intersatellite Comparison to GOSAT. Geophys. Res. Lett. 2018, 45, 3682–3689. [Google Scholar] [CrossRef]
  44. Schneising, O.; Buchwitz, M.; Reuter, M.; Bovensmann, H.; Burrows, J.P.; Borsdorff, T.; Deutscher, N.M.; Feist, D.G.; Griffith, D.W.T.; Hase, F.; et al. A Scientific Algorithm to Simultaneously Retrieve Carbon Monoxide and Methane from TROPOMI Onboard Sentinel-5 Precursor. Atmos. Meas. Technol. 2019, 12, 6771–6802. [Google Scholar] [CrossRef]
  45. Veefkind, J.P.; Aben, I.; McMullan, K.; Förster, H.; De Vries, J.; Otter, G.; Claas, J.; Eskes, H.J.; De Haan, J.F.; Kleipool, Q.; et al. TROPOMI on the ESA Sentinel-5 Precursor: A GMES Mission for Global Observations of the Atmospheric Composition for Climate, Air Quality and Ozone Layer Applications. Remote Sens. Environ. 2012, 120, 70–83. [Google Scholar] [CrossRef]
  46. Enverus Enverus. 2023. Available online: https://www.enverus.com/ (accessed on 15 June 2023).
  47. IPCC. IPCC Guidelines for National Greenhouse Gas Inventories. 2006. Available online: https://www.ipcc-nggip.iges.or.jp/public/2006gl/pdf/1_volume1/v1_3_ch3_uncertainties.pdf (accessed on 13 September 2023).
  48. EIA U.S. Energy Information Administration. Advances in Technology Led to Record New Well Productivity in the Permian Basin in 2021. 2022. Available online: https://www.eia.gov/todayinenergy/detail.php?id=54079#tab1 (accessed on 13 September 2023).
  49. Robertson, A.M.; Edie, R.; Field, R.A.; Lyon, D.; McVay, R.; Omara, M.; Zavala-Araiza, D.; Murphy, S.M. New Mexico Permian Basin Measured Well Pad Methane Emissions Are a Factor of 5–9 Times Higher Than U.S. EPA Estimates. Environ. Sci. Technol. 2020, 54, 13926–13934. [Google Scholar] [CrossRef] [PubMed]
  50. Allen, D.T.; Cardoso-Saldaña, F.J.; Kimura, Y.; Chen, Q.; Xiang, Z.; Zimmerle, D.; Bell, C.; Lute, C.; Duggan, J.; Harrison, M. A Methane Emission Estimation Tool (MEET) for Predictions of Emissions from Upstream Oil and Gas Well Sites with Fine Scale Temporal and Spatial Resolution: Model Structure and Applications. Sci. Total Environ. 2022, 829, 154277. [Google Scholar] [CrossRef] [PubMed]
  51. Allen, D.T.; Pacsi, A.P.; Sullivan, D.W.; Zavala-Araiza, D.; Harrison, M.; Keen, K.; Fraser, M.P.; Daniel Hill, A.; Sawyer, R.F.; Seinfeld, J.H. Methane Emissions from Process Equipment at Natural Gas Production Sites in the United States: Pneumatic Controllers. Environ. Sci. Technol. 2015, 49, 633–640. [Google Scholar] [CrossRef]
  52. Plant, G.; Kort, E.A.; Brandt, A.R.; Chen, Y.; Fordice, G.; Gorchov Negron, A.M.; Schwietzke, S.; Smith, M.; Zavala-Araiza, D. Inefficient and Unlit Natural Gas Flares Both Emit Large Quantities of Methane. Science 2022, 377, 1566–1571. [Google Scholar] [CrossRef]
  53. Zimmerle, D.; Vaughn, T.; Luck, B.; Lauderdale, T.; Keen, K.; Harrison, M.; Marchese, A.; Williams, L.; Allen, D. Methane Emissions from Gathering Compressor Stations in the U.S. Environ. Sci. Technol. 2020, 54, 7552–7561. [Google Scholar] [CrossRef]
  54. Lamb, B.K.; McManus, J.B.; Shorter, J.H.; Kolb, C.E.; Mosher, B.; Harriss, R.C.; Allwine, E.; Blaha, D.; Howard, T.; Guenther, A.; et al. Development of Atmospheric Tracer Methods to Measure Methane Emissions from Natural Gas Facilities and Urban Areas. Environ. Sci. Technol. 1995, 29, 1468–1479. [Google Scholar] [CrossRef]
  55. Zavala-Araiza, D.; Alvarez, R.A.; Lyon, D.R.; Allen, D.T.; Marchese, A.J.; Zimmerle, D.J.; Hamburg, S.P. Super-Emitters in Natural Gas Infrastructure Are Caused by Abnormal Process Conditions. Nat. Commun. 2017, 8, 14012. [Google Scholar] [CrossRef]
  56. Edie, R.; Robertson, A.M.; Field, R.A.; Soltis, J.; Snare, D.A.; Zimmerle, D.; Bell, C.S.; Vaughn, T.L.; Murphy, S.M. Constraining the Accuracy of Flux Estimates Using OTM 33A. Atmos. Meas. Technol. 2020, 13, 341–353. [Google Scholar] [CrossRef]
  57. CAPP Canadian Association of Petroleum Producers. CH4 and VOC Emissions from the Canadian Upstream Oil and Gas Industry; Calgary, A.B., Ed.; CAPP Canadian Association of Petroleum Producers: Calgary, AB, Canada, 1999; Volume 1–4. [Google Scholar]
  58. CAPP Canadian Association of Petroleum Producers. A National Inventory of Greenhouse Gas (GHG), Criteria Air Contaminant (CAC) and Hydrogen Sulphide (H2S) Emissions by the Upstream Oil and Gas Industry; Calgary, A.B., Ed.; CAPP Canadian Association of Petroleum Producers: Calgary, AB, Canada, 2004; Volume 1–5. [Google Scholar]
  59. API American Petroleum Institute. Compendium of Greenhouse Gas Emissions Estimation Methodologies for the Oil and Gas Industry; API American Petroleum Institute: Washington, DC, USA, 2004. [Google Scholar]
  60. GRI and EPA; Harrison, M.R.; Shires, T.M.; Wessels, J.K.; Cowgill, R.M. Methane Emissions from the Natural Gas Industry, Volumes 1–15, Final Report, GRI-94/0257 and EPA-600/R-96-080; Gas Research Institute: Des Plaines, IL, USA; U.S. Environmental Protection Agency: Washington, DC, USA, 1996. [Google Scholar]
  61. EPA Environmental Protection Agency—Method 21—Determination of Volatile Organic Compound Leaks. 2017. Available online: https://www.epa.gov/sites/default/files/2017-08/documents/method_21.pdf (accessed on 21 January 2020).
  62. Harrison, M.R.; Campbell, L.M.; Shires, T.M.; Cowgill, R.M. Methane Emissions from the Natural Gas Industry, Volume 2: Technical Report, Final Report, GRI-94/0257.1 and EPA-600/R-96-080b; Gas Research Institute: Des Plaines, IL, USA; U.S. Environmental Protection Agency: Washington, DC, USA, 1996. Available online: https://www.epa.gov/sites/default/files/2016-08/documents/2_technicalreport.pdf (accessed on 12 January 2024).
  63. Targa Resources Targa Resources. Gathering and Processing Segment. Permian Delaware. 2022. Available online: https://www.targaresources.com/operations/gathering-processing-segment (accessed on 13 September 2023).
  64. Duren, R.; Gordon, D. Tackling Unlit and Inefficient Gas Flaring. Science 2022, 377, 1486–1487. [Google Scholar] [CrossRef] [PubMed]
  65. Duren, R.M.; Thorpe, A.K.; Foster, K.T.; Rafiq, T.; Hopkins, F.M.; Yadav, V.; Bue, B.D.; Thompson, D.R.; Conley, S.; Colombi, N.K.; et al. California’s Methane Super-Emitters. Nature 2019, 575, 180–184. [Google Scholar] [CrossRef] [PubMed]
  66. Ayasse, A.K.; Thorpe, A.K.; Cusworth, D.H.; Kort, E.A.; Negron, A.G.; Heckler, J.; Asner, G.; Duren, R.M. Methane Remote Sensing and Emission Quantification of Offshore Shallow Water Oil and Gas Platforms in the Gulf of Mexico. Environ. Res. Lett. 2022, 17, 084039. [Google Scholar] [CrossRef]
  67. Hmiel, B.; Lyon, D.R.; Warren, J.D.; Yu, J.; Cusworth, D.H.; Duren, R.M.; Hamburg, S.P. Empirical Quantification of Methane Emission Intensity from Oil and Gas Producers in the Permian Basin. Environ. Res. Lett. 2023, 18, 024029. [Google Scholar] [CrossRef]
  68. COGCC. Colorado Oil and Gas Conservation Commission—Colorado Oil and Gas Information System (COGIS). 2023. Available online: https://cogcc.state.co.us/data.html (accessed on 3 June 2023).
  69. API American Petroleum Institute. Calculation Workbook for Oil and Gas Production Equipment Fugitive Emissions STANDARD by American Petroleum Institute; API American Petroleum Institute: Washington, DC, USA, 1996. [Google Scholar]
  70. EIA U.S. Energy Information Administration. Natural Gas Annual Report. 2022. Available online: https://www.eia.gov/naturalgas/annual/ (accessed on 13 June 2023).
Figure 1. (A) Simple site configuration. The MAES model assumes such sites are composed by one continuous well and a high-pressure separator operating at 204.5 psia. (B) Complex site configuration. The MAES model assumes such sites are composed of 2 continuous wells; 2× stage 1 separators operating at 118.65 psia, 1× stage 2 separator operating at 39.65 psia, and 1× VRT in the 3rd stage of separation at 16.79 psi; 1× water tank battery; 1× oil tank battery; 1× 1029 kW 4SLB driver for a reciprocating compressor operating as a gas lift; 1× 10⁸ kW 4SRB compressor at the second stage of separation operating as a VRU; 1× 70.8 kW 4SRB compressor at the third stage of separation operating as a VRU; 2 flares: one connected to a water tank and the other to an oil tank.
Atmosphere 15 00202 g001
Table 1. IPCC emission factors (EFs) based on those reported by the US EPA [15] for typical equipment on well pads [59]. Simple sites comprise well heads only, complex sites have separators, heaters, and small compressors [20].
SourceFugitive EF
(g CH4 Equip−1 h−1)
Vented EF *
(g CH4 Equip−1 h−1)
Simple Site
(g CH4 Equip−1 h−1)
Complex Site
(g CH4 Equip−1 h−1)
Well heads29 2929
Separators70 70
Kimray Valve 165 165
Heaters73 73
Small Comp339 339
Tanks 1758 1758
Dehydrator114102 216
Facility emission
(FE)
FES
(g CH4 site−1 h−1)
FEC
(g CH4 site−1 h−1)
Historic 292706
Contemporary 405200
* Estimated vented emissions for the Delaware basin using published emission factors [59], 2020 production rates [46] and site numbers [20]. Historic facility emission factors are based on measurement data from API (2004), while contemporary facility emission factors are based on measurements reported in Zhang et al. (2020) and Robertson et al. (2020) [49].
Table 2. Current and updated bottom-up (BU) Tier 1 (T1), Tier 2 (T2), and MAES emission estimates and percentage of natural gas (NG) produced using alternate emission factors described in Section 2 and Section 3. Category Source: Fl—Flaring, Fu—Fugitive, and V—Venting.
CategoryCurrent T1
(Gg CH4 y−1)
Updated T1
(Gg CH4 y−1)
Change (%)Current T2
(Gg CH4 y−1)
Updated T2 (Gg CH4 y−1)Change (%)MAES
(Gg CH4 y−1)
Gas production (Fu)140196+40146241+65
Gas Production (Fl)0.10.7+2900110+900
Oil Production (Fu)242337+3954484+765
Oil Production (V)97206+210136
Oil Production (Fl)322+30029203+600
Large Fugitives (Fu)-136 --
Production482898+862301074+367880
Servicing (Fl/V)15133+7871215+21,400
Gas Trans (Fu & V)3274+13457127+125
Liquid Transport (Fu)16160027
Gas Processing (Fu)6286+392282+272
Gas Processing (Fl)01.4 14+300
Oil Processing00 417+325
Total (Gg CH4 y−1)6071209+993151546+390
Normalized loss (%)1.10 2.25  0.57 2.81 
Uncertainty (%)±21.2 ±21.9  ±21.7 ±21.1 
Range (Gg CH4 y−1)478, 736 944, 1474  247, 383 1220, 1872
Table 3. Current emission factors used to derive EPA GHGI reports and data from recent measurement studies accounting for large emitters [55].
Source2020 EPA EFUnitsSuggested EFUnits
Large Tanks w/VRU2 kg/MMbbl28 kg/site 
Large Tanks w/o Control38 kg/MMbbl639 kg/site 
Small Tanks w/o Flares99 kg/MMbbl1679 kg/site 
Pneumatic Devices, High Bleed4066 kg/device12,128 kg/device 
Pneumatic Devices, Low Bleed161 kg/device481 kg/device 
Pneumatic Devices, Int Bleed1556 kg/device4643 kg/device 
Chemical Injection Pumps1518 kg/pump1577 kg/pump 
Oil Wellheads117  kg/well1314 kg/well 
Compressors703 kg/compressor876 kg/compressor
Produced Water14,198 kg/MMbbl736 kg/Site 
Table 4. The 2020 activity data, as calculated by EPA methodology, and suggested activity data derived from recent publications.
Source2020 Activity DataUnitSuggested Activity DataUnits
Large Tanks w/VRU213  MMbbls21,932  Sites  
Large Tanks w/o Control145  MMbbls14,915  Sites  
Small Tanks w/o Flares6  MMbbls639  Sites  
High Bleed257  Pneumatics849  Pneumatics  
Low Bleed14,706  Pneumatics48,625  Pneumatics  
Intermittent Bleed15,647  Pneumatics51,738  Pneumatics  
Separators1.05 Sep/well1.24 Sep/well  
Heater/Treaters0.17 Heater/well1.00 Heater/well  
Headers2.77 Header/well0.67 Header/well  
Compressors0.10 Comp/well0.64 Comp/well  
Disclaimer/Publisher’s Note: The statements, opinions and data contained in all publications are solely those of the individual author(s) and contributor(s) and not of MDPI and/or the editor(s). MDPI and/or the editor(s) disclaim responsibility for any injury to people or property resulting from any ideas, methods, instructions or products referred to in the content.

