
Research on the Identification of Typical Terrain Patterns in Yunnan Province Based on the K-Means Technology
 , ,
, , 
Abstract
:1. Introduction
2. Study Area, Data and Methods
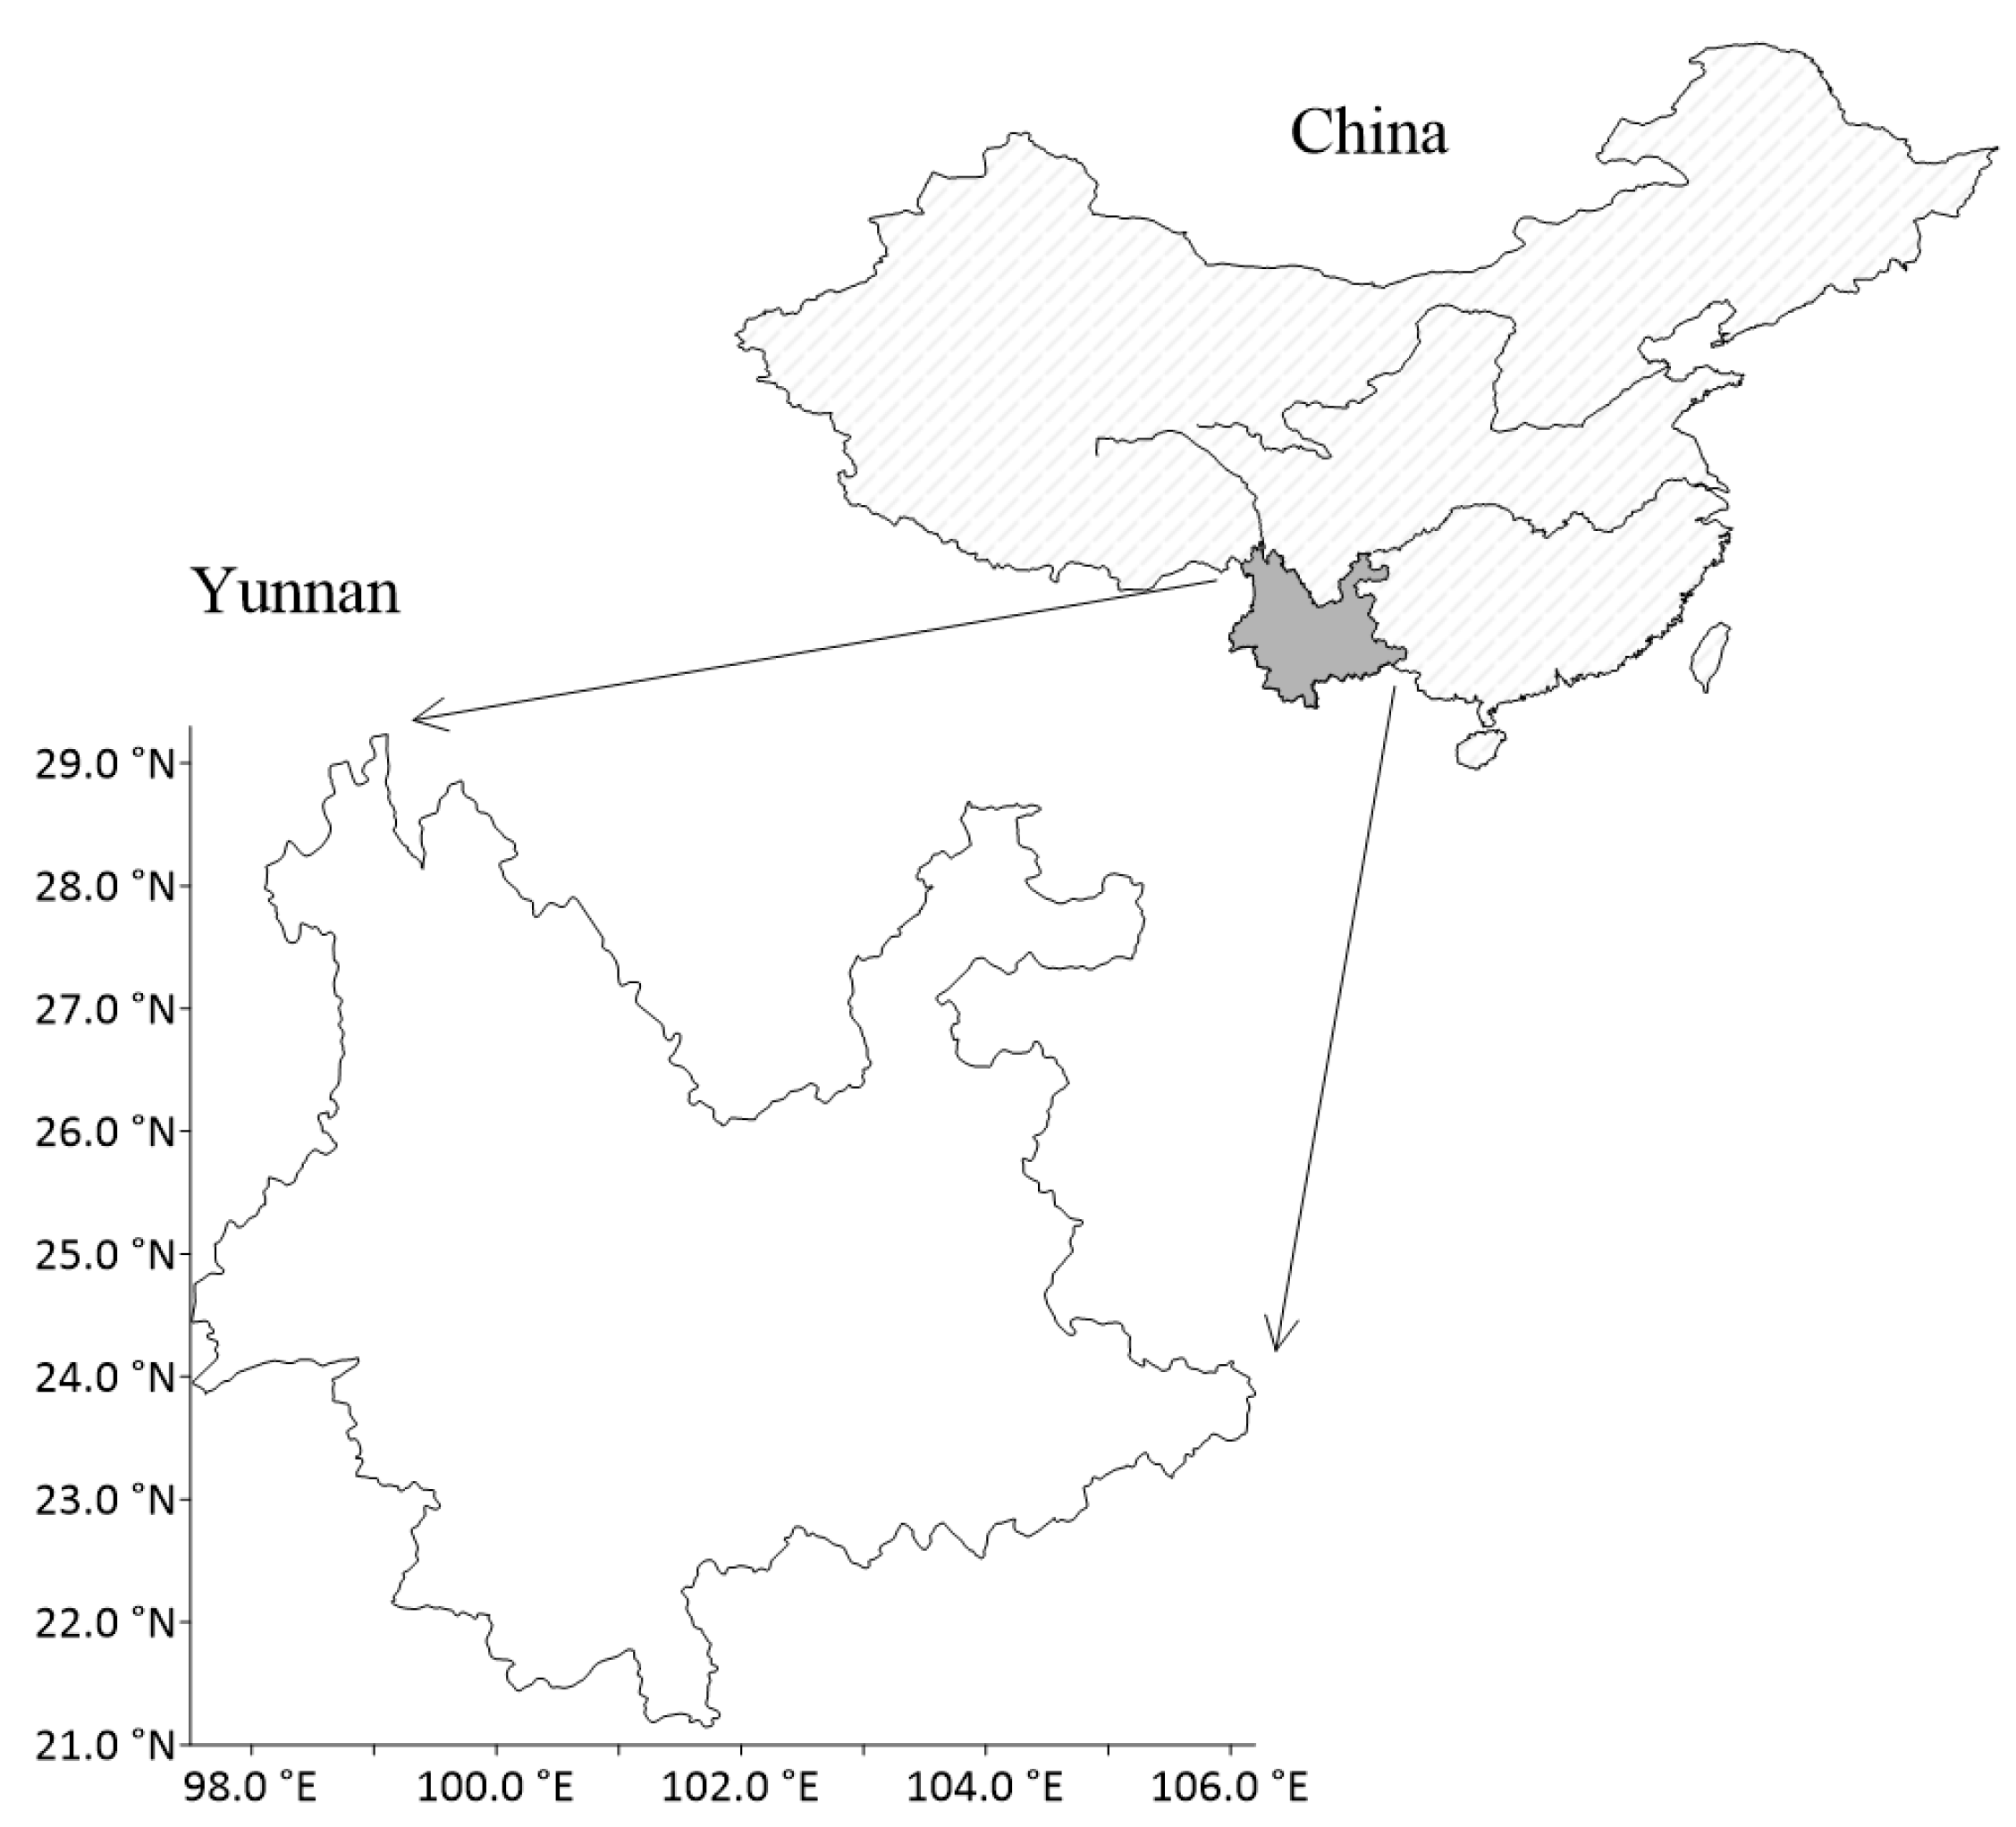
2.1. Study Area
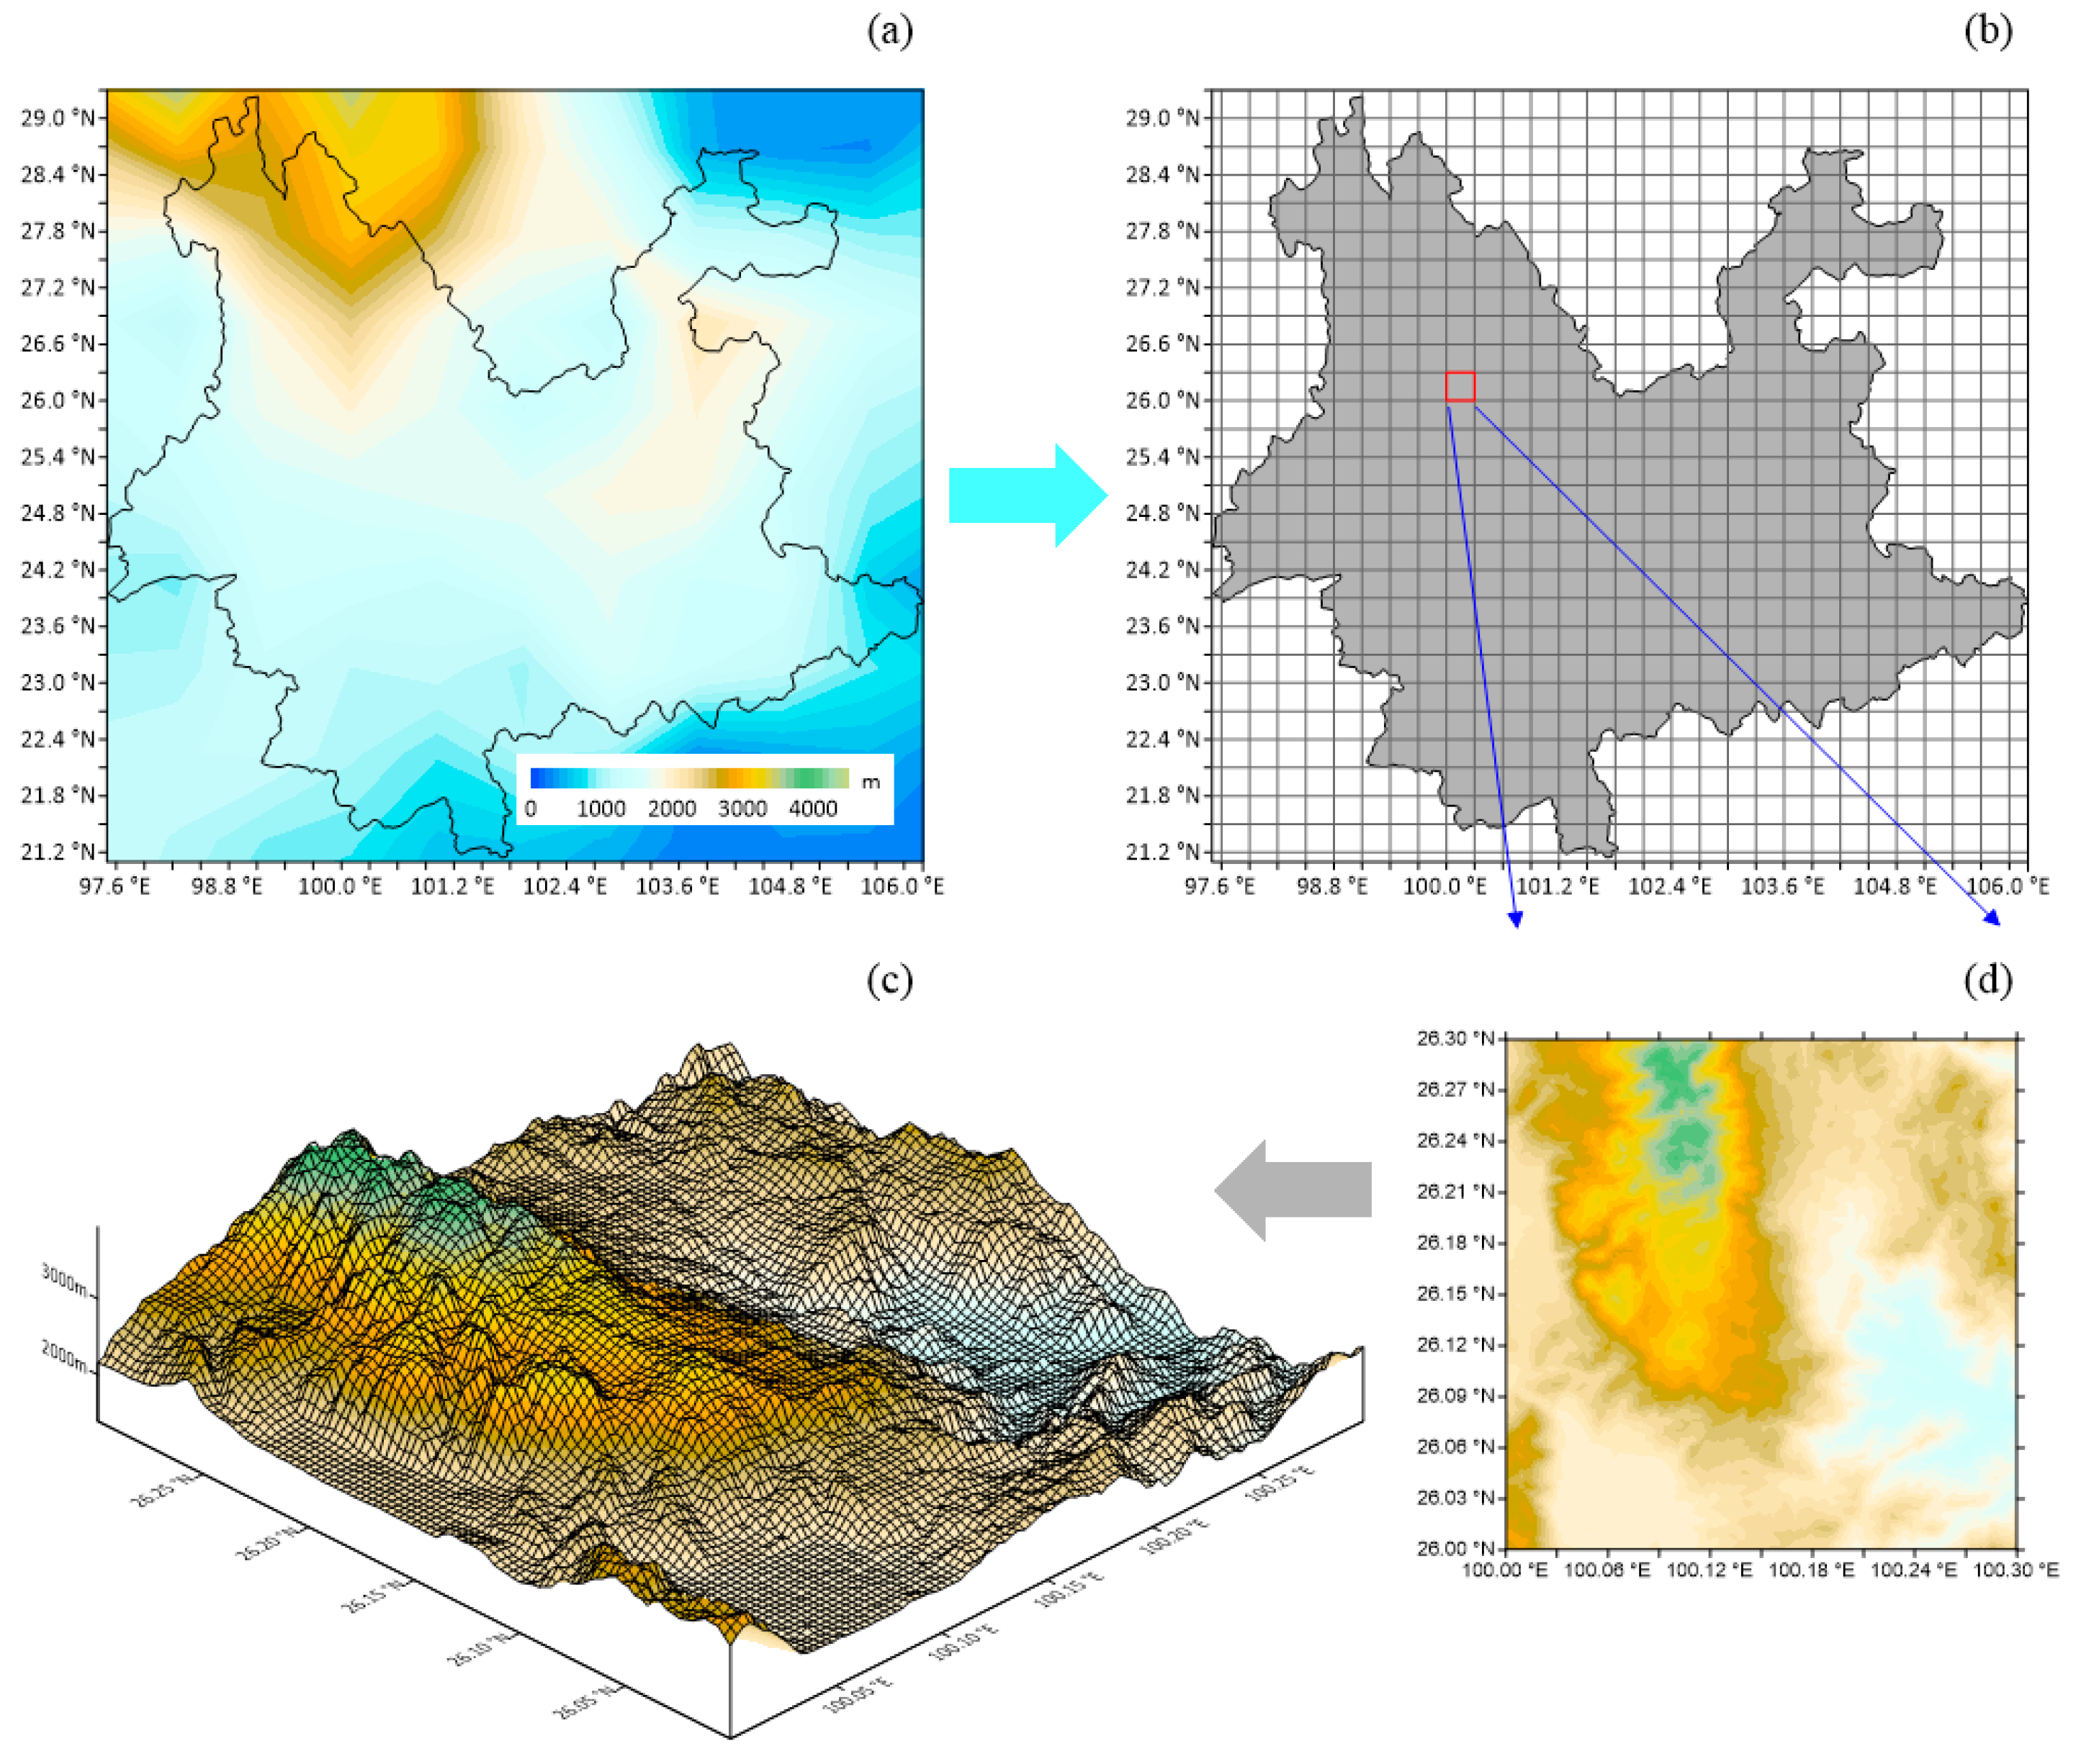
2.2. Data
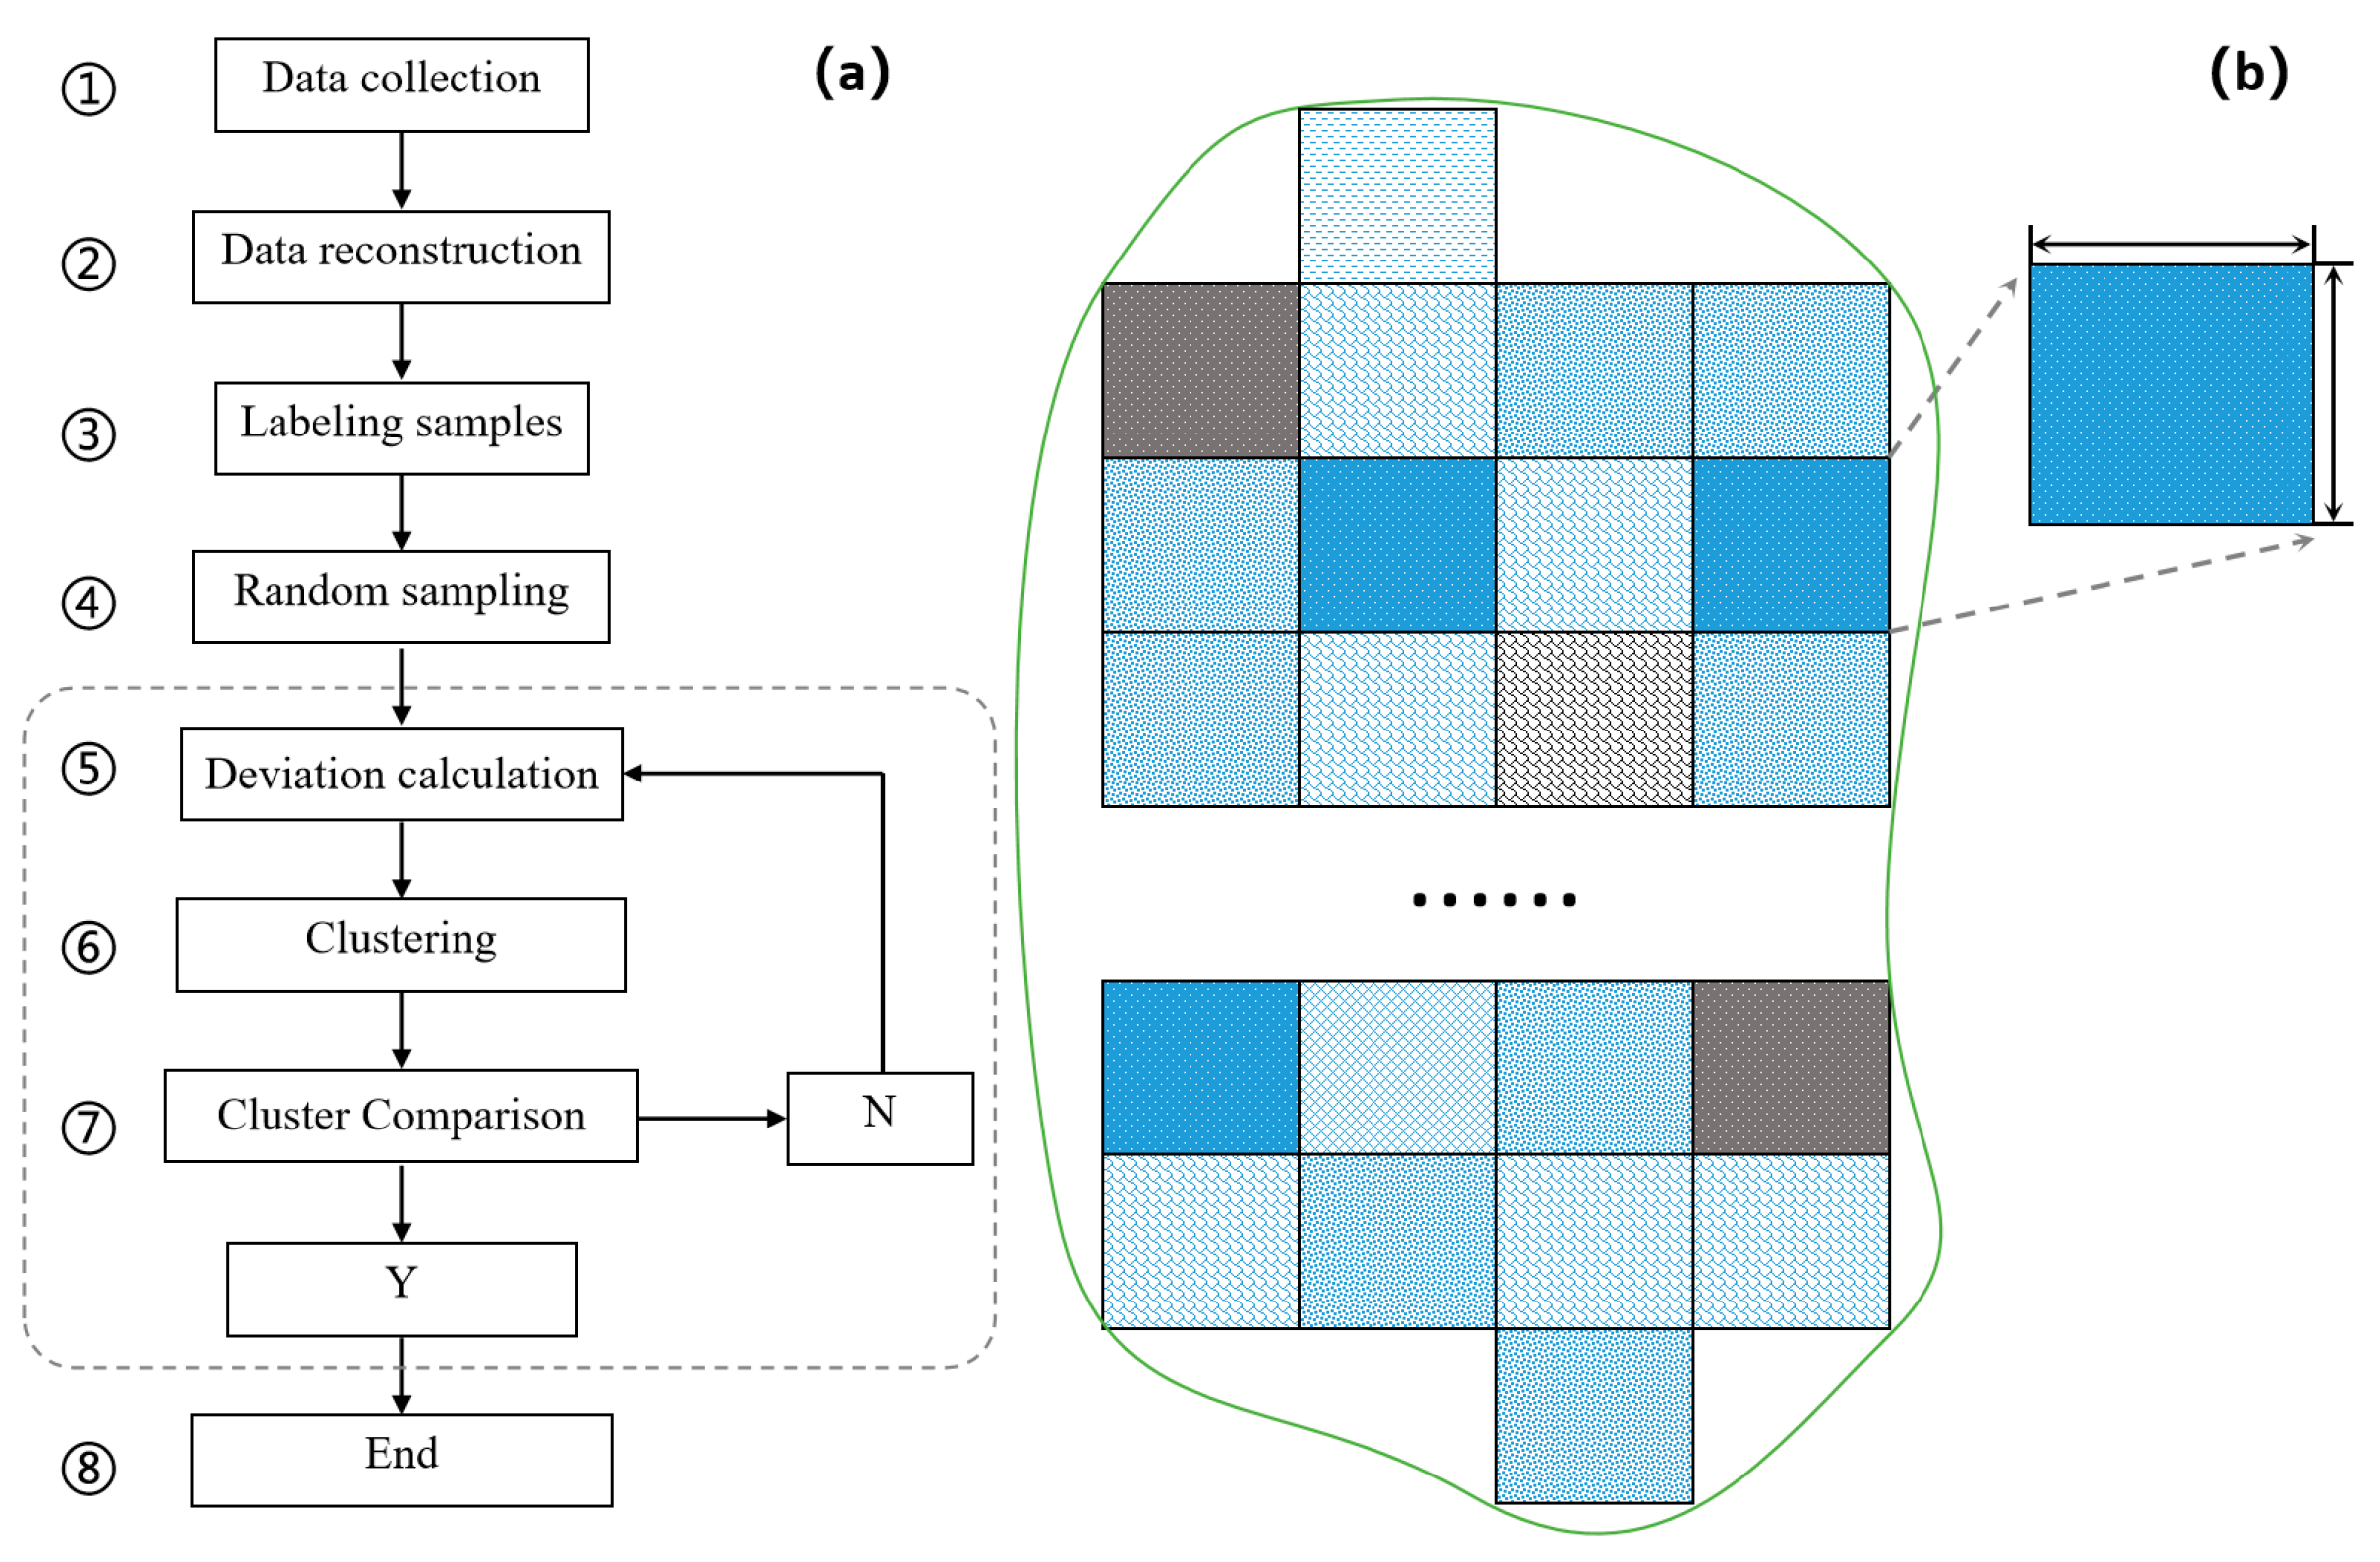
2.3. Typical Terrain Pattern Identification Method Based on the K-Means Method
3. Identifying Typical Terrain of Yunnan Province
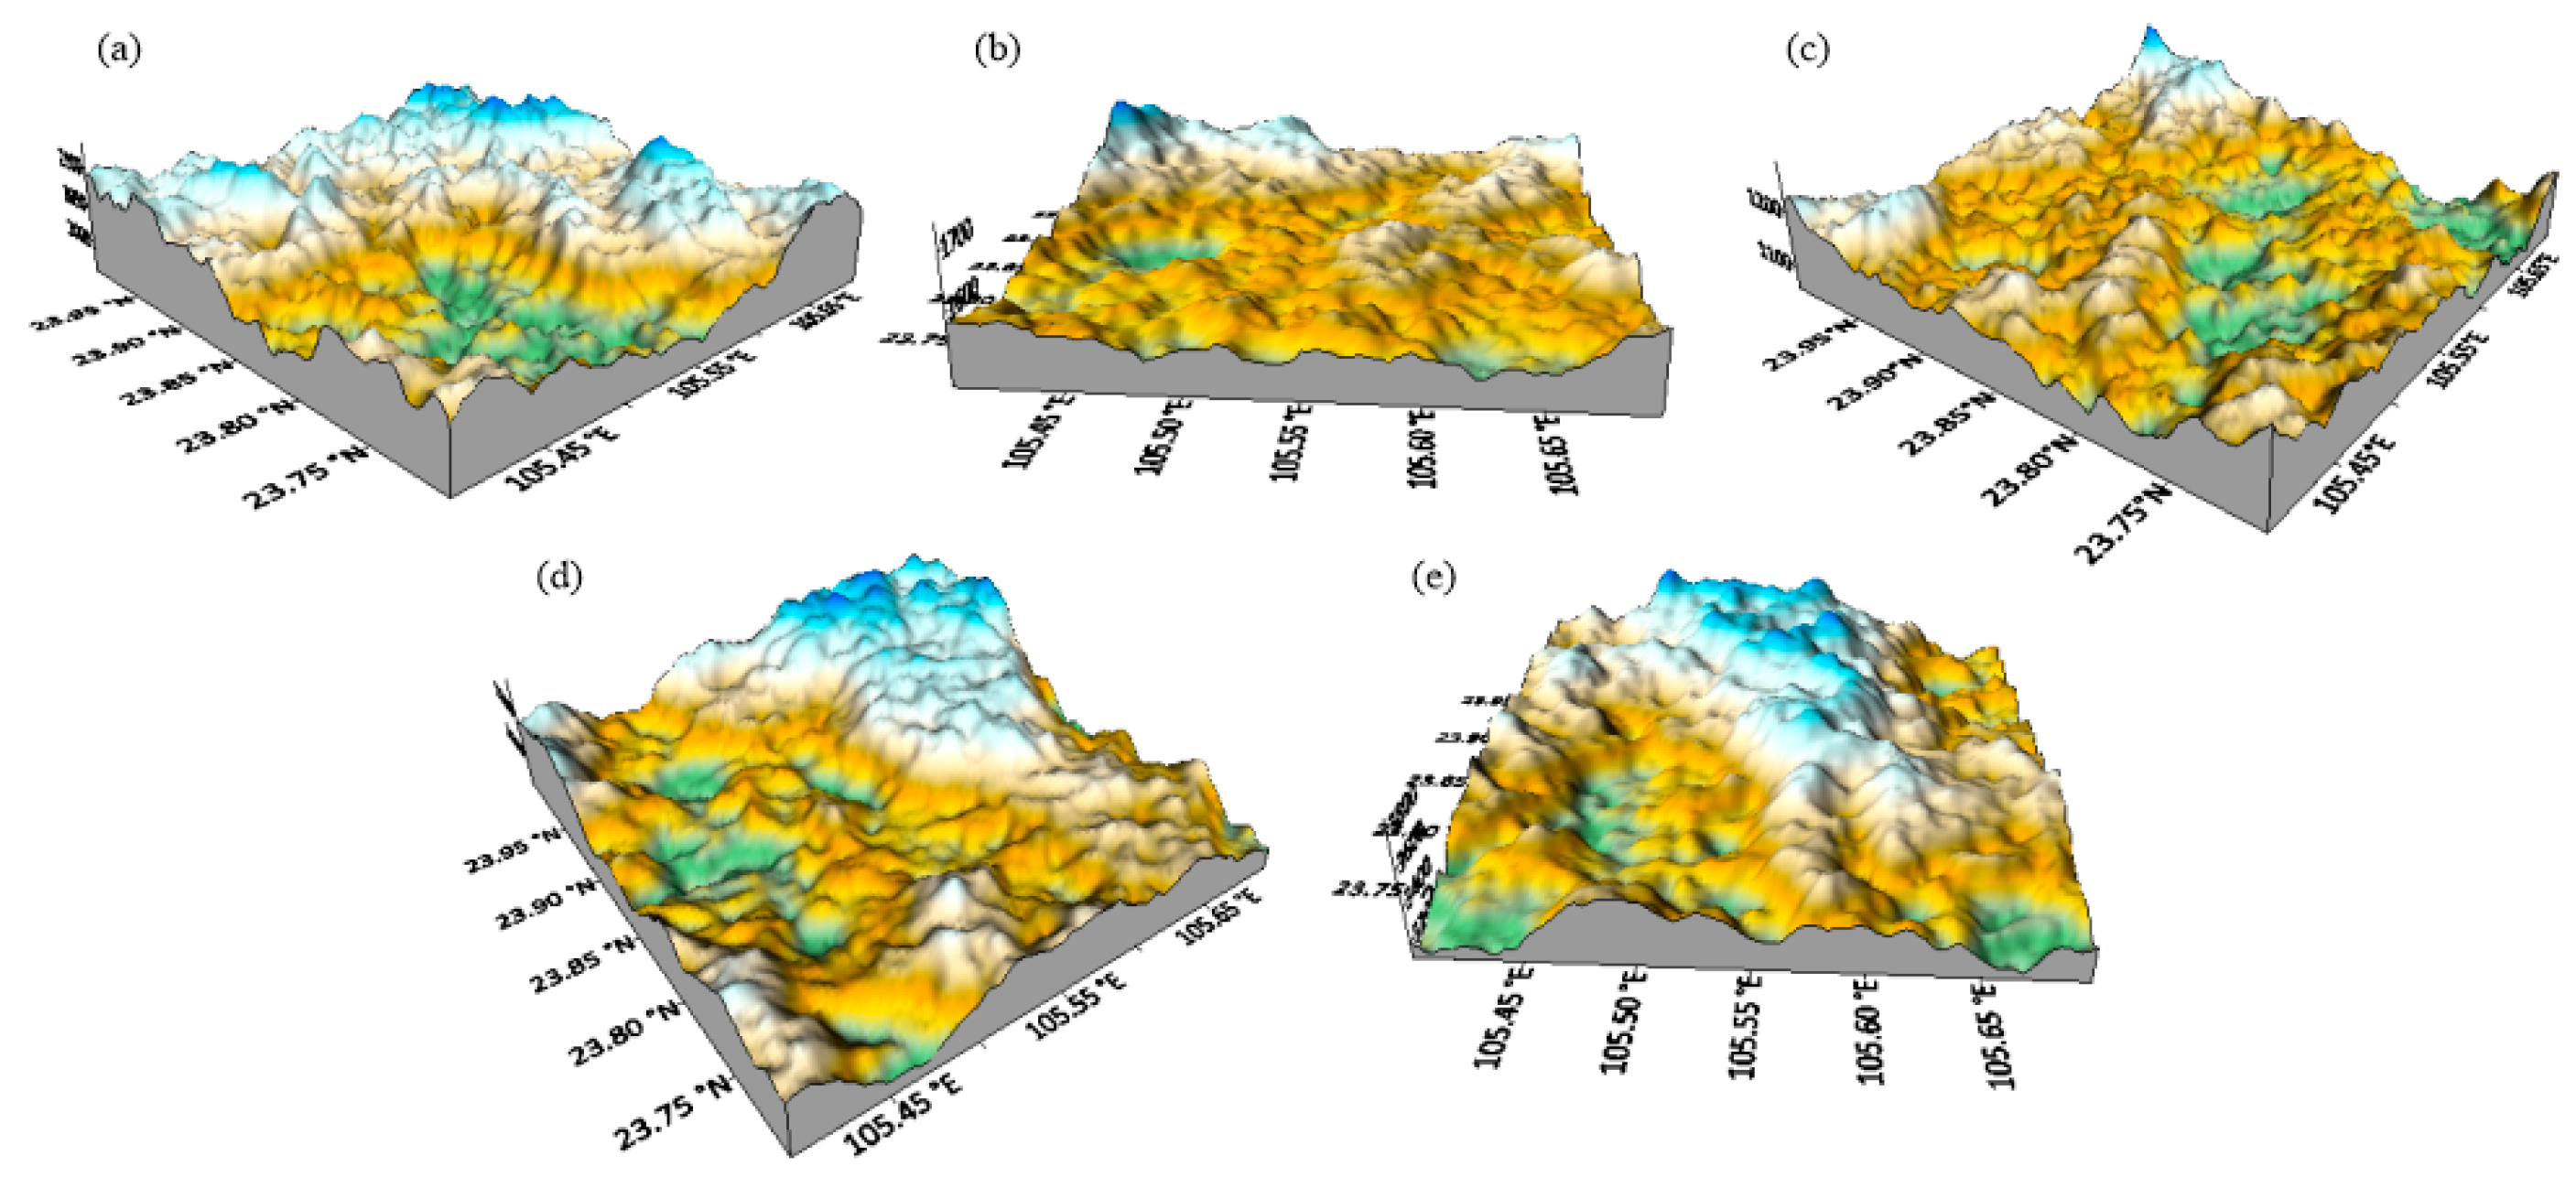
3.1. Features of Typical Terrain Patterns
3.2. Features of Representative Typical Terrain Patterns
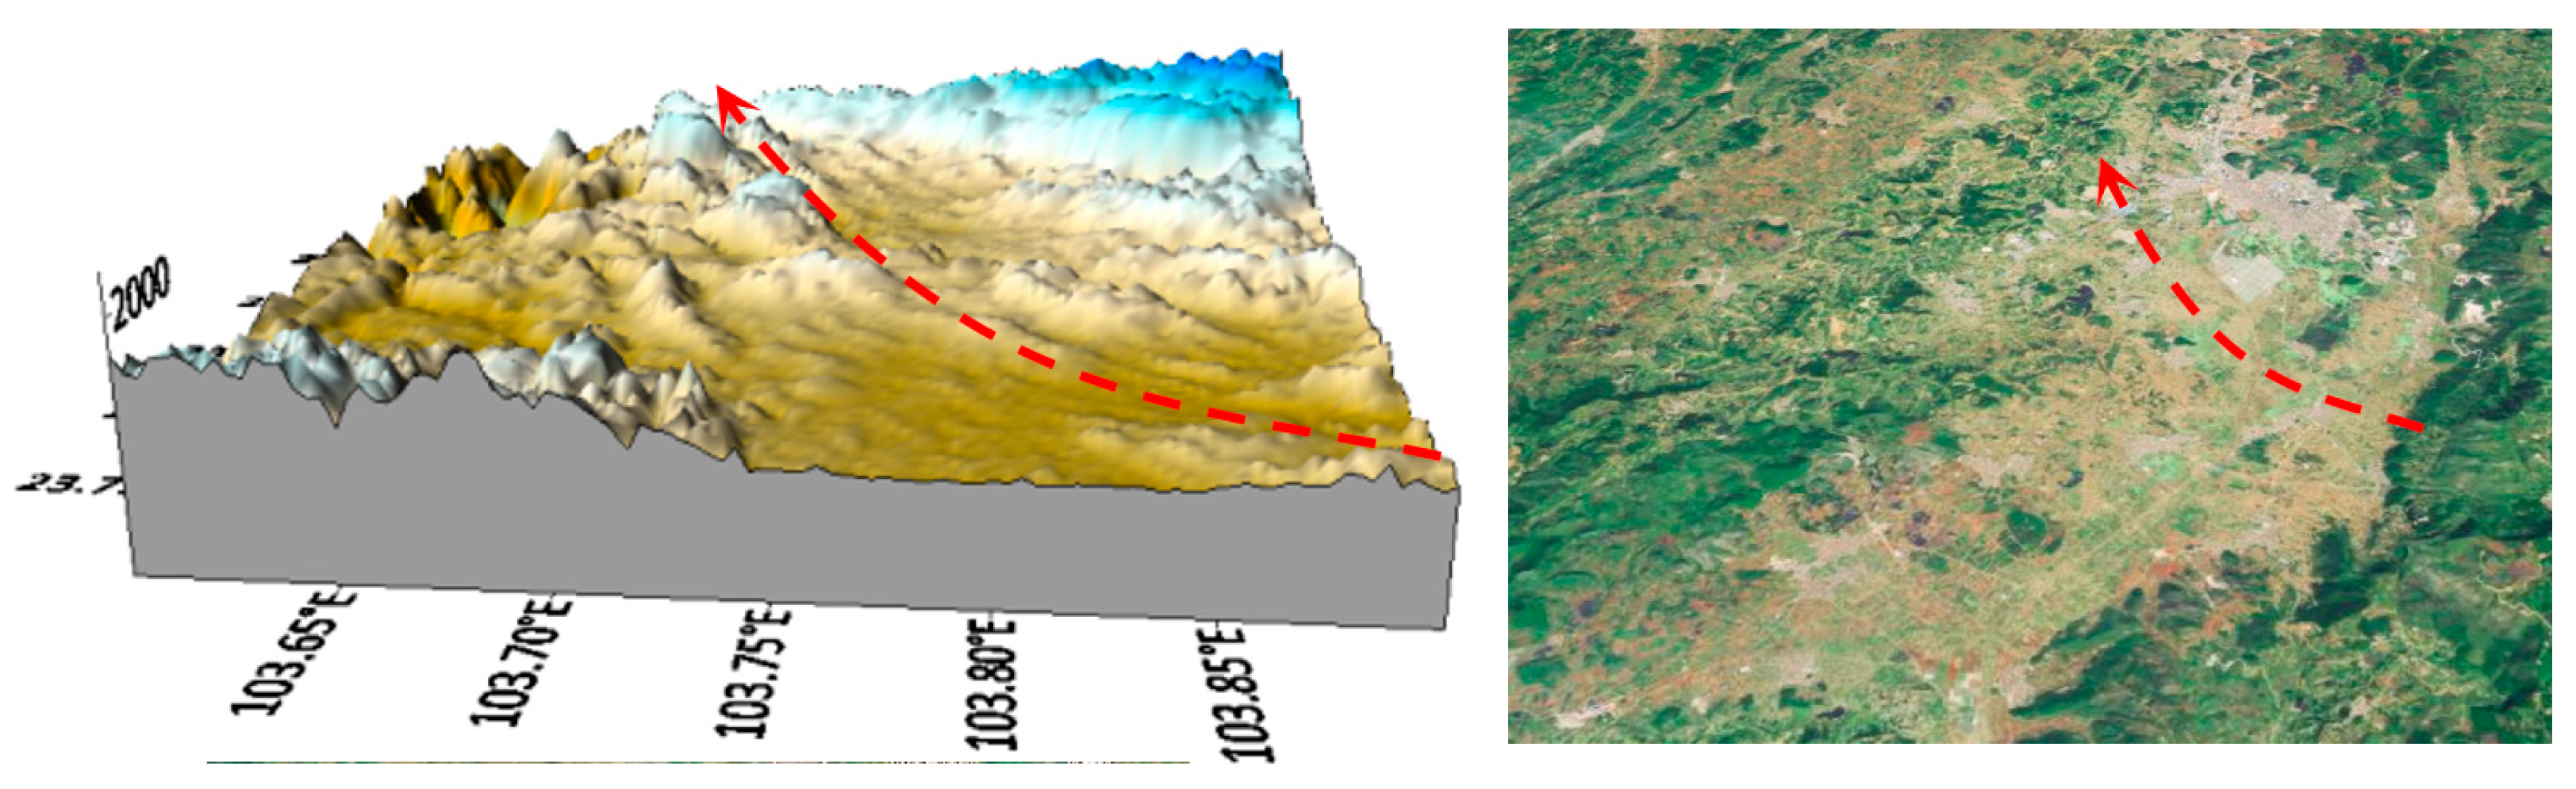
3.2.1. “Valley-Air Channel” Pattern
3.2.2. “Topographic Uplifting” Pattern
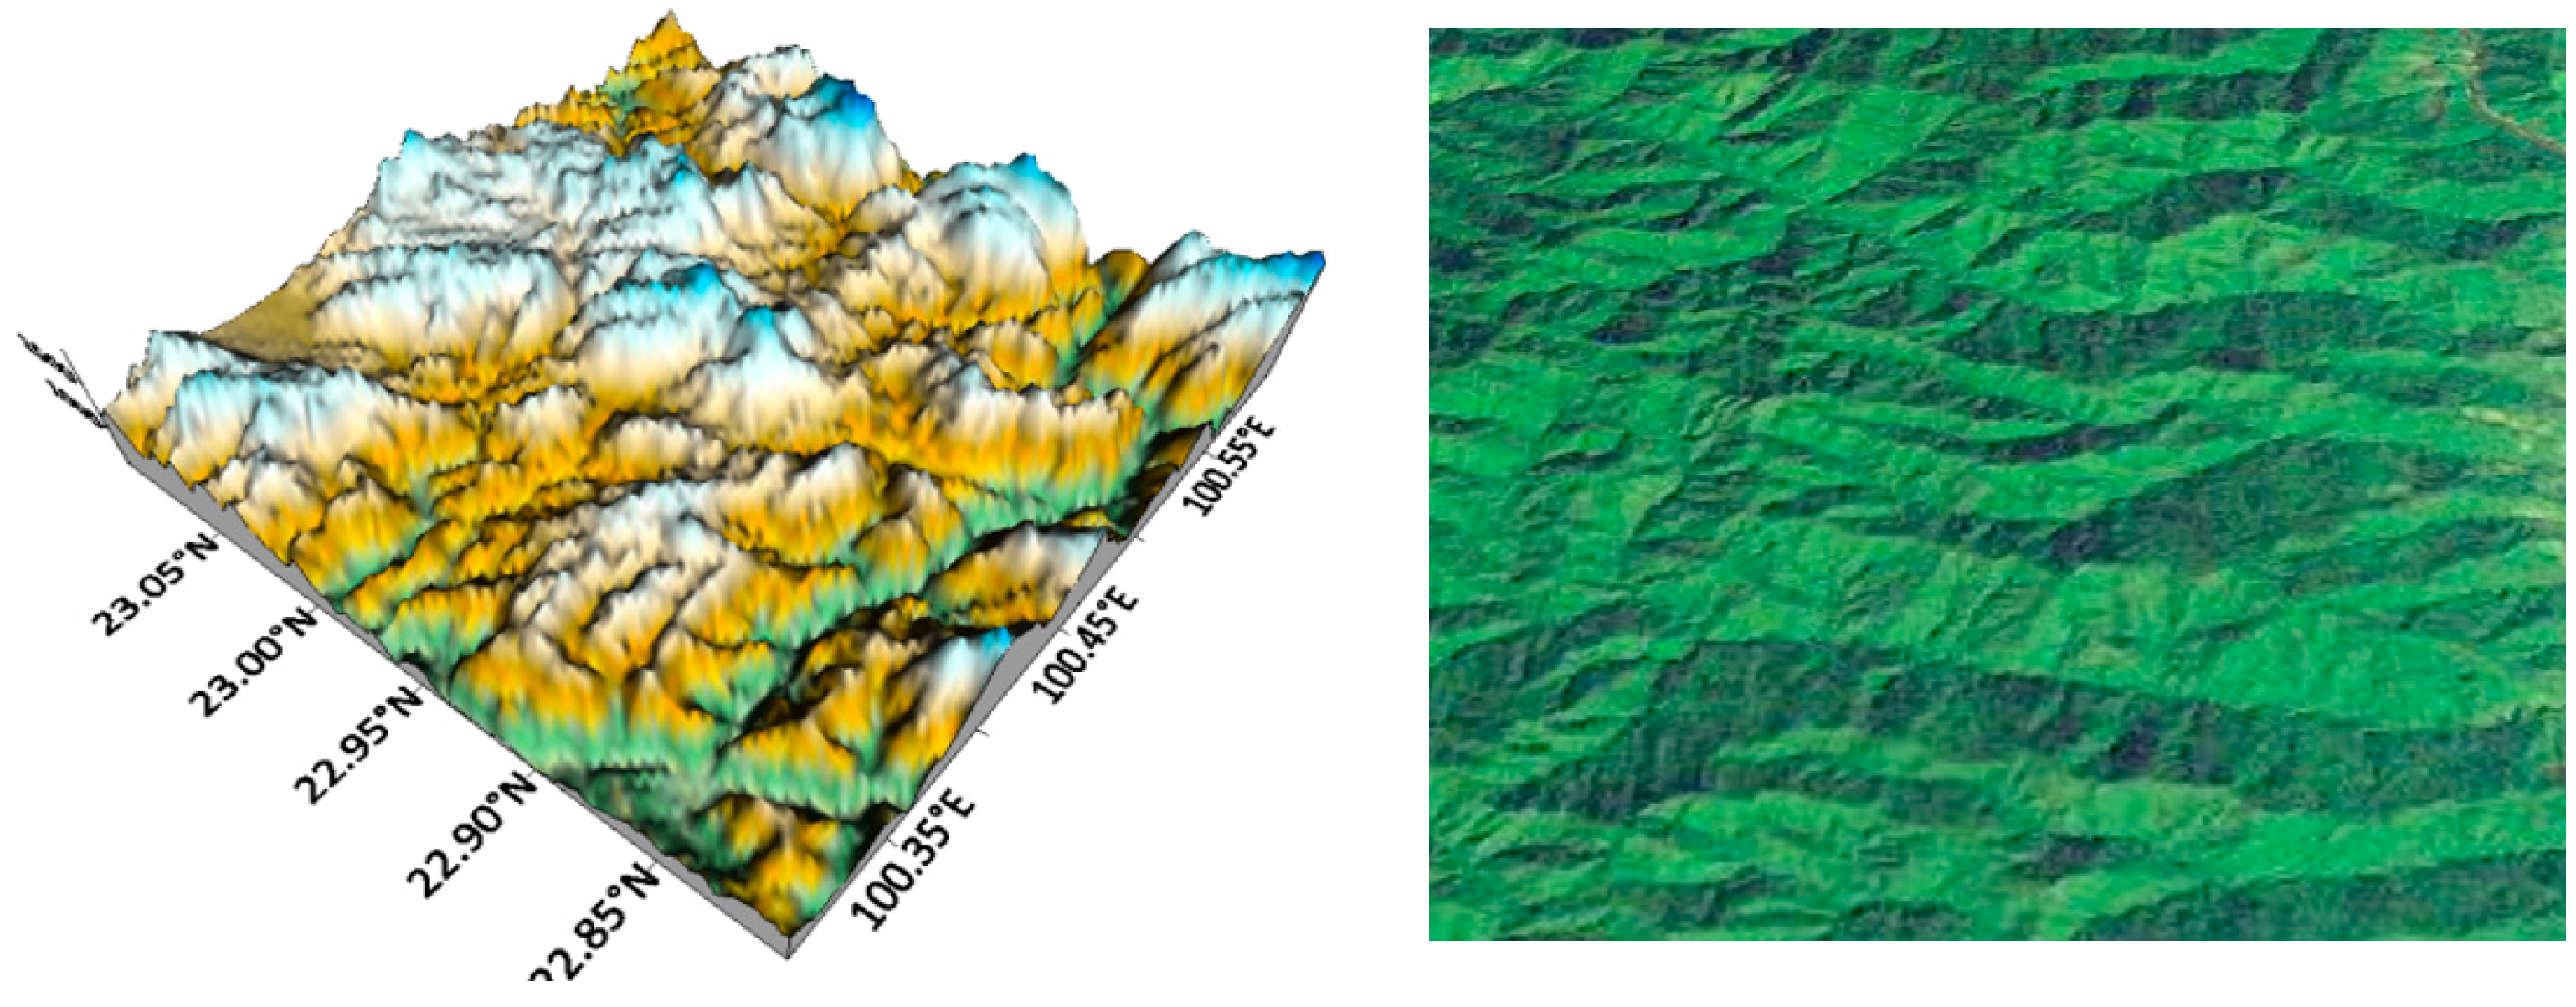
3.2.3. “Ravine” Pattern
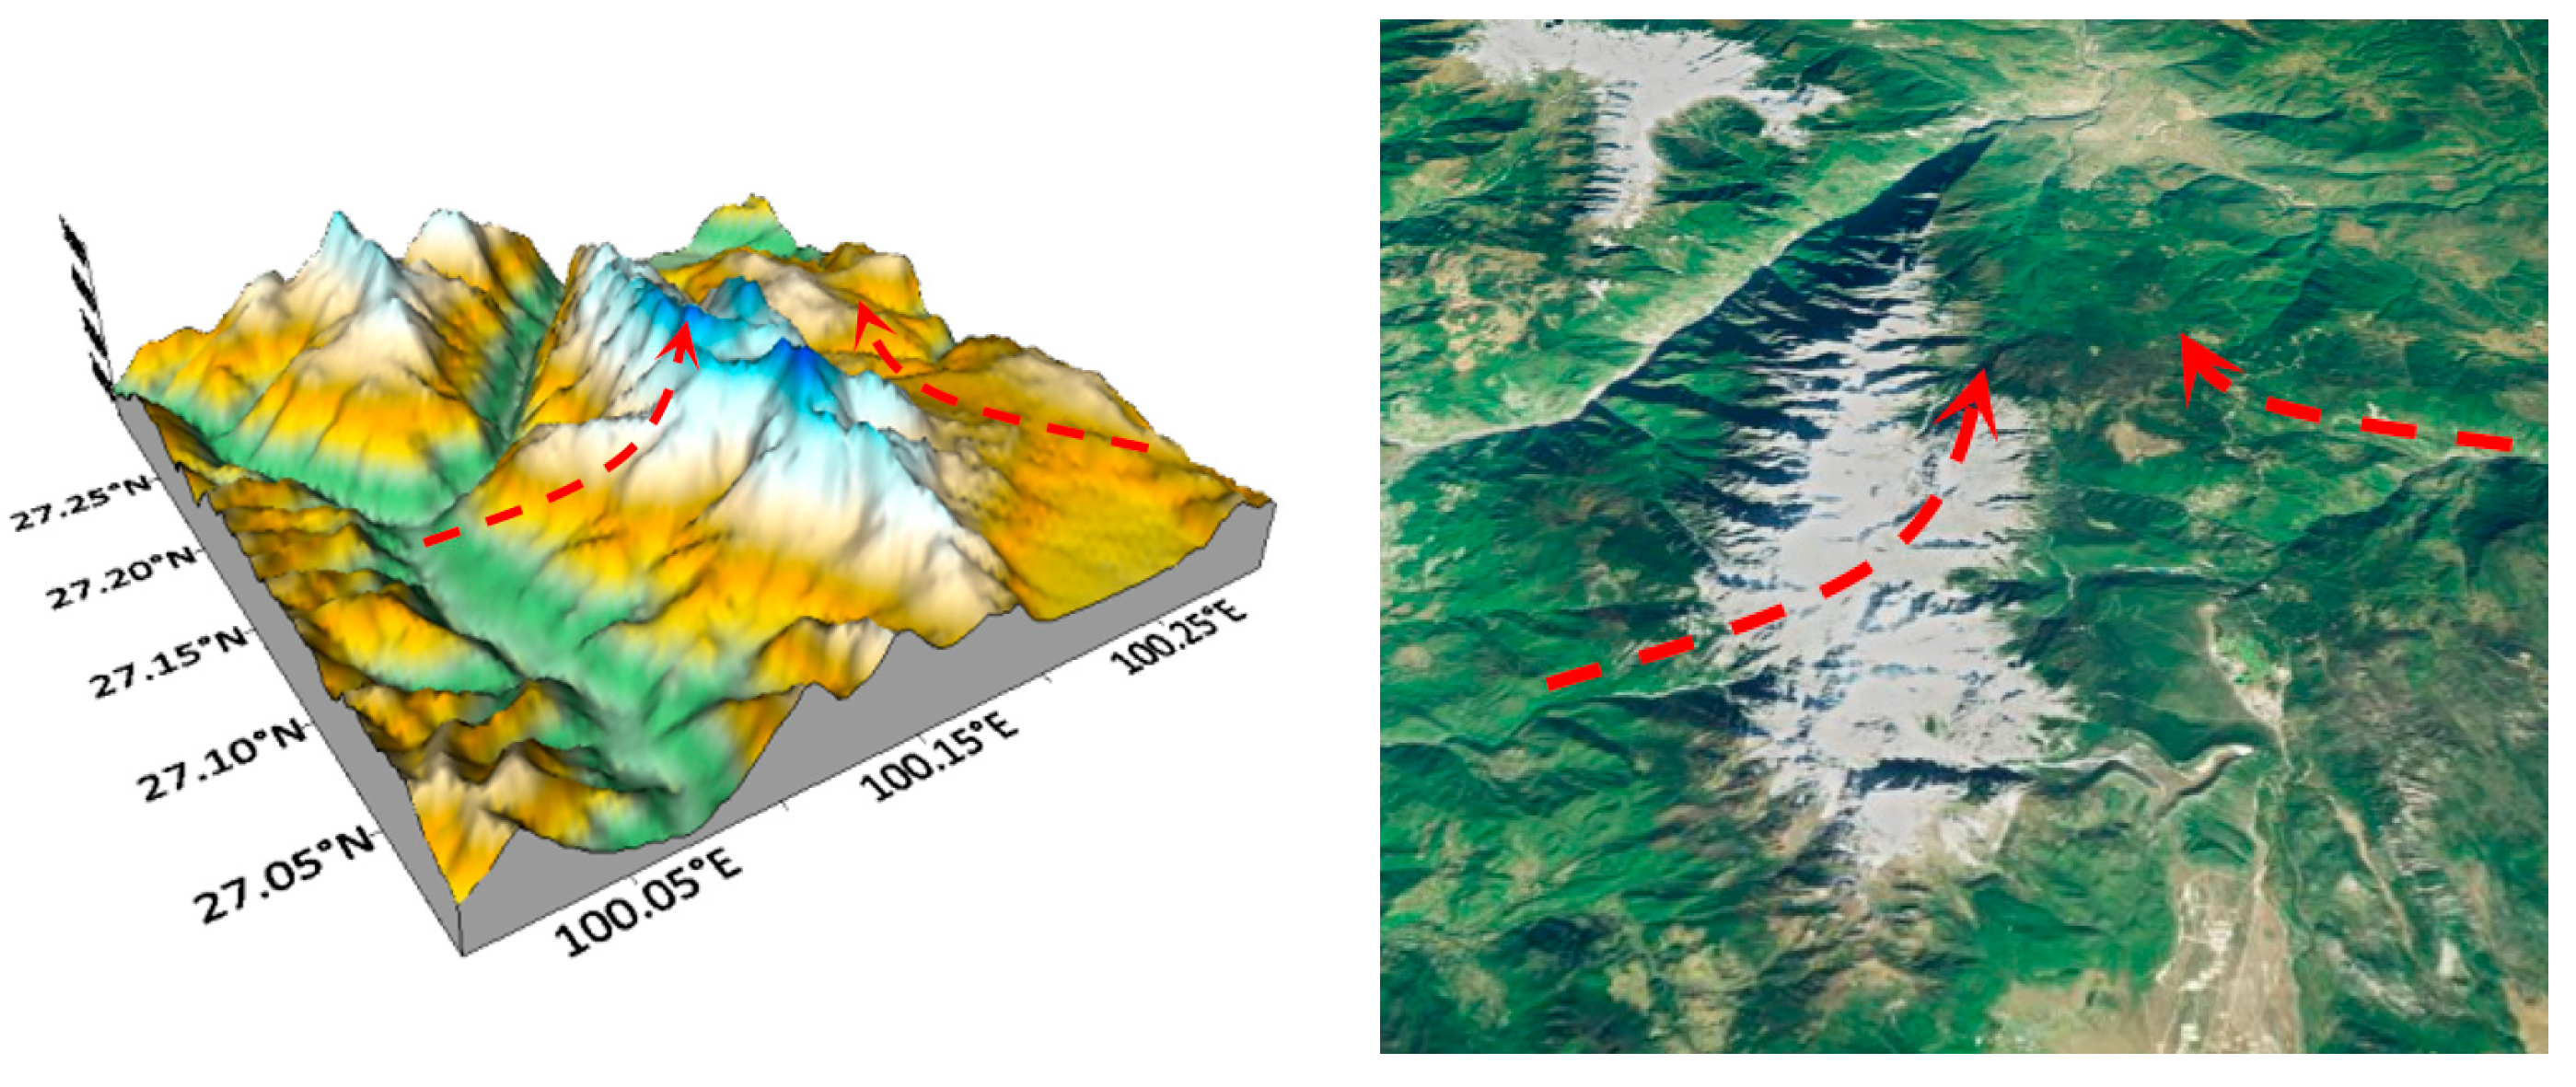
3.2.4. “Mountain Pass” Pattern
3.2.5. “Alpine Divide” Pattern
4. Conclusions and Discussion
Author Contributions
Funding
Institutional Review Board Statement
Informed Consent Statement
Data Availability Statement
Acknowledgments
Conflicts of Interest
References
- Hu, J.; Deng, Y.; Jiang, X.; Zeng, Y. Feature Extraction and Identification Method of Ice-covered Saddle Mircotopography for Transmission Lines. Electric Power. 2022, 8, 55. [Google Scholar]
- Hao, Z.; Wu, J. Exploration of the Law of Areas (Volumes) of Multi-Scale Landforms Based on Wavelet Analysis and Regression Analysis. 2007; 21, 12. [Google Scholar]
- Yang, S.; Hsu, S.; Hsiao, C.; Chang, C.H. Digital elevation models for high-resolution base flood elevation mapping in a densely populated city. Nat. Hazards 2022, 116, 2693–2716. [Google Scholar] [CrossRef]
- Ishalina, O.; Bliakharskii, D.; Florinsky, I. Recognition of crevasses with high-resolution digital elevation models: Application of geomorphometric modeling and texture analysis. Trans. GIS 2021, 25, 2529–2552. [Google Scholar] [CrossRef]
- Janowski, L.; Tylmann, K.; Trzcinska, K.; Rudowski, S.; Tegowski, J. Exploration of Glacial Landforms by Object-Based Image Analysis and Spectral Parameters of Digital Elevation Model. IEEE Trans. Geosci. Remote Sens. 2021, 60, 1–17. [Google Scholar] [CrossRef]
- Chen, F.; Li, J. Quantifying drought and water scarcity: A case study in the Luanhe river basin. Nat. Hazards 2016, 81, 12–27. [Google Scholar] [CrossRef]
- Demoulin, A.; Bovy, B.; Rixhon, B.; Cornet, Y. An automated method to extract fluvial terraces from digital elevation models: The Vesdre valley, a case study in eastern Belgium. Geomorphology 2007, 91, 51–64. [Google Scholar] [CrossRef]
- Girel, J.; Garguet-Duport, B.; Pautou, G. Landscape Structure and Historical Processes Along Diked European Valleys: A Case Study of the Arc/Isère Confluence (Savoie, France). Environ. Manag. 1997, 21, 891–907. [Google Scholar] [CrossRef] [PubMed]
- Vikas, C.; Kushwaha, R.; Ahmad, W.; Prasannakumar, V.; Reghunath, R. Genesis and geochemistry of high fluoride bearing groundwater from a semi-arid terrain of NW India. Environ. Earth Sci. 2013, 68, 289–305. [Google Scholar] [CrossRef]
- Makra, L.; Puskás, J.; Matyasovszky, I.; Csépe, Z.; Lelovics, E.; Bálint, B.; Tusnády, G. Weather Elements, Chemical Air Pollutants and Airborne Pollen Influencing Asthma Emergency Room Visits in Szeged, Hungary: Performance of Two Objective Weather Classifications. Int. J. Biometeorol. 2015, 59, 1269–1289. [Google Scholar] [CrossRef] [PubMed]
- Yovan, A.; Vinay, G.S.S.; Akhik, G. K-means Cluster Using Rainfall and Storm Prediction in Machine Learning Technique. J. Comput. Theor. Nanosci. 2019, 16, 3265–3269. [Google Scholar] [CrossRef]
- Kim, H.; Yu, Y.; Yang, Y.; Park, M.H. Portable Environmental Microfluidic Chips with Colorimetric Sensors: Image Recognition and Visualization. Toxicol. Environ. Health Sci. 2019, 11, 320–326. [Google Scholar] [CrossRef]
- Salehnia, N.; Salehnia, N.; Ansari, H.; Kolsoumi, S.; Bannayan, M. Climate Data Clustering Effects on Arid and Semi-arid Rainfed Wheat Yield: A Comparison of Artificial Intelligence and K-Means Approaches. Int. J. Biometeorol. 2019, 63, 861–872. [Google Scholar] [CrossRef] [PubMed]
- Kuo, R.; Ho, L.; Hu, C. Integration of self-organizing feature map and K-means algorithm for market segmentation. Comput. Oper. Res. 2002, 29, 1475–1493. [Google Scholar] [CrossRef]
- Qing, H.; Jian, Z.; Mengyan, D.; Dongmei, D.; Makkonen, L.; Tiihonen, M. Rime icing on bundled conductors. Cold Reg. Sci. Technol. 2019, 158, 230–236. [Google Scholar] [CrossRef]
- Wang, T.; Niu, S.; Lv, J.; Zhou, Y.; Wang, Y. Observation and Simulation Studies of Three Types of Wire Icing. Atmosphere 2019, 10, 234. [Google Scholar] [CrossRef]
- Liu, C.; Liu, J. Ice Accretion Cause and Mechanism of Glaze on Wires of Power Transmission Lines. Adv. Mater. Res. 2011, 189–193, 3238–3242. [Google Scholar] [CrossRef]
- Wang, Y.; Wang, X.; Jiang, Z.; Zeng, X.; Zhao, T. Assessment and zonation of wire icing disaster risk in China. J. Nat. Disasters 2012, 21, 110–118. [Google Scholar]
- Forgy, E. Cluster Analysis of Multivariate Data: Efficiency versus Interpretability of Classifications. Biometrics 1965, 21, 768–769. [Google Scholar]
- Michael, R. Cluster Analysis for Applications: Probability and Mathematical Statistics; Academic Press: New York, NY, USA, 1973; pp. 347–353. [Google Scholar]
- Wu, G.; Zhang, Y. Automatically Obtaining K Value Based on K-Means Elbow Method. Comput. Eng. Softw. 2019, 40, 167–170. [Google Scholar]
- Yan, P.; Zuo, D.; Yang, P.; Li, S. Typical Modes of the Wind Speed Diurnal Variation in Beijing based on the Clustering Method. Front. Phys. 2021, 9, 675922. [Google Scholar] [CrossRef]


Disclaimer/Publisher’s Note: The statements, opinions and data contained in all publications are solely those of the individual author(s) and contributor(s) and not of MDPI and/or the editor(s). MDPI and/or the editor(s) disclaim responsibility for any injury to people or property resulting from any ideas, methods, instructions or products referred to in the content. |
© 2024 by the authors. Licensee MDPI, Basel, Switzerland. This article is an open access article distributed under the terms and conditions of the Creative Commons Attribution (CC BY) license (https://creativecommons.org/licenses/by/4.0/).
Share and Cite
Zhou, F.; Huai, X.; Yan, P.; Zhao, C.; Jiang, X.; Pan, H.; Ma, Y.; Geng, H. Research on the Identification of Typical Terrain Patterns in Yunnan Province Based on the K-Means Technology. Atmosphere 2024, 15, 244. https://doi.org/10.3390/atmos15030244
Zhou F, Huai X, Yan P, Zhao C, Jiang X, Pan H, Ma Y, Geng H. Research on the Identification of Typical Terrain Patterns in Yunnan Province Based on the K-Means Technology. Atmosphere. 2024; 15(3):244. https://doi.org/10.3390/atmos15030244
Chicago/Turabian StyleZhou, Fangrong, Xiaowei Huai, Pengcheng Yan, Cailing Zhao, Xingliang Jiang, Hao Pan, Yutang Ma, and Hao Geng. 2024. "Research on the Identification of Typical Terrain Patterns in Yunnan Province Based on the K-Means Technology" Atmosphere 15, no. 3: 244. https://doi.org/10.3390/atmos15030244