Article

Comparative Analysis of Different Heavy Rainstorm Periods Lasting for Two Consecutive Days in the Qinba Region under the Influence of the Southwest Vortex

1
Shaanxi Meteorological Observatory, Xi’an 710014, China
2
Heavy Rain and Drought-Flood Disasters in Plateau and Basin Key Laboratory of Sichuan Province, Chengdu 610072, China
3
Xi’an Meteorological Bureau, Xi’an 710016, China
4
Shaanxi Provincial Institute of Meteorological Science, Xi’an 710016, China
5
National Meteorological Center, Beijing 100081, China
6
Xianyang Meteorological Bureau, Xianyang 712000, China
*
Author to whom correspondence should be addressed.
Atmosphere 2024, 15(3), 260; https://doi.org/10.3390/atmos15030260
Submission received: 18 December 2023 / Revised: 29 January 2024 / Accepted: 29 January 2024 / Published: 22 February 2024
(This article belongs to the Section Meteorology)

Abstract

:
In recent years, heavy rainfall events have occurred frequently in the Qinba region. Forecasting and predicting heavy rainfall in the Qinba region is difficult due to the unique underlying terrain and complicated mechanisms involved. One significant weather system that might bring significant rainfall to the region is the southwest vortex (SWV); however, its different positions, intensities, and interaction with other weather systems might result in precipitation with different intensities and distributions. In this study, ERA-5 reanalysis data, FY-4A satellite data, and conventional observation data were used to examine heavy rainstorms that occurred in the Qinba region in the periods of 3–4 September 2021 (referred to as Stage I) and 4–5 September 2021 (referred to as Stage II), while the SWV was in effect. During Stage I, the northwest vortex (NWV) and SWV generated a mesoscale shear line and mesoscale convective complex (MCC) in the Qinba region. This led to a considerable area of heavy rainfall, with a maximum hourly precipitation of 129 mm and heavy precipitation at 15 stations. During Stage II, a mesoscale convective system (MCS) influenced by the SWV was initiated by a low-level jet, resulting in a localized heavy downpour with a maximum hourly precipitation of 72 mm. Significant topography-forced uplift was found in both Stages I and II in the high-altitude Qinba region. Furthermore, the rainfall was stronger during Stage I due to the secondary circulation that developed in the middle and lower levels. These findings will improve our capability to predict rainstorms and prevent disasters in the Qinba region.

1. Introduction

The southwest vortex (SWV) generally appears on the 700–850 hPa isobaric surface, which is a closed low-pressure vortex system with cyclonic circulation formed in southwest China (26°–33° N, 100°–108° E) causing catastrophic weather with a wide range and strong influence [1,2]. As one of the most severe weather systems, a rainstorm triggered by the SWV is a complex and representative example of a typical rainstorm [3,4]. The SWV has played a crucial role in numerous significant precipitation events and floods, ranking as the second most important rainstorm system in China after typhoons [5,6]. Previous studies have found that there are significant differences in the precipitation distribution caused by the different movement paths of the SWV [7,8,9]. The vortex moving northeastward to the Qinba Mountain area can often result in heavy precipitation in northeast Sichuan, south Shaanxi, and north Yubei [10,11,12]. Approximately 25% of the SWV triggers strong convective weather as a result of convective instability, which causes short-term heavy precipitation [13]. Most of the heavy precipitation associated with the SWV is impacted by the plateau vortex [14,15,16,17,18,19], which is a product of the dynamic and thermal interactions of the special terrain of the Qinghai–Tibet Plateau, with a horizontal scale of 400–500 km. The coupling between the plateau vortex and the SWV is favorable for convective instability within the SWV and the development of mesoscale convective systems (MCSs) [20,21,22,23], triggering heavy precipitation. MCSs are organized groupings of thunderstorms that span thousands of square kilometers, always leading to hazardous weather like extreme rainfall and floods [24,25]. Meanwhile, mesoscale convective complexes (MCCs) are an extreme form of MCS [26], with many deep convective systems bearing a large amount of precipitation and high-impact weather. In addition, low-level jets and mesoscale shear lines can enhance precipitation time and efficiency by transporting water vapor and heat, and can strengthen the convergence and lifting of water vapor, thus leading to rainstorms [27,28,29].
The Qinba region is the geographical boundary of northern and southern China, serving as the natural boundary between the northern subtropical humid climate zone and the warm temperate semi-humid monsoon climate zone [30,31]. Previous work on the heavy precipitation in the Qinba region has focused on the role of topography. The mountain has been found to induce vertical secondary circulation [32,33] and significantly increase precipitation intensity [34]. While the majority of studies have analyzed SWV-induced precipitation in the Sichuan Basin [35,36,37,38], the mechanism of heavy precipitation in the Qinba region remains unclear. A continuous heavy precipitation process occurred in the Qinba region from 3 to 5 September 2021. (It is important to note that all of the times in this paper are given in China Standard Time (UTC+8).) This entire precipitation process was accompanied by the generation, evolution, and development of an SWV, leading to severe flash floods and geological disasters, along with small- and medium-sized river floods, causing significant economic losses and casualties [39]. However, the characteristics of precipitation, including its extent, intensity, and duration, significantly varied between the two stages.
Multi-format data and a meteorological analysis method were used to compare and analyze the heavy precipitation on two successive days in this study, which aims to help strengthen the understanding of heavy rainfall caused by the SWV, to further enhance our understanding of the impact of SWV activity on precipitation, and, moreover, to improve the ability to prevent and mitigate disasters in the Qinba region and throughout southwest China.

2. Data and Methods

2.1. Data

The hourly precipitation data used in this study were obtained from automatic and regional weather stations operated by the China Meteorological Administration (CMA) in order to analyze the cumulative precipitation in the study area and the changes in precipitation at the stations. Hourly reanalysis data from ECMWF fifth-generation data (ERA5) were used to analyze the weather circulation and changes in physical elements, including geopotential height, zonal and meridional winds, relative humidity, temperature, vorticity, divergence, and vertical velocity, on 0.25° × 0.25° grids at intervals of 50 hPa from 200 hPa to 1000 hPa pressure levels. Moreover, hourly blackbody radiation-induced temperature (TBB) data were obtained from the FY-4A satellite [40], which is a new generation of geostationary meteorological satellites in China that mainly provides relevant information on clouds and the atmosphere, such as cloud top height, cloud top pressure, and cloud optical thickness. The TBB data are released by the National Satellite Meteorological Center, with a horizontal spatial resolution of 4 km.

2.2. Methods

The TBB data from the FY-4A satellite were used to identify MCCs according to the criteria outlined by Maddox [26]. The first criterion states that a TBB of −32 °C or less needs to cover an area of 100,000 km2 or greater, and a TBB less than or equal to −52 °C should cover an area of at least 50,000 km2. The second criterion is that the length (the shortest length) of the MCC must be at least 70% of the width (the longest length perpendicular to the shorter length). The third criterion is that the life history of the MCC needs to last for at least 6 h. The MCS is defined in a similar manner to the MCC, with the exception that the cloud shield area with TBB ≤ −52 °C must be less than 50,000 km2.
The ERA-5 at 700 hPa is used to identify low-level jets and SWVs. Low-level jets are defined by examining the horizontal wind speed at 700 hPa and the criterion is that the wind speed is ≥ 12 m·s−1. The SWVs are objectively identified according to Li et al. [41] and Liu et al. [2], and there are five criteria. The first criterion is that it shows a significant mesoscale cyclonic circulation at 700 hPa with the center in the area of 26°–33° N, 100°–108° E. The second criterion is that it shows a low-pressure system with at least one closed isohypse on the 700 hPa weather chart with a positive relative vorticity of at least 10 × 10−5·s−1. The third criterion is that the horizontal scale exceeds 200 km when it matures and the life duration must be at least 6 h. The fourth criterion is that the vortex location is identified by the longitude and latitude of its convergence center. The fifth criterion is that its intensity is the pressure value of the low-pressure center, and a lower value represents a higher intensity.
The sounding data were used to generate a T-logP diagram and calculate the environmental factors to analyze the thermal conditions. The time variation of the vertical profiles of the regional average divergence, vorticity, and vertical velocity were calculated to analyze the dynamic conditions. The cross-sections of the wind field, relative humidity, and vertical velocity of the ERA-5 data were calculated to investigate the impact of the topography.

2.3. Study Area

The Qinba region includes the Qinling Mountains, the Daba Mountains, and the Hanshui Valley with a range of 31°–34° N, 105°–111° E. Most areas have an altitude of 1500–2500 m (Figure 1).

3. Results

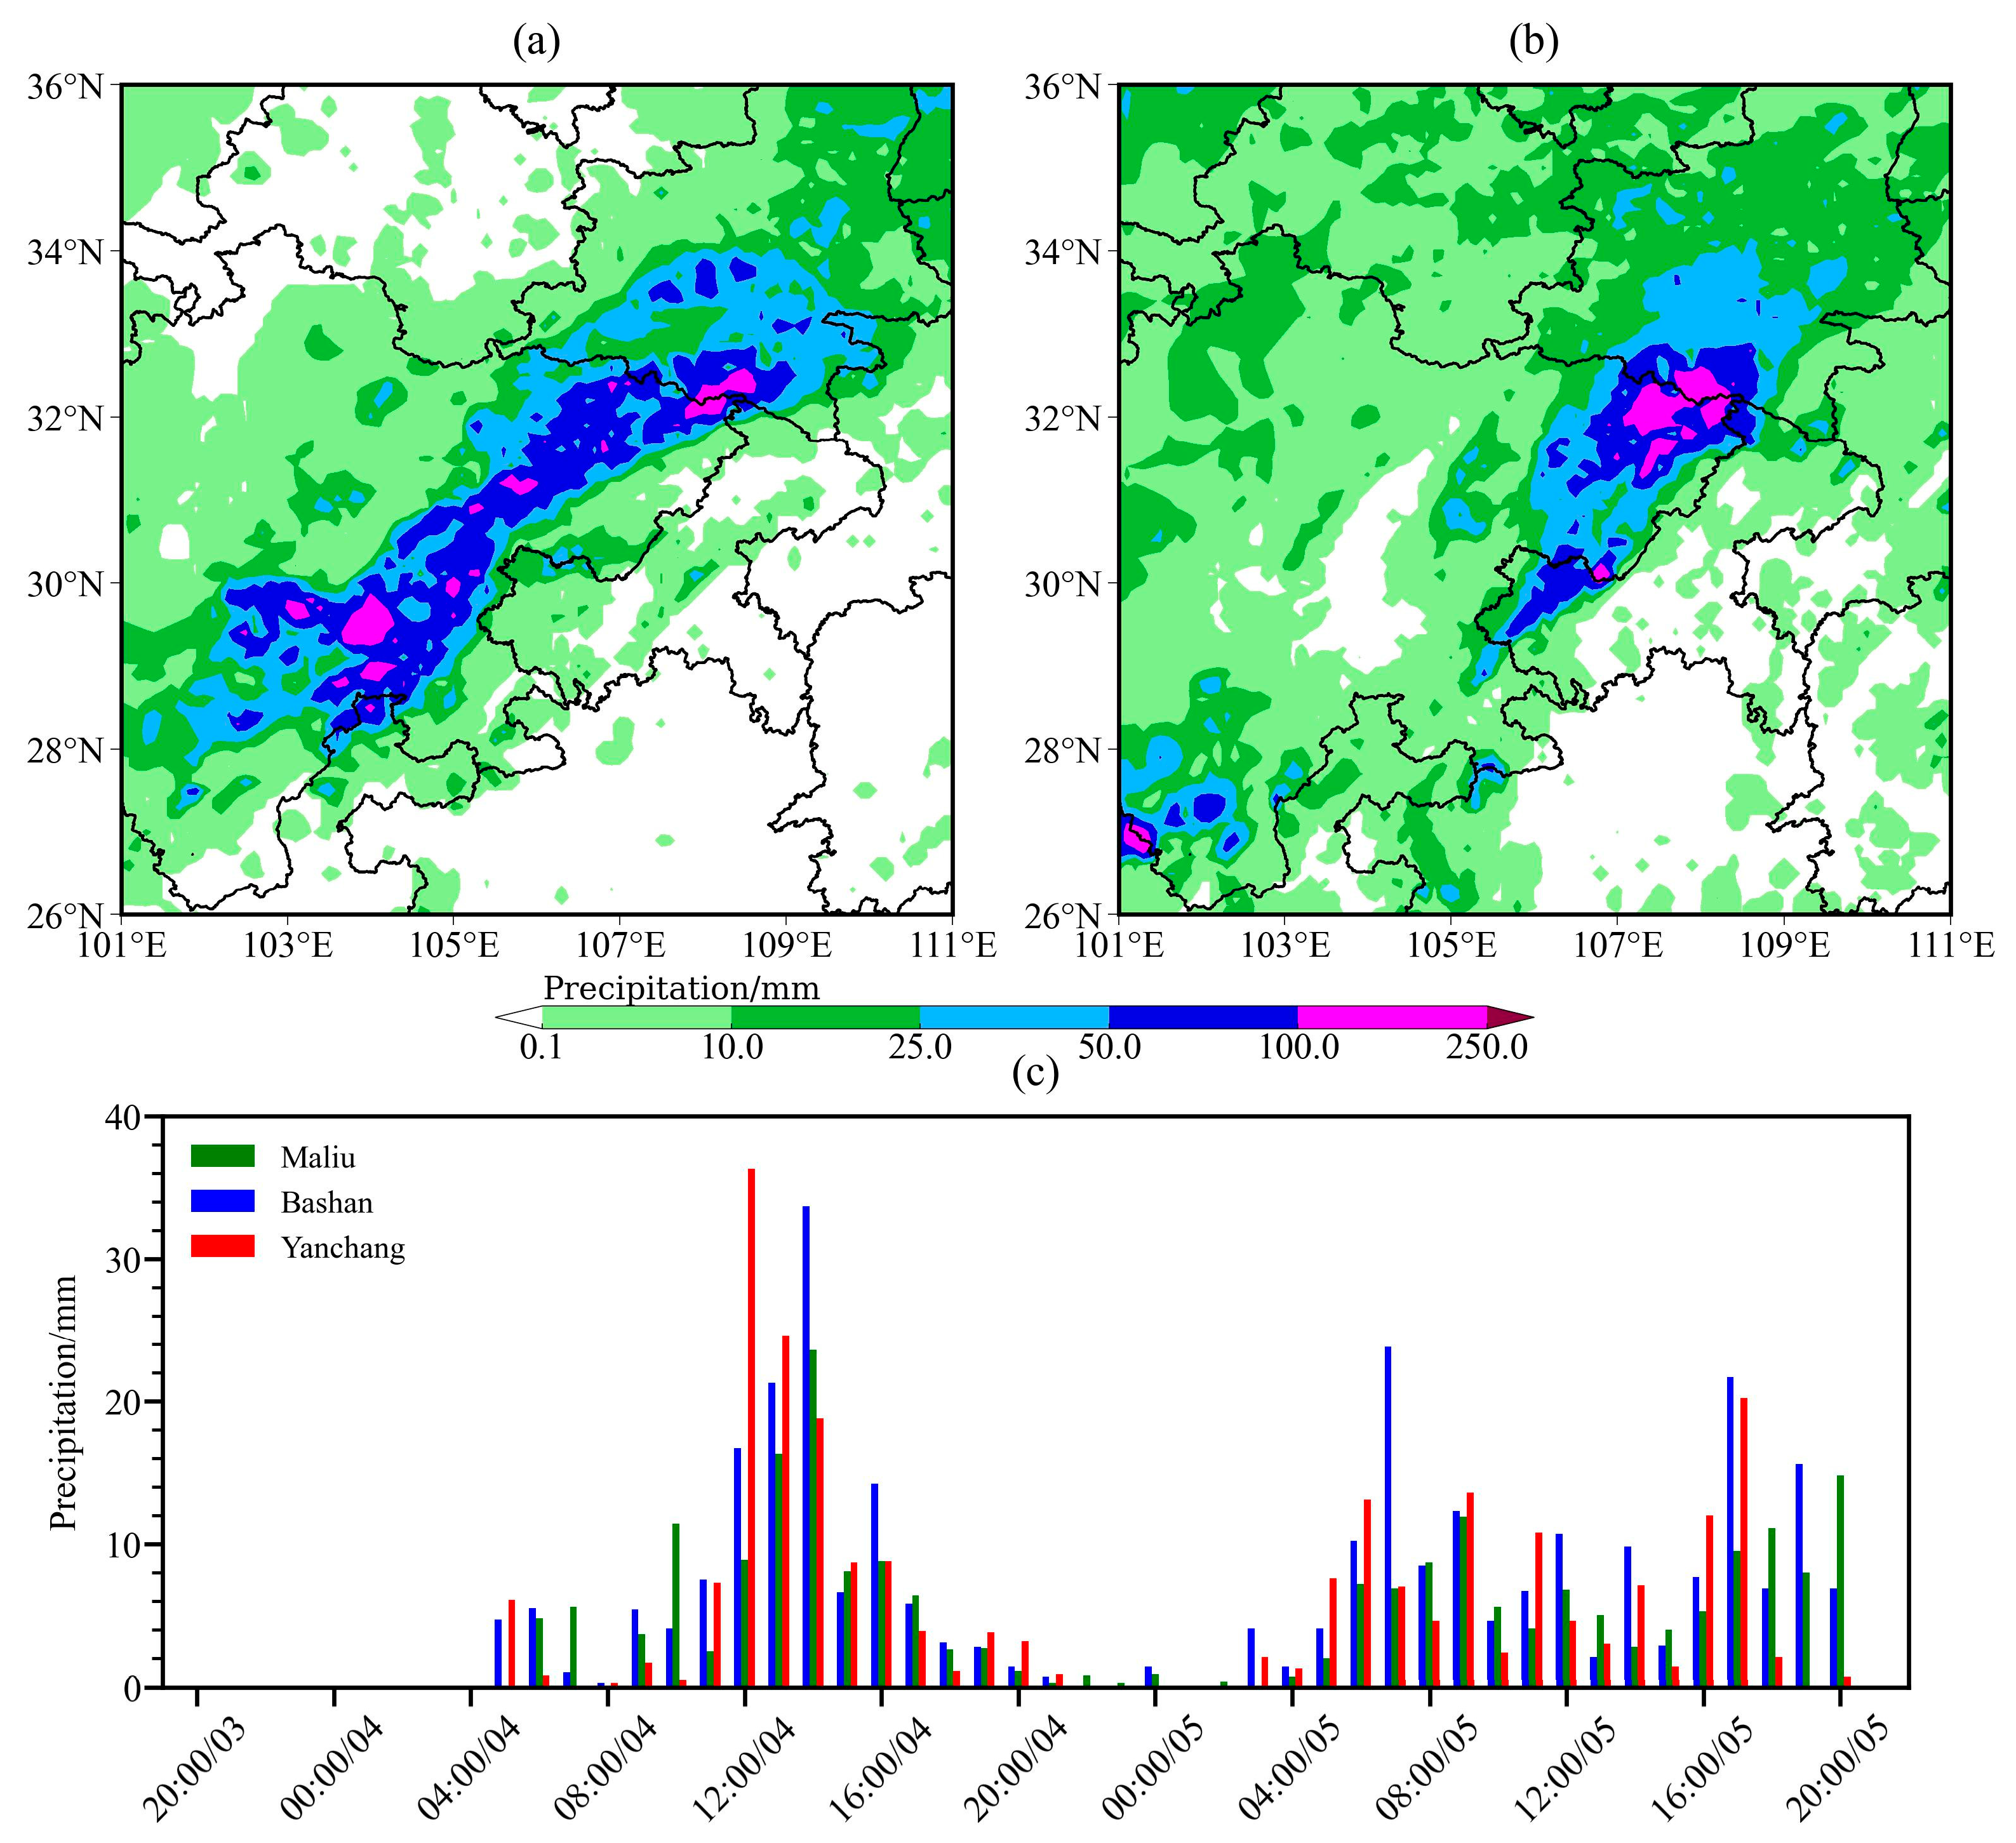
3.1. Precipitation Events and Mesoscale Convective System Characteristics

Figure 2a shows the geographical distribution of the 24 h cumulative rainfall from 20:00 on the 3rd to 20:00 4th (hereafter referred to as Stage I). A northeast–southwest-oriented rainstorm belt is visible, extending from southern Shaanxi to eastern Sichuan. As a result, heavy precipitation was recorded at 15 stations, with a maximum 24 h cumulative precipitation level of 173 mm and a maximum hourly precipitation level of 129 mm·h−1. Figure 2b shows the spatial distribution of the cumulative precipitation for the following 24 h after Stage I (hereafter referred to as Stage II). The rainstorms are visible at the border between southern Shaanxi and Sichuan, with relatively limited coverage (only four stations with heavy precipitation). The maximum 24 h cumulative precipitation reached 172 mm, and the maximum hourly precipitation reached 72 mm·h−1. Figure 2c shows the time series of the hourly precipitation from the stations experiencing heavy rainstorms (i.e., Yanchang Station in Hanzhong, Bashan Station in Ankang, and Maliu Station in Ankang). The precipitation in Stage I started in the early morning of the 4th, and exhibited a substantial increase after 08:00. The peak occurred between 12:00 and 14:00 (the maximum hourly precipitation of 36.3 mm, 33.7 mm, and 23.6 mm at the three stations), and then gradually decreased until the end of Stage I at 20:00. The temporal evolution of the precipitation was found to be unimodal during Stage I. During Stage II, the precipitation began to increase gradually from the early morning of the 5th. The peak intensity was recorded between 06:00–10:00 and 18:00–20:00 (with the maximum hourly precipitation being 20.2 mm, 23.8 mm, and 14.8 mm at the three stations), which resulted in a longer duration of precipitation. The precipitation intensity was found to be bimodal during Stage II.
From the above, it can be seen that the two stages were consecutive, and the regions of heavy rainfall were in close proximity to each other. In order to study the differences in two stages, the characteristics of the mesoscale convective systems were first analyzed. At the onset of Stage I, as observed through the TBB of the FY-4A satellite (Figure 3a), two meso-α-scale convective systems emerged in the Qinba region at 20:00 on the 3rd. The systems were situated in central Sichuan and on the border of southern Shaanxi and Sichuan, aligned in the northeast–southwest and east–west, respectively. Cold clouds with a TBB below −32 °C, embedding several cold centers with a TBB below −72 °C, produced significant precipitation. As a result, short-term heavy precipitation of over 20 mm·h−1 was recorded at a number of stations, with a maximum of 51 mm·h−1. The most intense precipitation was located in the area with the largest TBB gradient in the east–west-oriented meso-α-scale convective system. At 02:00 on the 4th (Figure 3b), an increase in the area of the cold center with a TBB below −72 °C was observed due to the development and eastward migration of meso-α-scale convective systems. Figure 3b shows a significant increase in the number of stations with hourly precipitation exceeding 20 mm. In the cold cloud area (TBB < −80 °C) located in southern Sichuan, several stations recorded heavy precipitation exceeding 50 mm·h−1, with the highest precipitation intensity being 96 mm·h−1. Convective systems continued to develop and the cold cloud area (TBB < −52 °C) reached over 9 × 10⁴ km2. The two meso-α-scale convective systems merged and intensified into a mature mesoscale convective complex (MCC), which had an elliptical shape with a distinct vortex structure (Figure 3c). The number of stations with hourly precipitation greater than 20 mm increased significantly, with a concentrated spatial distribution in the area with the large TBB gradient on the cooler side of the air towards the center and rear of the MCC. Meanwhile, some meso-β-scale and meso-γ-scale convective clouds occurred in the northern part of the MCC, bringing precipitation of over 20 mm·h−1 to stations on the southern border of Shaanxi. At 14:00, the MCC became less organized, lost its elliptical shape, and decayed into a meso-α-scale vortex cloud system. The cold cloud (TBB < −52 °C) decreased in size quickly, as shown in Figure 3d. The precipitation intensity also reduced, with the maximum hourly precipitation being only 28 mm. The meso-γ-scale convective clouds on the border of southern Shaanxi and Sichuan evolved into a meso-β-scale convective system, resulting in slightly enhanced precipitation with a maximum precipitation of 35 mm·h−1. At 20:00, the meso-α-scale vortex cloud system weakened into a meso-β-scale convective system, which significantly reduced the precipitation extent and intensity (Figure 3e), with a maximum hourly rainfall intensity of only 10 mm·h−1. The precipitation process of Stage I tended to end.
At the beginning of Stage II, which coincides with the dissipation of the meso-β-scale convective system in Stage I (Figure 3e), new meso-γ-scale convective clouds continued to form in the central Sichuan area. At 02:00 on the 5th, several meso-γ-scale convective clouds on the border of northern Sichuan and Chongqing developed into a northeast–southwest-oriented mesoscale convective system (MCS) (Figure 3f). The cold cloud (TBB < −52 °C) coverage area was less than 2 × 10⁴ km2, significantly smaller than that in Stage I. However, the precipitation intensity was higher in the center of the cold clouds. Five stations had a maximum hourly precipitation greater than 50 mm·h−1, with a maximum hourly precipitation of 69 mm. The MCS moved northeastwards and evolved into a meso-β-scale MCS, began to weaken rapidly, and eventually became an isolated meso-β-scale convective cloud by 08:00 on the southern edge of Shaanxi. Precipitation primarily occurred in the area with the large TBB gradient on the cooler side of the air towards the center and rear of the cold cloud, with three stations experiencing short-term heavy precipitation of over 40 mm·h−1 (Figure 3g). At this time, several new convective clouds were triggered at the rear of the cold cloud, resulting in short-term heavy precipitation of 20 mm·h−1 at a number of stations. The isolated meso-β-scale convective cloud dissipated gradually in southeastern Shaanxi as it moved northeastward. Meanwhile, the newly generated convection at its rear moved to the border between southern Shaanxi and Sichuan at 14:00, becoming an isolated meso-γ-scale convective cloud. Intense short-term precipitation over 20 mm·h−1 occurred in the region of a significant TBB gradient and the rear of the convective cloud (Figure 3h), which subsequently decreased in intensity while moving northeastward. The cloud departed the Qinba region at 20:00 (Figure 3i) with a precipitation intensity of less than 20 mm·h−1, marking the end of Stage II.
To summarize, a meso-α-scale MCC in the Qinba region during Stage I caused short-term intense precipitation exceeding 50 mm·h−1 under the center of the cold cloud (TBB < −72 °C) and on the cooler side of the large TBB gradient region. The MCC moved slowly and maintained its intensity for more than 10 h, accompanied by the development of several meso-β-scale and meso-γ-scale convective clouds. These are responsible for the heavy precipitation that occurred in the region. During Stage II, several meso-β-scale and meso-γ-scale MCSs occurred in the Qinba region. The area covered by cold clouds (TBB < −32 °C) was smaller than that of Stage I. The MCS kept generating new convective clouds as it moved eastwards, so the mesoscale convective clouds were maintained for a longer period. In the center and rear of the convective clouds, the maximum hourly precipitation exceeded 20 mm·h−1 at a number of stations, and these clouds continued to move across the southern Shaanxi–Sichuan border, forming the so-called “train effect” and cumulatively leading to locally heavy precipitation.

3.2. Synoptic Weather Conditions and Physical Conditions

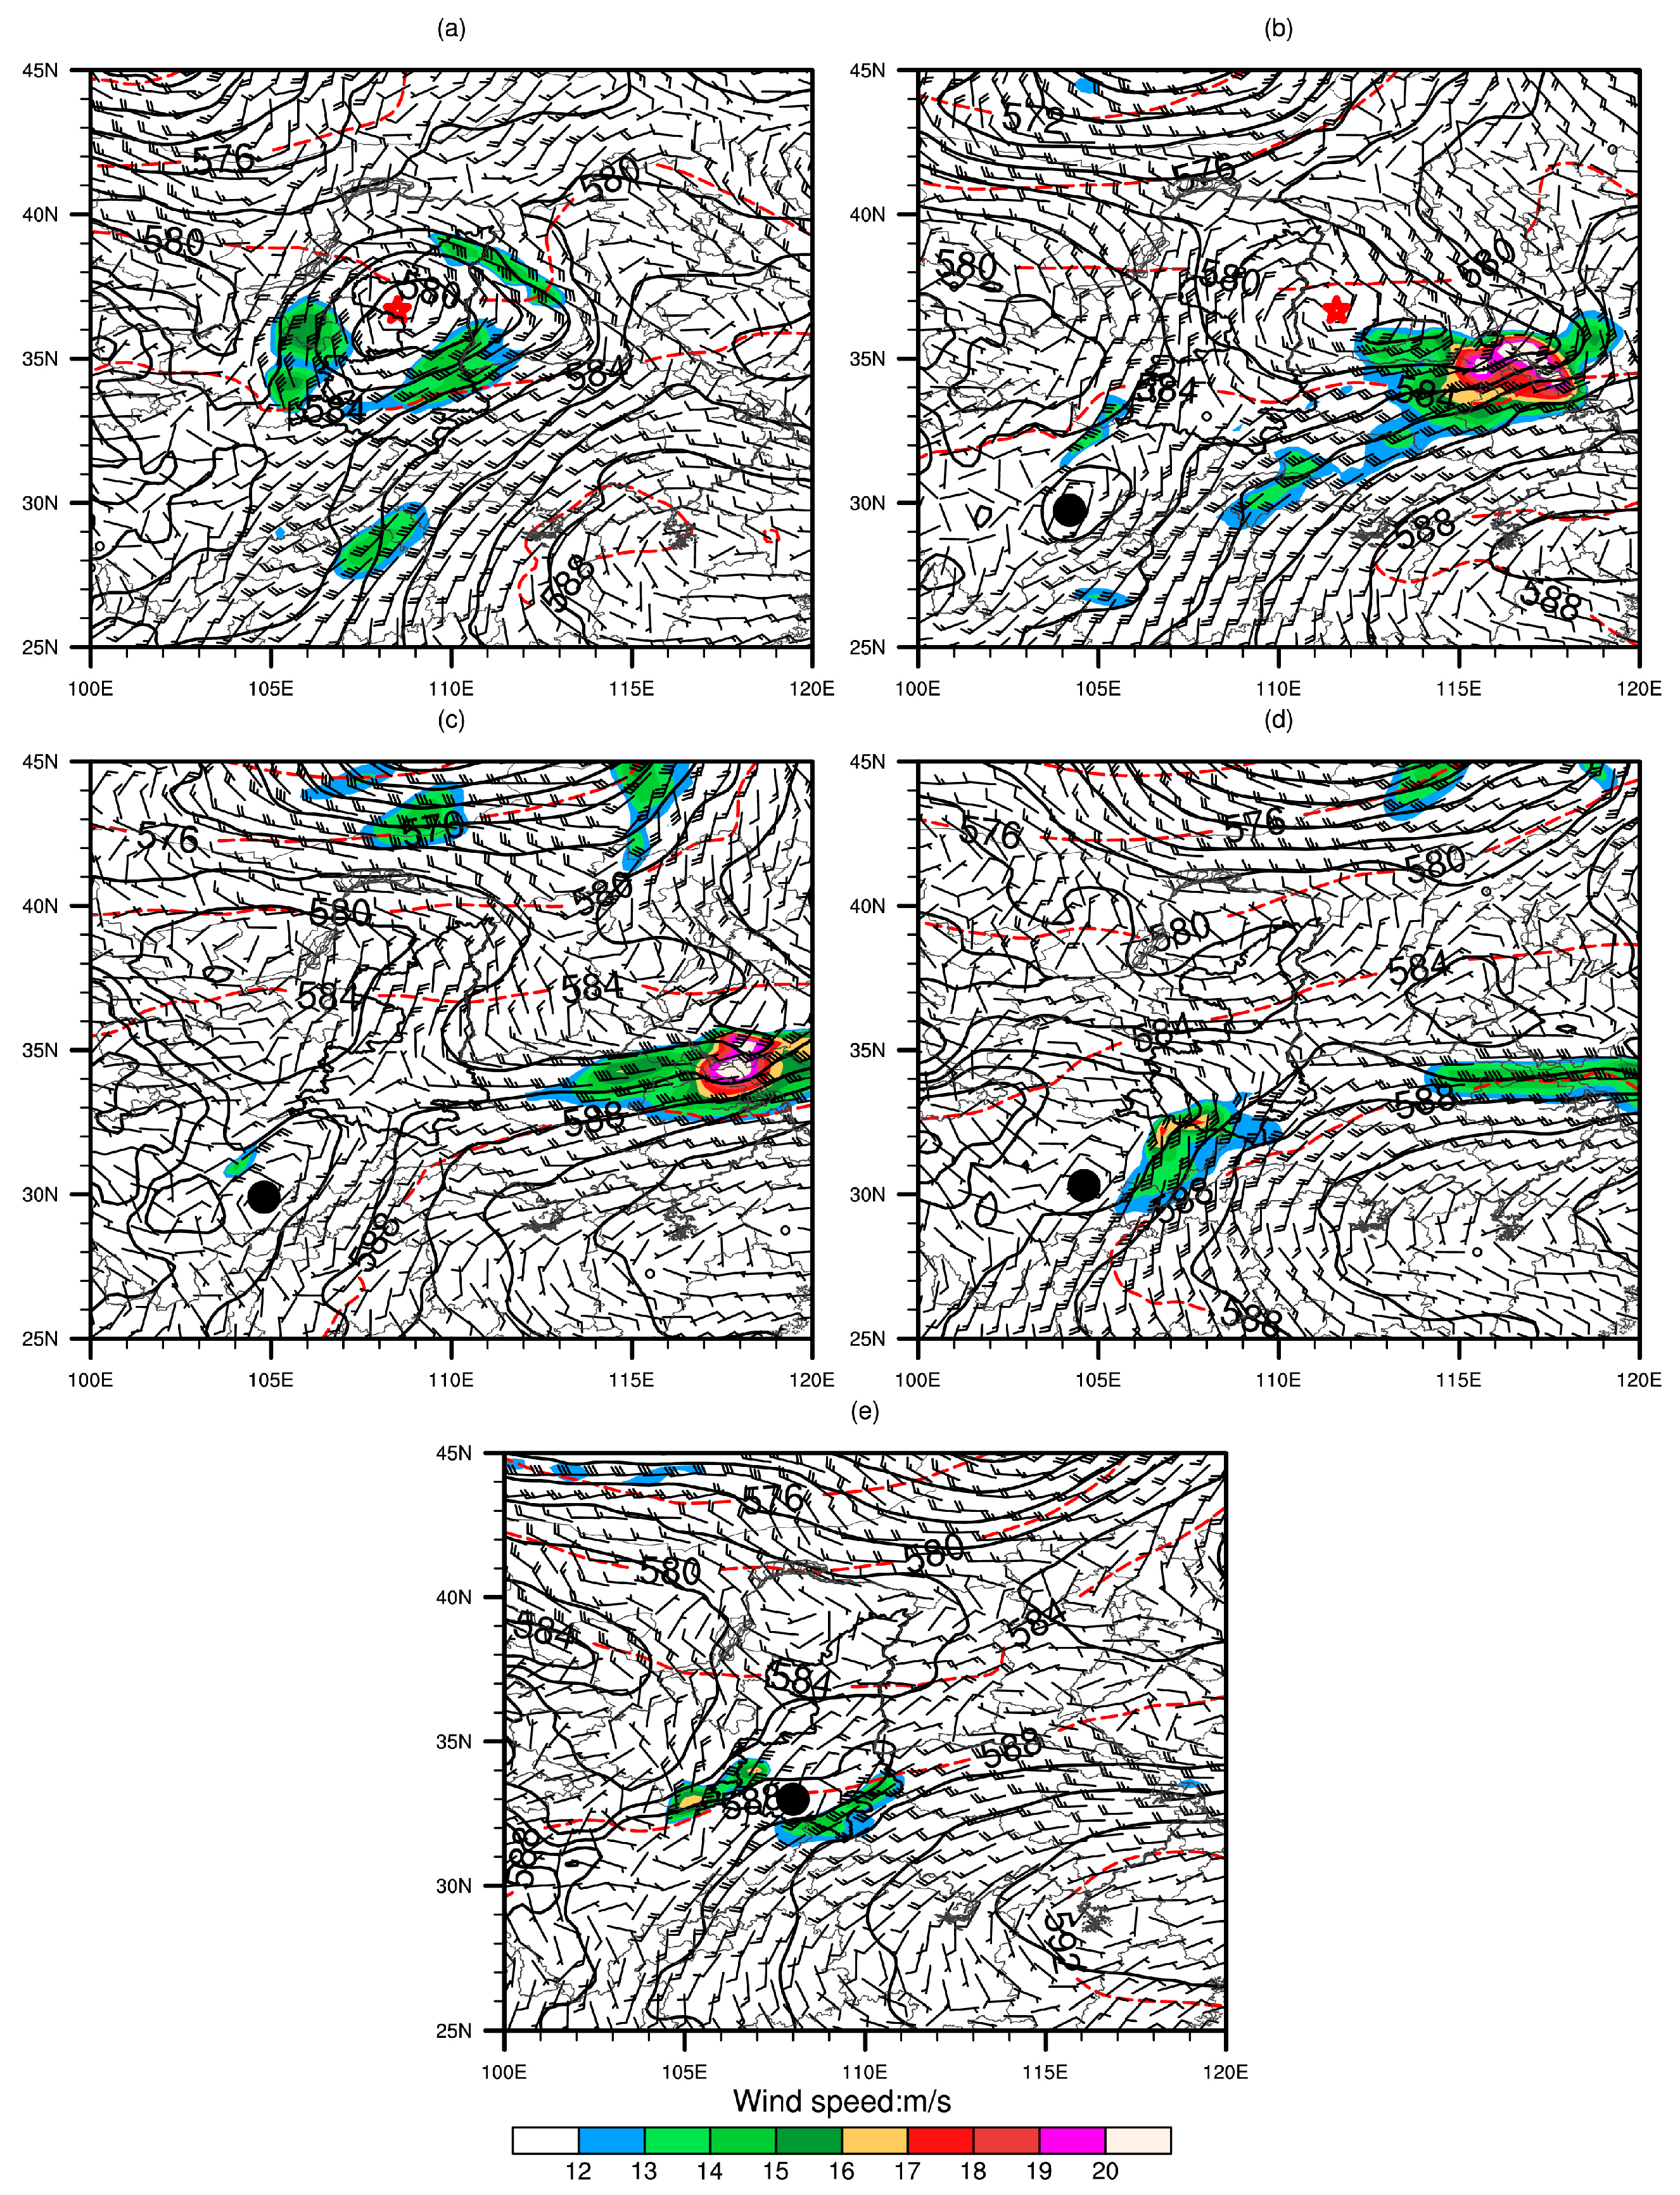
3.2.1. Synoptic Weather and Circulation Conditions

The 500 hPa synoptic weather map at the start of Stage I (20:00 on the 3rd) is shown in Figure 4a. A cold trough extended from northern Xinjiang to northern Inner Mongolia. Cold air behind the trough continuously intruded southwards into the southern Hetao region, triggering a 700 hPa northwest China vortex in central Gansu and pushing it towards northern Shaanxi. The western Pacific subtropical high-pressure system (WPSH) weakened. To the west of the WPSH, a broad southwesterly flow at 700 hPa transported warm and moist air into the Qinba region and mixed with cold air at the rear of the northwest China vortex. This led to the formation of a widespread mesoscale shear line in the Qinba region, which triggered the mesoscale convective clouds that were conducive to the intensification of precipitation. Meanwhile, a northerly low-level jet at the rear of the northwest vortex with a maximum wind speed of 18 m·s−1, along with a southwesterly low-level jet with a maximum wind speed reaching 16 m·s−1, provided favorable conditions for the development of convective activity. As the 500 hPa cold trough deepened and moved eastwards, the 700 hPa northwest vortex moved eastwards at 08:00 on the 4th (Figure 4b), leaving behind a strong northerly wind. The northwest vortex interacted with the southwesterly flow west of the WPSH and converged into an SWV in southwestern China, leading to a stronger upward motion. This contributed to the maturation of the MCC and heavy precipitation. As the 500 hPa WPSH expanded westwards and northwards, the strength of the 700 hPa southwesterly flow substantially decreased at 20:00 on the 4th (Figure 4c), causing the flow encircling the SWV to weaken. Moreover, the northwest vortex decayed as it moved eastwards. The convergent upward motion in the Qinba region became less strong. The expansion of WPSH impeded the transportation of moisture. The sounding at the nearby weather station exhibited a low instability energy. As a result, neither the moisture nor energy was sufficient for the maintenance or development of the MCC. Consequently, the MCC gradually decayed, and the precipitation ceased at this stage.
As the WPSH retreated eastwards and the southerly flow increased from the night of the 4th to the early morning of the 5th, the SWV regained its strength (not shown) and triggered an MCS in its outer southerly low-level jet in Stage II, as shown in Figure 4c. By 08:00 on the 5th, the WPSH had moved northwards and returned to its position at 20:00 on the 4th (Figure 4d). The southwesterly low-level jet intensified at the edge of the 700 hPa SWV, reaching a maximum wind speed of 18 m·s−1. Meso-γ-scale and meso-β-scale convective clouds were continuously generated by the low-level jet and crossed the southern border of Shaanxi, bringing intense precipitation. At 20:00 on the 5th, the 500 hPa WPSH expanded westwards and northwards, reaching southern Shaanxi (Figure 4e). The 700 hPa SWV weakened and moved northeastwards, with a weak cyclonic circulation in the center. At the northern edge of the SWV, the easterly wind became a northeasterly wind, generating a mesoscale shear line in southern Shaanxi with the southwesterly flow. As the wind speed of the shear line was less strong, the intense precipitation was concentrated in the positive vorticity region to the left front of the low-level jet.

3.2.2. Thermal Convective Conditions

Convective clouds in the two stages were generated from central Sichuan and then moved to the northeast. Therefore, the sounding data from Dachuan station in Sichuan were chosen for the following analysis in this section. At 20:00 on the 3rd, the wet layer (a layer with relative humidity greater than 80%) at Dachuan station was found to be shallow and was located between 700 and 850 hPa (Figure 5a left). Meanwhile, the middle and upper layers were affected by northerly airflow, causing temperature dew point differences greater than 5 °C, which was conducive to the formation of unstable stratification. The convective available potential energy (CAPE) was recorded as 3100.1 J·kg−1, while the K index and the SI index were 36.4 °C and 0.9 °C, respectively. In the near-surface (below the 850 hPa level), the wind direction rotated counterclockwise as the height increased, which implied a weak transport of cold air, leading to a convective inhibition (CIN) of 71.2 J·kg−1. Below 500 hPa, the pseudo-equivalent potential temperatures decreased with increasing altitude (Figure 5a, right). The temperature difference between the upper and lower layers reached −27.9 K, which indicates a strong convective instability. A widespread northerly flow meeting a southwesterly flow at 700 hPa created a mesoscale shear line, which led to significant and persistent convective activity. As a result, the conditions were favorable for heavy rainstorms.
At 08:00 on the 5th (Figure 5b left), the wet layer at Dachuan station deepened, with the air being saturated below the 300 hPa level. This indicates favorable water vapor conditions for precipitation. The heavy precipitation released a considerable amount of CAPE in Stage I, which led to a significant reduction in the CAPE value to 67.4 J·kg−1. It is worth noting that the SI index decreased to −2.29 °C and the K index increased to 41 °C, so the atmosphere remained thermally unstable. The smaller CIN above the 500 hPa level suggests that the middle and upper troposphere was comparatively stable and hindered the development of convective clouds. As a result, the TBB values are shown to be higher in Stage II. Moreover, the pseudo-equivalent potential temperature below the 500 hPa level was complex (Figure 5b right) and decreased with altitude between 850 and 600 hPa, meaning convective instability in these layers. However, the maximum temperature difference reached about 8 K, which resulted in a smaller lapse rate of the pseudo-equivalent potential temperature than that of Stage I, so the intensity of convective instability was also relatively small. At this time, a southerly low-level jet formed on the outer edge of the 700 hPa SWV and lasted for an extended period. The perturbations in the wind convergence continuously triggered small-scale convective clouds in the Qinba region, accompanied by an ample supply of moisture, leading to heavy precipitation.
From the variability in the environmental parameters at Dachuan station, as listed in Table 1, it is evident that the CAPE values during Stage I were notably greater than those during Stage II. The CAPE experienced a decline followed by an increase. This can be primarily attributed to the warm and humid air being transported into the Qinba region via the southwesterly low-level jet during the early part of Stage I. The unstable stratification was then established that held a substantial amount of unstable energy. The encounter of the northerly wind at the rear of the northwest vortex with the cold air triggered convective instability, which induced strong convection and precipitation exceeding 50 mm·h−1 at a number of stations. An extensive amount of CAPE was released during the precipitation. The formation of the SWV at 08:00 on the 4th facilitated the replenishment and strengthening of the water vapor and energy through convergence. Consequently, the CAPE value slowly declined from 924.5 J·kg−1 to 9.6 J·kg−1 by 20:00. At 08:00 on the 5th, a low-level jet transferred moisture and energy to the Qinba region, resulting in the reconstruction of an unstable stratification. As a result of the jet maintenance and cold air intrusion, the values of the CAPE increased from 67.4 J·kg−1 to 611.6 J·kg−1, thus providing energy for new convective activities. The CIN value reached 107.1 J·kg−1 in Stage I due to the intrusion of cold air into the lower layer, which favored the energy storage in the lower atmosphere and the development of convection after triggering. The values of the CIN were almost equal to 0 during Stage II, which indicated a higher susceptibility to triggering convective activity. Due to the moisture transport by the low-level jet, the specific humidity at 850 and 700 hPa was 1–2 g·kg−1 higher in Stage II than in Stage I, and the warm cloud depth (WCD) exceeded that in Stage I by 300 m. Consequently, the precipitation was more efficient. Although the energy level in Stage II was lower than that in Stage I, the short-term heavy precipitation of 50 mm·h−1 was still recorded by one station. Moreover, the higher K-index and lower SI index in Stage II indicated considerable atmospheric instability, which increased the susceptibility to triggering convective weather.
In addition, the environmental parameters derived from radiosonde at Ankang station in the southern Shaanxi Province are listed in Table 2. Compared to the Dachuan station in Sichuan, the Ankang station exhibits a significant difference in terms of CAPE, which is relatively low at both stages with a maximum of 83.7 J·kg−1 at the start of the SWV generation. Similarly, the thermodynamic instability parameters (K and SI indices) are relatively small. There is no significant decrease in the pseudo-equivalent potential temperature with height, indicating a stable atmospheric stratification. Despite the high specific humidity and thick warm clouds in the lower and middle layers, the atmospheric conditions do not support intense convective weather, especially short-duration heavy precipitation. Consequently, the mesoscale convective clouds induced by the front of the MCC during Stage I migrated into Ankang and gradually dissipated in the stable atmospheric environment. The MCS originating in northern Sichuan during Stage II did not develop further upon entering Ankang, resulting in only minor precipitation in the area. The primary region of intense precipitation remained located within the high potential energy zone between the northern boundary of Sichuan and the southern boundary of Ankang.

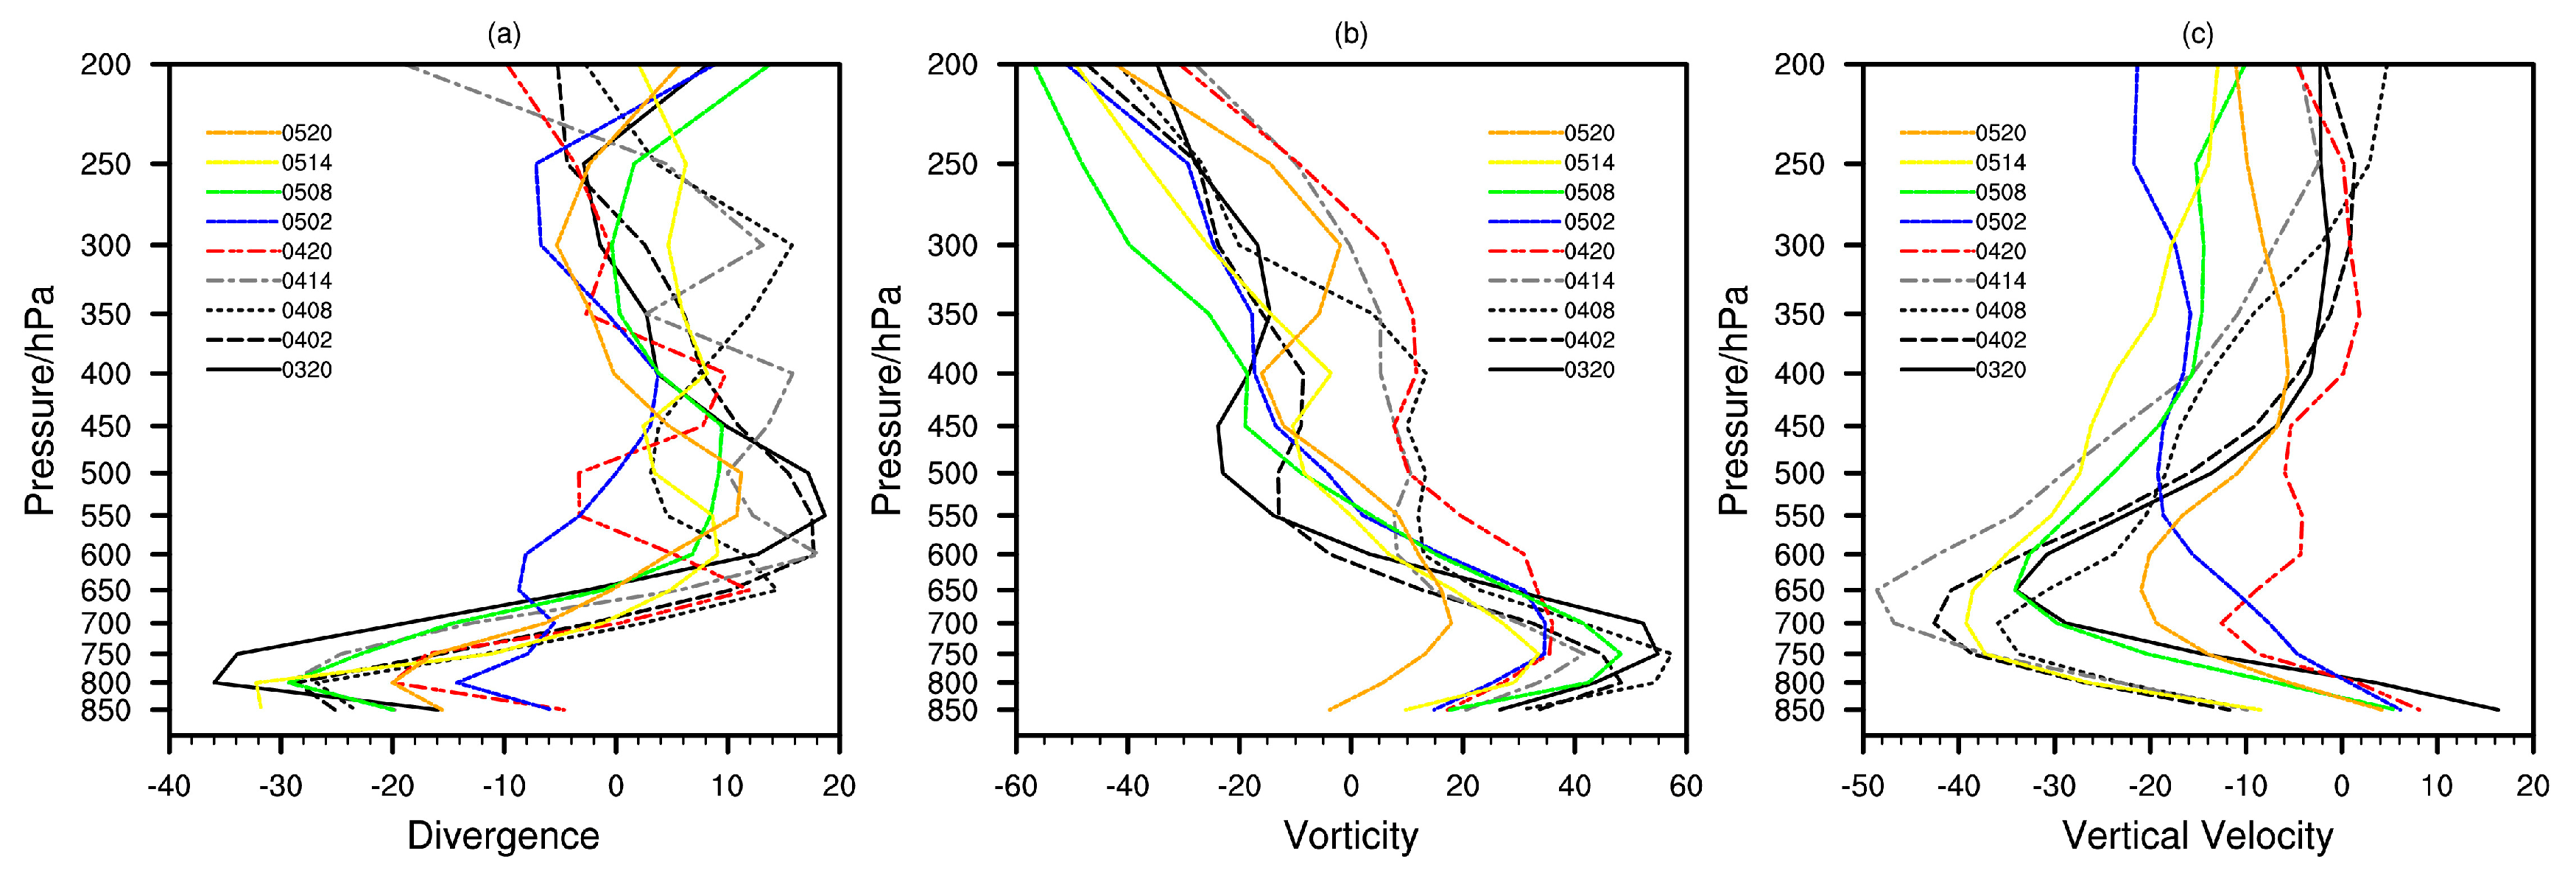
3.2.3. Dynamic Conditions

The divergence profiles taken every 6 h over the region of heavy precipitation (30°–33° N, 105°–109° E) can be utilized for a comparison of the dynamical conditions between the two stages. In both stages (Figure 6a), convergence is visible in the lower layer, with the most significant at 800 hPa, and divergence in the upper layer above 600 hPa. The lower-layer convergence reached −38 × 10−5 s−1 at 20:00 on the 3rd due to the encounter between northerly wind at the rear of the northwest vortex and southwesterly wind. The convergence gradually reduced to −28 × 10−5 s−1 as the northwesterly wind weakened and the SWV was generated. At the beginning of Stage II at 20:00 on the 4th, the low-level convergence weakened to below −20 × 10−5 s−1 as the SWV weakened. The convergence gradually increased again due to the strengthening southerly low-level jet, reaching a value of over −30 × 10−5 s−1 at 14:00 on the 5th. The overall intensity of convergence was lower in Stage II than in Stage I. Thus, the collaboration between the high- and low-level dynamics during Stage I produced a pumping effect that maintained the MCC for a longer period, resulting in significant intense precipitation.
The vorticity profiles (Figure 6b) illustrate that substantial positive vorticity is visible below the 600 hPa level in both stages, with the maximum vorticity located between 700 and 800 hPa. In Stage I, the values of vorticity exceeded 40 × 10−5 s−1, reaching 56 × 10−5 s−1 after the SWV formed at 08:00 on the 4th. The strong positive vorticity enhanced the cyclonic circulation, leading to the development of the mesoscale convective system and thereby intensifying precipitation. During Stage II, the values of vorticity decreased to below 35 × 10−5 s−1 as the SWV moved eastwards and weakened. By 20:00 on the 5th, the cyclonic circulation of the SWV was even weaker, exhibiting a vorticity value less than 20 × 10−5 s−1. The decrease in positive vorticity hindered the maintenance of mesoscale convective systems in an organized manner, thereby leading to strong precipitation scattered over the region.
The profiles of vertical motion (Figure 6c) demonstrate that the strongest upward motion was visible between 650 and 750 hPa in both stages. The encounter between the northerly wind at the rear of the northwest vortex and the southwesterly wind out of the WPSH produced a strong upward motion in the lower and middle atmosphere from 20:00 on the 3rd. This motion intensified, reaching its peak at −58 × 10−2 Pa·s−1 at 14:00 on the 4th, when the SWV formed. Subsequently, it promptly weakened as the vortex dissipated. In the beginning of Stage II at 20:00 on the 4th, the upward motion only reached −12 × 10−2 Pa·s−1, forced solely by the wind shear associated with the SWV. The increase in upward motion, which correlated with the formation of a southwesterly low-level jet and the enhancement of the northerly wind, reached maximum value of −38 × 10−2 Pa·s−1 at 20:00 on the 5th. In general, the upward motion was weaker in Stage II than in Stage I.

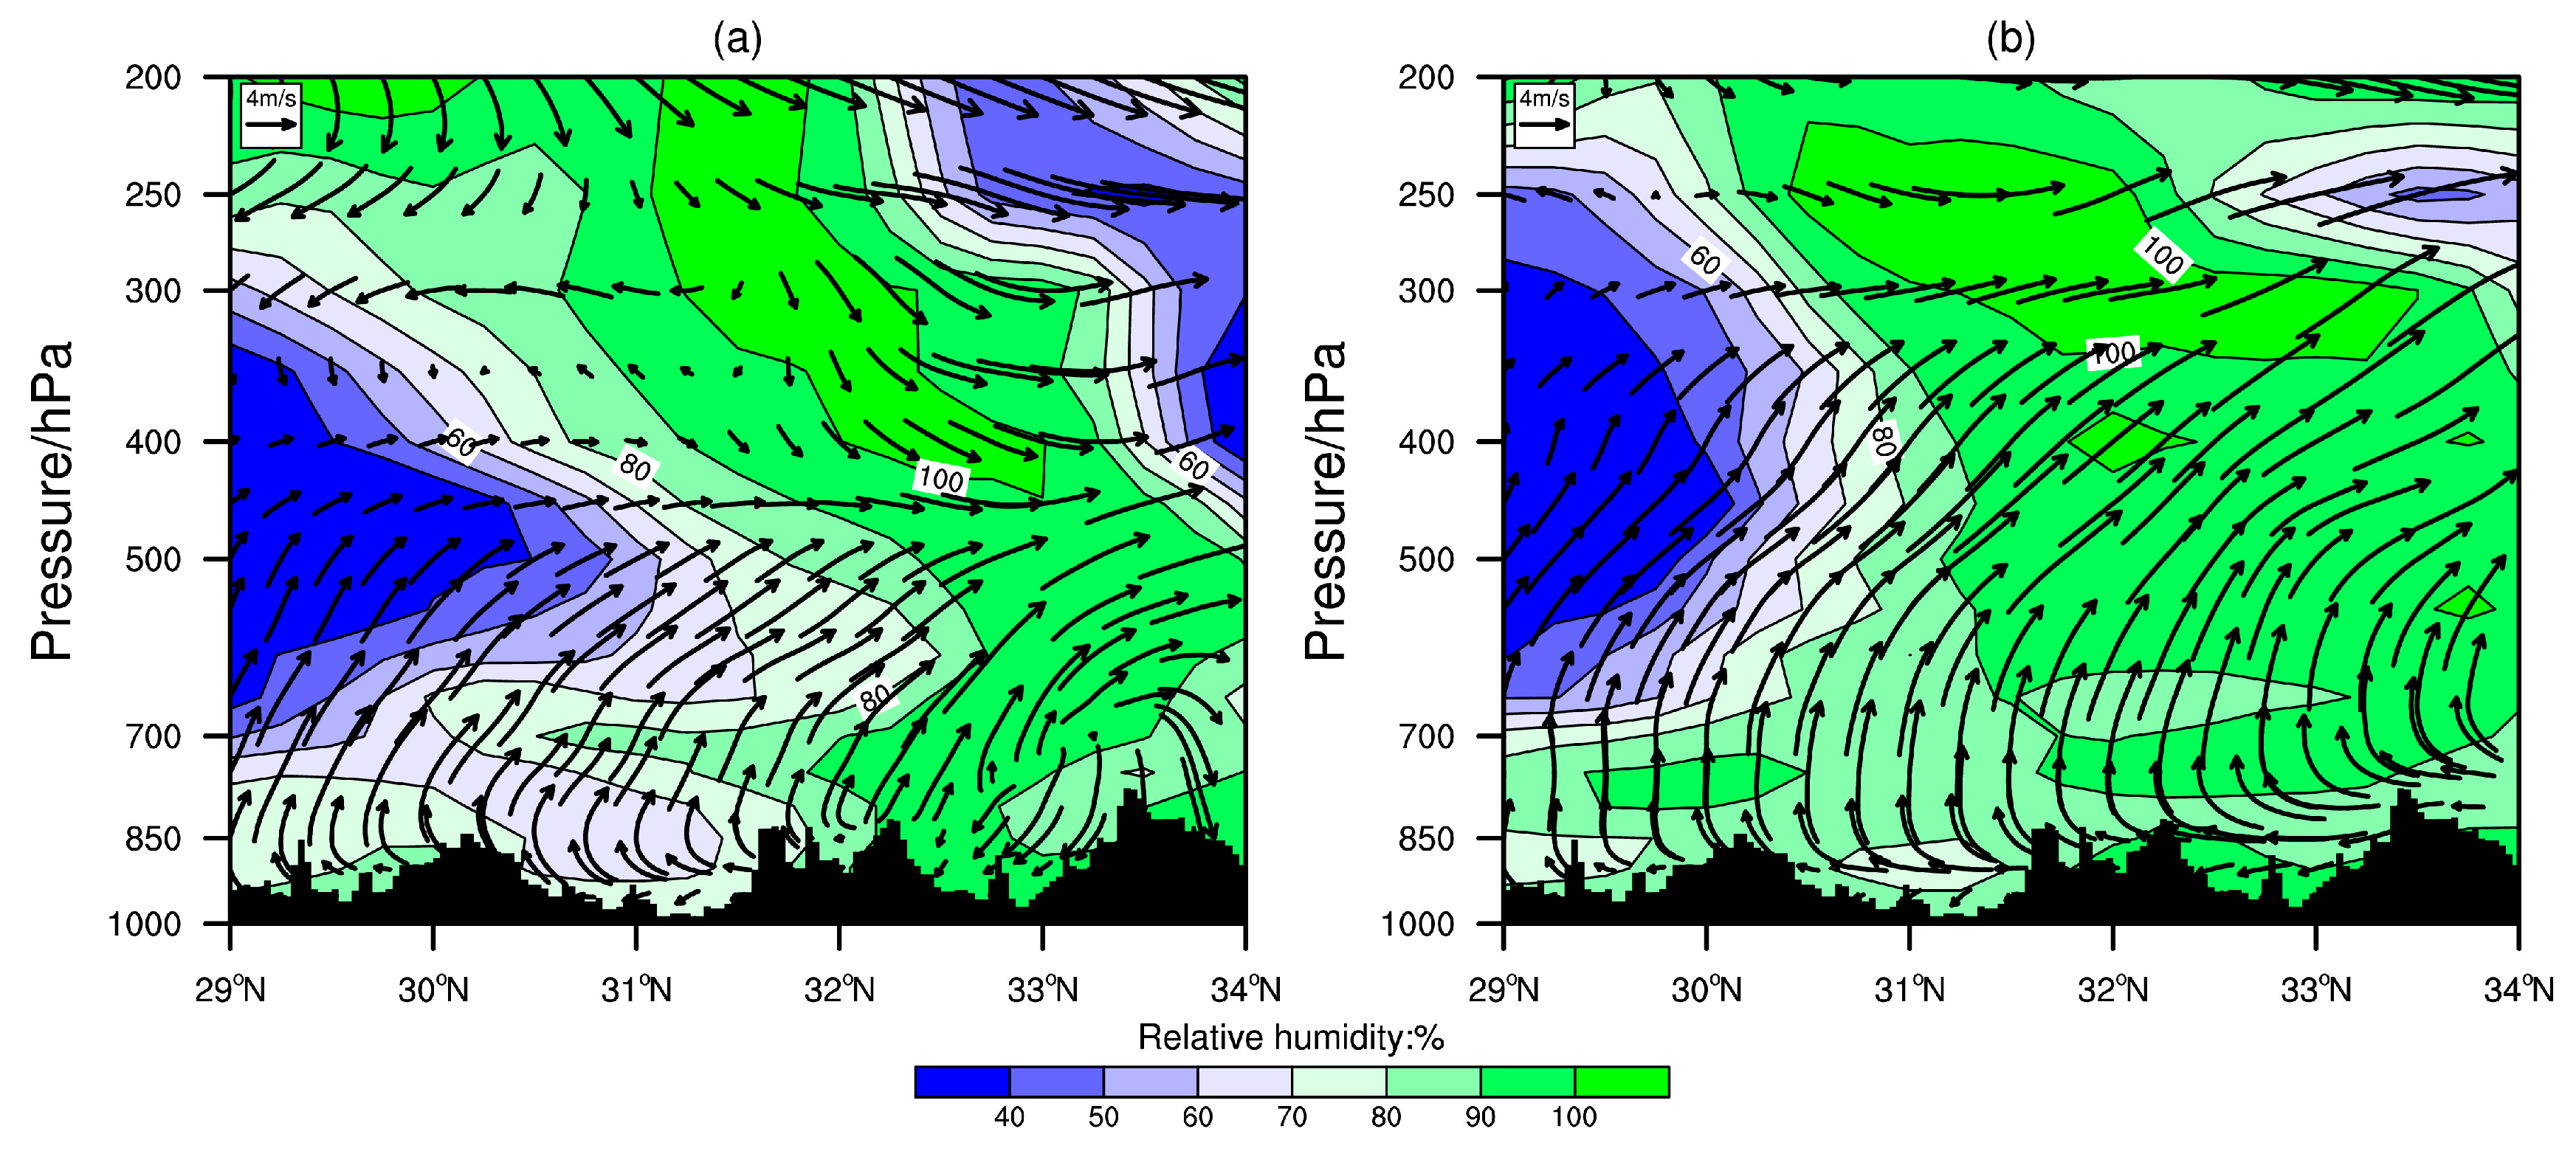
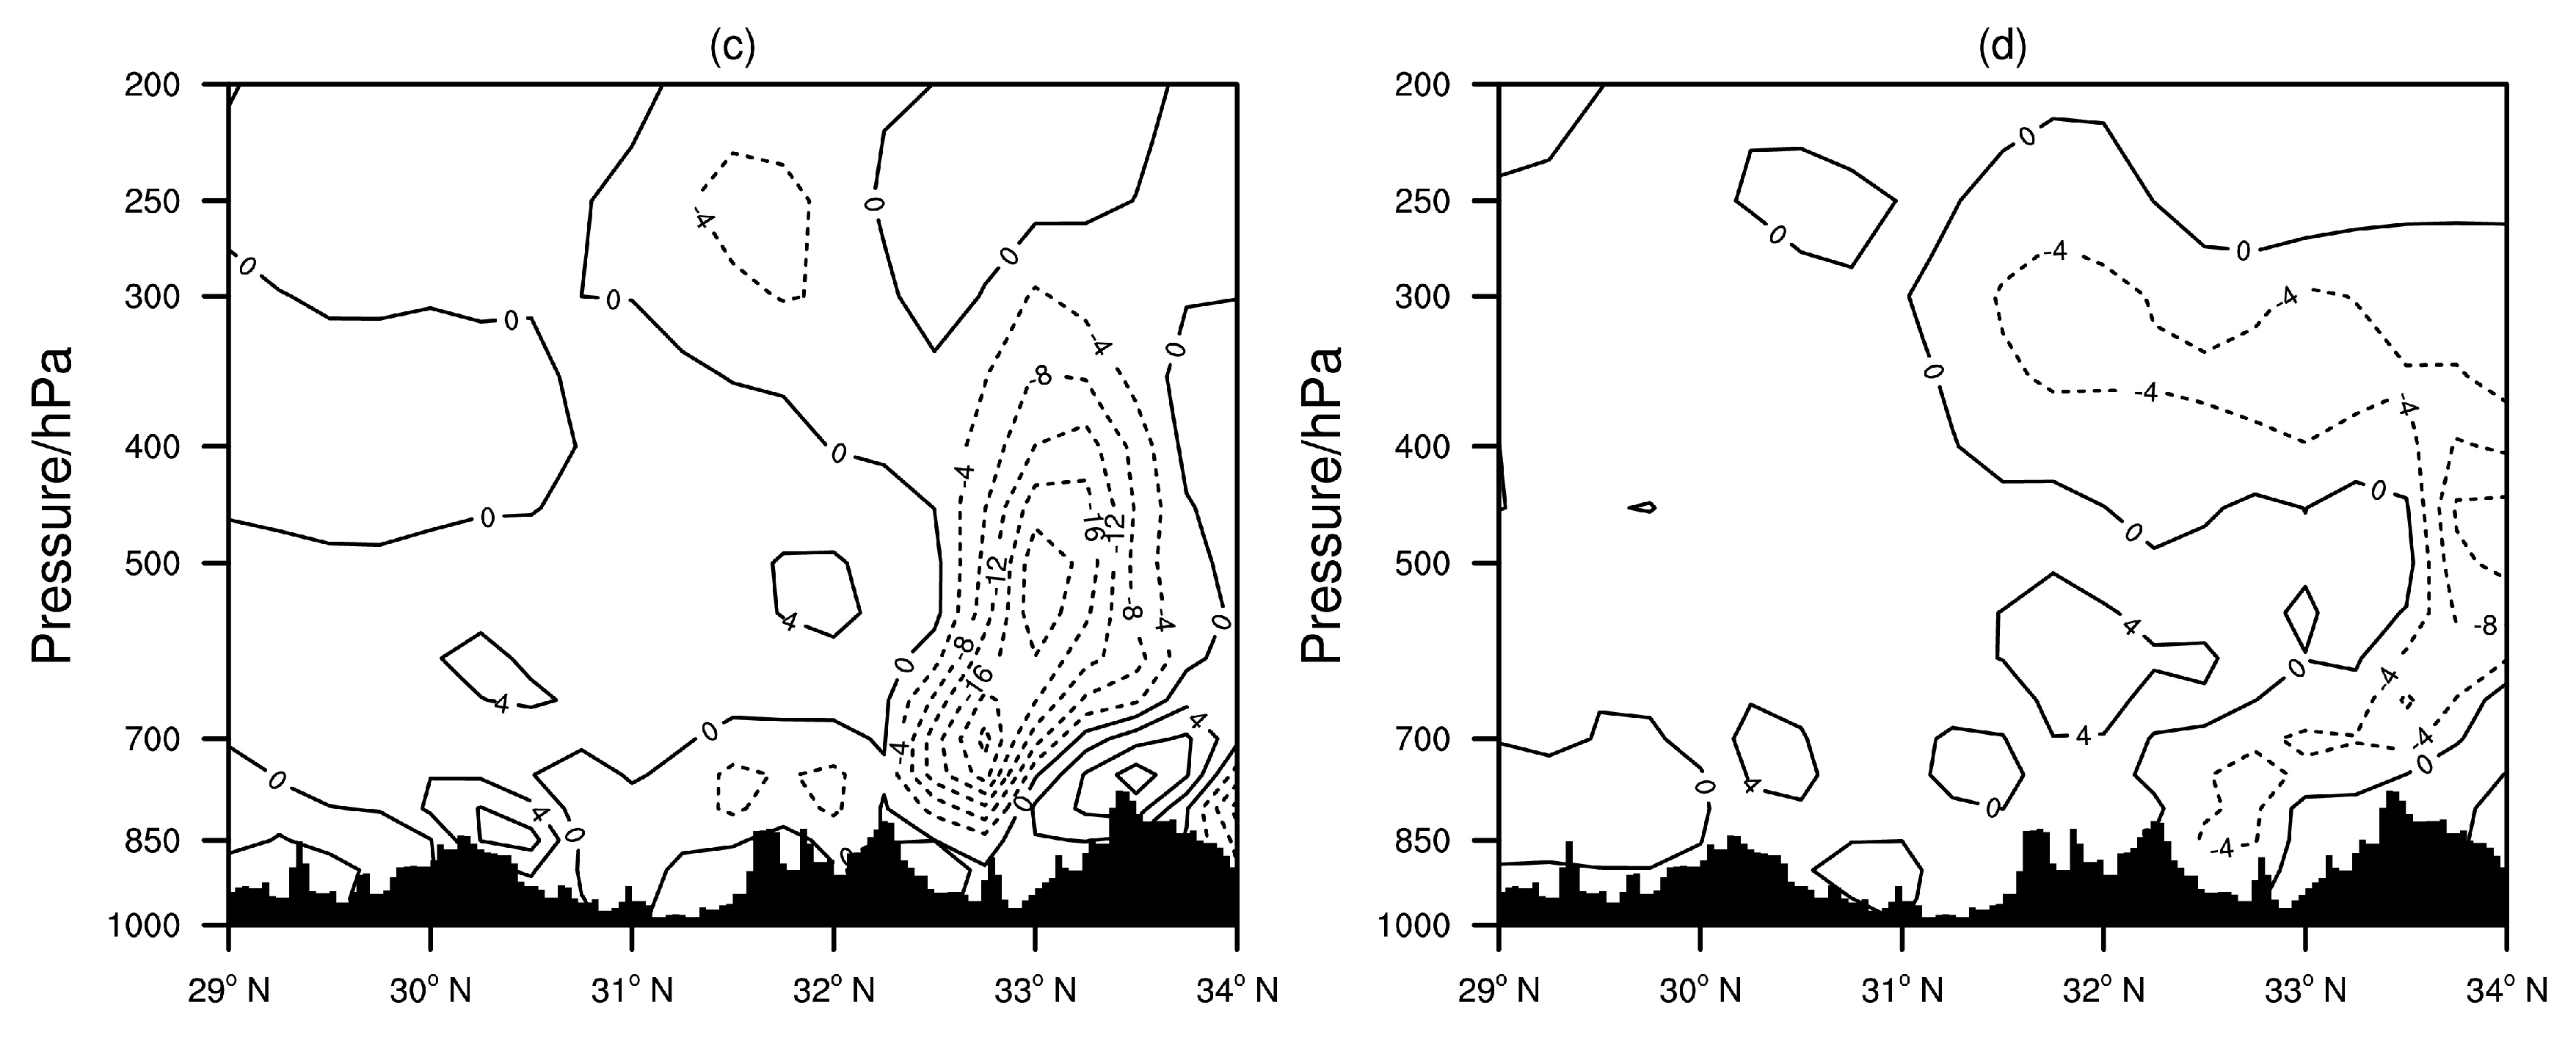
3.2.4. Vertical Structure

To investigate the impact of the topography on the vertical motion, cross-sections of the wind field, relative humidity, and vertical velocity were examined across the center of the heavy precipitation region (along the 108.5° E longitude) at 08:00 on the 4th and 5th September, respectively (Figure 7). A downdraft flow in the northerly wind was visible in the middle and upper layer under the force of the northwest vortex in Stage I (Figure 7a), which met the southerly wind in the lower and middle layer at 400 hPa over the heavy precipitation region (31°–33° N). Meanwhile, in the lower layer, dry air was continuously transported to the warm and humid flow in this region, which enhanced the convective instability. Because of the Qinling Mountains lying between 33° N and 34° N, the southwesterly flow was unable to cross the high elevation, and instead descended at 700 hPa. Part of the downdraft with a northeasterly component descended on the southern side of the Qinling and then rose due to the topographic blockage of the Bashan mountains, which induced a secondary circulation in the lower and middle layers in the heavy precipitation region. The secondary circulation triggered extensive strong upward motions that covered the high-altitude region of southern Shaanxi (32°–33° N, Figure 7c) and reached up to 300 hPa. The strongest upward motion was visible in the 700–500 hPa layer, with a value of −20 × 10−2 Pa·s−1. This strong upward motion resulted from the merging of the southerly wind associated with the SWV and the northerly wind at the rear of the northwest vortex. Meanwhile, the topography led to a secondary circulation. These created small-scale to meso-scale systems in the vertical wind field, which resulted in heavy precipitation.
As shown in the cross-section of the wind field at 08:00 on the 5th during Stage II (Figure 7b), the southerly winds are visible throughout the atmosphere layer due to the sole influence of the SWV. The strength of these winds and the overall relative humidity were significantly higher than in Stage I, indicating a saturated atmosphere. Convective precipitation tends to be produced by warm and moist southerly winds and topographic forcing. But, in the absence of the significant intrusion of dry air, the atmosphere remained relatively stable, preventing the development of widespread strong convective weather. The downward motion in the easterly wind on the southern side of the Qinling Mountains between 33° N and 34° N rose due to the Bashan Mountains. However, secondary circulation was not visible and the upward motion was weak and thin (Figure 7d), with a maximum value of −8 × 10⁻² Pa·s−1 at 700 hPa. To summarize, the topography of the Qinba region has a significant effect on controlling the vertical structure of the wind field by creating a secondary circulation. Consequently, this generates a more vigorous upward motion, ultimately enhancing the intensity of the precipitation.

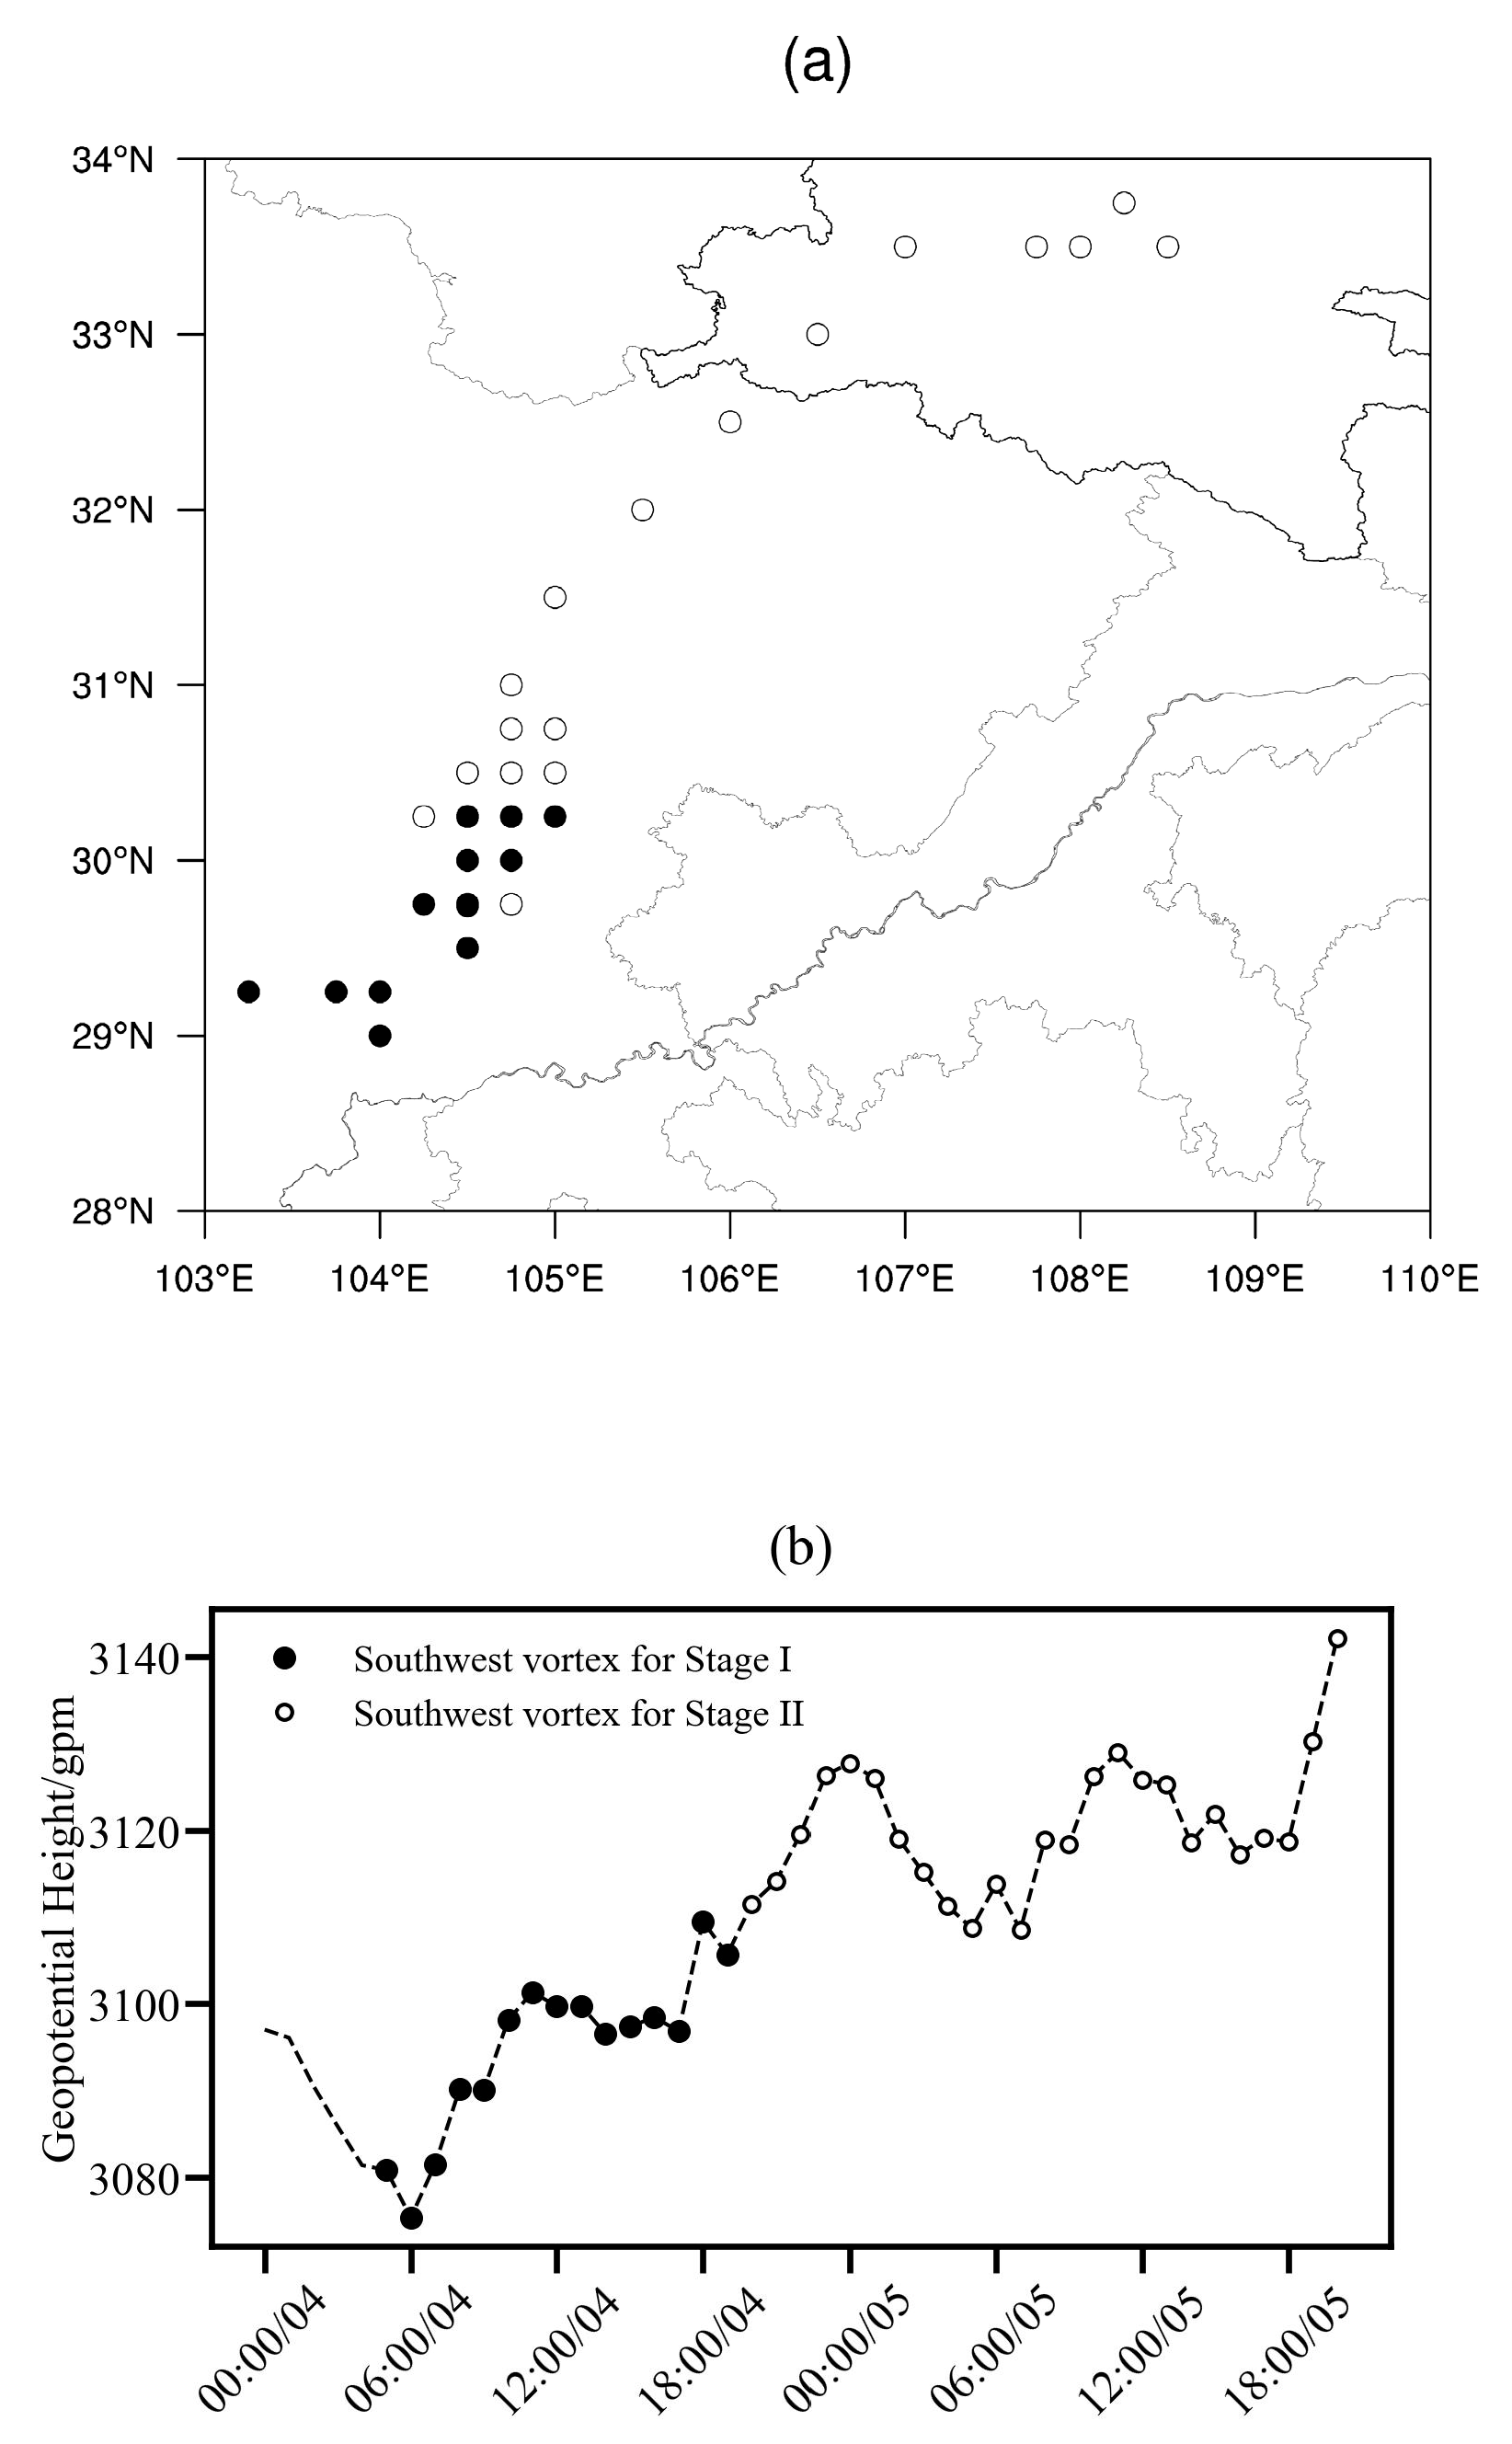
3.3. Characteristics of the SWV

The development and weakening of the SWV were present in both stages. The SWV, as indicated by the hourly 700 hPa wind field generated at 06:00 on the 4th, moved northeastwards and weakened at 20:00 on the 5th, with a life duration exceeding 30 h. Figure 8a shows the location variation in the SWV center. The SWV originated in Stage I in the south of the Sichuan Basin, at a location of 29.25° N, 103.75° E. It then gradually moved slowly, hovering in the region ranging from 29°–30.5° N and 103°–105° E, ultimately only traveling about 200 km to the northeast by 20:00 on the 4th. The 700 hPa potential height of the SWV center experienced an increase from 3075 gpm to 3112 gpm (Figure 8b). The SWV weakened while the northwest vortex moved eastwards. The precipitation covered the northeast of the SWV, where there was a convergence of the southwesterly and the northerly flow at the rear of the northwest vortex. During Stage II, the SWV center experienced significant changes in its position. It rapidly moved northeastwards between 20:00 on the 4th (29.75° N, 104.75° E) and 20:00 on the 5th, traveling approximately 500 km before eventually locating at 33.5° N, 108° E. The geopotential heights showed a fluctuation, with an initial rise followed by a decrease. The hourly 700 hPa wind fields indicated that a low-level jet surrounding the SWV gradually developed and intensified during the night of the 4th. Between 05:00 and 07:00 on the 5th, the jet reached its peak, with a maximum wind speed exceeding 17 m·s−1. The strengthening wind convergence intensified the SWV to reach its maximum strength of approximately 3108.5 gpm. The SWV then moved northeast and gradually dissipated. Its central potential height rose from 3112 gpm to 3142 gpm due to the weakening of the low-level jet. The intensity of the SWV was lower in Stage II than in Stage I. Precipitation predominantly took place within the warm zone that was affected by a southerly low-level jet, located in the eastern region of the SWV.
It can be seen that the SWV in Stage I had a greater intensity and stability and reduced mobility when it coordinated with the northwest vortex, leading to the development of the MCC and prolonging its existence, resulting in the widespread occurrence of heavy precipitation. The SWV is weaker in Stage II. As it moved towards the northeast, the convergence zone of the southerly low-level jet combined with the topography to create a strong upward movement, which triggered the generation of the MCS, resulting in strong precipitation scattered over the region.

4. Conclusions and Discussion

The comparative analysis of two consecutive days of heavy rainstorms (hereinafter referred to as Stage I and Stage II) in the Qinba area under the influence of the southwest vortex has been presented. The main conclusions are as follows:
(1) The two stages were accompanied by the generation, development, and evolution of the SWV. During Stage I, there was a wide range of heavy rainstorms, with 15 stations recording a 24 h accumulated rainfall of over 100 mm and a maximum hourly rainfall intensity of 129.0 mm. In Stage II, only four stations experienced heavy rainstorms, with a maximum hourly rainfall intensity of 72 mm. While the heavy rainstorms resulting from the two processes were in close proximity, their formation mechanisms were found to be noticeably distinct.
(2) Under the combined influence of the SWV and NWV during Stage I, two α-mesoscale convective cloud clusters strengthened and merged into an MCC. The heavy rainfall was concentrated in the center of the low TBB region and the high gradient value region on the side of cooler air. The maturity period of the MCC was more than 10 h, resulting in a large range of heavy rainstorms. Triggered by the southwestern low-level jet around the SWV, several γ-mesoscale convective clouds strengthened and merged into a β-mesoscale MCS in Stage II. During the eastward movement of the MCS, more γ-mesoscale convective clouds were triggered. This brought heavy precipitation to the cold cloud center and the TBB gradient maximum area, causing a train effect and local heavy rainstorms.
(3) The value of CAPE in Stage I was relatively high due to the influence of cold air behind the NWV. The joint action of the SWV led to convergence in the lower level and divergence in the upper level, with significantly strengthened positive vorticity and vertical upward motion in the lower and middle levels, resulting in stronger convection. Under the influence of the low-level jet around the SWV in Stage II, the atmospheric wet layer was deep. However, the CAPE value was smaller, and there was weaker divergence, vorticity, and vertical upward motion in the heavy precipitation area than in Stage I. Therefore, the coverage of heavy precipitation was relatively small and the convection was relatively weak.
(4) The SWV during Stage I had relatively high intensity and stability. Strong precipitation mainly occurred in the northeastern part of the SWV, where the southwesterly airflow converged with the northerly airflow behind the NWV. The SWV in Stage II weakened as it rapidly moved northeastwards, but it lasted for a long time and was accompanied by the strong development of low-level jets. Heavy precipitation was mainly concentrated in the jet convergence area in the eastern part of the SWV.
Most studies have shown that precipitation caused by the coupling of or interaction between the SWV and the plateau vortex often has a wider impact range, longer duration, and greater precipitation intensity than when the SWV acts alone [42,43,44]. This study described, for the first time, heavy rainstorms that were caused by the combined action of the NWV and the SWV, and a comparison was made with the weather that caused heavy rainstorms when the SWV acted alone. It is believed that the combination of the NWV and the SWV can cause stronger dynamic and thermal conditions, thus leading to a larger range and stronger rainstorms. This conclusion will not only improve the understanding of the weather system that causes rainstorms in the Qinba region, but also strengthen the study of the interaction mechanism between the SWV and the NWV.
In addition, the terrain of the Qinba region is complex; its mountains can increase precipitation by changing the water vapor, dynamics, and thermal conditions of the environment [33], and the windward slope and bell mouth also have a significant amplification effect on rainstorms [34,45]. This study found that a small-scale secondary circulation may form under the special terrain of the Qinba region, which could lead to a significant increase in precipitation. However, this study only analyzed one case, and further in-depth analysis is needed on how this secondary circulation is generated.
In future, the study of more cases of rainstorms caused by NWV and SWV, the spatial distribution characteristics, and the differences in heavy precipitation under this model will improve the understanding and the forecast level of heavy precipitation in the Qinba region.

Author Contributions

Conceptualization, methodology, formal analysis, Y.M. and Y.X.; investigation, resources, and data curation, R.L. and X.Z.; writing—original draft, Y.M. and Y.X.; writing—review and editing: P.L. and M.G. All authors have read and agreed to the published version of the manuscript.

Funding

This research was funded by the Special Fund of the China Meteorological Administration Rainstorm Fine Analysis and Forecast Youth Innovation Team (CMA2023QN05), Heavy Rain and Drought–Flood Disasters in Plateau and Basin Key Laboratory of Sichuan Province (SKZT202210, SKZT202106), the Natural Science Basic Research Program of Shaanxi Province (2022JM-142, 2023-JC-QN-0354), and the China Meteorological Administration Innovation and Development Special Project (CXFZ2023J031).

Institutional Review Board Statement

Not applicable.

Informed Consent Statement

Not applicable.

Data Availability Statement

The data presented in this study are available on request.

Acknowledgments

We would like to give our thanks to those who have made efforts to advance this work, and the fellow travelers along the way.

Conflicts of Interest

The authors declare no conflicts of interest.

References

  1. Feng, X.; Liu, C.; Fan, G.; Liu, X.; Feng, C. Climatology and Structures of Southwest Vortices in the NCEP Climate Forecast System Reanalysis. J. Clim. 2016, 29, 7675–7701. [Google Scholar] [CrossRef]
  2. Liu, C.; Li, Y.; Liu, Z.; Ye, M. Physical Formation Mechanisms of the Southwest China Vortex. Atmosphere 2022, 13, 1546. [Google Scholar] [CrossRef]
  3. Tao, S. The Heavy Rainfalls in China; Science Press: Beijing, China, 1980; p. 225. [Google Scholar]
  4. Li, Y.; Xu, X. A Review of the Research and Observing Experiment on Southwest China Vortex. Adv. Meteorol. Sci. Technol. 2016, 6, 134–140. (In Chinese) [Google Scholar]
  5. Wang, Z.; Wang, Y.; Liang, Y. A Numerical Experiment Study on a Southwest Vortex Rainstorm: Scientific Experiment, Operational Experiment and Weather Dynamics of Rainstorm Research on Academic Theory; Beijing Publishing House: Beijing, China, 1996; pp. 257–267. [Google Scholar]
  6. Li, G. Advances in Tibetan Plateau Vortex and Southwest Vortex Research and Related Scientific Problems. Desert Oasis Meteorol. 2013, 7, 1–6. (In Chinese) [Google Scholar]
  7. Fu, S.; Sun, J.; Zhao, S.; Li, W. The impact of the eastward propagation of convective systems over the Tibetan Plateau on southwest vortex formation in summer. Atmos. Ocean. Sci. Lett. 2010, 3, 51–57. [Google Scholar]
  8. Wu, R.; Luo, Y.; Yu, J. Statistical of moving-out southwest vortex and correlation between vortex and precipitation in central and eastern China. J. Meteorol. Sci. 2019, 39, 818–826. (In Chinese) [Google Scholar]
  9. Song, N.; Feng, X. Climate Characteristic of Moving-out and Non-moving-out Southwest Vortices. Plateau Mt. Meteorol. Res. 2021, 41, 59–67. (In Chinese) [Google Scholar]
  10. Li, M.; Gao, W.; Hou, J.; Xiao, D. Analysis on a Heavy Rainstorm from Southwest Vortex Moving Toward Northeast Direction in Sichuan and Shaanxi Provinces. Plateau Meteorol. 2013, 32, 133–144. (In Chinese) [Google Scholar]
  11. Wang, P.; Li, G. Numerical experiments of the impact of Qin-Ba mountainous terrain on a rainstorm caused by southwest vortex. J. Yunnan Univ. Nat. Sci. Ed. 2016, 38, 418–429. (In Chinese) [Google Scholar]
  12. Han, L.; Bai, A. Precipitation Characteristics of Southwest Vortex in Sichuan Basin from May to October in 2004–2017. Plateau Meteorol. 2019, 38, 552–562. (In Chinese) [Google Scholar]
  13. Liu, J.; Liu, H.; Xu, J. Analysis on Strong Convective Weather Triggered by Southwest Vortex. Plateau Meteorol. 2021, 40, 525–534. (In Chinese) [Google Scholar]
  14. Zhou, C.; Gu, Q.; He, G. Diagnostic Analysis of Vorticity in a Heavy Rain Event under Interaction of Plateau Vortex and Southwest Vortex. Meteorol. Sci. Technol. 2009, 37, 538–544. (In Chinese) [Google Scholar]
  15. Fu, S.; Sun, J.; Zhao, S.; Li, W.; Li, B. A study of the impacts of the eastward propagation of convective cloud systems over the Tibetan Plateau on the rainfall of the Yangtze-Huai River basin. Acta Meteor. Sin. 2011, 69, 581–600. [Google Scholar]
  16. Chen, B.; Gao, W. The Causing Storm Rain in Southwest Sichuan Basin Characteristic Analysis of Tibetan Plateau Vortex. Plateau Mt. Meteorol. Res. 2015, 35, 9–15. (In Chinese) [Google Scholar]
  17. Qiu, Y.; Li, G.; Hao, L. Diagnostic Analysis of Potential Vorticity on a Heavy Rain in Sichuan Basin under Interaction between Plateau Vortex and Southwest Vortex. Plateau Meteorol. 2015, 34, 1556–1565. (In Chinese) [Google Scholar]
  18. Yu, S.; Gao, W. Analysis of Environmental Background and Potential Vorticity of Different Accompanied Moving Cases of Tibetan Plateau Vortex and Southwest China Vortex. Chin. J. Atmos. Sci. 2017, 41, 831–856. (In Chinese) [Google Scholar]
  19. Gao, W.; Yu, S. The Case Study in Causes and Environmental Fields Analysis of Departure Plateau Vortex Accompanying with Induced Southwest Vortex. Plateau Meteorol. 2018, 37, 54–67. (In Chinese) [Google Scholar]
  20. Jiang, L.; Li, G.; Wang, X. Comparative Study Based on TRMM Data of the Heavy Rainfall Caused by the Tibetan Plateau Vortex and the Southwest Vortex. Chin. J. Atmos. Sci. 2015, 39, 249–259. (In Chinese) [Google Scholar]
  21. Yu, S.; Gao, W.; Xiao, D.; Peng, J. Observational facts regarding the joint activities of the southwest vortex and plateau vortex after its departure from the Tibetan Plateau. Adv. Atmos. Sci. 2016, 33, 34–46. [Google Scholar] [CrossRef]
  22. Chen, G.; Shen, Y.; Wang, X.; Zhu, Y.; Li, Q.; Zhang, Y. The Developmental Characteristics of the Structure of a Stationery Cold Southwest Vortex. Plateau Meteorol. 2018, 37, 1628–1642. (In Chinese) [Google Scholar]
  23. Zhou, Y.; Yan, L.; Wu, T.; Xie, Z. Comparative Analysis of Two Rainstorm Processes in Sichuan Province Affected by the Tibetan Plateau Vortex and Southwest Vortex. Chin. J. Atmos. Sci. 2019, 43, 813–830. (In Chinese) [Google Scholar]
  24. Schumacher, R.S.; Rasmussen, K.L. The formation, character and changing nature of mesoscale convective systems. Nat. Rev. Earth Environ. 2020, 1, 300–314. [Google Scholar] [CrossRef]
  25. Peters, J.M.; Schumacher, R.S. Mechanisms for organization and echo training in a flash-flood-producing mesoscale convective system. Mon. Weather Rev. 2015, 143, 1058–1085. [Google Scholar] [CrossRef]
  26. Maddox, R.A. Mesoscale convective complexes. Bull. Am. Meteorol. Soc. 1980, 61, 1374–1387. [Google Scholar] [CrossRef]
  27. Ran, L.; Li, S.; Zhou, Y.; Yang, S.; Ma, S.; Zhou, K.; Shen, D.; Jiao, B.; Li, N. Observational analysis of the dynamic, thermal, and water vapor characteristics of the “7.20” extreme rainstorm event in Henan province, 2021. Chin. J. Atmos. Sci. 2021, 45, 1366–1383. (In Chinese) [Google Scholar]
  28. Ma, C.; Li, Y.; Xu, B. Impact of double low-level jets on the extreme rainstorm in Henan province in July 2021. Chin. J. Atmos. Sci. 2023, 47, 1611–1625. (In Chinese) [Google Scholar]
  29. Xiao, Y.; Lou, P.; Li, M.; Wang, J. Analysis on a heavy rainstorm in Qinba region caused by southwest vortex and northwest vortex. Plateau Meteorol. 2023, 42, 98–107. (In Chinese) [Google Scholar]
  30. Kang, M.; Zhu, Y. Discussion and analysis on the geo-ecological boundary in Qinling range. Acta Ecol. Sin. 2007, 27, 2774–2784. (In Chinese) [Google Scholar]
  31. Zhang, C.; Ren, Y.; Cao, L.; Wu, J.; Zhang, S.; Hu, C.; Zhujie, S. Characteristics of dry-wet climate change in China during the past 60 years and its trends projection. Atmosphere 2022, 13, 275. [Google Scholar] [CrossRef]
  32. Bi, B.; Liu, Y.; Li, Z. Study on influence of the mechanical forcing of mesoscale topography on the extremely heavy rainfall in southern Shaanxi on 8~9 June 2002. Plateau Meteorol. 2006, 25, 485–494. (In Chinese) [Google Scholar]
  33. Li, X.; Wang, N.; Wu, Z. Terrain effects on regional precipitation in a warm season over Qinling-Daba mountains in central China. Atmosphere 2021, 12, 1685. [Google Scholar] [CrossRef]
  34. Zhao, Q.; Wang, J.; Wang, N.; Dai, C. Diagnostic study of topographic effect of a rainstorm in Qinba Mountain in summer in 2012. Meteorol. Sci. Technol. 2017, 45, 139–147. (In Chinese) [Google Scholar]
  35. Gao, D.; Li, Y.; Cheng, X. A numerical study on a heavy rainfall caused by an abnormal-path coupling vortex with the assimilation of southwest China vortex scientific experiment data. Acta Meteorol. Sin. 2018, 76, 343–360. (In Chinese) [Google Scholar]
  36. Cheng, X.; Li, Y.; Xu, X.; Heng, Z. Research and Numerical Simulation of a Torrential Rain Caused by the Southwest China Vortex during Flood Period. Plateau Meteorol. 2019, 38, 359–367. (In Chinese) [Google Scholar]
  37. Pu, X.; Bai, A.; Mao, X. Analysis of the Process of Heavy Rain and Cloud System Characteristics Caused by the Interaction of the Plateau Vortex and the Southwest Vortex. Adv. Meteorol. Sci. Technol. 2021, 11, 89–101. (In Chinese) [Google Scholar]
  38. Pu, X.; Bai, A. Analysis of formation mechanism of MCC heavy rain caused by interaction between plateau vortex and southwest vortex. J. Meteorol. Sci. 2021, 41, 27–38. (In Chinese) [Google Scholar]
  39. China News Network. 98 Towns and Offices in Ankang, Shaanxi Have Experienced Floods, Resulting in 56,748 People Affected. Available online: https://www.chinanews.com.cn/sh/2021/09-06/9558935.shtml (accessed on 6 September 2021). (In Chinese).
  40. Lu, F.; Zhang, X.H.; Chen, B.Y.; Liu, H.; Wu, R.H. FY-4 geostationary meteorological satellite imaging characteristics and its application prospects. J. Shandong Meteorol. 2017, 37, 1–12. (In Chinese) [Google Scholar]
  41. Li, J.; Wang, S.; Sun, G. Review and prospects of research on low vortex on the Qinghai-Tibetan Plateau. J. Lanzhou Univ. Nat. Sci. 2012, 48, 53–60. (In Chinese) [Google Scholar]
  42. Chen, Z.; Min, W.; Miu, Q.; He, G. A Case Study on Coupling Interaction between Plateau and Southwest Vortexes. Plateau Meteorol. 2004, 23, 75–80. (In Chinese) [Google Scholar]
  43. Zhao, C.; Wang, Y. A Case Study on Plateau Vortex Inducing SouthwestVortex and Producing Extremely Heavy Rain. Plateau Meteorol. 2010, 29, 819–831. (In Chinese) [Google Scholar]
  44. Zhou, M.; Liu, L.; Wang, H. Analysis of the echo structure and its evolution as shown in a severe precipitation event caused by the plateau vortex and the southwest vortex. Acta Meteorol. Sin. 2014, 554–569. (In Chinese) [Google Scholar]
  45. Xiao, Y.; Lou, P.; Liu, J.; Liu, S. Analysis on the cause and predictability of a γ-mesoscale short-time extremely rainstorm. Meteorol. Environ. Sci. 2022, 45, 13–22. (In Chinese) [Google Scholar]
Figure 1. Terrain characteristics of Qinba region.
Atmosphere 15 00260 g001
Figure 2. Accumulative precipitation over 24 h on 3–4 September 2021 ((a), unit: mm) and 4–5 September 2021 ((b), unit: mm) and variation of 1 h precipitation during the two heavy rainstorms at three heavy rainstorm stations in Qinba region (c).
Atmosphere 15 00260 g002
Figure 3. FY−4A infrared cloud image TBB (unit: °C) and 1 h accumulated precipitation over 10.0 mm at 20:00 (a) on 3 September; 02:00 (b), 08:00 (c), 14:00 (d), and 20:00 (e) on 4 September; and 02:00 (f), 08:00 (g), 14:00 (h), and 20:00 (i) on 5 September 2021.
Atmosphere 15 00260 g003
Figure 4. Geopotential height at 500 hPa (red lines, unit: gpm) and 700 hPa (black lines, unit: gpm), and wind field (windbarb, unit: m·s−1) and low-level jet (color filled, units: m·s−1) at 700 hPa at 20:00 (a) on 3, 08:00 (b) and 20:00 (c) on 4, and 08:00 (d) and 20:00 (e) on 5 September 2021. Red pentagrams represent the location of the NWV and black dots represent the location of the SWV.
Atmosphere 15 00260 g004
Figure 5. T−logP diagram (left) and profile of pseudo-equivalent potential temperature (right) at Dachuan station in Sichuan Province at 20:00 on 3 September (a) and 05:00 on 4 September (b) 2021.
Atmosphere 15 00260 g005
Figure 6. Profile of regional mean (30°−33° N, 105°−109° E) divergence ((a), unit: 10−5·s−1), vorticity ((b), unit: 10−5·s−1), and vertical velocity ((c), unit: 10−2·Pa−1·s−1) at 6 h intervals from 20:00 on 3 to 5 September 2021. The black lines are for Stage I and the gray lines are for Stage II.
Atmosphere 15 00260 g006
Figure 7. Meridional profile of wind field (vector, units: m·s−1) and relative humidity (color filled, units: %) (a,b) and vertical velocity (contour lines, units: 10−2 Pa·s−1) along 108.5° E at 08:00 on 4 September (a,c) and 5 September (b,d). Black-filled areas represent the altitude of the terrain.
Atmosphere 15 00260 g007aAtmosphere 15 00260 g007b
Figure 8. Variation of hourly position (a) and geopotential height at 700 hPa (b) of southwest vortex. Black dots represent southwest vortex for Stage I and white dots represent southwest vortex for Stage II.
Atmosphere 15 00260 g008
Table 1. Environmental parameters of Sichuan Dachuan station.
CAPE/J·kg−1CIN/J·kg−1q850/g·kg−1q700/g·kg−1K/°CSI/°CWCD/m
20:00 on 3rd3100.171.214.09.436.40.94394
08:00 on 4th924.5107.113.610.940.8−1.734365
20:00 on 4th9.6014.010.237.2−0.14378
08:00 on 5th67.40.116.410.641−2.294678
20:00 on 5th611.6015.311.041.3−1.884602
Table 2. Environmental parameters of Shaanxi Ankang station.
CAPE/J·kg−1CIN/J·kg−1q850/g·kg−1q700/g·kg−1K/°CSI/°CWCD/m
20:00 on 3rd5014.58.935.4−0.354132
08:00 on 4th83.71.115.011.137.90.094827
20:00 on 4th012.313.79.333.11.254814
08:00 on 5th73.70.710.810.432.43.74612
20:00 on 5th2.413.612.310.629.76.664859
Disclaimer/Publisher’s Note: The statements, opinions and data contained in all publications are solely those of the individual author(s) and contributor(s) and not of MDPI and/or the editor(s). MDPI and/or the editor(s) disclaim responsibility for any injury to people or property resulting from any ideas, methods, instructions or products referred to in the content.

