Article

Inter-Comparison of Lightning Measurements in Quasi-Linear Convective Systems

by
Jacquelyn Ringhausen
1,*,
Vanna Chmielewski
2 and
Kristin Calhoun
2
1
Cooperative Institute for Severe and High-Impact Weather Research and Operations (CIWRO), The University of Oklahoma, 120 David L. Boren Blvd., Norman, OK 73072, USA
2
NOAA/OAR National Severe Storms Laboratory, 120 David L. Boren Blvd., Norman, OK 73072, USA
*
Author to whom correspondence should be addressed.
Atmosphere 2024, 15(3), 309; https://doi.org/10.3390/atmos15030309
Submission received: 13 February 2024 / Revised: 27 February 2024 / Accepted: 28 February 2024 / Published: 29 February 2024
(This article belongs to the Special Issue Recent Advances in Lightning Research)

Abstract

:
Data from four lightning networks collected during three quasi-linear convective systems (QLCS) are used to understand the differences in detection for optimizing their combined use. Additionally, using unique aspects from each network provides a more complete picture of lightning in a thunderstorm. The four lightning networks examined include a Lightning Mapping Array (LMA), the Earth Networks Total Lightning Network (ENTLN), the Geostationary Lightning Mapper (GLM), and the National Lightning Detection Network (NLDN). The data from each network are inter-matched and locations where each network uniquely detected a flash versus all are analyzed in reference to three QLCSs, including two QLCSs that occurred in the Southeast (22 March 2022 and 30 March 2022) during the Propagation, Evolution, and Rotation in Linear Systems (PERiLS) field campaign, and one case from Oklahoma (26 February 2023). Unique aspects of the lightning provided by each network are examined, including flash initiation altitude, size, type, and energy. Lightning flash trends and characteristics for each QLCS are similar between networks in general, but deviate in certain conditions and locations. Times of decreased matching between networks were associated with localized increases in lightning rates, smaller flash sizes, and lower-energy flashes. The differences in each network’s performance across the QLCSs demonstrates the importance of understanding the limitations in each and the advantage of using multiple networks.

1. Introduction

Lightning location networks differ in lightning detection method based on observed frequency ranges, the number and location of sensors, and the algorithms used to quantify and locate lightning [1]. Due to these differences, each network can provide unique information about not only the lightning itself, but also the supporting meteorological environment. For instance, Lightning Mapping Arrays (LMAs) detect lightning breakdown processes at higher frequencies and uniquely map lightning channels in 3D [2]. However, they do not map the channel to ground, have a negative leader detection bias, provide no flash type classification, and have a substantial drop off in source detection efficiency (DE) with range [3,4,5]. The National Lightning Detection Network (NLDN) [6] and the Earth Networks Total Lightning Network (ENTLN) [7] operate at lower frequencies, allowing for a much larger detection range. These systems are more sensitive to energetic processes such as return strokes or narrow bipolar events. They cannot provide 3D detail or spatial extent, but can generally distinguish between cloud-to-ground (CG) and intra-cloud (IC) lightning [6,8,9]. The Geostationary Lightning Mapper (GLM) onboard the Geostationary Operational Environmental Satellites (GOES) detects optical lightning emissions, including over oceans and places where ground-based sensors are limited [10]. It does not provide altitude information or differentiate CG and IC lightning, although some work has demonstrated a path to do so (flash type classification [11,12]), (altitude [13]). GLM DE can be dampened depending on storm makeup [14,15], flash characteristics (e.g., size, initiation altitude, type, and duration [16,17]), and the distance from nadir [16,18].
Combining data from multiple networks not only provides a more complete lightning dataset, but the strengths and weaknesses of each network might be leveraged to signal information on the storm environment and microphysics. For example, ref. [19] used the flash type capabilities of NLDN and the 3D mapping of LMAs to calculate more accurate nitrogen oxide (NOx) amounts, since ICs and CGs produce differing NOx values. Reference [11] predicted flash types in the GLM data via merging with ENTLN to relate flash type to hurricane intensification and weakening [20].
Lightning and charge layer characteristics depend on storm updraft and microphysics [21,22,23,24]. For electrification, rebounding collisions of hydrometeors such as graupel and ice crystals in the presence of supercooled liquid water need to occur, and the charge acquired by each hydrometeor is dependent on characteristics such as temperature, liquid water content, rime accretion rate, and relative sizes [25,26]. LMA flash rates have been parameterized from radar-inferred microphysical and kinematic parameters such as graupel mass, graupel echo volume, updraft volume, and updraft velocity [27,28,29,30,31]. Past studies using LMA data have also shown or theorized that stronger updrafts create more pockets of charge from turbulence and often produce smaller, more numerous flashes, while less turbulent stratiform regions have larger striated layers of charge that produce fewer but larger flashes [22,24,32]. Relationships between flash size and rate to updraft strength are not as clear within other datasets. For instance, ref. [18] demonstrated that LMA data matched these past findings of smaller flashes and higher flash rates during stronger updrafts in two Colorado storms and one Alabama storm, but GLM did not necessarily. The lower altitude and smaller sizes of the Colorado flashes paired with the off-nadir viewing angle of GLM caused decreased detection and a depressed signature in flash rates. The normally charged Alabama storm, however, produced similar flash rates between the two networks. Reference [33] further compared GLM and LMA along with the International Space Station (ISS)—Lightning Imaging Sensor (LIS), the Atmosphere–Space Interactions Monitor (ASIM), and radar for a single lightning flash. For the analyzed flash, GLM most prominently detected return strokes, recoil leader processes, and lightning leader branching involving new leader development and was affected by the position of the lightning channel in the cloud as well as the cloud properties above and surrounding the flash. Thus, the characteristics of flashes viewed by different networks might give information about the nature of the storm updraft, as well as clues to the broad charge structure present.
Rapid increases in total lightning (i.e., lightning jump [34,35,36]) using the LMA often precede severe criteria including tornadoes [34,36,37,38,39,40]. Lightning jumps in the LMA may be related to both the updraft volume and increased precipitation mass, which contributes to downdraft-generated vorticity, which in turn can enhance the low-level mesocyclone and tornado formation [40,41]. However, if horizontal shearing instability (HSI) is the mesovortex generation mechanism, then this process would not be observed. Further, when the lightning jump method is applied to other lightning networks, the relationship is not as clear. For instance, ref. [42] found that GLM produced more lightning jumps in general, but these jumps did not consistently correlate to severe weather events, or even severe storms, producing a false alarm rate greater than 80%. Ref. [43] also found large false alarm rates with many lightning jumps common in non-severe storms using NLDN data. Reference [44] further found that NLDN and GLM varied greatly in both lightning jumps and flash rates depending on storm makeup.
This paper aims to demonstrate the differences between each network and the unique characteristics of lightning that each network provides. This will be explored using three quasi-linear convective systems (QLCSs), two sampled during the Propagation, Evolution, and Rotation in Linear Storms (PERiLS) field campaign [45] and one sampled in Oklahoma, all with reliable LMA observations. PERiLS was focused on sampling tornadic QLCSs in the Southeast, with collaboration across several universities and research organizations. QLCSs themselves are organized lines of convection that are oriented linearly, often driven by a frontal passage, and produce a wide variety of severe weather. Minimal research has been performed on the inter-comparison of lightning network performance within these systems. QLCSs provide an interesting laboratory for lightning network comparison due to their large coverage area and the spectrum of flash characteristics and meteorological processes present within them.
All of the previous discussion supports the fact that (1) lightning characteristics are intimately related to the storm motions/updraft and microphysics and (2) the lightning trends presented by each network can differ based on differences in methods of detection and algorithms and thus cannot be treated generically. This fact is the motivation for this study, not only to compare and contrast the different networks, but to showcase the unique information of flashes each network can provide and how this combination reveals a more complete depiction of storm electrification. Through this study, we seek to answer the following: What characteristics of flashes in QLCSs make them more likely to be seen by all networks? It is expected that larger, higher-altitude, and higher-energy flashes during lower-flash-rate periods are most likely to match between networks. Higher heights and energies should allow more light to reach cloud top for GLM, larger flashes provide more branching for overlap between LMA and very-low-frequency (VLF) networks, and lower flash rates provide more stability in flash sorting algorithms across networks. The QLCS cases we will be analyzing vary by location, time of day, and charge structure, which can all influence the observed lightning trends. Anomalous versus normal charge structures, favored in different locations, affect network performance due to differences in initiation heights and dominant flash types. Also, network performance is not expected to be uniform for all regions.

2. Materials and Methods

For this study, four lightning networks are used to gain the full picture of lightning in each storm. More detail on each network is provided in the following sections.

2.1. Lightning Mapping Array (LMA)

Data were collected from the National Severe Storms Laboratory (NSSL) mobile LMA and OKLMA. The mobile LMA was deployed as part of PERiLS to study QLCSs. It detects very-high-frequency (VHF) emissions (60–66 MHz) from lightning and consists of eight sensors. This frequency range allows for the detection of smaller-scale breakdown processes such as branching and leader development, allowing for the 3D mapping of lightning. Time-of-arrival techniques pinpoint radiation source locations, with location errors being tens of meters within the network bounds and increasing location errors with distance outside the network [3,4]. The DE of LMA networks within network range is typically greater than 95%, but decreases quickly outside of 150 km of the network center [3,4,5,46,47]. To be considered in this analysis, an LMA source needed to have a maximum reduced chi-squared value of 1.0 and be detected by six sensors minimum, and the flash needed to be composed of more than ten sources. LMA sources were grouped into flashes using the lmatools python package (https://zenodo.org/record/32510, accessed on 20 February 2024), with a threshold of 3 km and 0.15 s and a maximum flash duration of 3 s.

2.2. Geostationary Lightning Mapper (GLM)

The GLM is an instrument aboard the GOES 16, 17, and 18 that detects optical emission from lightning escaping cloud top. The GLM is focused on the 777.4 nm wavelength, a prominent emission line for lightning [48,49,50,51]. The spatial resolution of GLM varies from 8 km at nadir to 14 km at the edge of the field of view [52]. The data are classified into three main classifications: (1) events representing a single illuminated pixel that exceeds the background threshold, (2) groups encompassing all adjacent pixels that occur in the same 2 ms timeframe, and (3) flashes consisting of all events/groups that occur within 330 ms temporally and 16.5 km spatially [10]. For large flashes, there can be an unrealistic splitting due to an upper limit imposed by the Lightning Cluster-Filter Algorithm (LCFA) of 101 groups in a flash [53]. Since our analysis focuses on QLCSs with large stratiform regions for lightning to propagate into forming expansive flashes, some flashes were flagged as reaching this limit. Thus, events and groups comprising flagged flashes are resorted without an upper limit on the number of groups comprising a flash, similar to [53]. The overall DE of GLM flashes is estimated to be around 70% [16,54], with fluctuations due to day versus night sensitivity changes [16,55], storm makeup [15,18], and distance from GOES nadir [56].

2.3. Earth Networks Total Lightning Network (ENTLN)

The ENTLN is a worldwide lightning detection network operating between 1 and 12 MHz [57]. Sensors are not uniformly distributed worldwide, so DE varies geographically [58]. ENTLN incorporates the World Wide Lightning Location Network (WWLLN) into its dataset and has done so since December 2011, helping improve DE over oceans [59]. For ENTLN, pulses are sorted into flashes if they are within 700 ms and 10 km of another pulse. ENTLN can detect both CG and IC lightning with moderately high accuracy, especially over CONUS, where the sensor density is higher, with an estimated stroke and pulse classification accuracy of 86–93% [8,20]. For this analysis, the newest method of ENTLN flash classification is used, as described in [7].

2.4. National Lightning Detection Network (NLDN)

The NLDN is a ground-based lightning detection network over CONUS with a >30-year observational record. It operates in the low-frequency (LF) range, detecting signals created by fast discharges such as return strokes. NLDN is particularly good at detecting CG flashes, with a DE of 93 % with location errors less than 300 m [6,9,60,61]. However, the DE for IC flashes is substantially lower, with estimates around 10% [1,6,62]. NLDN strokes are grouped into flashes for this analysis using the methods described in [6].

2.5. Matching Between Networks

Lightning from each network are inter-matched using a threshold of 30 km and 20 ms, similar to past matching studies [11,58,63,64]. ENTLN pulses, GLM groups, and NLDN strokes were matched to LMA sources, and the parent flashes were then subsequently matched if they contained one or more pulses/groups/strokes that matched. We chose to match at the pulse level to make sure matches were of the same discharge process. However, this method of matching will cause lower values for subsequent flash matches, because although LMA flash detection is >90%, at the pulse level, sources are produced in the streamer zones at leader tips, whereas VLF or optical are produced by current flowing in the leader or channel. Thus, we are not calculating a true DE as has been done in the majority of past lightning network inter-comparison studies, which used flash-to-flash matching with much larger time criteria for matching (e.g., [54,62,65]). Instead, we acquire a determination of overlapping processes being detected between networks. An example of what each network is detecting at the pulse level is shown in Figure 1. In the example, GLM primarily is matching and detecting the earlier portion of the flash, implying these pulses are the most optically bright parts of the flash. The majority of ENTLN and NLDN pulses occur in the western portion of the flash, primarily detecting the most energetic pulses such as return strokes. LMA is detecting small breakdown processes but not resolving the large energetic processes like the return strokes that ENTLN and NLDN are detecting in the southwest region of Figure 1. Further, no networks are matching the extensive LMA branching later in the flash. Although the example shown in Figure 1 is one LMA flash, it consists of two GLM flashes, three NLDN flashes, and six ENTLN flashes, further highlighting the differences in sorting algorithms between networks.
Since QLCSs can span large distances, some of the furthest sampled QLCS regions are further than 150 km from the LMA and will have a lower LMA DE and decreased location accuracy. Thus, we limited the pulse and flash matching to within 100 km of the LMA network center, where estimated flash detection is 100% (Figure 2).
Thermodynamic parameters discussed in the case descriptions such as surface-based convective available potential energy (SBCAPE), 0–3 km storm relative helicity (SRH), and equilibrium level (EL) are retrieved from the High-Resolution Rapid Refresh (HRRR) model and further corroborated with nearby National Weather Service (NWS) soundings and the Storm Prediction Center Mesoanalysis products (http://catalog.eol.ucar.edu/perils_2022/analysis, accessed on 20 February 2024).

2.6. Cases of Interest

QLCSs are used in this research, since they provide a unique and minimally explored basis for lightning network comparison due to their large coverage area, large spectrum of flash characteristics, and large range of meteorological processes present within them. Three main cases were chosen to allow for reliable sampling of each storm using the LMA. These cases are described in greater detail in the following sections and basic information can be found in Table 1.

2.6.1. Case 1: 22 March 2022 PERiLS IOP1

Case 1 is a QLCS event sampled on 22 March 2022 in the first year of the PERiLS field campaign. The QLCS formed over Texas around 0000 UTC on 22 March. As it propagated east, the QLCS moved into a more favorable environment for development, with higher SRH and SBCAPE. This case included a variety of storm modes, as evidenced by deep convection developing in the warm sector ahead of the main frontal band of storms in eastern Mississippi around 1800 UTC. Eventually, these discrete cells merged with the main line. Overall features of the Case 1 QLCS include a trailing stratiform region (Figure 2), average SBCAPE of ∼500 J / kg , EL ∼ 10.4 km , and average 0–3 km SRH of 400 m 2 / s 2 . This QLCS included five tornadoes within the sampling domain along the Mississippi/Alabama border (Figure 2), a supercell merger with the line, and the most lightning overall out of all cases (Table 2). The sampling of Case 1 occurred primarily during daytime.

2.6.2. Case 2: 30 March 2022 PERiLS IOP2

Case 2 was another active QLCS sampled along the MS/AL border during PERiLS on 30 March 2022. Similar to Case 1, this QLCS originated in Texas/Oklahoma around 0200 UTC on 30 March, strengthened in Louisiana around 1700 UTC producing several tornadoes, and continued to produce severe weather as it moved through Mississippi and into our study area at 2200 UTC. There were six tornadoes within range of the mobile LMA network associated with the Case 2 parallel stratiform QLCS passage (Figure 2). Compared to Case 1, the timing of sampling was later in the day, including after-dark measurements, the average SBCAPE values were higher (∼700 J / kg ), with similar 0–3 km SRH (>350 m 2 / s 2 ) and EL around 10.2 km . Lightning flash rates were overall lower than Case 1.

2.6.3. Case 3: 26 February 2023 Oklahoma

Case 3 was a prominent fast-moving QLCS system that moved through Oklahoma on 26 February 2023. Storms initiated in the Oklahoma panhandle and western Kansas around 2300 UTC and were more cellular in nature. As the storms propagated eastward, they formed into a linear system and moved into the study area, where SRH values increased rapidly by 0100 UTC on February 27. There were six tornadoes in the study domain for Case 3. Several of the mobile LMA sensors were deployed to supplement the permanent OKLMA network during this case. This case contrasts the other cases in its location and thermodynamic profile, with lower SBCAPE (∼300 J / kg in the domain), higher average 0–3 km SRH around 600 m 2 / s 2 , and a lower EL (∼8.6 km ). The QLCS also had a very limited stratiform region when compared to the other cases and moved quickly through the domain. Case 3 had the lowest amount of lightning overall and included after- dark measurements.

2.7. Overall Comparison of Matching between Networks

The amount of flashes matching between networks differs depending on storm location/evolution and network (Table 2). Matching was similar for Cases 1 and 2, with LMA flashes matching best to GLM flashes, followed by ENTLN and NLDN. NLDN had the highest overlap with ENTLN, which is reasonable since ENTLN and NLDN have similar methods of detection. ENTLN, however, had the highest percentage matched to GLM and LMA. GLM matching to LMA decreases from around 84–88% for Cases 1 and 2 to 79% for Case 3. This lower fraction of matched flashes is possibly partially due to an off-nadir viewing angle decreasing the GLM’s ability to detect lower-energy flashes in Oklahoma [56]. Contrarily, ENTLN and NLDN have an increase in percentage matched for Case 3 and have the lowest percentage matched to LMA for Case 1, implying a different flash population is likely playing a role in the differences between cases. Since we are matching at the source/pulse/stroke/group level, matching between networks not being 100% supports the notion that these networks are recording different processes. The overall totals further show this difference, with moderate variations in the number of flashes between networks across cases (Table 2). Through all these observed differences, each network provides another piece of the lightning puzzle.

3. Results

Analysis of the number of flashes matching to a unique LMA flash shows the overall matching is closest to 1 (Table 3), due to the large majority of LMA flashes being very small. There are, however, differences between the average number of flashes matching to a single LMA flash between networks. For instance, ENTLN had a higher average number matched across all cases when compared to NLDN and GLM, with a range of 1.24–1.51 flashes matching to each LMA flash. It also had the highest number matched to one flash, with nine ENTLN flashes matching to one LMA flash in Case 2. NLDN had the lowest average number of flashes matched to an LMA flash across cases, with a range of 1.01–1.03. This could in part be a result of the lower number of flashes present in the NLDN dataset compared to ENTLN (totals shown in Table 2). NLDN detects CGs very well, but is not geared towards detection of small IC pulses and flashes [6]. Thus, there are fewer pulses (and flashes) to match to, with the primary strokes being CG, which is less likely to match to LMA-detected processes. Additionally, the two networks differ in their flash sorting criteria, with NLDN having a smaller temporal bound overall and larger spatial bound for ICs than ENTLN (NLDN: 500 ms and 10 km for CGs, 20 km for ICs [6] versus ENTLN: 700 ms and 10 km [29]) which can contribute to differences in the flash totals. GLM is the middle ground of the networks, with the average number of flashes matched to a single LMA flash between 1.04 and 1.17. Case 3 had a clear drop in the mean number of flashes matched to each LMA flash, supporting the notion that GLM is not detecting small, less-energetic IC groups (and flashes) for Case 3 due to the off-nadir viewing angle [56].
Through matching networks to the LMA, we can explore the characteristics of flashes that overlap and those that do not (Figure 3). For Case 1, the matched flashes are on average larger than the unmatched flashes across all networks ( 27 km 2 for matched versus 13 km 2 for unmatched). For altitude, there is a minimal difference between matched and unmatched flashes, with both having an average value around ∼8.3 km. Overall, Case 1 has the highest average flash initiation altitudes out of all cases. Recall that GLM had the highest percent matched to LMA flashes for Case 1, while ENTLN and NLDN had their lowest percentage matched in Case 1, which could imply that height is a bigger factor for GLM detection/matching than the other networks. Flash areas show a clearer difference between matched and unmatched LMA flashes, with matched flashes having an average flash area of 25 km2, while unmatched LMA flashes had an average value of 11.6 km2. Additionally, ENTLN matched to the smallest flash areas out of all networks (21.5 km2).
Similar matching trends between networks occur in Case 2, but with much larger average flash areas than Case 1 and lower altitudes. The Case 2 peak matching occurs at ∼40 km 2 in area and 7.5 km in height. As in Case 1, there is very little variation in matching trends with height for GLM, NLDN, and ENTLN. There is also a small peak in unmatched flashes at ∼4 km, implying that a population of lower-altitude flashes are not matching. Similar to Case 1, unmatched flashes are smaller than matched flashes, with an average flash area for unmatched LMA flashes of 16.8 km2. Additionally, for Case 2, NLDN is matching to larger flashes on average than ENTLN or GLM. This matches up with the fact that NLDN had decreased flash detection in Case 2, implying it is not seeing smaller flashes.
A bigger change in matching occurs in Case 3. Initiation altitudes are the lowest in height and there is a clear difference in the matched versus unmatched heights. There is also a big difference in matched versus unmatched areas, with larger LMA flashes (average between 40 and 55 km 2 ) more likely matched, while unmatched LMA flashes were substantially smaller (16 km 2 ). GLM is clearly matching to larger flashes than NLDN or ENTLN, with a median flash area of 56.0 km 2 . This is potentially due in part to the location of Case 3 being further from GLM nadir (Oklahoma versus Mississippi/Alabama), causing smaller lower-energy flashes not to be detected [56]. For altitude, all networks have nearly identical matching patterns, with a peak at ∼6.5 km. This altitude is lower than other cases, which may also contribute to GLM having a lower DE, although the EL was also lower in height for this case. Unmatched flashes are on average lower in altitude (5.7 km) and there is a lack of a lower secondary maximum in altitude, implying a different charge arrangement than the first two cases. This agrees with past findings analyzing differences in flash altitudes regionally, where regions like Oklahoma and Colorado often had lower average flash initiation heights than Southeastern storms [14,46]. This difference is often attributed to anomalously charged storms, which are more common in the Great Plains region. The average temperature where the most flashes are initiating also supports an anomalous charge structure for Case 3, with the peak for Case 3 sitting at −14 °C based on the nearest NWS soundings, whereas Case 1 and Case 2 peak at around −30 °C, matching the respective temperature peaks for anomalously and normally charged storms in [14]. Overall, the height is a bigger factor in matching between network for Case 3 than Case 1 or 2.
We also compare flash characteristics unique to each network for unmatched versus matched flashes (Figure 4). As a reminder, if multiple GLM/NLDN/ENTLN flashes match to an LMA flash, the characteristics of all of them are included in the matched dataset. Energies for matched and unmatched flashes differ between cases, networks, and flash types (Figure 4). When discussing amplitudes and polarities of flashes, we use the nomenclature described in [66], where, for example, an IC flash propagating from the lower negative to the upper positive charge region is considered a positive (+) IC and the opposite negative (-). For ENTLN, there are two main peaks of negative and positive amplitudes among matched IC flashes in Case 1, with +ICs more likely to be matched. These two peaks are also present for unmatched ICs, but with a larger peak in -IC amplitudes. Case 2 also has two main peaks, with similar distributions of positive and negative matched versus unmatched ICs as Case 1. Case 3 has a completely different amplitude pattern, with very few +ICs occurring at all. On average, larger-amplitude IC flashes matched better to LMA flashes. CGs for Cases 1 and 2 have similar patterns, with a larger portion of +CGs matching to LMA flashes, while unmatched ENTLN flashes are predominantly negative. It has been shown that there is frequently a spurt of in-cloud negative leader growth seen immediately following a +CG stroke [67], which would result in matching between VLF networks and LMA using our criteria. The LMA will not see the channel to ground, but it will see the in-cloud bloom. For Case 3, very few +CGs occur, and -CGs are lower-amplitude on average than Cases 1 and 2. Overall, the matched versus unmatched flash amplitudes for Case 3 are indistinguishable.
NLDN amplitudes are very similar between Cases 1 and 2 for CGs and ICs (Figure 4). Unlike ENTLN, the main peak for ICs is composed of small positive-amplitude flashes, with very few small-amplitude -ICs present and more higher-amplitude ICs than ENTLN. Case 3, however, is very similar to ENTLN, with most of the matched and unmatched ICs being negative. CGs also have larger amplitudes than ENTLN flashes for all cases. Similar to ENTLN, +CGs are more likely to be matched to LMA. Interestingly, the majority of CGs for Case 3 were predominantly negative, which is the opposite of what is typically observed in past studies of anomalous storms [68,69,70,71]. However, the majority of these past studies were isolated storms, and charge structures in QLCSs are much more complicated. The predominant number of -CGs in this case could be partially due to biases in the classification algorithms of both ENTLN and NLDN favoring negative flashes to be classified as CGs, since -CGs are much more common on average compared to -ICs.
Flash energies for GLM are larger in Cases 1 and 2 (∼54 fJ) and smallest for Case 3 (∼38 fJ), similar to ENTLN and NLDN amplitudes (Figure 4). Matched flashes have larger energy values than unmatched flashes across all cases, although the difference is small. GLM flash footprints in Cases 1 and 2 follow a similar pattern as the flash energy, with unmatched flashes being smaller (140 and 207 km2) than matched flashes (209 and 277 km2, respectively) across cases. However, the flash areas in Case 3 are on par with the other two cases and there is no clear difference between matched versus unmatched flash areas, which differs from the smaller energy values for Case 3. The difference between Case 1 and Case 2 GLM flash characteristics versus Case 3 is possibly due to a combination of location (off-nadir viewing angle for GLM in Oklahoma [56]) and charge structure (anomalous charge, lower initiation heights, smaller cloud depth [46]); however, Case 3 also occurred after dark, which would have a positive effect on GLM flash detection. Off-nadir viewing would cause the smallest of flashes not to be detected, since they would not overcome the GLM energy threshold for detection, which would increase the upper bound for small flashes to match, matching the absence of smaller GLM flash areas in Case 3, and the larger LMA flash areas to be matched to GLM versus ENTLN and NLDN. Adding to this is the possibility that the flashes themselves are smaller due to the difference in charge structures between the cases, further enhancing this effect.

3.1. Example Snapshots for Inter-Comparison of Network Performance

To get a better idea of what is happening at times when networks do and do not quite match up, we examine a few of those times in detail. The first example showcases a time where detection between networks was similar, but matching was low in one section and higher in the other. The second example demonstrates a time where the opposite is true: the detection between networks varied greatly, but the matching to LMA was high. Lastly, the third example shows a time where networks had both similar detection amongst networks and high matching to the LMA.

3.1.1. Example 1: 27 February 2023, 0315 UTC

0315 UTC in Case 3 was an active severe time period for the QLCS, with several tornadoes ongoing. In this example, there is variation across the sampled region of the QLCS in not only the amount of lightning each network is detecting, but also in the matching between networks. To inter-compare differences between areas of higher matching between networks versus lower matching, we will be focusing on two areas of the QLCS, termed the left region and right region. There is a prominent decrease in matching for the left region and higher matching in the right region (Figure 5). The decrease in matching of flashes to LMA flashes in the left region is present across all networks, with the most prominent signature present for the NLDN and GLM. The percentages of GLM, ENTLN, and NLDN flashes that had a corresponding LMA flash match in the left region are 40.8%, 83.1%, and 43.9%, respectively, and 96.8%, 98.7%, and 97.9%, respectively, for the right region. ENTLN and NLDN detect more flashes in the left region (346 and 300 flashes) versus the right region (243 and 242 flashes, respectively). The LMA, however, reports substantially more flashes in the right region versus the left region (1310 versus 313 flashes, respectively). The GLM has similar trends to the LMA, but more muted, with more flashes occurring in the right region versus the left (267 versus 213 flashes, respectively). Overall, the left region has more variation in flash rates and locations between networks, with more spread location-wise in the ENTLN data.
There are clear differences in the LMA flash characteristics between the two regions, as shown in the violin plots in Figure 5. The right region has much larger flashes in general, with an average flash area of nearly 60 km2, while the left region has an average flash area of less than 25 km2. LMA flash altitudes also differed, with higher average flash initiation altitudes in the left region versus the right (6.5 versus 5 km, respectively). One potential contributor to the lower matching in the left region is its distance being further from the network center, causing decreased detection by the LMA. This is further supported by the lower number of LMA flashes in the left region. However, the GLM flash characteristics show that the flash populations are inherently different, meaning the distance from the LMA network center is not the only reason for decreased matching between networks. Similar to the LMA, GLM flashes in the right region are larger than the left region, with average flash areas being approximately 300 versus 210 km2, respectively. Additionally, GLM flash energies are also larger in the right region (70 fJ) versus the left region (25 fJ). The larger, more energetic flashes in the right region support better matching between networks (and better detection for GLM), since larger flashes provide more opportunity for overlap of processes detected between networks.
NLDN and ENTLN provide flash type and polarity information between the two regions. The majority of flashes, according to NLDN, are IC in both regions (left:245, right:205), with a larger amount of both IC and CG flashes present in the left region. Although the amount of CG flashes is less in the right region (left:55, right:37), the spread in CG amplitude is higher, implying larger-amplitude flashes are occurring. The ENTLN flash type and amplitude tell a slightly different story than NLDN. The majority of flashes in the left and right region are IC (left:253, right:160), with a higher proportion of the lightning being IC in the left region. However, CG flash counts are comparable between the two regions (left:93, right:83). There is also less spread in amplitude values than NLDN, with positive ICs being slightly more common for the left region than the right.

3.1.2. Example 2: 22 March 2022, 1900 UTC

In this example, the QLCS was at a lull in severe development after having produced numerous tornadoes in western Mississippi, with no ongoing tornadoes when compared to the first example. We view lightning from a different perspective via cross sections through a portion of the QLCS in this example (Figure 6). There is large variation in the amount of lightning each network is detecting. Similar to Example 1, the LMA detects nearly triple all other networks at this time (maximum flash rate of ∼400 flashes per five minutes), with ENTLN having the second-highest flash rates (∼130 flashes per five minutes). GLM has decreased detection compared to other networks, with values less than half of ENTLN and even further from LMA flash rates (∼65 flashes per five minutes). NLDN also has lower flash rates (∼85 flashes per five minutes), which differs from Example 1, where NLDN and ENTLN were more aligned. Although flash rates were lower across networks, the percentage of flashes with an LMA match was higher than the overall average for the QLCS, with 84.6% of ENTLN flashes, 84.4% of NLDN flashes, and 91.9% of GLM flashes having a corresponding LMA match. This differs from Example 1, where matching was substantially lower than the QLCS average. Thus, Example 1 had more variation in the unique flash processes being detected by each network, whereas Example 2 has a larger variation in the amount of lightning detected by each individual network, but the processes that were detected were more aligned.
Looking at the flash characteristics, most flashes occur in a narrow area in distance and altitude (between 5–10 km ). Compared to Example 1, the altitudes are on average higher in this example (8 km versus 5–6 km). The flash rates also peak just to the east of the reflectivity peak. A decent proportion of the LMA flashes are small (<10 km 2 ), and nearly half of the GLM flashes are relatively small (<200 km 2 ). Similar to Example 1, ENTLN shows that the majority of flashes are IC, and NLDN flash types are in agreement. Looking at amplitude, the majority of flashes are low-current events (<15 kA ), which supports both NLDN and GLM not recording these flashes.
The combination of small IC flashes occurring in a small region co-located with enhanced reflectivity is a recipe for decreased GLM DE. GLM detects optical emission from space, so higher-current, larger flashes that occur higher in altitude are more likely to emit enough light to escape cloud top and be luminous enough to overcome the GLM background threshold. GLM struggles to detect short-duration ICs [16] and flashes occurring within strong reflectivity cores [72], which cause more scattering and absorption of light as it travels to cloud top [15]. The relatively high flash rates (over 300 flashes per 5 min) occurring in a compact area could be another ingredient in the decreased GLM DE at this time. Numerous flashes occurring close in distance and time can be combined into one flash for GLM, thus decreasing flash rates [73]. Similar to GLM, NLDN is not geared towards detecting small-amplitude ICs, and this pattern of higher reflectivity aloft appears to be often associated with decreased DE of flashes for NLDN throughout our analysis. Larger reflectivity values aloft imply a vigorous updraft lofting hydrometeors and formation of small pockets of charge supporting small but numerous ICs [22].

3.1.3. Example 3: 22 March 2022, 2150 UTC

Similar to Example 2, 2150 UTC was a time during the QLCS in between the most intense severe weather producing periods, with no ongoing tornadoes in the study area at this time. Compared to Example 2, the QLCS was weaker at this time, with lower maximum reflectivity values. Flash rates across networks are much more in-line with one another than in Example 2, although they do not match perfectly, which is expected due to differences in flash detection and sorting methods between sensors. The LMA has a maximum flash rate of ∼120 flashes per five minutes, with GLM having the second-highest maximum flash rate of ∼65, followed by ENTLN (∼54) and NLDN (∼42). The percentage of flashes that had an LMA match in each network were 97.7% for GLM, 98.1% for ENTLN, and 98.2% for NLDN, most closely matching the right region in Example 1.
In this example, high reflectivity values do not extend as high in altitude compared to Example 2 (Figure 7). LMA flash sizes are predominantly >10 km 2 and span a large array of initiation altitudes (3–11 km). Flash peaks are also more in-line with the reflectivity core compared to the prior example time. The majority of GLM flashes are also large (>200 km 2 ), the opposite of Example 2. ENTLN flashes contain a large percentage of CGs, and the CG peak lags behind (to the west of) the IC peak. NLDN has a smaller proportion of CGs than ENTLN, but matches the pattern of the CG peak occurring to the west of the IC peak.
Overall, larger, more dispersed flashes with a larger percentage of CGs in the ENTLN data occurred at this time when compared to the first two examples, indicating higher-current flashes, which are better detected by GLM, NLDN, and ENTLN. Having the higher reflectivity values confined to lower levels also aids in the ability of optical emission to reach cloud top and not be as greatly scattered or absorbed while traveling through the cloud. This is especially true since the lightning is primarily occurring above the reflectivity core, and the direction light is brightest will favor the direction of greatest mean free path and lesser concentration [15].

4. Discussion and Conclusions

This study compared four lightning networks to determine the differences in the lightning detected by each during QLCSs and to showcase the unique information provided by each network to produce more complete information about the lightning than one network could provide alone. Through this analysis, the following results were found:
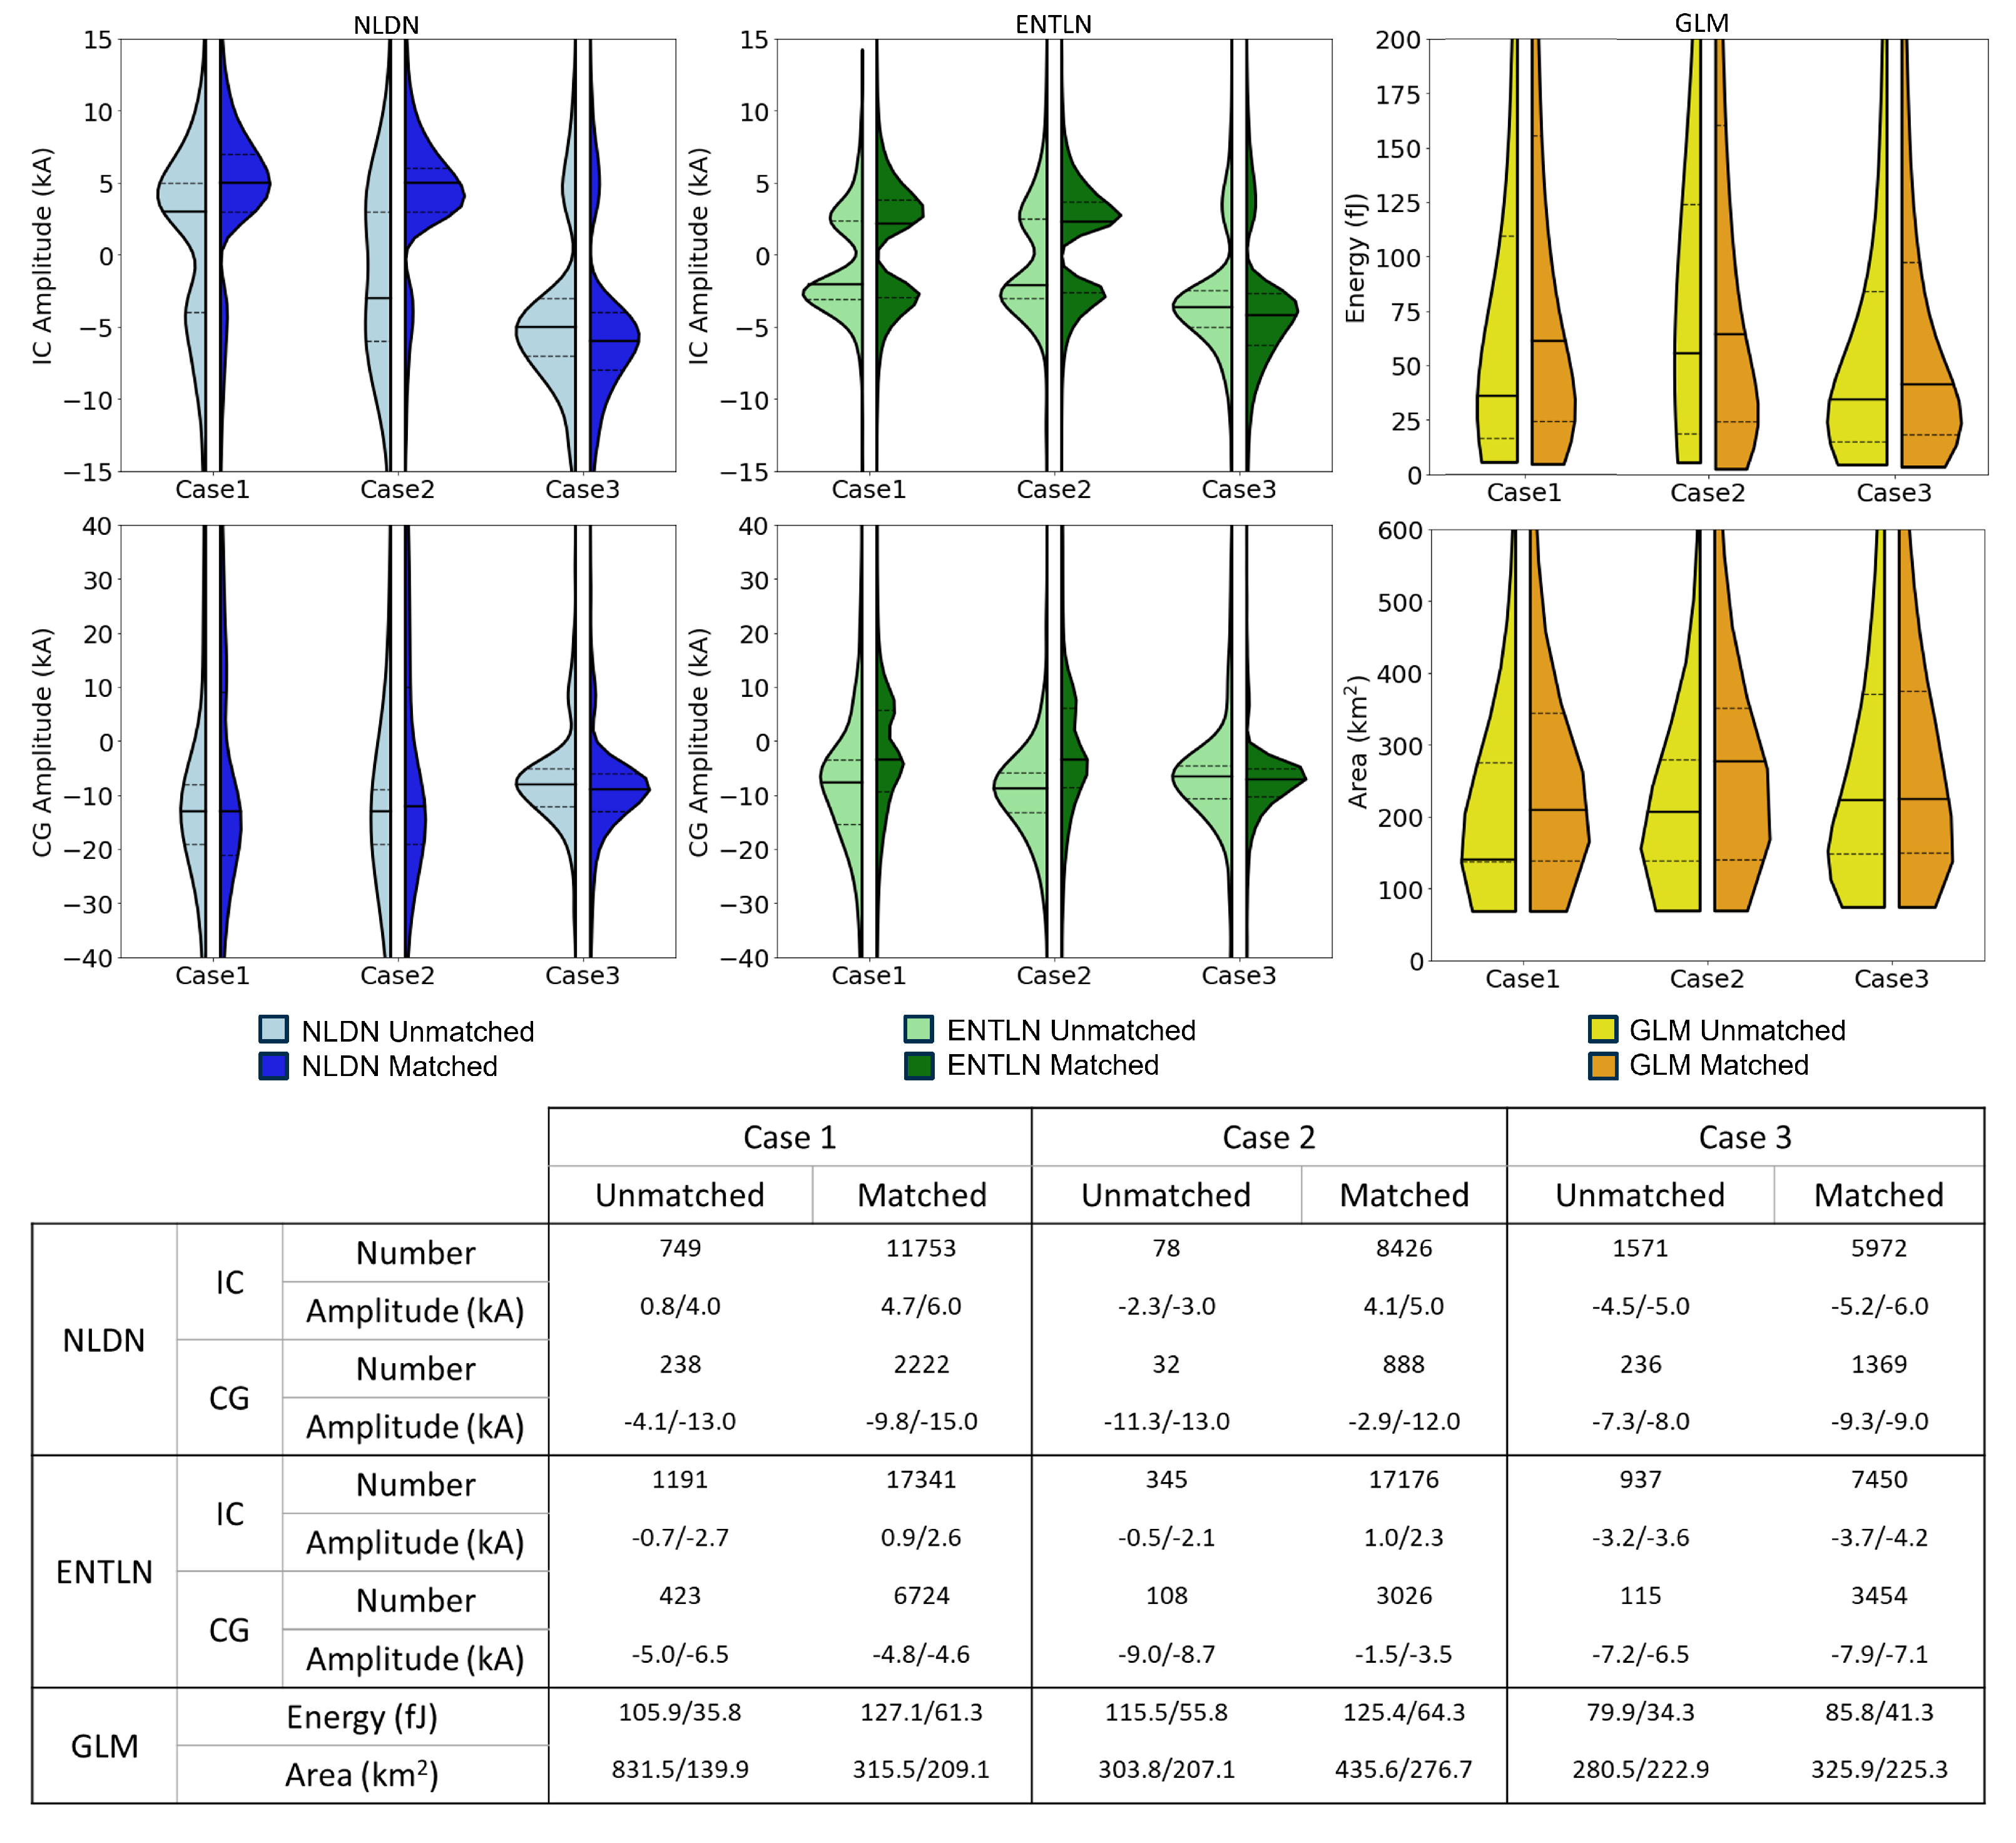
  • Lightning flash trends and characteristics for each case were similar between networks in general, but deviated in certain conditions and locations: Overall matching between networks showed moderate overlap in the matching of flashes between networks, with the highest matching between ENTLN and NLDN, which suggests ENTLN and NLDN are detecting the same processes (current flowing in the leader). It was also found that GLM is the most likely to detect the same processes as the LMA out of the networks analyzed. This is most likely in part due to small IC processes occurring high in altitude being detected by the GLM. However, the fact that GLM had higher matching to LMA than to ENTLN or NLDN is counter-intuitive, since processes involving current flow would be expected to produce optical emission more prominently than leader tip processes detected by the LMA. The path and strength of optical emission from lightning in a cloud is a complicated problem involving the channel location and shape in the cloud, the strength of the flash current, as well as the microphysical makeup of the cloud. Additionally, a high matching fraction could happen with a very low DE, where GLM would only be detecting the brightest things, i.e., the most likely to match. Conversely, a low matching fraction could indicate a high FAR, or it could indicate a network is locating lightning that the LMA does not.
    Variations in charge structure are expected across a QLCS [21], so it follows that flash rates and characteristics would also differ. Case 1 had the highest LMA altitudes on average (8.4 km), followed by Case 2 (7.7 km), with the lowest for Case 3 (6.1 km). This matches the lower SBCAPE values present in Case 3 causing less-vigorous updrafts, lower EL heights, and a lower region of charge in altitude. LMA and GLM flash sizes were smallest for Case 1 and largest for Case 3. However, GLM flash energy values were lowest for Case 3. The smaller GLM flash energies and lack of small footprints for Case 3 are likely due to a combination of off-nadir viewing angle causing less-energetic pixels to drop off, which would decrease the overall flash energies and increase the lower bound of flash footprints [56]. Additionally, flashes initiating on average lower in the cloud in Case 3 will cause less light to escape cloud top [74].
    For Cases 1 and 2, the -ICs ENTLN detects are not present in NLDN. Potentially, one of the network algorithms could be mis-classifying the IC polarity, but it is hard to determine if this is the case. -IC flashes are typically less common than +ICs due to the most common charge structure supporting propagation of IC leaders upward from negative charge to the upper positive [75], so the large portion of -ICs in the ENTLN data is curious. Additionally, the amplitude is on average smaller for ENTLN when compared to NLDN across all cases. NLDN and ENTLN agreed the most during Case 3, with both detecting predominantly negative flashes, both CG and IC. This varies from typical anomalous storms, where +CGs often dominate. The charge structure in Case 3 stays confined to lower altitudes and has a dipolar structure, similar to the initial anomalous charge structure observed in [76]. SBCAPE and EL were low for this case (<300 J/kg and 8.6 km, respectively), so charged hydrometeors were not lofted as high as other cases. In general, the change from +ICs to -ICs in both NLDN and ENTLN could potentially be used as a signal for anomalous charge structure, but more cases would need to be analyzed to confirm this hypothesis. Just as +CGs are often more common in anomalous storms, it follows that -ICs would also be more common. This signature has been shown in a recent study to be present in several anomalous storms [77]. Additionally, -ICs are higher amplitude for Case 3, while -CGs are smaller amplitude. Overall, the differences in each network’s performance across the three cases demonstrates the importance of understanding limitations in each and the advantage of using multiple networks.
  • Flash rates among networks were more likely to align in areas of lower flash rates, larger flashes, more dispersed in location, and fewer ICs: This finding corroborates past research showing that larger flashes and CGs were better aligned between LMA and GLM [16]. Time periods with higher flash rates cause more variability in flash sorting algorithms than less prolific flash rates, since numerous flashes occurring close in time may be sorted into one flash in some networks and multiple flashes in others [73]. Areas with lower flash rates are often associated with lower reflectivity values, which implies fewer hydrometeors are present to scatter or absorb light, making detection easier for GLM specifically. Additionally, these stratiform areas can produce larger, higher-current flashes, which are well-detected by ENTLN, NLDN, and GLM.
    Smaller flashes, on the other hand, are usually less energetic and thus may not be detected by all networks. ICs are typically smaller and make up a large portion of flashes during times of high flash rates. Turbulent eddies caused by strong updrafts create pockets of charge that support smaller, more numerous flashes and more ICs [22]. These small IC flashes often have decreased detection by ENTLN, NLDN, and GLM. Thus, times of the most severe weather will often have the most variety in lightning network performance.
This study ultimately provides inter-comparison of four different lightning networks, how they vary with QLCSs, and theories and discussion of why these variations may occur. In this study, we have shown that the networks do have differences and that some of these differences appear to be related to properties of both the lightning and the storms themselves. We postulate that it should therefore be possible to leverage these differences to improve near-term storm behavior prediction. Overall, more cases will need to be analyzed to see if the trends found in this study hold true. These results provide motivation for further study of lightning network merging and performance in different events, regions, and meteorological processes.

Author Contributions

Conceptualization, J.R., V.C. and K.C.; methodology, J.R. and V.C.; formal analysis, J.R.; investigation, J.R.; writing—original draft preparation, J.R., V.C. and K.C.; writing—review and editing, J.R., V.C. and K.C. All authors have read and agreed to the published version of the manuscript.

Funding

Funding was provided by NOAA/Office of Oceanic and Atmospheric Research under NOAA–University of Oklahoma Cooperative Agreement NA21OAR4320204, U.S. Department of Commerce.

Institutional Review Board Statement

Not applicable.

Informed Consent Statement

Not applicable.

Data Availability Statement

Mobile LMA data are available through the published dataset: https://doi.org/10.26023/R0K6-AXR5-YZ00, and OKLMA data through: https://doi.org/10.15763/DBS.OKLMA. ENTLN data were provided by Earth Networks and can be acquired by contacting Earth Networks: https://get.earthnetworks.com/contactus. GOES-16 GLM data for this study were obtained through the Comprehensive Large Array-Data Stewardship System (CLASS): https://www.avl.class.noaa.gov/. NLDN data were provided by Vaisala and can be requested by contacting Vaisala: https://www.vaisala.com/en/lp/request-vaisala-lightning-data-research-use. HRRR data are available for download through AWS: https://registry.opendata.aws/noaa-hrrr-pds/.

Acknowledgments

The authors wish to thank all the scientists who helped in data collection during the PERiLS field campaign.

Conflicts of Interest

The authors declare no conflicts of interest.

Abbreviations

The following abbreviations are used in this manuscript:
QLCSQuasi-Linear Convective System
LMALightning Mapping Array
GLMGeostationary Lightning Mapper
ENTLNEarth Networks Total Lightning Network
NLDNNational Lightning Detection Network
ICIntra-Cloud
CGCloud-to-Ground
CAPEConvective Available Potential Energy
SRHStorm Relative Helicity
ELEquilibrium Level

References

  1. Cummins, K.L.; Murphy, M.J. An Overview of Lightning Locating Systems: History, Techniques, and Data Uses, With an In-Depth Look at the U.S. NLDN. IEEE Trans. Electromagn. Compat. 2009, 51, 499–518. [Google Scholar] [CrossRef]
  2. Rison, W.; Thomas, R.J.; Krehbiel, P.R.; Hamlin, T.; Harlin, J. A GPS-based three-dimensional lightning mapping system: Initial observations in central New Mexico. Geophys. Res. Lett. 1999, 26, 3573–3576. [Google Scholar] [CrossRef]
  3. Thomas, R.J.; Krehbiel, P.R.; Rison, W.; Hunyady, S.J.; Winn, W.P.; Hamlin, T.; Harlin, J. Accuracy of the Lightning Mapping Array. J. Geophys. Res. Atmos. 2004, 109, D14207. [Google Scholar] [CrossRef]
  4. Koshak, W.J.; Solakiewicz, R.J.; Blakeslee, R.J.; Goodman, S.J.; Christian, H.J.; Hall, J.M.; Bailey, J.C.; Krider, E.P.; Bateman, M.G.; Boccippio, D.J.; et al. North Alabama Lightning Mapping Array (LMA): VHF Source Retrieval Algorithm and Error Analyses. JAOT 2004, 21, 543–558. [Google Scholar] [CrossRef]
  5. Chmielewski, V.C.; Bruning, E.C. Lightning Mapping Array flash detection performance with variable receiver thresholds. J. Geophys. Res. Atmos. 2016, 121, 8600–8614. [Google Scholar] [CrossRef] [PubMed]
  6. Murphy, M.; Cramer, J.; Said, R. A Recent History of Upgrades to the U.S. National Lightning Detection Network. J. Atmos. Ocean. Technol. 2021, 38, 573–585. [Google Scholar] [CrossRef]
  7. Zhu, Y.; Stock, M.; Lapierre, J.; DiGangi, E. Upgrades of the Earth Networks Total Lightning Network in 2021. Remote Sens. 2022, 14, 2209. [Google Scholar] [CrossRef]
  8. Zhu, Y.; Rakov, V.A.; Tran, M.D.; Stock, M.G.; Heckman, S.; Liu, C.; Sloop, C.D.; Jordan, D.M.; Uman, M.A.; Caicedo, J.A.; et al. Evaluation of ENTLN performance characteristics based on the ground-truth natural and rocket-triggered lightning data acquired in Florida. J. Geophys. Res. Atmos. 2017, 122, 9858–9866. [Google Scholar] [CrossRef]
  9. Zhu, Y.; Rakov, V.A.; Tran, M.D.; Nag, A. A study of National Lightning Detection Network responses to natural lightning based on ground truth data acquired at LOG with emphasis on cloud discharge activity. J. Geophys. Res. Atmos. 2016, 121, 14651–14660. [Google Scholar] [CrossRef]
  10. Goodman, S.J.; Blakeslee, R.J.; Koshak, W.J.; Mach, D.; Bailey, J.; Buechler, D.; Carey, L.; Schultz, C.; Bateman, M.; McCaul, E., Jr.; et al. The GOES-R Geostationary Lightning Mapper (GLM). El Sevier 2013, 125-126, 34–49. [Google Scholar]
  11. Ringhausen, J.S.; Bitzer, P.M. An In-Depth Analysis of Lightning Trends in Hurricane Harvey Using Satellite and Ground-Based Measurements. J. Geophys. Res. Atmos. 2021, 126, e2020JD032859. [Google Scholar] [CrossRef]
  12. Koshak, W.; Peterson, H.; Biazar, A.; Khan, M.; Wang, L. The NASA Lightning Nitrogen Oxides Model (LNOM): Application to air quality modeling. Atmos. Res. 2014, 135–136, 363–369. [Google Scholar] [CrossRef]
  13. Peterson, M.; Light, T.E.L.; Mach, D. The illumination of thunderclouds by lightning: 3. Retrieving optical source altitude. Earth Space Sci. 2021, 9, e2021EA001944. [Google Scholar] [CrossRef] [PubMed]
  14. Fuchs, B.R.; Rutledge, S.A.; Dolan, B.; Carey, L.D.; Schultz, C. Microphysical and Kinematic Processes Associated With Anomalous Charge Structures in Isolated Convection. J. Geophys. Res. Atmos. 2018, 123, 6505–6528. [Google Scholar] [CrossRef] [PubMed]
  15. Brunner, K.N.; Bitzer, P.M. A First Look at Cloud Inhomogeneity and Its Effect on Lightning Optical Emission. Geophys. Res. Lett. 2020, 47, e2020GL087094. [Google Scholar] [CrossRef]
  16. Zhang, D.; Cummins, K.L. Time Evolution of Satellite-Based Optical Properties in Lightning Flashes, and its Impact on GLM Flash Detection. J. Geophys. Res. Atmos. 2020, 125, e2019JD032024. [Google Scholar] [CrossRef]
  17. Lang, T.J.; Ávila, E.E.; Blakeslee, R.J.; Burchfield, J.; Wingo, M.; Bitzer, P.M.; Carey, L.D.; Deierling, W.; Goodman, S.J.; Medina, B.L.; et al. The RELAMPAGO Lightning Mapping Array: Overview and Initial Comparison with the Geostationary Lightning Mapper. J. Atmos. Ocean. Technol. 2020, 37, 1457–1475. [Google Scholar] [CrossRef]
  18. Rutledge, S.A.; Hilburn, K.A.; Clayton, A.; Fuchs, B.; Miller, S.D. Evaluating Geostationary Lightning Mapper Flash Rates Within Intense Convective Storms. J. Geophys. Res. Atmos. 2020, 125, e2020JD032827. [Google Scholar] [CrossRef]
  19. Mecikalski, R.M.; Bitzer, P.M.; Carey, L.D. Why Flash Type Matters: A Statistical Analysis. Geophys. Res. Lett. 2017, 44, 9505–9512. [Google Scholar] [CrossRef]
  20. Ringhausen, J.S.; Bitzer, P.M.; Koshak, W.J.; Mecikalski, J. Classification of GLM Flashes Using Random Forests. Earth Space Sci. 2021, 8, e2021EA001861. [Google Scholar] [CrossRef]
  21. Stolzenburg, M.; Rust, W.D.; Smull, B.F.; Marshall, T.C. Electrical structure in thunderstorm convective regions: 1. Mesoscale convective systems. J. Geophys. Res. 1998, 103, 14059–14078. [Google Scholar] [CrossRef]
  22. Bruning, E.C.; MacGorman, D.R. Theory and Observations of Controls on Lightning Flash Size Spectra. J. Atmos. Sci. 2013, 70, 4012–4029. [Google Scholar] [CrossRef]
  23. Calhoun, K.M.; MacGorman, D.R.; Dowell, D.C. Numerical Simulations of Lightning and Storm Charge of the 29–30 May 2004 Geary, Oklahoma, Supercell Thunderstorm Using EnKF Mobile Radar Data Assimilation. Monthly Weather. Rev. 2014, 142, 3977–3997. [Google Scholar] [CrossRef]
  24. Brothers, M.D. Investigating the Relative Contribution of Charge Deposition in Organizing Charge within a Thunderstorm; American Meteorological Society: Boston, MA, USA, 2017. [Google Scholar]
  25. Takahashi, T. Riming Electrification as a Charge Generation Mechanism in Thunderstorms. J. Atmos. Sci. 1978, 35, 1536–1548. [Google Scholar] [CrossRef]
  26. Saunders, C.P.R. Thunderstorm electrification laboratory experiments and charging mechanisms. J. Geophys. Res. Atmos. 1994, 99, 10773–10779. [Google Scholar] [CrossRef]
  27. Deierling, W.; Peterson, W.A. Total lightning activity as an indicator of updraft characteristics. J. Geophys. Res. Atmos. 2008, 113, D16210. [Google Scholar] [CrossRef]
  28. Carey, L.D.; Rutledge, S.A. The Relationship between Precipitation and Lightning in Tropical Island Convection: A C-Band Polarimetric Radar Study. Mon. Weather. Rev. 2000, 128, 2687–2710. [Google Scholar] [CrossRef]
  29. Liu, C.; Cecil, D.J.; Zipser, E.J.; Kronfeld, K.; Roberston, R. Relationships between lightning flash rates and radar reflectivity vertical structures in thunderstorms over the Tropics and Subtropics. J. Geophys. Res. Atmos. 2012, 117, D06212. [Google Scholar] [CrossRef]
  30. Carey, L.D.; Schultz, E.V.; Schultz, C.J.; Deierling, W.; Peterson, W.A.; Bain, A.L.; Pickering, K.E. An Evaluation of Relationships between Radar-Inferred Kinematic and Microphysical Parameters and Lightning Flash Rates in Alabama Storms. Atmosphere 2019, 10, 796. [Google Scholar] [CrossRef]
  31. Basarab, B.M.; Rutledge, S.A.; Fuchs, B.R. An improved lightning flash rate parameterization developed from Colorado DC3 thunderstorm data for use in cloud-resolving chemical transport models. J. Geophys. Res. Atmos. 2015, 120, 9481–9499. [Google Scholar] [CrossRef]
  32. Calhoun, K.M.; MacGorman, D.R.; Ziegler, C.L.; Biggerstaff, M.I. Evolution of Lightning Activity and Storm Charge Relative to Dual-Doppler Analysis of a High-Precipitation Supercell Storm. Monthly Weather. Rev. 2013, 141, 2199–2223. [Google Scholar] [CrossRef]
  33. Montanyà, J.; López, J.A.; Rodriguez, C.A.M.; van der Velde, O.A.; Fabró, F.; Pineda, N.; Navarro-González, J.; Reglero, V.; Neubert, T.; Chanrion, O.; et al. A simultaneous observation of lightning by ASIM, Colombia-Lightning Mapping Array, GLM, and ISS-LIS. J. Geophys. Res. Atmos. 2021, 126, e2020JD033735. [Google Scholar] [CrossRef]
  34. Gatlin, P.N.; Goodman, S.J. A Total Lightning Trending Algorithm to Identify Severe Thunderstorms. J. Atmos. Ocean. Technol. 2010, 27, 3–22. [Google Scholar] [CrossRef]
  35. Schultz, C.J.; Petersen, W.A.; Carey, L.D. Preliminary Development and Evaluation of Lightning Jump Algorithms for the Real-Time Detection of Severe Weather. J. Appl. Meteorol. Climatol. 2009, 48, 2543–2563. [Google Scholar] [CrossRef]
  36. Schultz, C.J.; Carey, L.D.; Schultz, E.V.; Blakeslee, R.J. Insight into the Kinematic and Microphysical Processes that Control Lightning Jumps. Weather. Forecast. 2015, 30, 1591–1621. [Google Scholar] [CrossRef]
  37. Williams, E.R.; Boldi, B.; Matlin, A.; Weber, M.; Hodanish, S.; Sharp, D.; Goodman, S.; Raghavan, R.; Buechler, D. The behavior of total lightning activity in severe Florida thunderstorms. Atmos. Res. 1999, 51, 245–265. [Google Scholar] [CrossRef]
  38. Schultz, C.J.; Petersen, W.A.; Carey, L.D. Lightning and Severe Weather: A Comparison between Total and Cloud-to-Ground Lightning Trends. Weather. Forecast. 2011, 26, 744–755. [Google Scholar] [CrossRef]
  39. Williams, B.M.; Carey, L. Characteristics of Total Lightning within Tornadic vs. Non-tornadic QLCSs. In In Proceedings of the 95th American Meteorological Society Annual Meeting, Phoenix, AZ, USA, 4–8 January 2015. [Google Scholar]
  40. Stough, S.M.; Carey, L.D.; Schultz, C.J.; Bitzer, P.M. Investigating the Relationship between Lightning and Mesocyclonic Rotation in Supercell Thunderstorms. Weather. Forecast. 2017, 32, 2237–2259. [Google Scholar] [CrossRef]
  41. Schultz, C.; Carey, L.D.; Schultz, E.V.; Blakeslee, R.J. Kinematic and microphysical significance of lightning jumps versus nonjump increases in total flash rate. Weather. Forecast. 2017, 32, 275–288. [Google Scholar] [CrossRef] [PubMed]
  42. Curtis, N.; Carey, L.; Schultz, C. An Analysis of the Lightning Jump Algorithm Using Geostationary Lightning Mapper Flashes. In Proceedings of the International Lightning Detection Conference (ILDC 2018), Fort Lauderdale, FL, USA, 12–15 March 2018. [Google Scholar]
  43. Murphy, M.J. Preliminary results from the inclusion of lightning type and polarity in the identification of severe storms. In Proceedings of the 97th Annual Meeting of the American Meteorological Society, Seattle, WA, USA, 22–26 January 2017. [Google Scholar]
  44. Murphy, M.J.; Said, R.K. Comparisons of Lightning Rates and Properties From the U.S. National Lightning Detection Network (NLDN) and GLD360 With GOES-16 Geostationary Lightning Mapper and Advanced Baseline Imager Data. J. Geophys. Res. Atmos. 2020, 125, e2019JD031172. [Google Scholar] [CrossRef]
  45. Kosiba, K. The Propagation Evolution Rotation in Linear System (PERiLS) Project. Bull. Amer. Meteor. Soc. 2023. [Google Scholar]
  46. Fuchs, B.R.; Bruning, E.C.; Rutledge, S.A.; Carey, L.D.; Krehbiel, P.R.; Rison, W. Climatological analyses of LMA data with an open-source lightning flash-clustering algorithm. J. Geophys. Res. Atmos. 2016, 121, 8625–8648. [Google Scholar] [CrossRef]
  47. Carey, L.D.; Murphy, M.J.; McCormick, T.L.; Demetriades, N.W.S. Lightning location relative to storm structure in a leading-line, trailing-stratiform mesoscale convective system. J. Geophys. Res. Atmos. 2005, 110, D03105. [Google Scholar] [CrossRef]
  48. Orville, R.E.; Henderson, R.W. Absolute Spectral Irradiance Measurements of Lightning from 375 to 880 nm. J. Atmos. Sci. 1984, 41, 3180–3187. [Google Scholar] [CrossRef]
  49. Goodman, S.J.; Christian, H.J.; Rust, D. A Comparison of the optical pulse characteristics of intracloud and cloud-to-ground lightning as observed above clouds. J. Appl. Meteorol. 1988, 27, 1369–1381. [Google Scholar] [CrossRef]
  50. Christian, H.J.; Blakeslee, R.J.; Goodman, S.J. Lightning Imaging Sensor (LIS) for the Earth Observing System. In NASA Technical Memorandum; NASA: Washington, DC, USA, 1992. [Google Scholar]
  51. Walker, T.; Hill, J.; Jordan, D.; Uman, M.; Christian, H. Physical Characteristics of Triggered Lightning Determined by Optical Spectroscopy; American Geophyiscal Union: Washington, DC, USA, 2010. [Google Scholar]
  52. Edgington, S.; Tillier, C.; Anderson, M. Design, calibration, and on-orbit testing of the geostationary lightning mapper on the GOES-R series weather satellite. In Proceedings of the International Conference on Space Optics—ICSO 2018, Chania, Greece, 9–12 October 2018; Sodnik, Z., Karafolas, N., Cugny, B., Eds.; International Society for Optics and Photonics, SPIE: Washington, DC, USA, 2019; Volume 11180, pp. 1480–1494. [Google Scholar] [CrossRef]
  53. Peterson, M. Research Applications for the Geostationary Lightning Mapper Operational Lightning Flash Data Product. J. Geophys. Res. Atmos. 2019, 124, 10205–10231. [Google Scholar] [CrossRef]
  54. Bateman, M.; Mach, D.; Stock, M. Further Investigation Into Detection Efficiency and False Alarm Rate for the Geostationary Lightning Mappers Aboard GOES-16 and GOES-17. Earth Space Sci. 2021, 8, e2020EA001237. [Google Scholar] [CrossRef]
  55. Koshak, W.; Mach, D.; Bateman, M.; Armstrong, P.; Virts, K. GOES-16 GLM Level 2 Data Full Validation Data Quality; NASA: Washington, DC, USA, 2018. [Google Scholar]
  56. Cummins, K.L. On the spatial and temporal variation of GLM flash detection and how to manage it. In Proceedings of the 10th Conference on the Meteorological Application of Lightning Data, 101st Annual Meeting of the American Meteorological Society, 101st Annual Meeting of the American Meteorological Society, Virtual, 10–15 January 2021. [Google Scholar]
  57. Liu, C.; Sloop, C.; Heckman, S. Application of Lightning in Predicting High Impact Weather; Earth Networks, Inc.: Germantown, MD, USA, 2014. [Google Scholar]
  58. Bitzer, P.M.; Burchfield, J.C.; Christian, H.J. A Bayesian Approach to Assess the Performance of Lightning Detection Systems. J. Atmos. Ocean. Technol. 2016, 33, 563–578. [Google Scholar] [CrossRef]
  59. Rudlosky, S. Evaluating Ground-Based Lightning Detection Networks using TRMM/LIS Observations. In Proceedings of the 23rd International Lightning Detection Conference & 5th International Lightning Meteorology Conference, Tucson, AZ, USA, 18–21 March 2014. [Google Scholar]
  60. Biagi, C.J.; Cummins, K.L.; Kehoe, K.E.; Krider, E.P. National Lightning Detection Network (NLDN) performance in southern Arizona, Texas, and Oklahoma in 2003–2004. J. Geophys. Res. Atmos. 2007, 112, D05208. [Google Scholar] [CrossRef]
  61. Mallick, S.; Rakov, V.A.; Ngin, T.; Gamerota, W.R.; Pilkey, J.T.; Hill, J.D.; Uman, M.A.; Jordan, D.M.; Heckman, S.; Sloop, C.D.; et al. An Update on Testing the Performance Characteristics of the ENTLN. In Proceedings of the International Conference on Atmospheric Electricity, Norman, OK, USA, 9–13 June 2014. [Google Scholar]
  62. Virts, K.; Koshak, W.J. Monte Carlo Simulations for Evaluating the Accuracy of Geostationary Lightning Mapper Detection Efficiency and False Alarm Rate Retrievals. J. Atmopsheric Ocean. Technol. 2023, 40, 219–235. [Google Scholar] [CrossRef]
  63. Zhang, D.; Cummins, K.; Nag, A.; Murphy, M.; Bitzer, P. Evaluation of the National Lightning Detection Network Upgrade Using the Lightning Imaging Sensor. In Proceedings of the International Lightning Detection Conference, Estoril, Portugal, 25–30 September 2016. [Google Scholar]
  64. Bitzer, P.M.; Burchfield, J.C. Bayesian techniques to analyze and merge lightning locating system data. Geophys. Res. Lett. 2016, 43, 12–605. [Google Scholar] [CrossRef]
  65. Marchand, M.; Hilburn, K.; Miller, S.D. Geostationary Lightning Mapper and Earth Networks Lightning Detection Over the Contiguous United States and Dependence on Flash Characteristics. J. Geophys. Res. Atmos. 2019, 124, 11552–11567. [Google Scholar] [CrossRef]
  66. Bruning, E.C.; Weiss, S.A.; Calhoun, K.M. Continuous variability in thunderstorm primary electrification and an evaluation of inverted-polarity terminology. Atmos. Res. 2014, 135–136, 274–284. [Google Scholar] [CrossRef]
  67. Lapierre, J.L.; Sonnenfeld, R.G.; Stock, M.; Krehbiel, P.R.; Edens, H.E.; Jensen, D. Expanding on the relationship between continuing current and in-cloud leader growth. J. Geophys. Res. Atmos. 2017, 122, 4150–4164. [Google Scholar] [CrossRef]
  68. Carey, L.D.; Buffalo, K.M. Environmental Control of Cloud-to-Ground Lightning Polarity in Severe Storms. Mon. Weather. Rev. 2007, 135, 1327–1353. [Google Scholar] [CrossRef]
  69. Lang, T.J.; Rutledge, S.A.; Wiens, K.C. Origins of positive cloud-to-ground lightning flashes in the stratiform region of a mesoscale convective system. Geophys. Res. Lett. 2004, 31, L10105. [Google Scholar] [CrossRef]
  70. MacGorman, D.R.; Burgess, D.W. Positive Cloud-to-Ground Lightning in Tornadic Storms and Hailstorms. Mon. Weather. Rev. 1994, 122, 1671–1697. [Google Scholar] [CrossRef]
  71. Wiens, K.C. Kinematic, Microphysical, and Electrical Structure and Evolution of Thunderstorms during the Severe Thunderstorm Electrification and Precipitation Study (STEPS). Ph.D. Thesis, Colorado State University, Fort Collins, CO, USA, 2005. [Google Scholar]
  72. Rudlosky, S.D.; Virts, K.S. Dual Geostationary Lightning Mapper Observations. Mon. Weather. Rev. 2021, 149, 979–998. [Google Scholar] [CrossRef]
  73. Mach, D.M. Geostationary Lightning Mapper Clustering Algorithm Stability. J. Geophys. Res. Atmos. 2020, 125, e2019JD031900. [Google Scholar] [CrossRef]
  74. Franklin, V.M. An Evaluation of the Lightning Imaging Sensor with New Insights on the Discrimination of Lightning Flash and Stroke Detectability. Master’s Thesis, University of Alabama in Huntsville, Huntsville, AL, USA, 2013. [Google Scholar]
  75. Wu, T.; Yoshida, S.; Akiyama, Y.; Stock, M.; Ushio, T.; Kawasaki, Z. Preliminary breakdown of intracloud lightning: Initiation altitude, propagation speed, pulse train characteristics, and step length estimation. J. Geophys. Res. Atmos. 2015, 120, 9071–9086. [Google Scholar] [CrossRef]
  76. Stough, S.M.; Carey, L.D.; Schultz, C.J.; Cecil, D.J. Supercell Thunderstorm Charge Structure Variability and Influences on Spatial Lightning Flash Relationships with the Updraft. Montly Weather. Rev. 2022, 150, 843–861. [Google Scholar] [CrossRef]
  77. DiGangi, E.; Lapierre, J.; Zhu, Y.; Stock, M. Investigating Storm Charge Distribution Trends with Intracloud Lightning Polarity Data. In Proceedings of the International Lightning Detection Conference, Langkawi, Kedah, Malaysia, 12–15 June 2023. [Google Scholar]
Figure 1. Example of a lightning flash composed of LMA sources (red circle), ENTLN pulses (green diamond), NLDN strokes (blue square), and GLM groups (orange triangle). Grey points indicate unmatched pulses, while colored points indicate matched. This example consists of 2 s of data at 1855 UTC from Case 1.
Atmosphere 15 00309 g001
Figure 2. Spatial plot showing LMA sensor locations (blue dots), flash detection efficiency determined using the methods of [5], and radar examples for Case 1 (left), Case 2 (middle), and Case 3 (right). Black circle indicates 100 km range from LMA network center used in matching analysis.
Atmosphere 15 00309 g002
Figure 3. Characteristics of the LMA flashes that were matched to ENTLN (green), GLM (yellow), NLDN (blue), and unmatched LMA flashes (grey) including initiation height (top) and flash area (bottom) for Case 1 (left), Case 2 (middle), and Case 3 (right). Mean/median values for each network and case are also shown below. In violin plot, black solid line is the median, and dotted lines are the 25th and 75th percentiles.
Atmosphere 15 00309 g003
Figure 4. Characteristics of unmatched (left lighter colors) and matched (right darker colors) flashes to LMA for IC and CG amplitudes of ENTLN (green) and NLDN (blue); GLM (yellow) energies and footprints for Case 1, Case 2, and Case 3. Mean/median values for each network and case are shown in the table below. In violin plot, the black solid line is the median, and dotted lines are the 25th and 75th percentiles.
Atmosphere 15 00309 g004
Figure 5. Example of a time where lightning networks differ. Time of example is 0315 UTC on 27 February 2023. Contoured percentages of flashes matched for each network (left) and violin plots (right) of flash characteristics unique to each network comparing the right and left region where matching between networks differed for each network are shown. Flash totals for each region are also displayed in the upper-left of the spatial plots.
Atmosphere 15 00309 g005
Figure 6. Example of a time where lightning networks differ. Time of example is 1900 UTC on 22 March 2022. Contoured flash rates for each network (left) and cross sections through the QLCS (middle) for each network are shown, as well as the overall location of the cross sections in the QLCS (right).
Atmosphere 15 00309 g006
Figure 7. Same as Figure 6, but an example of a time where lightning networks match well. Time of example is 2150 UTC on 22 March 2022.
Atmosphere 15 00309 g007
Table 1. Table showing the dates, times, and locations for each of the three cases of interest.
Case 1Case 2Case 3
Date22 March 202230 March–31 March 202227 February 2023
Time1800–2359 UTC2100–0300 UTC0100–0400 UTC
LocationMississippi/AlabamaMississippi/AlabamaOklahoma
Network Center (Lat, Lon)33.125, −88.26833.632, −88.66035.271, −97.818
Table 2. Results of matching between networks for all three cases. Columns are the amount of the network that matched, while rows are the network being matched to. For example, in Case 1, 18,395 ENTLN flashes out of 25,254 total ENTLN flashes had a matching LMA detection. Total flashes for each network and case are also shown.
LMA ENTLN GLM NLDN
L M A Case 118,395 (72.8%)15,670 (88.3%)13,760 (72.2%)
Case 216,415 (79.3%)15,201 (84.3%)10,360 (78.3%)
Case 39732 (80.9%)8005 (79.7%)8521 (82.0%)
E N T L N Case 125,798 (51.2%)13,725 (77.4%)17,536 (92.0%)
Case 219,151 (48.2%)13,419 (74.4%)11,901 (90.0%)
Case 315,167 (61.2%)6494 (64.7%)10,153 (97.7%)
G L M Case 122,923 (45.6%)17,926 (71.0%)12,620 (66.2%)
Case 222,109 (55.6%)16,696 (80.7%)10,548 (79.8%)
Case 311,807 (47.7%)8831 (73.4%)7035 (67.7%)
N L D N Case 110,989 (21.9%)14,020 (55.5%)10,553 (58.8%)
Case 28541 (21.5%)10,379 (50.2%)9238 (51.2%)
Case 36611 (26.7%)6985 (58.1%)5854 (58.3%)
LMA TotalENTLN TotalGLM TotalNLDN Total
Case 150,26025,25417,73019,061
Case 239,74220,68818,04213,225
Case 324,77712,02310,04110,389
Table 3. Max and mean number of flashes that matched to a single LMA flash for each network and Case.
SensorCase 1Case 2Case 3
MaxMeanMaxMeanMaxMean
ENTLN51.2491.3161.51
NLDN71.0151.0331.01
GLM61.1761.1251.04
Disclaimer/Publisher’s Note: The statements, opinions and data contained in all publications are solely those of the individual author(s) and contributor(s) and not of MDPI and/or the editor(s). MDPI and/or the editor(s) disclaim responsibility for any injury to people or property resulting from any ideas, methods, instructions or products referred to in the content.

