Article

A Novel Approach to Assessing Light Extinction with Decade-Long Observations of Chemical and Optical Properties in Seoul, South Korea

1
Air Quality Research Division, National Institute of Environmental Research, Incheon 22689, Republic of Korea
2
Department of Environmental Science, Hankuk University of Foreign Studies, Yongin-si 17035, Republic of Korea
3
Open Space Co., Seoul 07511, Republic of Korea
*
Author to whom correspondence should be addressed.
Atmosphere 2024, 15(3), 320; https://doi.org/10.3390/atmos15030320
Submission received: 27 January 2024 / Revised: 21 February 2024 / Accepted: 1 March 2024 / Published: 4 March 2024
(This article belongs to the Special Issue Novel Insights into Air Pollution over East Asia)

Abstract

:
We performed continuous long-term measurements of PM2.5 mass, comprehensive chemical composition, and optical properties, including scattering and absorption coefficients, from March 2011 to December 2020 at the Metropolitan Air Quality Research Center in Seoul, South Korea. PM2.5 peaked at 38 μg/m3 in 2013 and has been declining steadily since then, reaching 22 μg/m3 in 2020. The extinction coefficients also decreased with the decline in PM2.5, but the correlation between the two factors was not as pronounced. This deviation was mainly attributed to the rapid changes in the chemical composition of PM2.5 over the same period. The mass contribution of sulphate to PM2.5 decreased from 33.9 to 24.1%, but the fraction of nitrate and organic carbon increased from 23.4 and 20.0 to 34.1 and 32.2%, respectively, indicating that sulphate has been replaced by nitrate and organic carbon over the past decade. To assess the effect of changing aerosol chemical compositions on light extinction, we compared the measured extinction coefficients with those estimated via the various existing light extinction approaches, including the revised IMPROVE algorithm. We found that the simplified linear regression model provided the best fit to our data, with a slope of 1.03 and R2 of 0.87, and that all non-linear methods, such as the IMPROVE algorithms, overestimated the observed long-term light extinction by 23 to 48%. This suggests that the simple linear regression scheme may be more appropriate for reflecting the varying aerosol conditions over long periods of time, especially for urban air. However, for conditions where the chemical composition does not change much, non-linear methods such as the IMPROVE scheme are likely to be more appropriate for reproducing light extinction.

1. Introduction

Visibility is defined as the maximum horizontal distance at which a target object can be perceived by the human eye [1] and is an important indicator of urban air quality, which is closely related to aerosols in the atmosphere [2]. Visibility can be assessed through visual observations, direct measurements of scattering and absorption, and the calculation of light extinction coefficients from aerosol chemical composition. In particular, light extinction coefficients derived from chemical composition can be used to assess visibility in conditions where human observation or direct measurement is difficult and can quantify the contribution of chemical components to visibility degradation [3,4,5,6].
Visibility degradation occurs primarily through the scattering and absorption of light by particles and gaseous pollutants in the atmosphere [7]. Several studies have reported that fine particles, mainly those with aerodynamic diameters of 2.5 μm or less (PM2.5), contribute significantly to visibility deterioration through light scattering and absorption [8]. The extinction of light by PM2.5 is more pronounced than Reyleigh scattering and NO2 absorption by gases. The chemical composition of PM2.5 consists of three components: water-soluble inorganic ions, carbon, and trace elements [9]; the main chemical components, sulfate, nitrate, organic matter, and elemental carbon, are known to contribute significantly to light scattering and absorption [10]. In particular, the optical properties of light scattering and absorption by particles can vary depending on the size distribution, mass concentration, and chemical composition of particles [11]. In order to evaluate the impact of aerosols on visibility, several studies have been actively conducted to identify the characteristics and causes of light extinction due to aerosol chemical compositions and to determine a light extinction coefficient suitable for regional characteristics [12,13,14,15,16,17,18,19].
The U.S. Environmental Protection Agency (EPA) has identified PM2.5 as a source of visibility degradation since the 1970s through its Interagency Monitoring of Protected Visual Environment (IMPROVE) program as a network of visibility [3]. The EPA IMPROVE Network has presented a total of five studies (EPA IMPROVE Network Reports I~V) on the phenomenon of visibility deterioration in relation to chemical composition. Malm et al. [3] presented the initial formula, called the IMPROVE algorithm, which is a calculation formula for the light extinction coefficient for aerosol chemical composition. In the Grand Canyon and Great Smoky regions of the United States, the proposed equation mainly applied sulfate and nitrate, organic matter, carbon matter, soil matter, and the humidity fraction to calculate the light extinction coefficient. However, the equation tended to underestimate peak extinction coefficient values and overestimate trough values, so Pitchford et al. [4] developed a new algorithm to complement the equation by Malm et al. [3]. The revised IMPROVE algorithm takes into account an increase in the ratio of organic matter to organic carbon from 1.4 to 1.8, the addition of sea salt, the use of site-specific Rayleigh scattering, the application of NO2 in areas where it is available, and humidity fractions based on the size distribution of the main chemical components: sulfate, nitrate, and organic matter. Recently, Lan et al. [20] and Hu et al. [21] applied multiple linear regressions between directly measured extinction coefficients and the main chemical components of PM2.5 to quantify the chemical components that contribute to visibility attenuation and to determine whether the chemical components involved in light extinction fit well with the IMPROVE algorithm.
Researchers in Korea have also continued to conduct studies on the chemical and physical properties of aerosols, as well as their optical properties. Kim et al. [22] proposed an experimental equation considering the correlation between aerosol mass concentration, sulfate, and nitrate. In addition, Kim et al. [23] proposed a light extinction coefficient equation suitable for air quality in Seoul by modifying the coarse particle size in the IMPROVE algorithm. Previous studies have mainly focused on interpreting relationships and calculating extinction coefficients using relatively short-term measured data. In this study, however, we compared the extinction coefficient directly measured over a long period of time with the extinction coefficient calculated from various equations proposed in previous studies using aerosol chemical composition, and proposed a new equation that reflects aerosol composition changes over a long period of time.

2. Materials and Methods

2.1. Sampling Site and Period

The research site is located at the Seoul Metropolitan Air Quality Research Center (SMAQRC: 37.61° N, 126.93° E, 67 m asl), a division of the National Institute of Environmental Research (NIER) under the Ministry of Environment of Korea in Bulgwang-dong, Eunpyeong-gu, Seoul, Republic of Korea. Geographically, SMAQRC is located in a residential complex bounded by Mt. Bukhansan to the northeast, public facilities to the southeast, and a mixture of commercial and residential structures from the southwest to the northwest (see Figure 1). In addition, within a 0.1 km radius of the SMAQRC, Jinheung Road and Tongil Road, both six-lane thoroughfares, run from Gugi Tunnel in the northeast to Yeonsinnae in the northwest and from Yeonsinnae in the northwest to Hongeun Crossroads in the southeast. Data were systematically collected at hourly intervals from March 2011 to December 2020.

2.2. Chemical Analysis

Mass concentrations of PM10 and PM2.5 were measured with a BAM1020 (MetOne Inc., Grant Pas, OR, USA) instrument using the β-ray absorption method. The chemical composition of PM2.5 was measured in three major categories: inorganic ions, carbon, and metals. Inorganic ions were analyzed via ion chromatography (IC) using Ambient Ion Monitors (URG Co., Chapel Hill, NC, USA). Carbon was analyzed via thermal/optical transmittance (TOT) and non-dispersive infrared (NDIR) using a semi-continuous carbon aerosol analyzer ( Sunset Laboratory Inc., Tigard, OR, USA) according to NIOSH5040 protocol. Trace elemental components were analyzed using online XRF (Sailbri Cooper Inc., Tigard, OR, USA) with X-ray fluorescence spectroscopy. The measurement methods for the major chemical components are described in detail in a previous study [6]. The meteorological data were obtained from Bulgwang measurement station, operated by the Korea Ministry of Environment, located at the SMAQRC.

2.3. Optical Analysis

We analyzed the directly measured scattering and absorption coefficients using a Nephelometer (TSI Co., Shoreview, MN, USA) and an Aethalometer (Magee Sci., Berkeley, CA, USA), without the sample dryer, respectively, to calculate the light extinction coefficient of the particles. The scattering coefficient of particles was measured by collecting aerosols at a flow rate of 5 L/min, using LED light source for the sample injected into the integrating cell, and measuring the intensity of the scattered light. The measuring wavelengths are 450 nm (blue), 525 nm (green), and 635 nm (red), with a measuring range of 0.25 to 2000 Mm−1 and a detection limit of 0.3 Mm−1. The sample injected in the nephelometer was RH-controlled with a Nafion dryer and heater. The absorption coefficient of particles was measured by continuously sampling aerosols through a PM2.5 impactor at a flow rate of 5 L/min onto a quartz-based tape. The collected sample was irradiated with a laser in seven wavelength regions (370, 470, 520, 590, 660, 880, 950 nm), from the near infrared to the near ultraviolet, on the accumulated spot. The amount of light transmitted was calculated based on the analysis time, and the amount of light attenuation was analyzed at 5 min intervals.

2.4. Light Extinction Metrics

The extinction coefficient (Bext) serves as a comprehensive metric that captures the collective effect of both scattering and absorption coefficients from particles and gases, as defined in Equation (1).
Bext = bp_scat + bp_abs + bg_scat + bg_abs [Mm]−1
In this equation, “p” and “g” stand for particles and gases, respectively, while “scat” and “abs” stand for scattering and absorption, respectively. The particle scattering coefficient (bp_scat) can be derived from the particle mass and its composition, including nitrate, sulfate, and organic components. Simultaneously, the particle absorption coefficient (bp_abs) can be determined from elemental carbon concentrations. Gaseous components are characterized by the Rayleigh scattering coefficient (bg_scat), which is fixed at (0.120 × 10⁻⁴ m−1) and the absorption coefficient (3.3 × [NO2] ppm × 10−4) derived from the NO2 gas concentration (bg_abs). Traditionally, the total extinction coefficient is obtained by summing the contributions from both particles and gases. In our study, however, we focus only on the particle-related extinction coefficient, as given in Equation (2).
Bp_ext = bp_scat + bp_abs [Mm]−1
This choice stems from our ability to directly observe particle extinction coefficients (Bp_ext) by combining particle scattering and absorption measurements obtained from the nephelometer at 550 nm and the aethalometer at 520 nm, respectively. This straightforward approach allows for comprehensive understanding of changes in extinction coefficients related to changes in particle mass and composition. By focusing on direct measurements, we increase the precision and depth of our insights into the complex dynamics of aerosol light extinction coefficients.
Using the various light extinction coefficient algorithms that have been studied, we attempted to determine the algorithm that most accurately captures long-term variations in chemical composition (Table 1). Park et al. [6] proposed an expression that modified the coefficient for the carbon component of the revised IMPROVE algorithm [4] using non-linear regression analysis, and other previous studies [13,21,24] presented expressions that emphasized the differences in the coefficients for each component and the fractional coefficient of moisture in contrast to the original IMPROVE algorithm expression [3]. Using equations derived from these previous studies, including the IMPROVE algorithm, we performed estimates for particle light extinction coefficients. We then compared these estimates to directly measured values over a 10-year period.
We introduced a novel algorithm aimed at enhancing the simulation of particle light extinction based on long-term aerosol chemistry data. Our approach employs a simple linear regression model, distinct from previously presented algorithms, as it incorporates all available aerosol chemistries. Implementation of this model utilized the Python programming language (version 3.8.8) along with a statistical inference technique employing a BayesianRidge module from the sklearn package (version 1.3.2) [25]. The objective was to identify the optimal functional relationship between measured aerosol light extinction and chemical variables. In this context, the independent variable encompassed all measured chemical compositions, while the directly measured light extinction coefficient served as the dependent variable [26]. Consequently, this methodology facilitated accurate modeling and prediction of the intricate relationship between chemical composition and the light extinction coefficient [20,21,27].

3. Results and Discussion

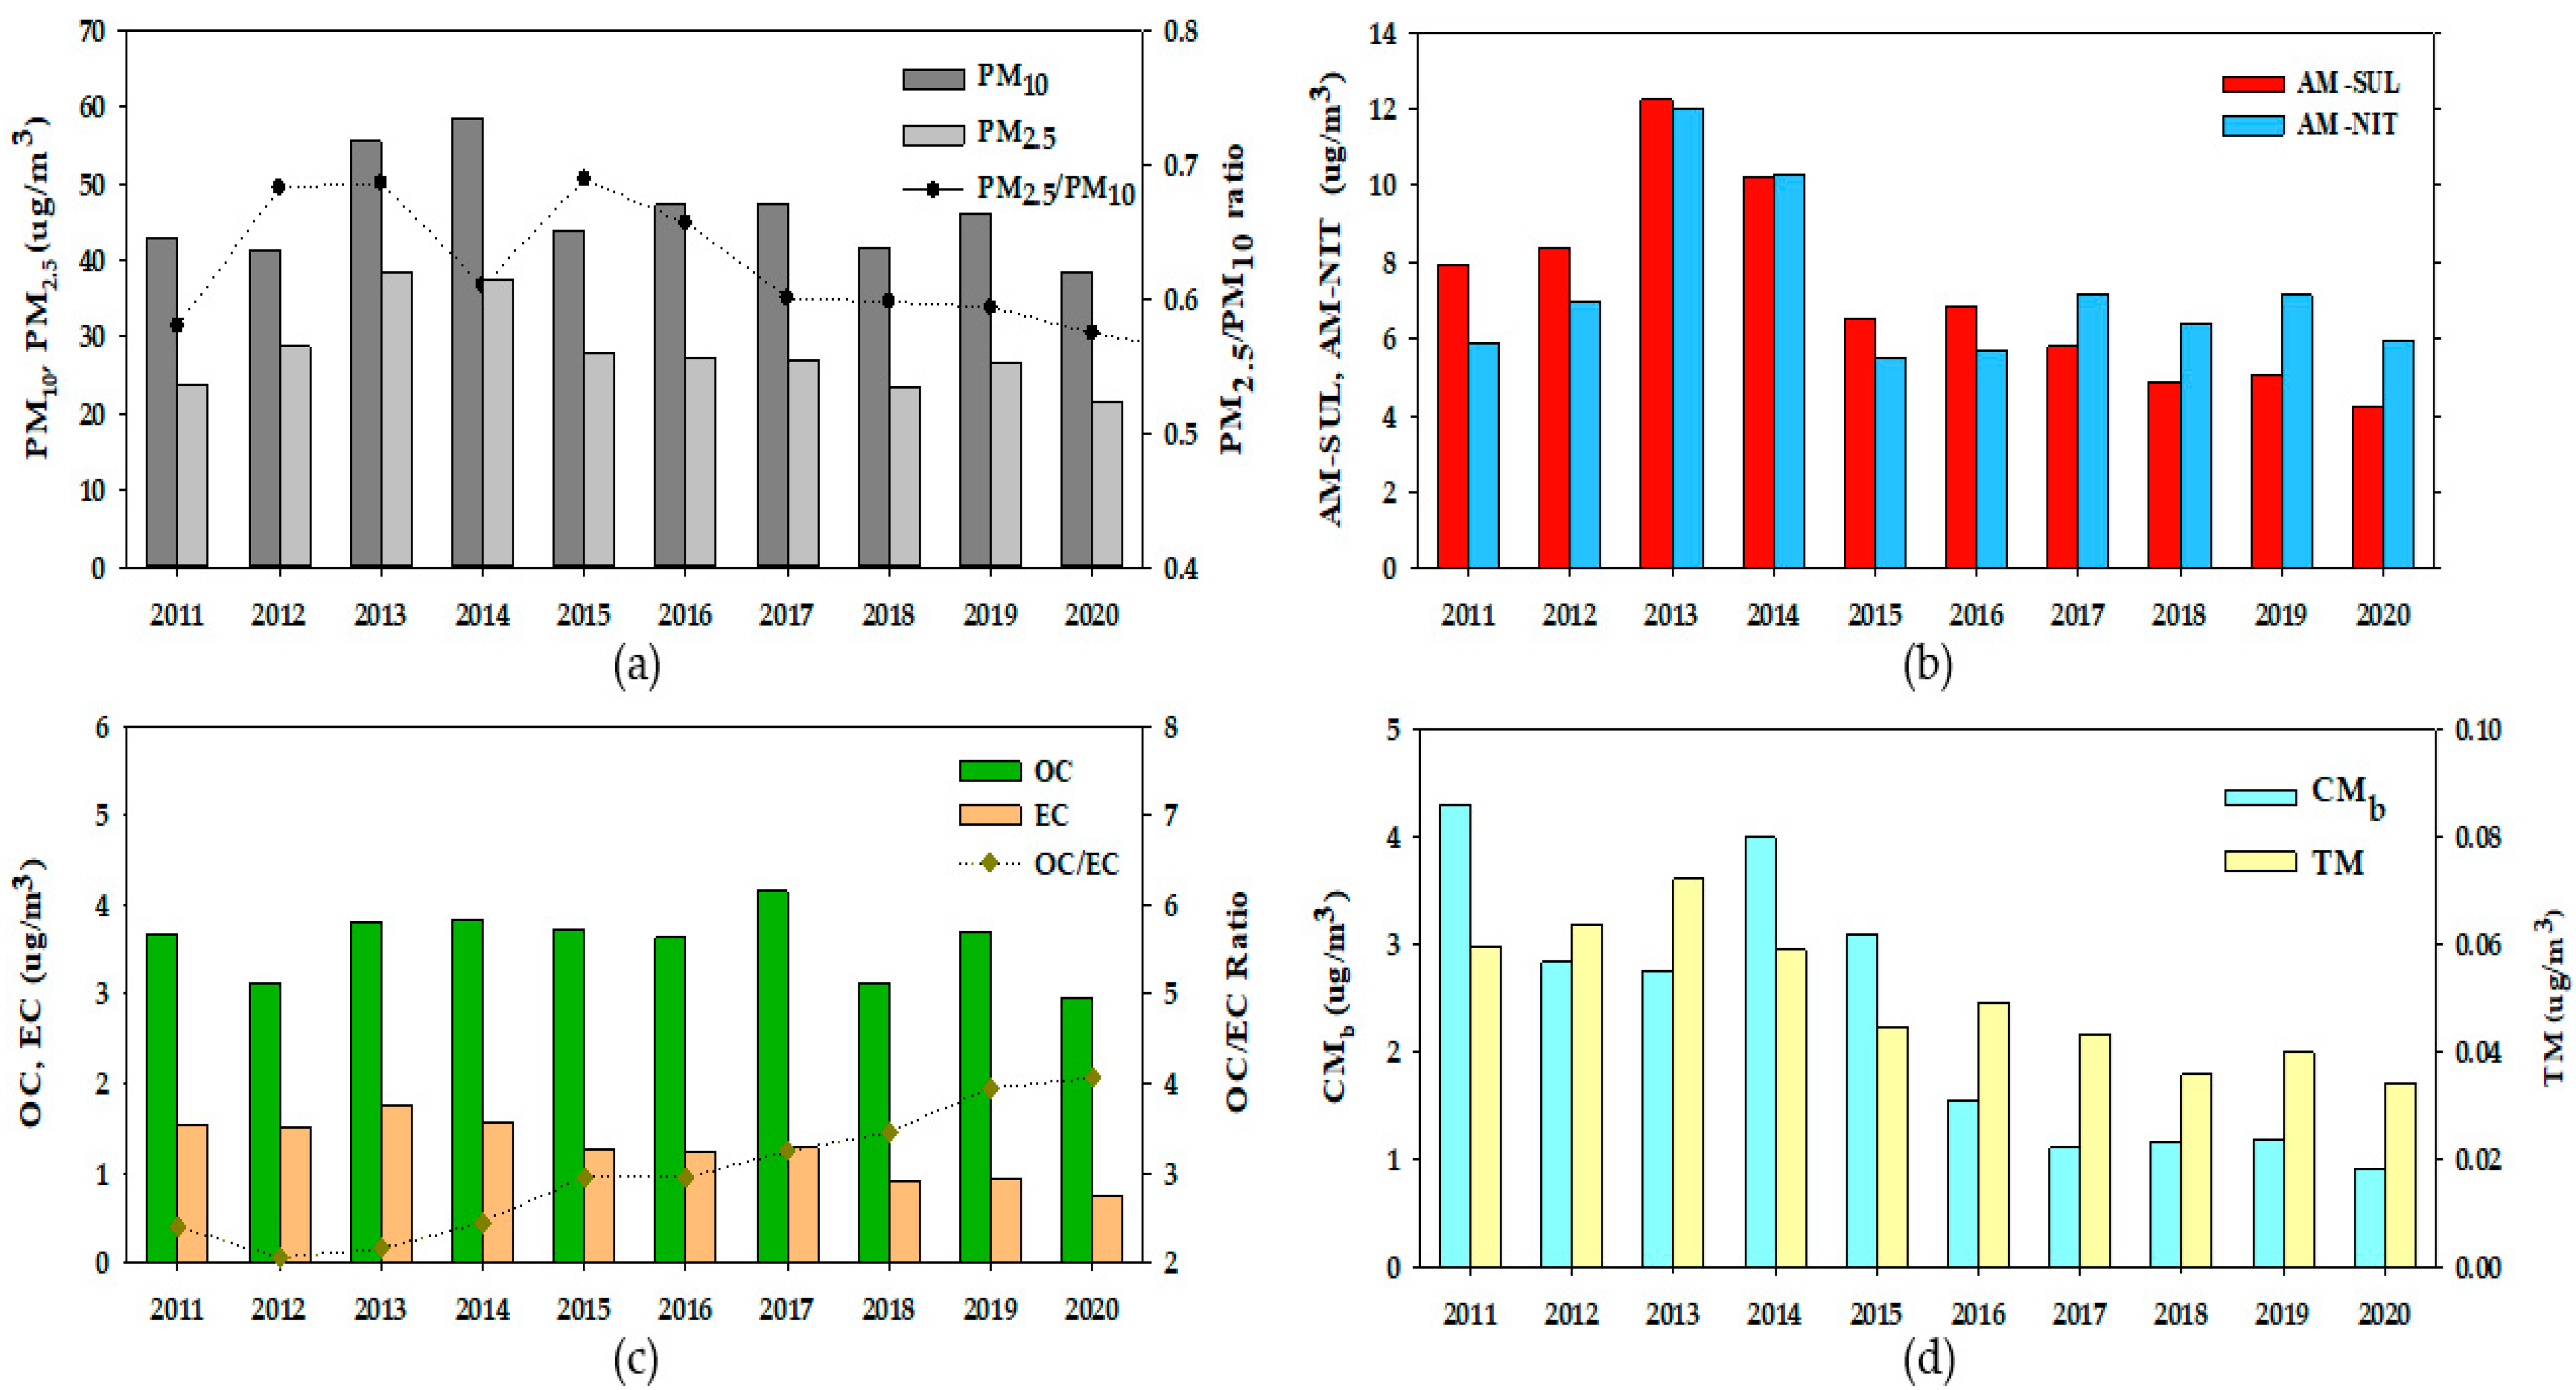
3.1. Aerosol Mass Concentrations and Chemical Composition of PM2.5

The annual average maximum concentrations for PM10 and PM2.5 were 59 μg/m3 in 2014 and 38 μg/m3 in 2013, respectively, while the annual average minimum concentrations reached 38 μg/m3 for PM10 and 22 μg/m3 for PM2.5 in 2020 (Figure 2a). Over the last decade, both PM10 and PM2.5 have shown a consistent decreasing trend since the maximum in 2014 [28]. The PM2.5/PM10 ratio decreased by about 11%, from about 68% in 2013 to about 57% in 2020 (see Figure 2a). To understand these changes, an analysis of the concentrations of chemical constituents was conducted. The annual average concentration of ammonium sulfate (AM-SUL), a major ionic component, steadily decreased from 12.2 μg/m3 in 2013 to 4.2 μg/m3 in 2020, mirroring the decreasing trend in PM2.5 concentration. Conversely, ammonium nitrate (AM-NIT) decreased from 12.0 μg/m3 in 2013 to 6.0 μg/m3 in 2020, but remained constant between 2015 and 2020, showing periodic increases and decreases (Figure 2b).
The annual average concentrations of organic carbon (OC) and elemental carbon (EC) both showed a decreasing trend. OC decreased from 3.8 μg/m3 in 2013 to 3.0 μg/m3 in 2020, while EC decreased from 1.8 μg/m3 in 2013 to 0.7 μg/m3 in 2020. In addition, the OC/EC ratio increased from 2.2 in 2013 to 4.3 in 2020, reflecting the decrease in EC at a lower concentration level (Figure 2c). This can be attributed to a reduction in primary emissions as part of South Korea’s air quality management policies. The crustal mass (CMb: 3.73[Si] + 1.63[Ca] + 2.42[Fe] + 1.94[Ti]) showed a similar pattern to PM10, peaking in 2014 (4.0 μg/m3) due to frequent yellow dust events and decreasing steadily until 2020 (0.9 μg/m3). The trace metal (TM: [V] + [Cr] + [Mn] + [Co] + [Ni] + [As] + [Se] + [Pb]) followed a similar trend to the main chemical components, including PM2.5 (Figure 2d), peaking in 2013 (0.07 μg/m3) and decreasing until 2020 (0.03 μg/m3). In summary, the concentrations of sulfate, nitrate, organic carbon, and elemental carbon show a consistent decrease over time, indicating a reduction in the concentration of particulate matter primarily of anthropogenic origin.

3.2. Aerosols and Measured Extinction Coefficients

Figure 3a shows the annual variation in the directly measured extinction coefficient and PM2.5 mass. The data show a robust positive correlation (R2: 0.84) between the extinction coefficient and PM2.5, although some exceptions are observed, especially in recent years. Figure 3b shows the annual contribution of chemical components to the PM2.5 mass. Predominantly, AMSUL, AMNIT, and OM (organic mass) emerge as the major species, which together contribute about 80% and show temporal variations. To assess the concentration of OM, we deviated from the previous study [6], which used an OM/OC ratio of 1.4. Instead, our study uses a value of 1.9, which is consistent with the current oxidation state in Seoul [29]. The significant increase in OM/OC and OC/EC ratios over the past decade indicates changes in the emissions, chemical composition, and oxidation state of carbonaceous compounds in Seoul, including the mixing state of soot, and, in turn, the aerosol extinction coefficients [30]. Among these major species, AMSUL had the highest contribution of 33.9% in 2013, which decreased by approximately 10% to 24.1% in 2020. Conversely, AMNIT, with the lowest distribution of 23.4% in 2015, increased by approximately 10% to 34.1% in 2020. In addition, OM will increase by 12% from 20.0% in 2013 to 32.2% in 2020. Our estimation suggests a shift in the contribution of major chemical components in PM2.5 from AMSUL to AMNIT and OM over time. This shift may have implications for the annual characteristics of light extinction.

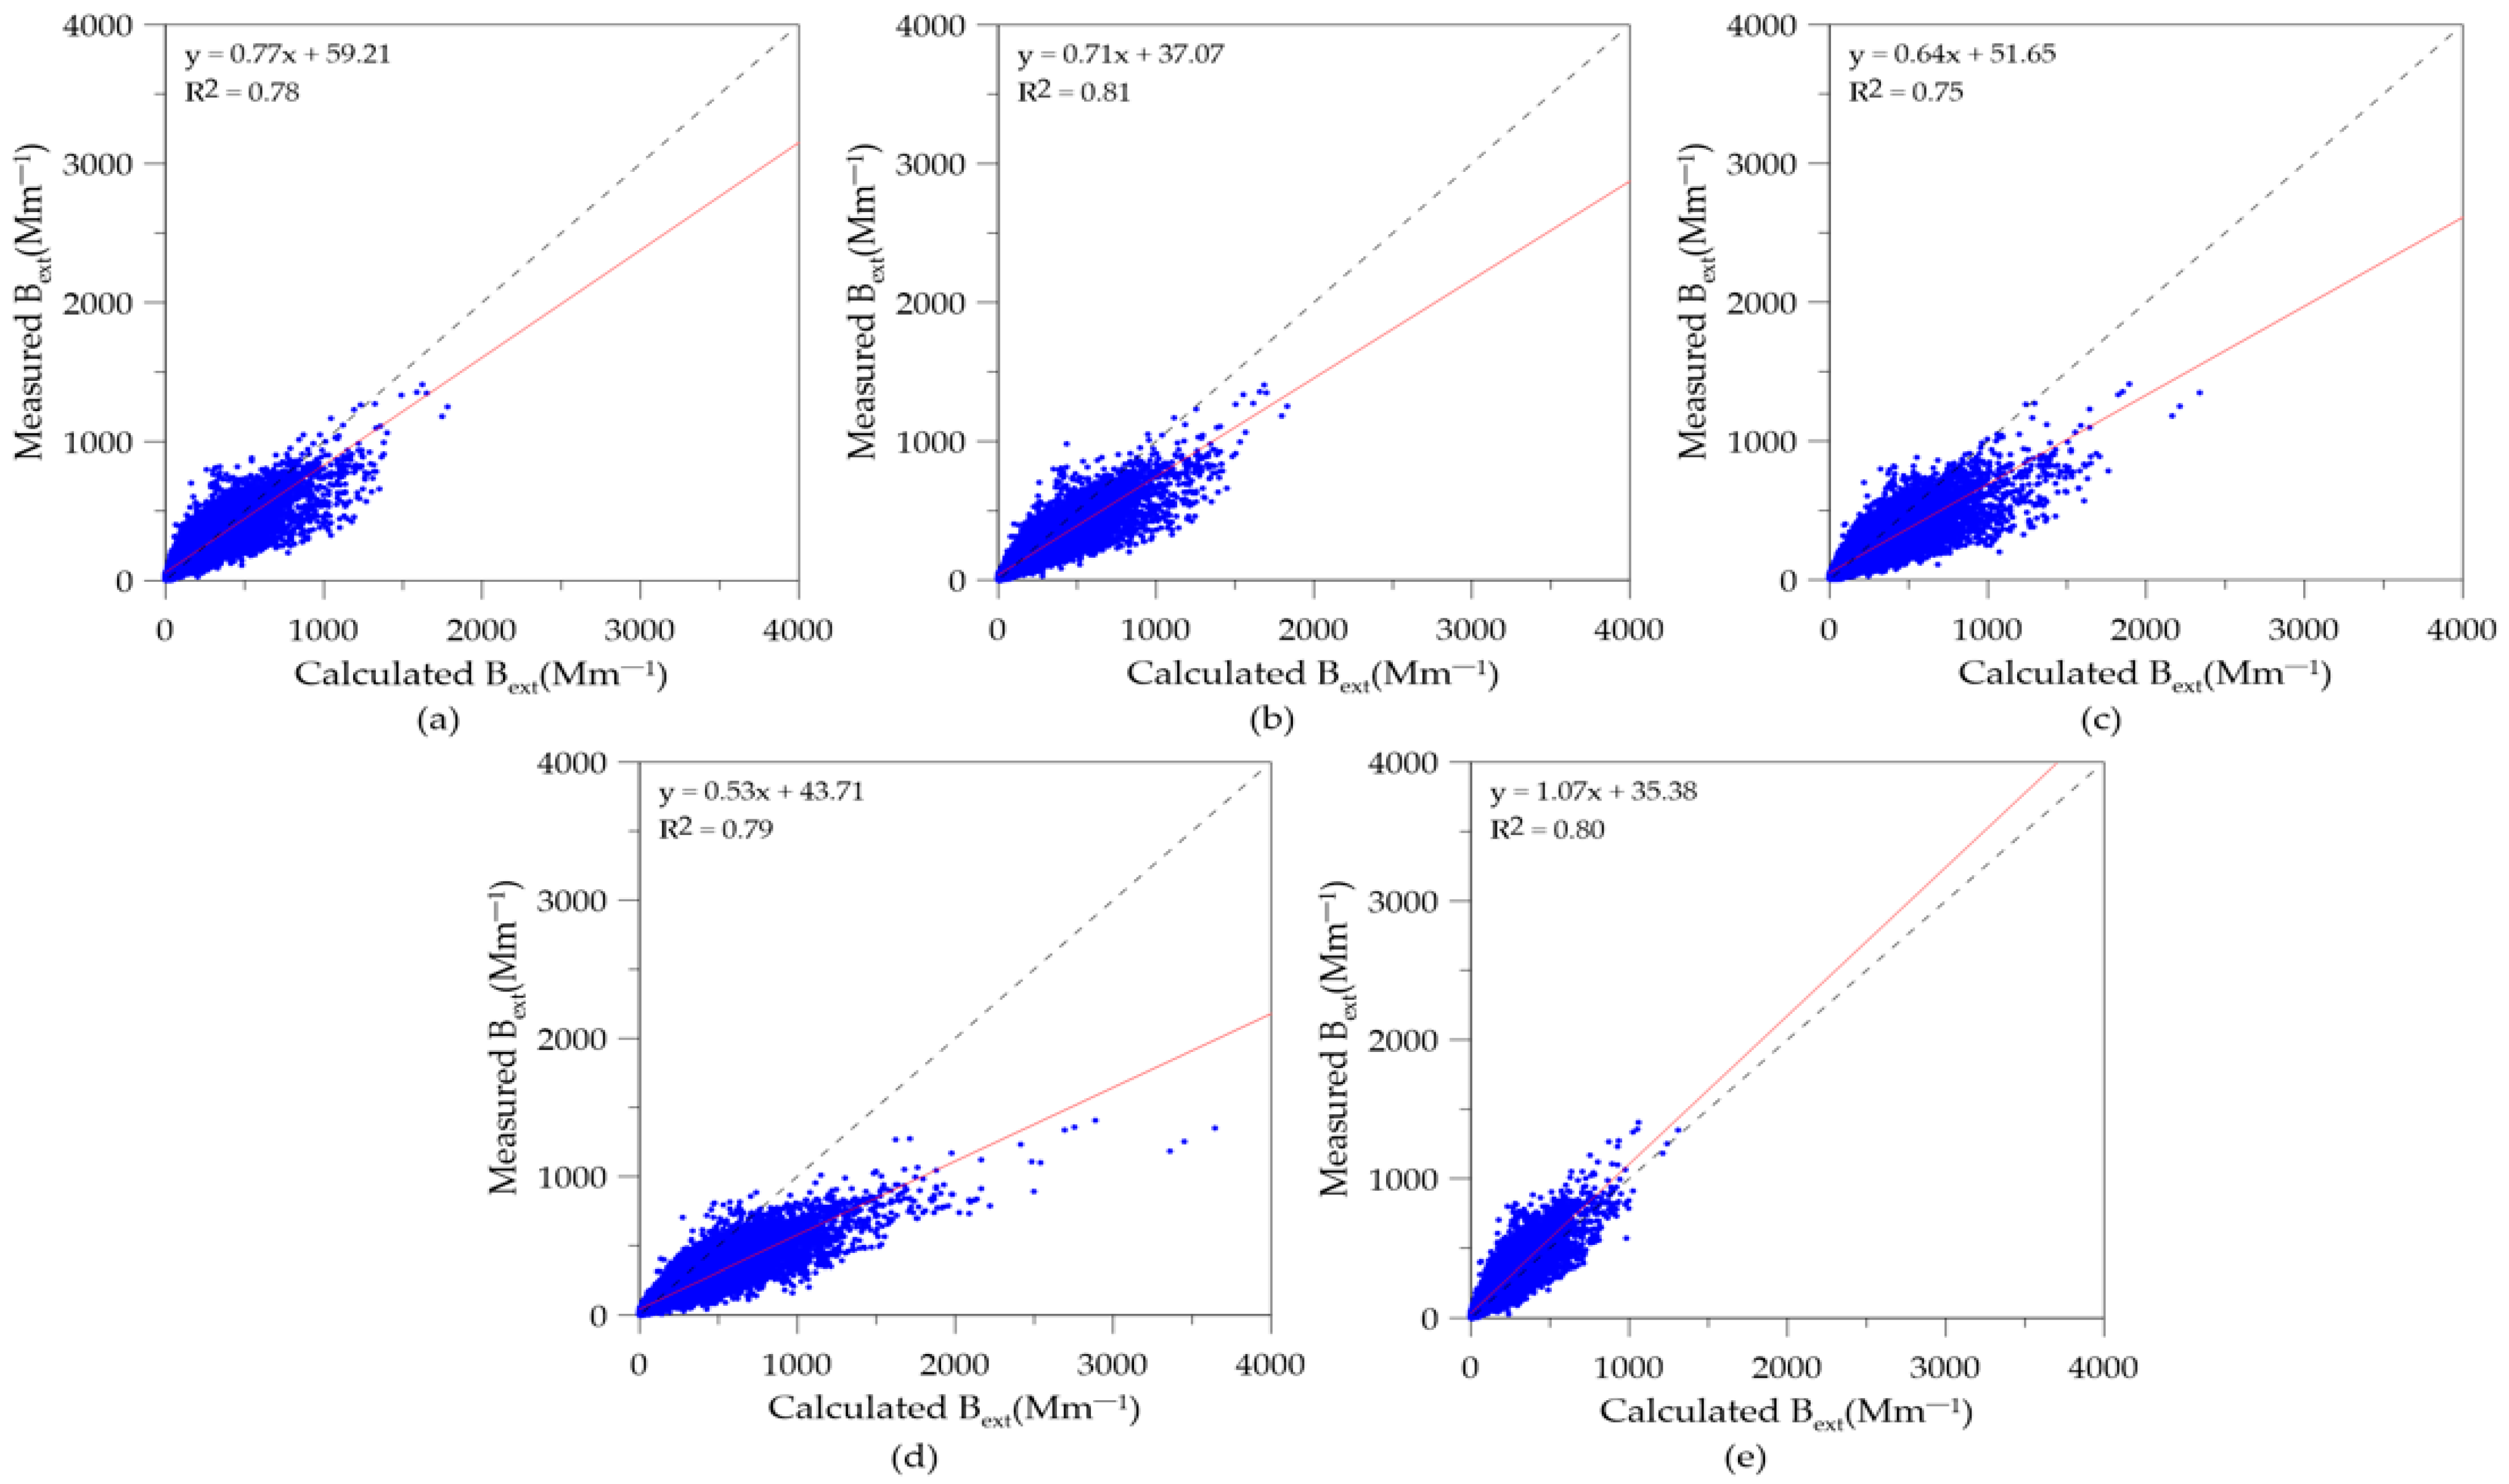
3.3. Assessment of Light Extinction Algorithms

In this study, we evaluated the effectiveness of different algorithms in calculating the light extinction coefficient, taking into account the long-term variations in the chemical composition in Seoul. A comparative analysis was performed between the calculated light extinction values derived from established algorithms (see Table 1 for previous studies [4,6,13,21,24]) and the directly measured extinction coefficients. Figure 4a illustrates the correlation between the extinction coefficient calculated using the revised IMPROVE algorithm and the directly measured extinction coefficient. While there is a strong correlation (slope: 0.77, R2: 0.78), the calculated extinction coefficient is overestimated by approximately 22%.
Similarly, other modified IMPROVE algorithms from previous studies showed reasonable correlation with the directly measured extinction coefficient (R2: 0.75 to 0.82). However, significant overestimation ranging from 29 to 48% was observed (see Figure 4b–d). These results suggest that modified IMPROVE algorithms, including the revised IMPROVE algorithm, may not adequately capture the measured light extinction coefficients over rapidly changing aerosol chemical compositions over long periods of time.
It is noteworthy that the extinction coefficient using the simple linear scheme of Yu et al. [13] shows a better correlation with the directly measured extinction coefficient, albeit with a slight underestimation of about 7% (see Figure 4e). This underestimation can be attributed to the use of a constant moisture fraction for the main chemical components and the exclusion of certain variables such as soil composition and chlorine content. To refine the Yu scheme, a similar linear regression model was applied, including moisture and additional factors such as crustal mass and chlorine.

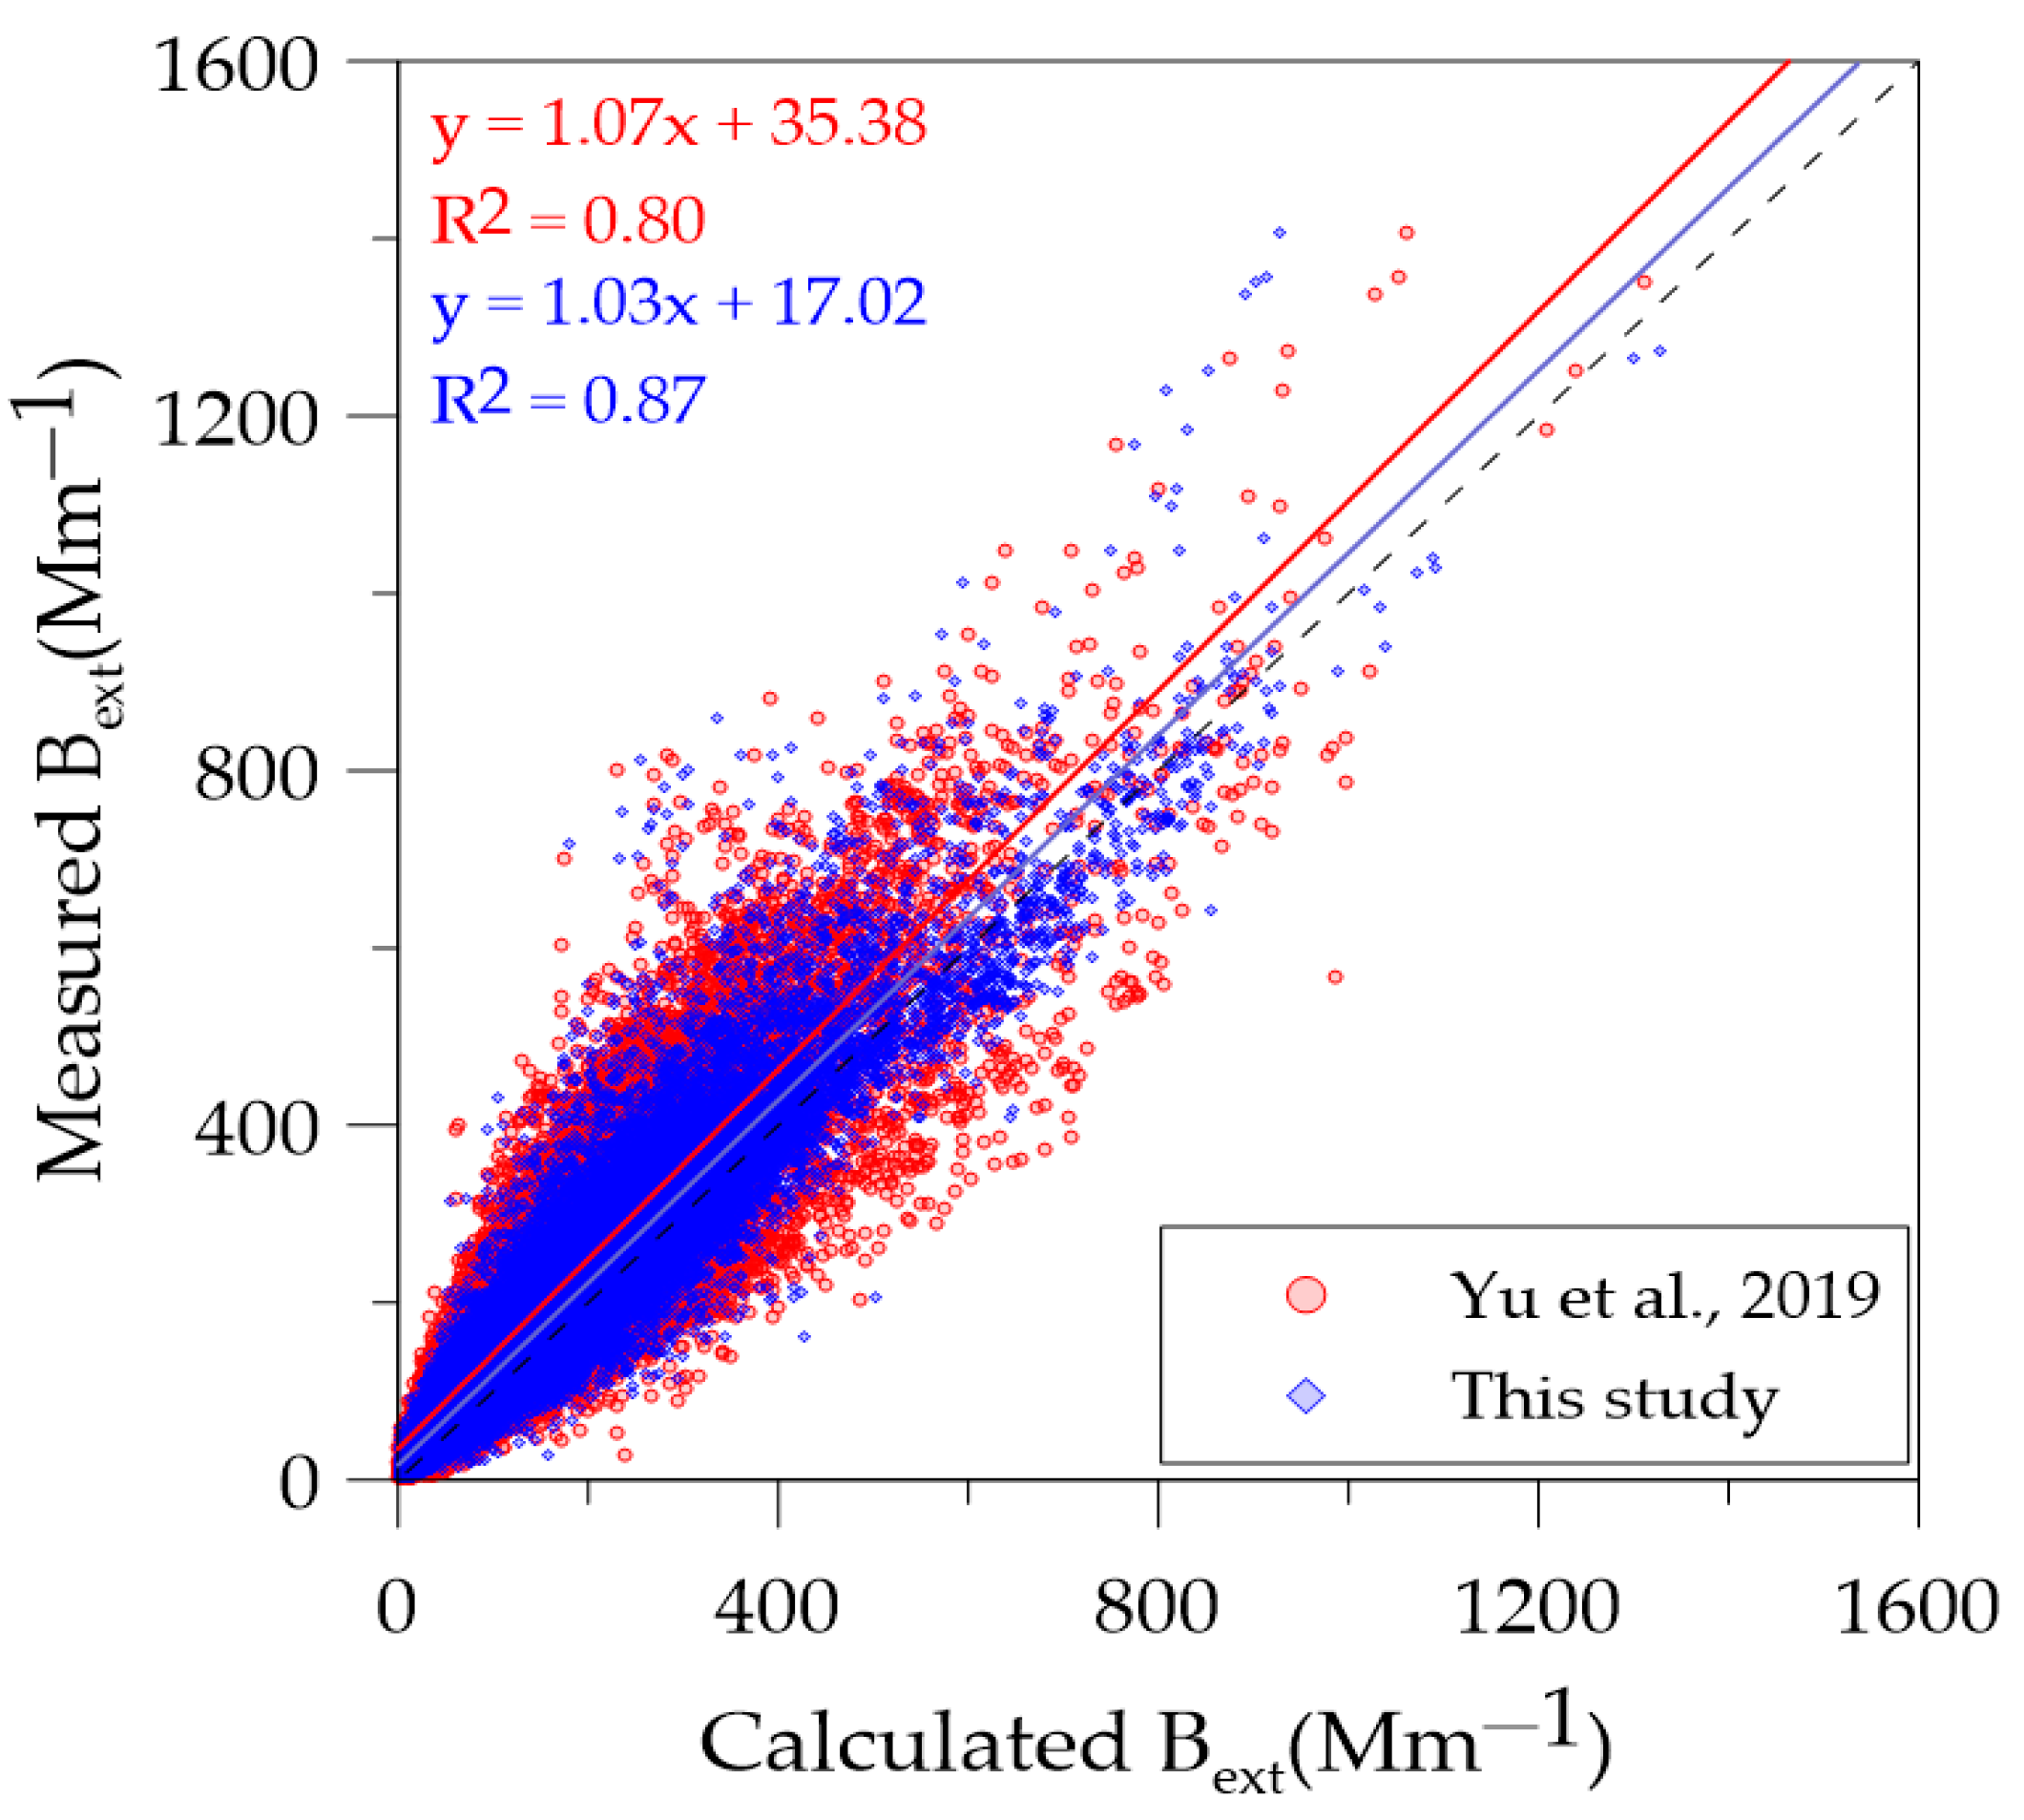
3.4. A Modified Yu Scheme

Unlike the equations found in the revised IMPROVE algorithm and most previous studies, which include various variables and nonlinear relationships between them, such as chemical component specific coefficients, moisture growth factors, and chemical component concentrations, our approach adopted a simplified first-order equation, similar to the Yu scheme. However, our equation included almost all chemical constituents as independent variables within the IMPROVE scheme, with the directly measured extinction coefficient as the dependent variable. In this study, we used a Bayesian model within a linear regression framework for all variables to derive best-fit coefficients tailored to the long-term measurement data.
The best-fit coefficients for all variables (such as SS, LS, SN, LN) are detailed in Equation (3). It is noteworthy that the inclusion of CM as an independent variable had no effect on the light coefficient values due to its zero value. In addition, FS, Cl, and humidity had minimal effects on the extinction coefficient. Nevertheless, the coefficients of sulfate and nitrate exceeded those of the revised IMPROVE algorithm. Conversely, the coefficient of EC was approximately 2.4 times greater than its counterpart in the revised IMPROVE algorithm equation. This observation led to the conclusion that sulfate, nitrate, and EC play a more significant role in light extinction in the Seoul area than suggested by the revised IMPROVE algorithm. The aethalometer used in this study was not equipped with a sample dryer, which may have caused moisture to accumulate in the sample, thereby reducing the light absorption coefficient [31,32]. There is a possibility that the absorption coefficient may have been underestimated due to this problem, suggesting that the EC coefficient in Equation (3) could potentially be larger than estimated.
B e x t 9.5 × S S + 9.5 × L S + 7.3 × S N + 6.9 × L N + 3.6 × S O M + 5.2 × L O M + 23.8 × E C + 0.6 × F S + 0.5 × C l + 0.0 × C M + 0.4 × R H
In Figure 5, we performed a comparative analysis using the directly measured extinction coefficient, the extinction coefficient derived from the equation proposed by Yu et al. [13], and our Equation (3). The fit with our new scheme (slope: 1.03, R2: 0.87) showed favorable performance compared to the results of Yu et al. [13] (slope: 1.07, R2: 0.80), demonstrating a significant reduction in scatter in the scatter plot.
To further validate our new scheme, we examined the comparison between our scheme and those from previous studies [4,6,13,21,24], as detailed for each year in Table 2. With the exception of 2015, where the data completeness of 8.3% was too low for a meaningful comparison, our new scheme outperformed the results of previous studies. The overestimation of the light extinction coefficient in 2015 (slope 1.58) calculated from the equation provided in this study might result from the limited dataset, predominantly gathered during the summer months. Likewise, the overestimation of the light extinction coefficient in 2020 (slope 1.37) derived from the equation presented in this study might stem from alterations in operating conditions due to the transition between different instruments. Notably, other schemes in previous studies showed an overall tendency to overestimate light extinction coefficients [4,21,24]. The two schemes proposed by Park et al. [6] and Yu et al. [13] showed good linearity with a slope close to 1; however, they had more scattered data with lower R2 values. Based on these results, we concluded that our new scheme is more robust in representing the light extinction in rapidly changing air quality in Seoul.
This study establishes a model that minimizes the influence of rapidly changing chemical variables and allows the reliable calculation of light extinction coefficients. This model is found to be more suitable for representing changing aerosol conditions over an extended period of time.

4. Conclusions

In this study, we conducted a comprehensive analysis of the chemical and optical properties of aerosols from March 2011 to December 2020 in the Seoul region. The mass concentration of particulate matter (PM) and the PM2.5/PM10 ratio showed a remarkable decrease over the past decade. At the same time, the major chemical components in PM2.5, namely, sulfate, organic matter, and elemental carbon, showed an overall decreasing trend. Conversely, while the extinction coefficient showed a similar pattern to PM2.5, the correlation between the two was not readily apparent. This discrepancy can be attributed to the considerable variability in the chemical composition of PM2.5, indicating a transition in the predominant chemical constituents from sulfate to nitrate and organic components over time.
Chemical extinction coefficients were calculated using various light extinction calculation methods proposed in previous studies, including the revised IMPROVE algorithm. Comparisons with schemes from previous studies indicated a tendency for the calculated extinction coefficients to be overestimated by approximately 23% to 48%. As a result, a new first-order equation was developed using a Bayesian model based on linear regression analysis. This equation was found to be effective in predicting light coefficients and included all relevant chemical variables. Through extensive comparison and validation against the revised IMPROVE algorithm and equations from previous studies for each year, the first-order equation presented in this study demonstrated improved accuracy and reliability (slope: 1.03, R2: 0.87). Consequently, the simple linear regression model proposed here is expected to be well suited to efficiently assess the impact of changes in aerosol chemical composition on light extinction.

Author Contributions

Conceptualization, S.-M.P. and G.L.; methodology, G.L.; software, S.-M.P. and G.L.; validation, S.-M.P.; formal analysis, S.-M.P.; investigation, S.-M.P., J.S.P. and I.-H.S.; resources, S.-M.P., J.L. and H.W.K.; data curation, S.-M.P., J.S.P. and I.-H.S.; writing—original draft preparation, S.-M.P.; writing—review and editing, Y.C., H.J.S., J.Y.A., Y.W.J., T.L. and G.L.; visualization, S.-M.P., J.K. and J.-h.K.; supervision, G.L. project administration, H.J.S., J.Y.A. and J.M.P.; funding acquisition, H.J.S., J.Y.A. and J.M.P. All authors have read and agreed to the published version of the manuscript.

Funding

This research was funded by the National Institute of Environmental Research (NIER), funded by the Ministry of Environment of the Republic of Korea (Grant number: NIER-2020-03-01-004) and National Research Foundation Korea (Grant number: NRF-2022R1A2C201017912).

Institutional Review Board Statement

Not applicable.

Informed Consent Statement

Not applicable.

Data Availability Statement

The data presented in this study are available on request from the corresponding author. The data are not publicly available due to data policy of National Institute of Environmental Research (NIER).

Acknowledgments

The authors thank all researchers at Seoul Metropolitan Air Quality Research Center (SMAQRC) of the National Institute of Environmental Research (NIER) for supporting these research opportunities.

Conflicts of Interest

Jeong-ho Kim is an employer of Open Space company. The paper reflects the views of the scientist and not the company.

References

  1. Horvath, H. Atmospheric visibility. Atmos. Environ. 1981, 15, 1785–1796. [Google Scholar] [CrossRef]
  2. Watson, J.G. Visibility: Science and regulation. J. Air Waste Manag. Assoc. 2002, 52, 628–713. [Google Scholar] [CrossRef]
  3. Malm, W.C.; Sisler, J.F.; Huffman, D.; Eldred, R.A.; Cahill, T.A. Spatial and seasonal trends in particle concentration and optical extinction in the United States. J. Geophys. Res.-Atmos. 1994, 99, 1347–1370. [Google Scholar] [CrossRef]
  4. Pitchford, M.; Malm, W.; Schichtel, B.; Kumar, N.; Lowenthal, D.; Hand, J. Revised Algorithm for Estimating Light Extinction from IMPROVE Particle Speciation Data. J. Air Waste Manag. Assoc. 2007, 57, 1326–1336. [Google Scholar] [CrossRef]
  5. Bai, D.; Wang, H.; Tan, Y.; Yin, Y.; Wu, Z.; Guo, S.; Shen, L.; Zhu, B.; Wang, J.; Kong, X. Optical Properties of Aerosols and Chemical Composition Apportionment under Different Pollution Levels in Wuhan during January 2018. Atmosphere 2019, 11, 17. [Google Scholar] [CrossRef]
  6. Park, S.M.; Song, I.H.; Park, J.S.; Oh, J.; Moon, K.J.; Shin, H.J.; Ahn, J.Y.; Lee, M.D.; Kim, J.; Lee, G. Variation of PM2.5 chemical compositions and their contributions to light extinction in Seoul. Aerosol Air Qual. Res. 2018, 18, 2220–2229. [Google Scholar] [CrossRef]
  7. Lee, J.Y.; Jo, W.K.; Chun, H.H. Long-term trends in visibility and its relationship with mortality, air-quality index, and meteorological factors in selected areas of Korea. Aerosol Air Qual. Res. 2015, 15, 673–681. [Google Scholar] [CrossRef]
  8. Cao, J.J.; Wang, Q.Y.; Chow, J.C.; Watson, J.G.; Tie, X.X.; Shen, Z.X.; Wang, P.; An, Z.S. Impacts of aerosol compositions on visibility impairment in Xi’an, China. Atmos. Environ. 2012, 59, 559–566. [Google Scholar] [CrossRef]
  9. Luan, T.; Guo, X.; Guo, L.; Zhang, T. Quantifying the relationship between PM2.5 concentration, visibility and planetary boundary layer height for long-lasting haze and fog-haze mixed events in Beijing. Atmos. Chem. Phys. 2018, 18, 203–225. [Google Scholar] [CrossRef]
  10. Ramanathan, V.; Carmichael, G. Global and regional climate changes due to black carbon. Nat. Geosci. 2008, 1, 221–227. [Google Scholar] [CrossRef]
  11. Li, R.; Hu, Y.J.; Li, L.; Fu, H.B.; Chen, J.M. Real-time aerosol optical properties, morphology and mixing states under clear, haze and fog episodes in the summer of urban Beijing. Atmos. Chem. Phys. 2017, 17, 5079–5093. [Google Scholar] [CrossRef]
  12. Vecchi, R.; Bernardoni, V.; Valentini, S.; Piazzalunga, A.; Fermo, P.; Valli, G. Assessment of light extinction at a European polluted urban area during wintertime: Impact of PM1 composition and sources. Environ. Pollut. 2018, 233, 679–689. [Google Scholar] [CrossRef]
  13. Yu, X.; Shen, L.; Xiao, S.; Ma, J.; Lü, R.; Zhu, B.; Hu, J.; Chen, K.; Zhu, J. Chemical and Optical Properties of Atmospheric Aerosols during the Polluted Periods in a Megacity in the Yangtze River Delta, China. Aerosol Air Qual. Res. 2019, 19, 103–117. [Google Scholar] [CrossRef]
  14. Wu, X.; Xina, J.; Zhang, X.; Klaus, S.; Wang, Y.; Wang, L.; Wen, T.; Liu, Z.; Si, R.; Liu, G.; et al. A new approach of the normalization relationship between PM2.5 and visibility and the theoretical threshold, a case in north China. Atmos. Res. 2020, 245, 105054. [Google Scholar] [CrossRef]
  15. Tao, J.; Zhang, L.; Wu, Y.; Zhang, Z. Evaluation of the IMPROVE formulas based on Mie model in the calculation of particle scattering coefficient in an urban atmosphere. Atmos. Environ. 2020, 222, 117116. [Google Scholar] [CrossRef]
  16. Gao, L.; Yan, P.; Mao, J.; Zhang, X.; Zhang, X.; Wu, Y.; Jing, J.; Xu, J.; Deng, X.; Chi, W. Ambient Atmospheric Aerosol Extinction Coefficient Reconstruction from PM2.5 Mass Concentrations and Application to Haze Identification in China. Aerosol Air Qual. Res. 2021, 21, 200386. [Google Scholar] [CrossRef]
  17. Prennia, A.J.; Hand, J.L.; Malm, W.C.; Copeland, S.; Luo, G.; Yu, F.; Taylor, N.; Russell, L.M.; Schichtel, B.A. An examination of the algorithm for estimating light extinction from IMPROVE particle speciation data. Atmos. Environ. 2019, 214, 116880. [Google Scholar] [CrossRef]
  18. Izhar, S.; Gupta, T.; Qadri, A.M.; Panday, A.K. Wintertime chemical characteristics of aerosol and their role in light extinction during clear and polluted days in rural Indo Gangetic plain. Environ. Pollut. 2021, 282, 117034. [Google Scholar] [CrossRef]
  19. Guo, L.; Cui, Y.; He, Q.; Gao, W.; Pei, K.; Zhu, L.; Li, H.; Wang, X. Contributions of aerosol chemical composition and sources to light extinction during haze and non-haze days in Taiyuan, China. Atmos. Pollut. Res. 2021, 12, 101140. [Google Scholar] [CrossRef]
  20. Lan, Z.; Zhang, B.; Huang, X.; Zhu, Q.; Yuan, J.; Zeng, L.; Hu, M.; He, L. Source apportionment of PM2.5 light extinction in an urban atmosphere in China. J. Environ. Sci. 2018, 63, 277–284. [Google Scholar] [CrossRef]
  21. Hu, S.; Zhao, G.; Tan, T.; Li, C.; Zong, T.; Xu, N.; Zhu, W. Current challenges of improving visibility due to increasing nitrate fraction in PM2.5 during the haze days in Beijing, China. Environ. Pollut. 2021, 290, 118032. [Google Scholar] [CrossRef] [PubMed]
  22. Kim, Y.K.; Lee, H.W.; Lee, Y.S. Attenuation of the Atmospheric Aerosol Transmissivity due to Air Pollution. J. KAPRA 1995, 11, 23–29, (In Korean with English Abstract). [Google Scholar]
  23. Kim, K.W.; Kim, Y.J.; Oh, S.J. Visibility Impairment during Yellow Sand Periods in the Urban Atmosphere of Kwangju, Korea. Atmos. Environ. 2001, 35, 5157–5167. [Google Scholar] [CrossRef]
  24. Valentini, S.; Bernardoni, V.; Massabo, D.; Prati, P.; Valli, G.; Vecchi, R. Tailored coefficients in the algorithm to assess reconstructed light extinction at urban sites: A comparison with the IMPROVE revised approach. Atmos. Environ. 2018, 172, 168–176. [Google Scholar] [CrossRef]
  25. Liao, K.; Wang, Q.; Wang, S.; Yu, J.Z. Bayesian Inference Approach to Quantify Primary and Secondary Organic Carbon in Fine Particulate Matter Using Major Species Measurements. Environ. Sci. Technol. 2023, 57, 5169–5179. [Google Scholar] [CrossRef] [PubMed]
  26. Aldrich, J.R.A. Fisher on Bayes and Bayes Theorem. Baysian Anal. 2008, 3, 161–170. [Google Scholar] [CrossRef]
  27. Zhu, W.; Guo, S.; Lou, S.; Wang, H.; Yu, Y.; Xu, W.; Liu, Y.; Cheng, Z.; Huang, X.; He, L.; et al. A novel algorithm to determine the scattering coefficient of ambient organic aerosols. Environ. Pollut. 2021, 270, 116209. [Google Scholar] [CrossRef]
  28. Chen, X.; Zhang, F.; Zhang, D.; Xu, L.; Liu, R.; Teng, X.; Zhang, X.; Wang, S.; Li, W. Variations of air pollutant response to COVID-19 lockdown in cities of the Tibetan Plateau. Environ. Sci. Atmos. 2023, 3, 708. [Google Scholar] [CrossRef]
  29. Song, I.H.; Park, J.S.; Park, S.M.; Kim, D.G.; Kim, Y.W.; Shin, H.J. Seasonal characteristics of PM1 in Seoul, Korea, measured using HR-ToF-Aerosol Mass Spectrometer in 2018. Atmos. Environ. 2021, 266, 118717. [Google Scholar] [CrossRef]
  30. Chen, X.; Ye, C.; Wang, Y.; Wu, Z.; Zhu, T.; Zhang, F.; Ding, X.; Shi, Z.; Zheng, Z.; Li, W. Quantifying evolution of soot mixing state from transboundary transport of biomass burning emissions. iScience 2023, 26, 108125. [Google Scholar] [CrossRef] [PubMed]
  31. Miyakawa, T.; Mordovskoi, P.; Kanaya, Y. Evaluation of black carbon mass concentrations using a miniaturized aethalometer: Intercomparison with a continuous soot monitoring system (COSMOS) and a single-particle soot photometer (SP2). Aerosol Sci. Technol. 2020, 54, 811–825. [Google Scholar] [CrossRef]
  32. Abichou, G.; Ngagine, S.H.; Ba, T.N.; Wang, G.; Flament, P.; Deboudt, K.; Dusanter, S.; Sigrist, M.W.; Tomas, A.; Chen, W. A New Photoacoustic Soot Spectrophone for Filter-Free Measurements of Black Carbon at 880 nm. Molecules 2022, 27, 6065. [Google Scholar] [CrossRef] [PubMed]
Figure 1. Measurement point in Seoul, South Korea.
Atmosphere 15 00320 g001
Figure 2. Annual variations in PM mass (a) and AM-SUL, AM-NIT in PM2.5 (b), OC, EC in PM2.5 (c), CMb, TM in PM2.5 (d).
Atmosphere 15 00320 g002
Figure 3. Annual PM2.5 mass and light extinction coefficients (a) and yearly contributions of major chemical components in PM2.5 (b).
Atmosphere 15 00320 g003
Figure 4. Comparative analysis of light extinction coefficients calculated from different schemes versus directly measured extinction coefficients: (a) Pitchford et al. [4], (b) Park et al. [6], (c) Valentini et al. [24], (d) Hu et al. [21], (e) Yu et al [13]. The red solid line and black dotted line indicate the line of best fit between two variables and 1:1 line, respectively.
Atmosphere 15 00320 g004
Figure 5. Comparative analysis of measured light extinction coefficients in this study (blue) and the Yu et al. [13] scheme (red).
Atmosphere 15 00320 g005
Table 1. Light extinction calculation schemes in published studies.
BextReference
2.2fS (RH)[SS] + 4.8fL (RH)[LS] + 2.4fS (RH)[SN] + 5.1fL (RH)[LN] + 2.8[SOM] + 6.1[LOM] + [FS] + 1.7fSS (RH)[SSa] + 0.6[CMa] + 10[EC]Pitchford et al. [4]
2.2fS (RH)[SS] + 4.8fL (RH)[LS] + 2.4fS (RH)[SN] + 5.1fL (RH)[LN] + 8.4[SOM] + 9.6[LOM] + [FS] + 1.7fSS (RH)[SS] + 0.6[CMa] + 21[EC]Park et al. [6]
4.4f1 (RH)[AM-SUL] + 5.2f2 (RH)[AM-NIT] + 6.1f3 (RH)[OM] + 3.2[FS] + 0.6[CMa] + 6.74[EC]Valentini et al. [24]
9.7f (RH)[AM-SUL] + 5.2f (RH)[ AM-NIT] + 6.5[OM] + 5.5[Others] + 0.6[CMa] + 10[EC]Hu et al. [21]
3f (RH)[AM-SUL] + 3f (RH)[AM-NIT] + 4[OM] + 10[EC]Yu et al. [13]
fS, L, SS, 1~3(RH): relative humidity function; SS, SN, SOM: small size mode (sulfate, nitrate, organic mass). LS, LN, LOM: large size mode (sulfate, nitrate, organic mass); FS: fine soil, SSa: sea salt, CMa: coarse mass (PM10–PM2.5); EC: elemental carbon; AM-SUL: ammonium sulfate, AN-MIT: ammonium nitrate.
Table 2. Comparison of directly measured extinction coefficients with optical extinction coefficients calculated from published schemes.
YearRecovery Rate
(%)
Pitchford et al. [4]Park et al. [6]Valentini et al. [24]Hu et al. [21]Yu et al. [13]This study
SlopeR2SlopeR2SlopeR2SlopeR2SlopeR2SlopeR2
201147.10.920.691.030.730.720.670.560.671.220.721.140.74
201262.70.880.761.030.820.780.760.570.791.200.771.140.83
201344.60.720.830.900.900.660.820.490.851.070.861.000.91
201424.80.760.870.950.930.580.860.510.901.080.890.980.96
20158.31.170.741.310.800.890.740.690.791.240.711.580.85
201650.00.730.821.010.880.640.780.550.801.110.810.970.89
201738.00.610.770.850.890.460.750.460.800.820.790.930.96
201866.90.560.780.840.850.500.760.560.800.900.800.800.88
201975.10.790.860.950.880.620.850.690.871.100.870.970.93
202070.80.950.811.220.910.730.790.780.831.250.841.370.96
Average0.770.780.710.810.640.740.530.791.070.801.020.88
Disclaimer/Publisher’s Note: The statements, opinions and data contained in all publications are solely those of the individual author(s) and contributor(s) and not of MDPI and/or the editor(s). MDPI and/or the editor(s) disclaim responsibility for any injury to people or property resulting from any ideas, methods, instructions or products referred to in the content.

