Article

Quantifying High-Temperature and Drought Stress Effects on Soybean Growth and Yield in the Western Guanzhong Plain

1
Shaanxi Meteorological Service Center of Agricultural Remote Sensing and Economic Crops, Xi’an 710015, China
2
School of Chemical Engineering, Northwest University, Xi’an 710069, China
3
Baoji Institute of Agricultural Science, Qishan 722499, China
*
Author to whom correspondence should be addressed.
Atmosphere 2024, 15(4), 392; https://doi.org/10.3390/atmos15040392
Submission received: 29 January 2024 / Revised: 18 March 2024 / Accepted: 20 March 2024 / Published: 22 March 2024
(This article belongs to the Section Meteorology)

Abstract

:
High-temperature and drought events significantly impact crop growth and development. In the soybean-producing region of the Guanzhong Plain in China, understanding the dynamics of these climatic phenomena is vital for soybean yield preservation. Through a fixed-position observation experiment that analyzed four growth stages, nine agronomic traits, and soybean yield per unit area from 1998 to 2023, this research evaluated the characteristics of high-temperature and drought processes in various growth stages. It also examined the influence of high-temperature processes, drought processes, and their combined effects on agronomic traits and yield. The results indicate the following: (1) High temperature was a constant factor during the soybean growth period, with temperature-related indices markedly surpassing those related to drought. Notably, the occurrence of high-temperature and drought events was more prevalent during the flowering–podding stage than at the podding or grain-filling stages. (2) High temperature profoundly affected soybean yield components, primarily through a decrease in the number of grains per plant during the flowering–podding stage, subsequently impacting the grain weight per plant and yield. In years with extremely high temperatures, the soybean plant height was reduced by 6.1 to 15 cm, the main stem node number decreased by 0.1 to 2.9, the branch number decreased by 0.2 to 0.6, the number of pods per plant decreased by 4.8 to 13.7, the number of grains per pod decreased by 0.1 to 0.3, the number of grains per plant decreased by 13.5 to 32.6, the grain weight per plant decreased by 3.8 to 6.9 g, and the 100-grain weight decreased by 0.1 to 4.5 g. The common impact of high temperature combined with drought processes in different growth stages was reflected in the reduction in the number of branches by 0.1 to 1.4 and the reduction in the number of grains per pod by 0.02 to 13.7. This study underscores the importance of addressing the quantitative effects of climate change and extreme weather on soybean yield, which could help to develop effective adaptation and mitigation strategies.

1. Introduction

Climate change has profound and severe impacts on crop yields in several ways, driven primarily by changes in temperature, precipitation, and sunshine duration [1]. These meteorological factors are intricately linked to the growth and yield of crops [2,3,4]. Soybean (Glycine max L.) is an important source of plant protein and a major oil crop in China, playing a significant role in human food supply and economic development. The western Guanzhong Plain in Shaanxi Province is an important region for summer soybean production. The planting area of soybean is steadily expanding there, with an average yield of 2190 kg/ha in the experimental plots, peaking at 3298.5 kg/ha in optimal years, indicating significant potential for enhancing yield efficiency. However, frequent and severe occurrences of high-temperature and drought events in the area are the primary meteorological disasters affecting soybean sowing and growth, posing certain risks to local agricultural production. Understanding the dynamics of these environmental conditions and their effects on soybean yield components is essential for guiding agricultural strategies and safeguarding food security in the region. Meteorological conditions during the growing season are key environmental factors for soybean sowing, growth, development, and yield formation, and are closely related to soybean agronomic traits, yield, and quality [5,6]. However, climate change, occurring globally, significantly impacts the growth and yield of soybean [7,8,9]. In particular, meteorological disasters such as high-temperature and drought events pose serious threats to the growth and development of soybean [5,10,11], with high-temperature stress believed to cause seed abortion in soybean [12,13,14,15,16,17,18,19,20], and extreme temperature stress potentially being a major cause of soybean staygreen syndrome [21,22]. Therefore, understanding the characteristics of soybean under high-temperature and drought processes, as well as analyzing their impact on soybean agronomic traits and yield [23,24], is crucial for developing adaptive agricultural management strategies and enhancing the sustainability of soybean production.
This study delves into regional resource endowment and meticulously examines the characteristics of disaster processes during the soybean growth period and their impact on soybean. Firstly, it evaluates the dynamics of high-temperature and drought processes across various growth stages from 1998 to 2023, including the sowing, seedling emergence, flowering, and ripening stages. The evaluation of high-temperature processes involved an analysis based on different grades of high-temperature days, comprehensive intensity of high temperature, annual high-temperature processes, the duration of high-temperature processes, a cumulative high-temperature climate index, and the intensity of high-temperature processes. Additionally, this research utilized the meteorological drought composite index (MCI) to determine the start and end dates, duration, and cumulative intensity of drought processes during distinct growth stages, thereby characterizing the drought processes. Secondly, an in-depth impact analysis was performed to assess high-temperature processes, drought processes, and their combined effects on plant height, pod-setting height, the main stem node number, the branch number, pods per plant, grains per pod, grains per plant, grain weight per plant, 100-grain weight, and yield per unit.
This study provides critical insights into the characteristics of meteorological disasters encountered by soybean throughout its growth cycle against the backdrop of climate change. By conducting a quantitative analysis of how high-temperature and drought events influence soybean agronomic traits and yield over an extended period, this research sheds light on the specific patterns of high-temperature and drought processes within the study region. Moreover, it explores the underlying mechanisms by which elevated temperature affects soybean yield. The findings of this investigation are crucial for performing comprehensive assessments of disaster impacts.

2. Materials and Methods

2.1. Overview of the Study Area

Qishan County, located within the East Asian monsoon region, enjoys a warm temperate semi-humid climate that features marked seasonal shifts in temperature and precipitation. The summer season, from June to August, brings the year’s highest temperatures, serving as the main season for rainfall, alongside abundant sunlight. Despite this, precipitation distribution is irregular, with droughts being a frequent occurrence, thus leading to frequent high-temperature and drought disasters. In contrast, the autumn period, from September to November, is characterized by prolonged rainy weather, with a gradual drop in temperature, increased humidity, and diminished sunlight exposure. Located in the loess plateau region of northwest China, Qishan County is a primary agricultural hub where key grain and oilseed crops such as wheat, corn, and soybean are cultivated. The region predominantly features brown soil, which is relatively fertile yet shallow. Although precipitation levels are low, the area benefits from favorable conditions for sunlight and warmth. The effective irrigated farmland spans 18,260 mu, making up just 19.7% of the total arable land in the county, indicating a limited capacity for irrigation despite the agricultural prominence of the region.
The field trial data were sourced from the Liujiayuan Experimental Base in Qishan County, Baoji Institute of Agricultural Science. Within this experimental base, the earliest recorded sowing date was 29 May 1999, while the latest sowing occurred on 21 June 2010, with the average sowing date falling on 12 June. The earliest seedling emergence stage was noted on 4 June 1999, with the latest emergence recorded on 28 June 2010, resulting in an average emergence date of 19 June. The flowering stage of soybean commenced as early as 13 July 2000 and as late as 9 August 2010, averaging on 21 July. The ripening stage was observed as early as 17 September 2002 and 2003, with the latest ripening date on 10 October 2010, averaging on 28 September. Overall, the average duration of the growth stages spanned 108 days. During the period from soybean sowing to seedling emergence, various climatic conditions were recorded. The sunshine duration varied from 33.1 to 125.9 h. The average daily temperature fluctuated between 16.8 and 29.9 °C, with the highest daily temperature ranging from 20 to 41.5 °C. The total rainfall during this period varied from 0.2 to 121.6 mm, and the daily relative air humidity was between 32% and 99%. From the emergence stage to the flowering stage, the sunshine duration extended from 89.6 to 315.7 h. The average daily temperature varied between 18 and 33.2 °C, with the highest daily temperature again ranging from 20 to 41.5 °C. The total rainfall during this phase ranged from 19.7 to 165.5 mm, while the daily relative air humidity varied from 30% to 98%.

2.2. Data

Field experimental data for this study were sourced from the Liujiayuan experimental base in Qishan County, Baoji Institute of Agricultural Science. The experimental material was the soybean variety ‘Qindou 8’ from the Shaanxi Hybrid Rapeseed Research Center. Field experiments were continuously conducted from 1998 to 2023 as a long-term fixed-position observation, covering four growth stages (sowing, seedling emergence, flowering, and ripening) and nine agronomic traits (plant height, pod-setting height, main stem node number, branch number, pods per plant, grains per pod, grains per plant, grain weight per plant, 100-grain weight), as well as the yield per unit [25]. The experimental fields were generally irrigated twice a year—once after sowing and once during the flowering–podding stage—using a spray irrigation method, typically for 8 h each time [26,27]. This base, among the 14 national and regional observation stations built in Qishan County, is the closest to the Qishan County Meteorological Bureau observation field, with a straight-line distance of 7.2 km. Therefore, the meteorological data used in this paper are from the Qishan National Station (34°27′ N, 107°39′ E, 669.6 m) observation data (Figure 1), sourced from the National Meteorological Center, and have undergone strict quality control.

2.3. Research Methods

This study utilized meteorological data from the National Meteorological Center and multi-year observational data of soybean agronomic traits to evaluate the characteristics of high-temperature and drought processes in the western Guanzhong area and analyzed their impacts on soybean agronomic traits and yield. The methods utilized in this study for researching high-temperature and drought events follow the technical methods and standards recommended in the first national comprehensive risk census of natural disasters [28,29]. These methods have advantages such as cross-departmental applicability, full coverage, and uniform industry standard norms. They are applicable across various sectors and stages, including agricultural planting, cultivation, horticulture, seed production, and climate quality assessment of agricultural products, making them highly valuable for widespread use in various industries.

2.3.1. Calculation of Single-Station Comprehensive Intensity of High Temperature and Determination of Intensity Grades

Based on the meteorological industry standard in China [24], the calculation formula for the comprehensive intensity index of high temperature (SI) is expressed in Equation (1):
SI = j = 1 3 I j × T j
where SI indicates the single-station comprehensive intensity index of high temperature; Ij represents the single-station high-temperature intensity, i.e., the grading of the daily maximum temperature, with values 1, 2, and 3 corresponding to the temperature ranges [35 °C, 37 °C), [37 °C, 40 °C), and [40 °C, +∞), respectively; and Tj is the number of high-temperature days corresponding to Ij [28].
In this study, a comprehensive dataset was established, capturing daily high temperatures in Qishan County from 1998 to 2023, with the data structured annually. The specific timing and phenological stages of a high-temperature process were determined based on the start and end dates when the temperature reached or exceeded 35 °C. The daily high-temperature intensity ( I j ) and the duration of high temperatures ( T j ) were then calculated for each process. Using Equation (1), the SI values for meteorological stations during all study periods in the designated areas were calculated. The frequency of each SI value was then tallied. These values were arranged in ascending order, and the percentile method was used to divide them into different levels, determining the value intervals for each SI level. This establishes the comprehensive intensity grades for high temperature (Gk), as presented in Table 1 [28].
In this study, the comprehensive intensity grades for high temperature were defined as follows: Gk = 1 indicates an extremely high-temperature year; Gk = 2 indicates a very severe high-temperature year; Gk = 3 indicates a severe high-temperature year; Gk = 4 indicates a moderate high-temperature year; and Gk = 5 indicates a year without high temperature.

2.3.2. Single-Station Daily High-Temperature Climate Index

The high-temperature climate index is a measure of high-temperature intensity. When the daily maximum temperature is ≥35 °C, the daily high-temperature climate index is calculated using Equation (2):
I d = T g 34.9 × D g 0.5 + T d 25.9 × D d 0.5
where Id represents the single-station daily high-temperature climate index; Tg indicates the daily maximum temperature (°C); Dg signifies the duration of high-temperature days up to the current day (d); Td denotes the daily minimum temperature (°C); and Dd is the duration of days with the daily minimum temperature continuously at or above 26 °C up to the current day (d).
In this study, the corresponding SI value range for Gk = 1 was [44, +∞), for Gk = 2 was [23, 44), for Gk = 3 was [13, 23), and for Gk = 4 was [1, 13).

2.3.3. Drought Characteristic Extraction

The drought index reflects the degree of drought, and this study employed the MCI to reflect drought intensity [10,11,30]. A drought process is identified when a station experiences light drought or above for 15 consecutive days or more, with at least one day reaching moderate drought or above. The date of the first occurrence of light drought during the period is considered the start of the drought process. After a drought process begins, if there are five consecutive days of no drought or wet conditions, this process ends. The last day of the drought process, with a drought level of light or above before it ends, is considered the end date of the drought process. The total number of days from the start to the end of the drought process is the duration of the drought process. The cumulative drought intensity reflects the combination of drought index intensity and duration, expressing the intensity of the drought process, and is calculated according to Equation (3):
S n = n α 1 i = 1 N I i
where S(n) is the cumulative drought intensity for n days of drought at a station; n represents the number of consecutive days of drought at a station; α denotes the weight coefficient, generally ranging from 0.5 to 1.0, preferably 0.5, and in this study, 0.5 was used; and Ii signifies the absolute value of the drought index on the ith day, 1 ≤ i ≤ n, with the drought index for levels below light drought set to 0. Drought process intensity was divided into four levels: light, moderate, severe, and extreme.
For this investigation, conventional statistical techniques, such as correlation analysis and time series analysis, were employed to process and analyze the data. All computations relevant to this study were carried out using Microsoft Excel 2021.

3. Results

3.1. Characteristics of Disaster Weather Processes during the Soybean Growth Period

3.1.1. Spatial–Temporal Variations in Characteristics of High-Temperature Processes

This study utilized the annual agronomic trait data for soybean as well as meteorological data to conduct a comprehensive correlation analysis. The relationships between the cumulative high-temperature index during the growing season and soybean agronomic traits were analyzed. The results showed a significant correlation between the high-temperature index and plant height (r = 0.29), grains per pod (r = 0.30), and main stem node number (r = 0.34). These findings were statistically significant at α levels of 0.2 and 0.05 with a sample size of N = 26. Using the daily maximum temperature data during the soybean growth period from 1984 to 2023 (a total of 40 years, with 1998 to 2023 being the observation period for soybean in the field, from which the average values for each phenological stage of soybean were calculated, with 1984 to 1997 as the average growth period), the comprehensive intensity and grade of high temperatures during the soybean growth period were calculated annually. The corresponding SI value range for Gk = 1 was [44, +∞), with 2017 and 2022 classified as extremely high-temperature years; for Gk = 2, it was [23, 44), with 2005, 2006, 2014, and 2016 as very severe high-temperature years; for Gk = 3, it was [13, 23), with 1997, 2001, 2004, 2009, 2013, 2015, 2019, 2021, and 2023 as severe high-temperature years; 1984 was a year without high temperature; and the remaining years were categorized as moderate high-temperature years.
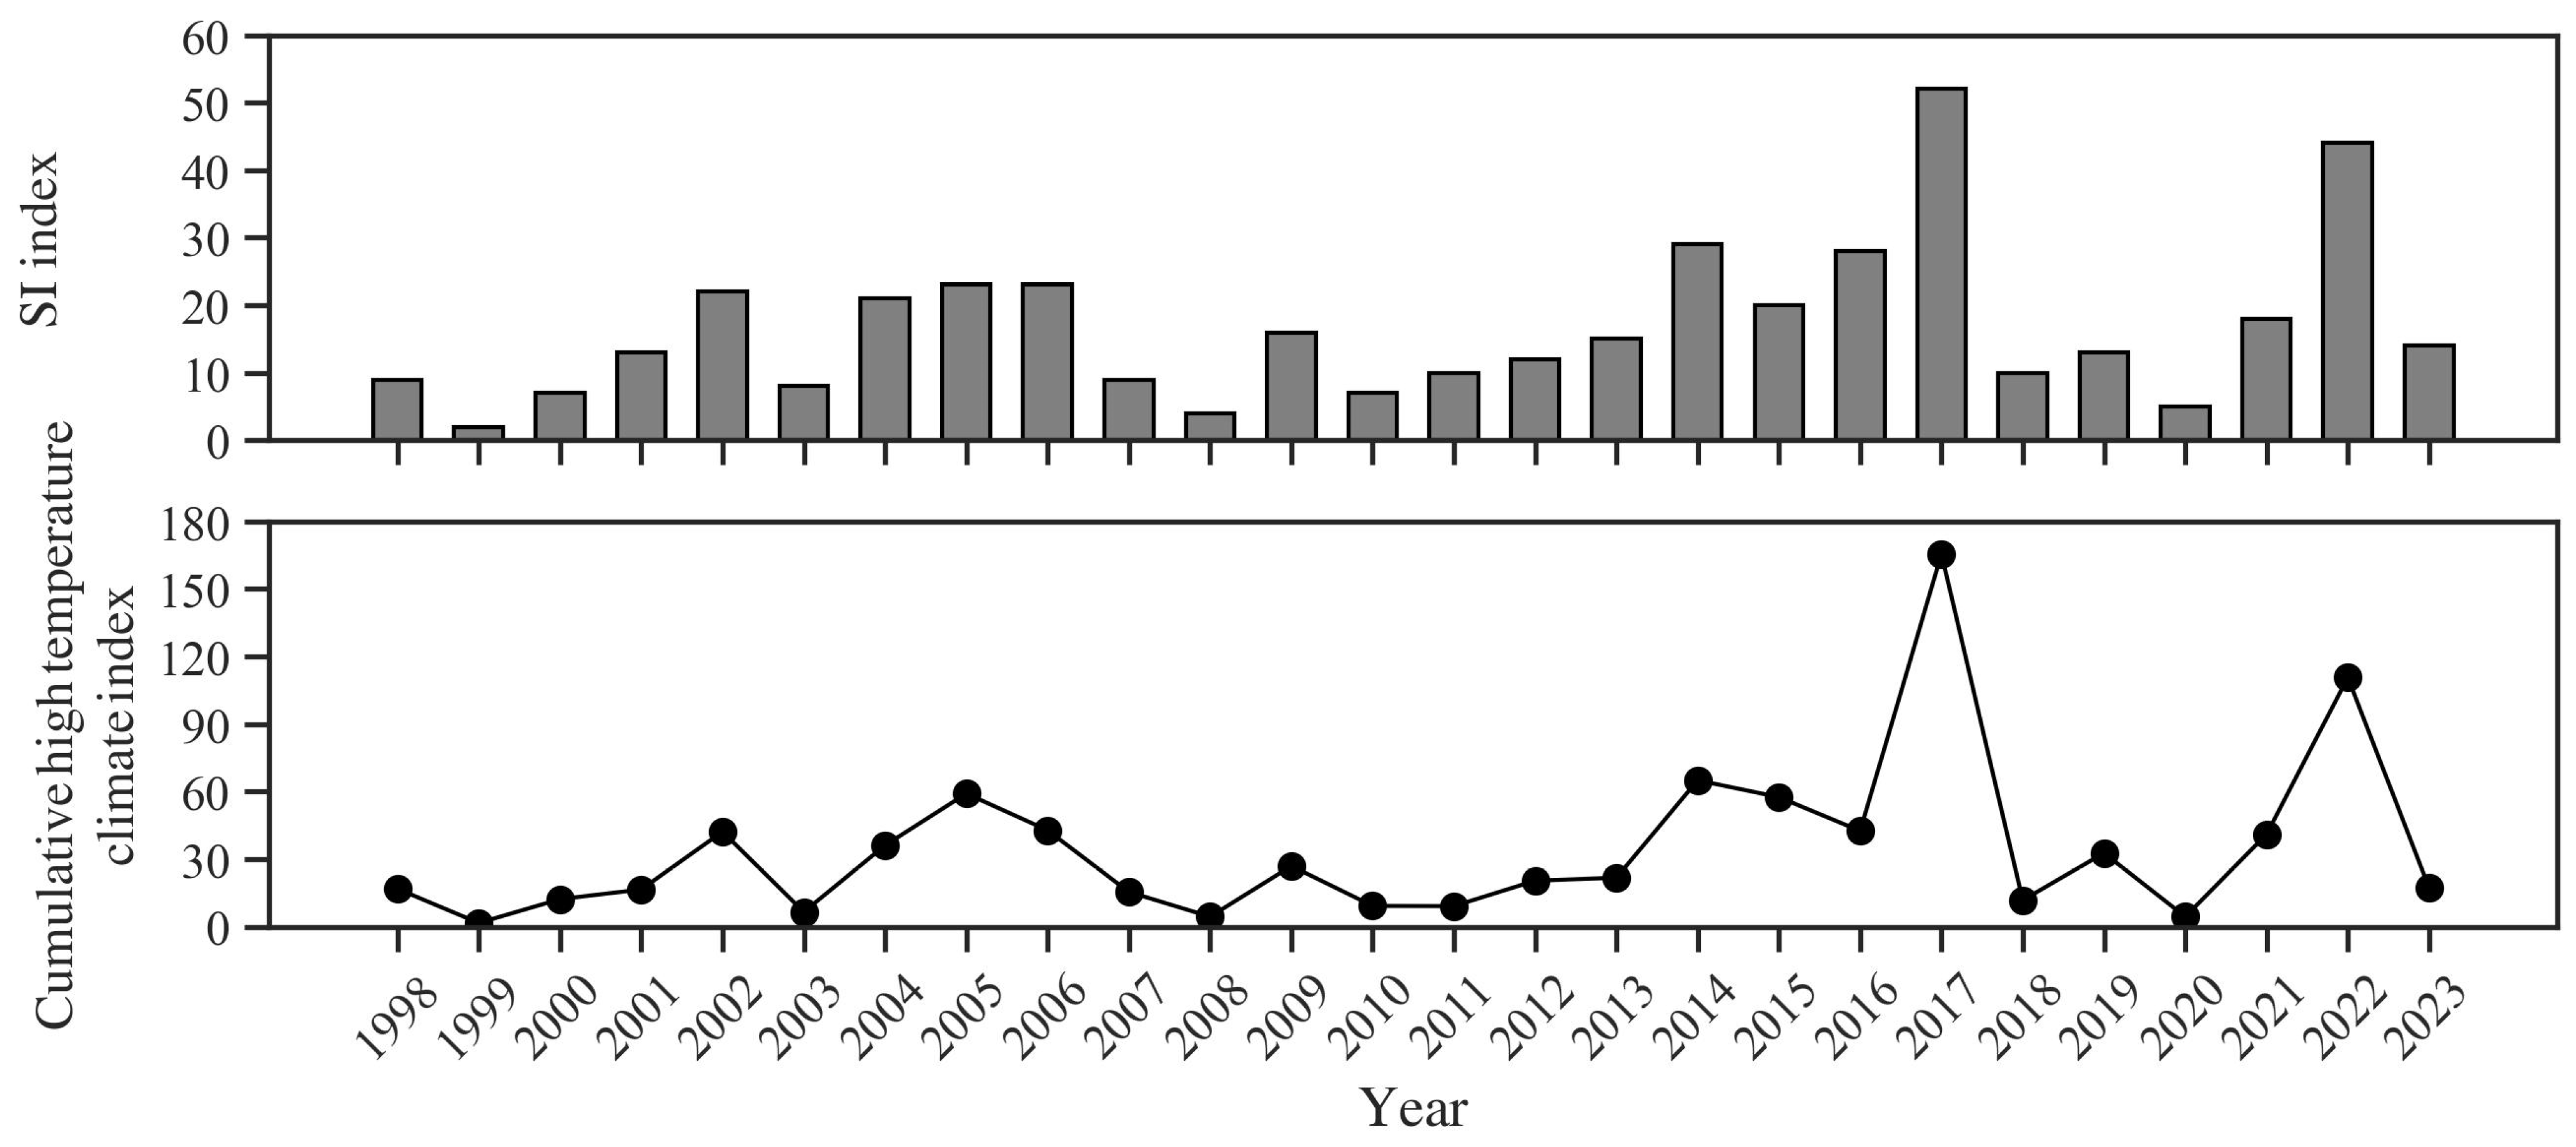
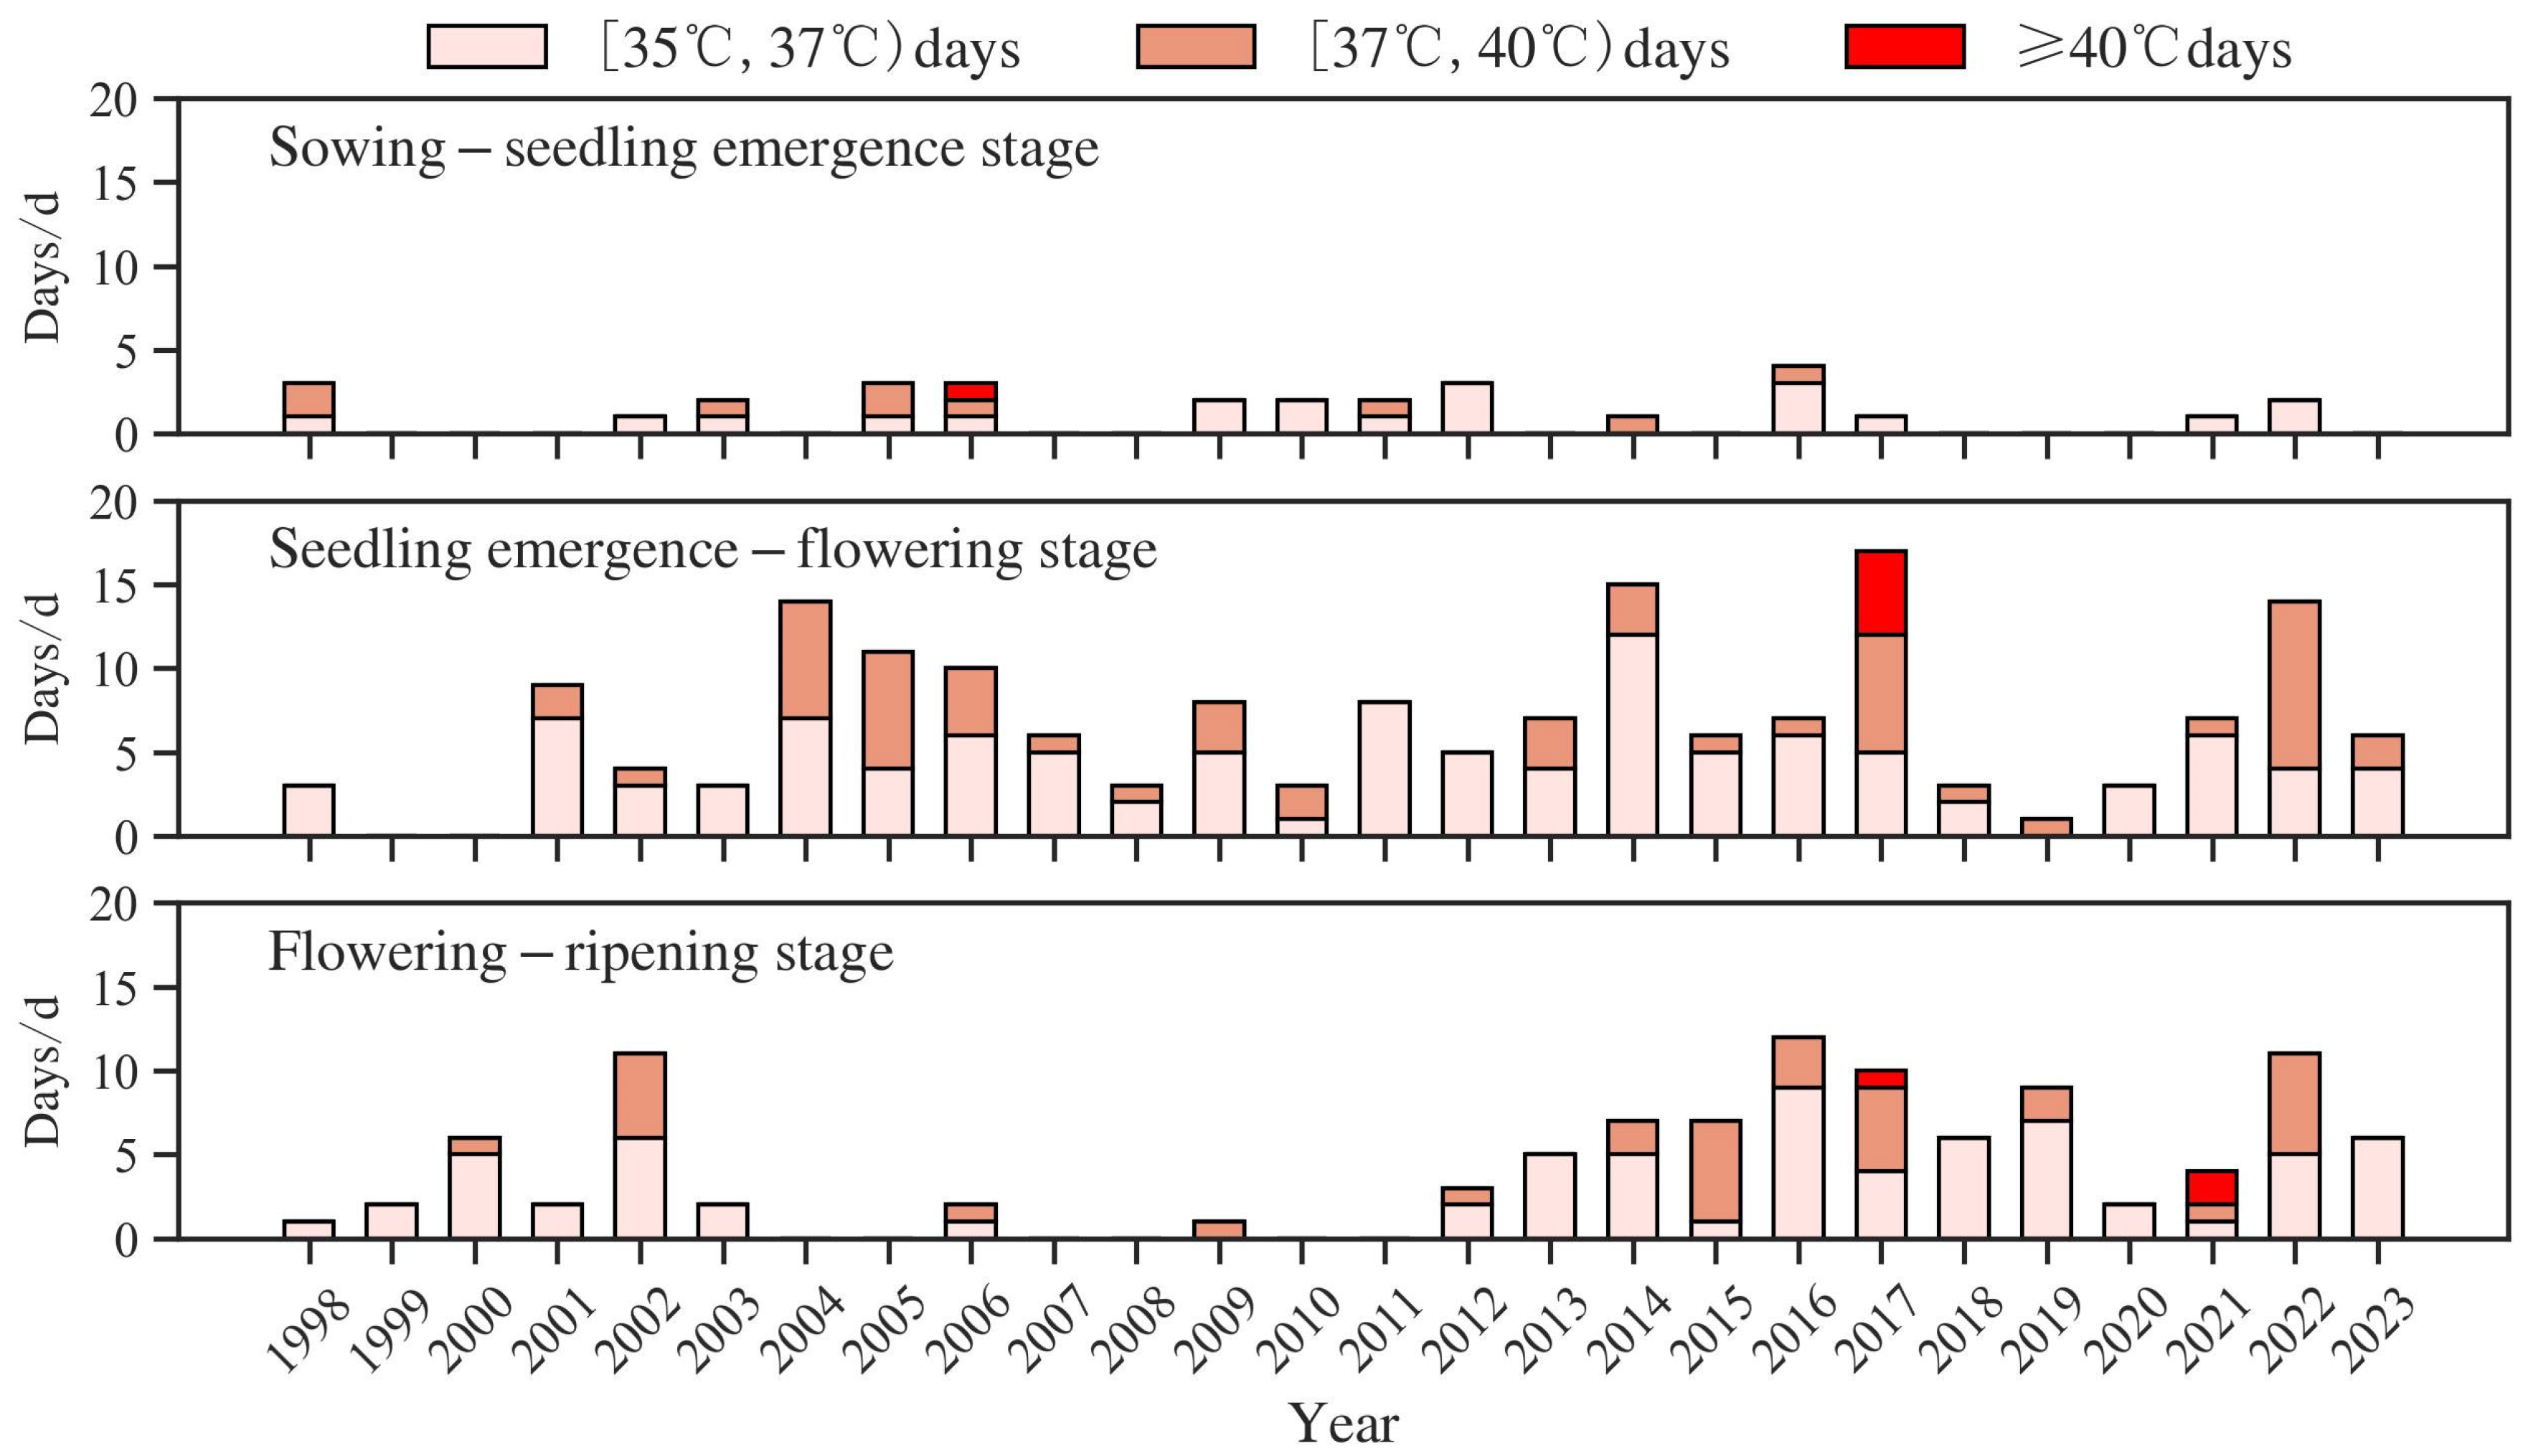
During the 26-year growing season of soybean, there were 314 days of high temperature, with a cumulative duration of high-temperature processes totaling 251 days and 74 occurrences of high-temperature processes. The comprehensive intensity of high temperature was 434, and the cumulative high-temperature climate index was 884. The average number of days with a maximum temperature in the range of [35 °C, 37 °C) was 7.8 days; in the range of [37 °C, 40 °C), it was 3.9 days; and above 40 °C, it was 0.3 days (Figure 2 and Figure 3).
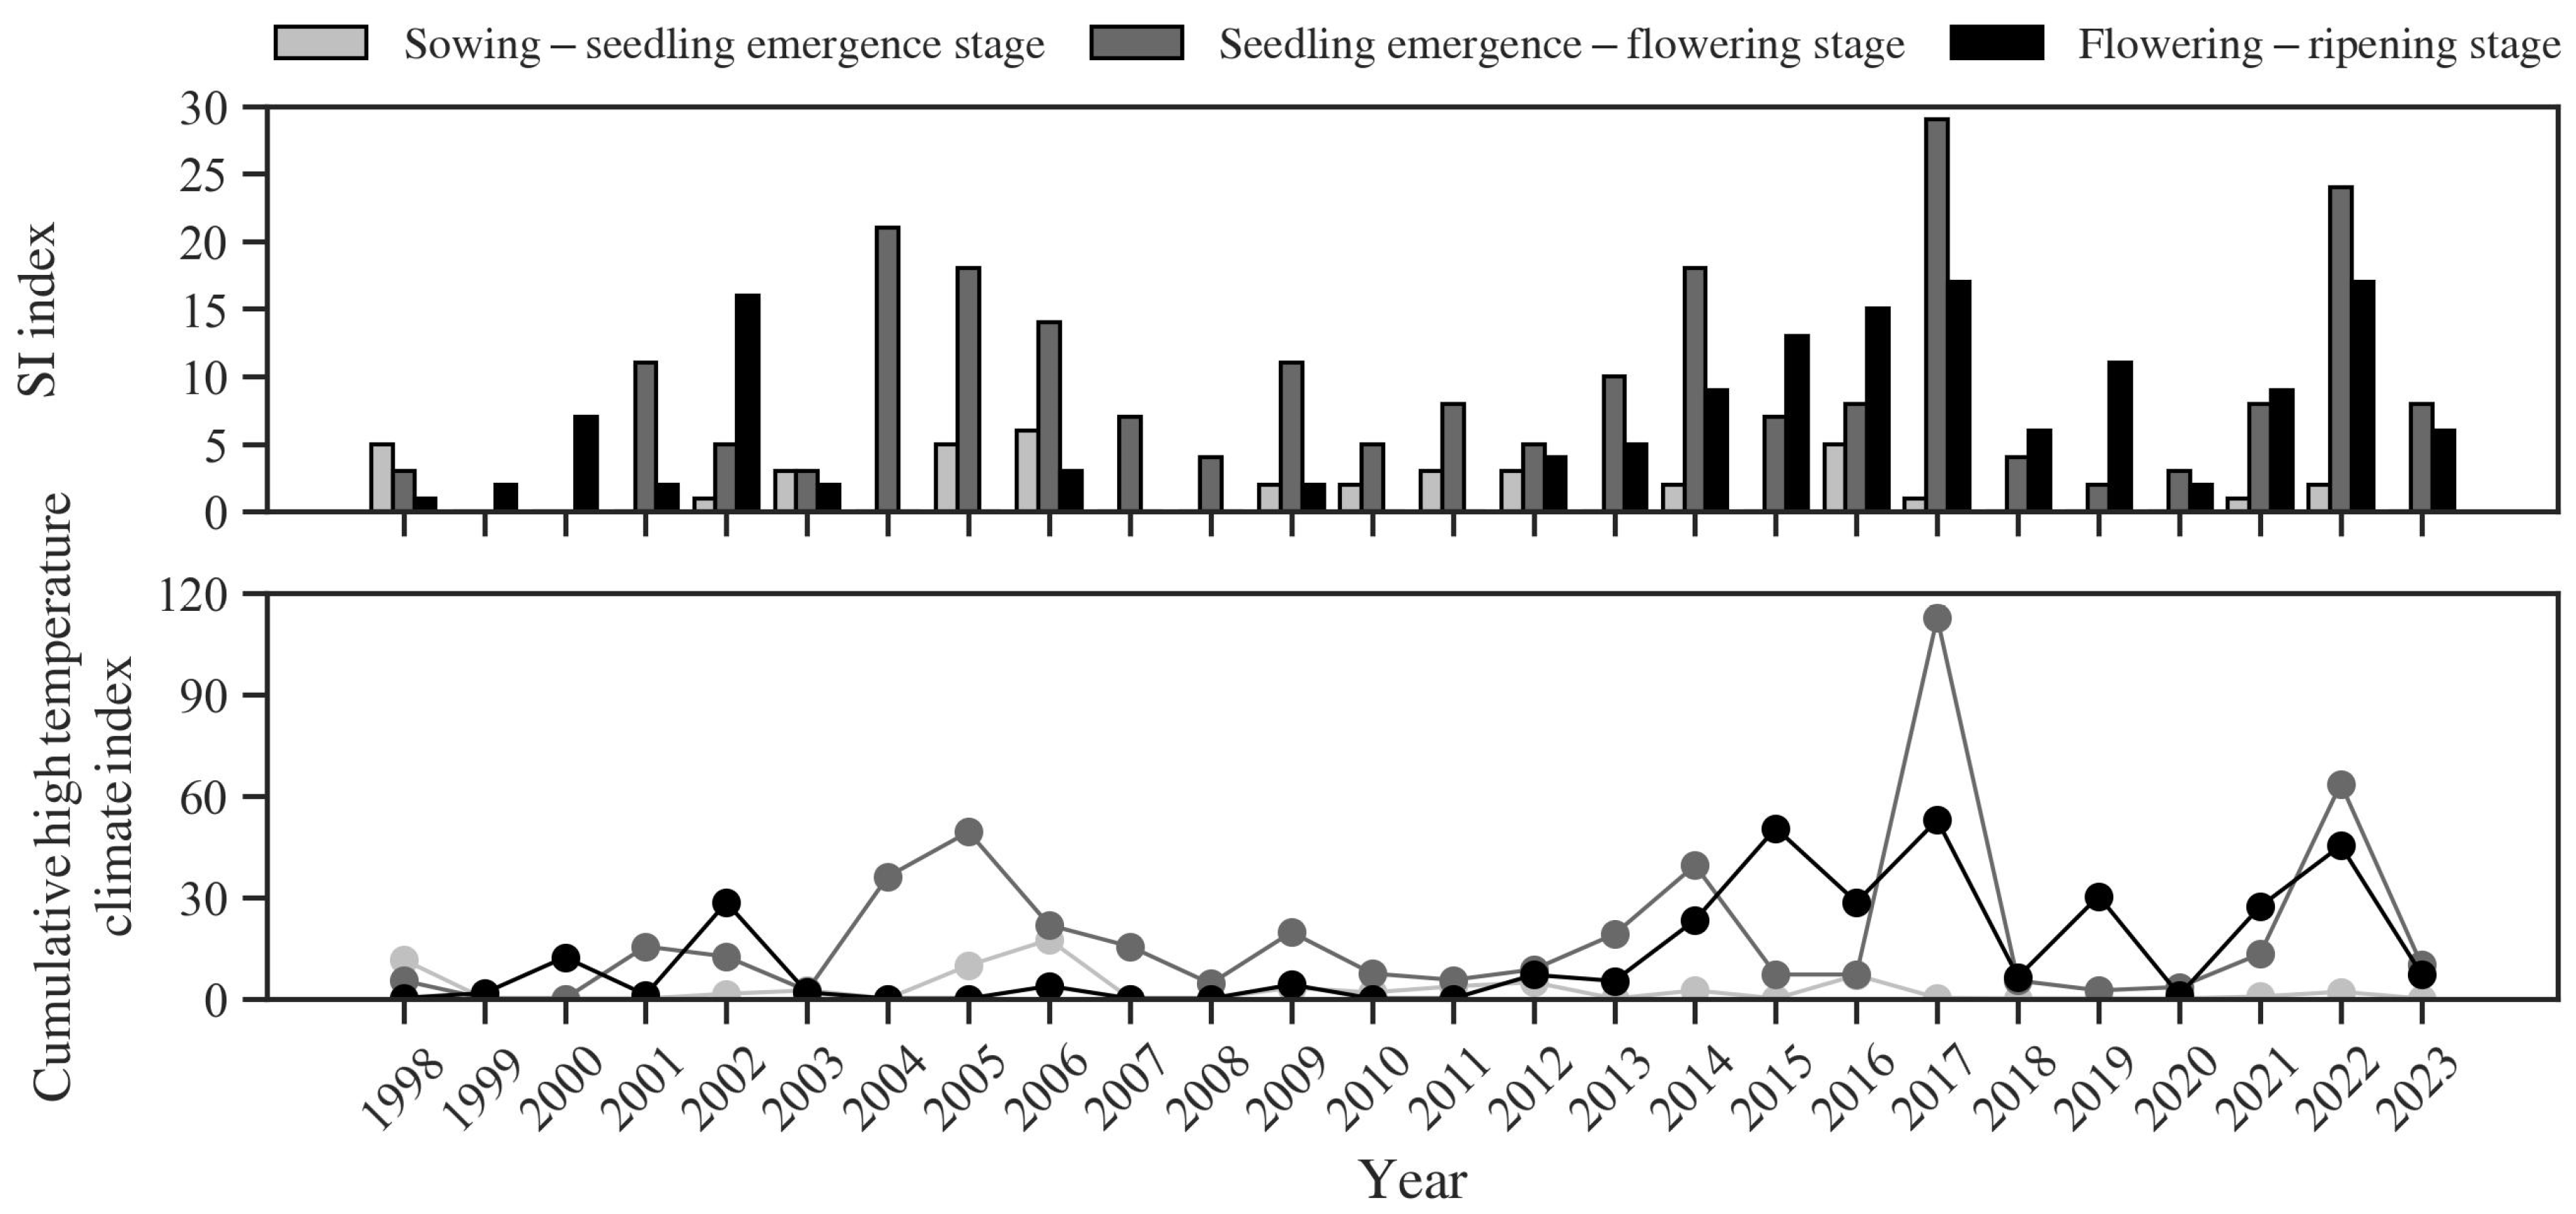
From 1998 to 2023, during the soybean growth period, the annual average high-temperature climate index was 34.2. In 2004, 2007, and 2008, high temperatures occurred only during the seedling emergence to flowering stage, while in 1999 and 2000, high temperatures occurred only during the flowering to ripening stage. The average high-temperature climate index from sowing to seedling emergence was 2.6, with high temperatures occurring in 14 years, lasting 1 to 3 days, and the high-temperature climate index ranging from 0.2 (in 2017) to 17.4 (in 2006), accounting for 3 to 68% of the entire growth period (in 1998).
The average high-temperature climate index from seedling emergence to flowering was 18.7, with high temperatures occurring in 24 years, lasting 2 to 15 days, and the high-temperature climate index ranging from 2.4 (in 2019) to 112.6 (in 2017), accounting for 7 to 93% of the entire growth period (in 2001). The average high-temperature climate index from flowering to ripening was 13.0, with high temperatures occurring in 20 years, lasting 2 to 11 days, and the high-temperature climate index ranging from 0.2 (in 1998) to 52.8 (in 2017), accounting for 1 to 100% of the entire growth period (in 1999 and 2000).
In an annual time series, high temperatures from sowing to seedling emergence showed a decreasing trend, while those from seedling emergence to flowering and from flowering to ripening generally showed an increasing trend, with the annual comprehensive intensity of high temperature, high-temperature process and duration, and cumulative high-temperature climate index during the flowering to ripening stage showing a more noticeable increase (Figure 4).
As illustrated in Figure 5, high-temperature characteristic indices showed significant time series changes: The number of high-temperature days, the comprehensive intensity of high temperature, and the cumulative high-temperature climate index during the soybean growth period generally exhibited an increasing trend, though there were fluctuations between years. The years 2017 and 2022 recorded the highest values in terms of high-temperature days (28 days each), the duration of high-temperature processes (25 days and 27 days, respectively), the number of high-temperature processes (five times and seven times, respectively), the comprehensive intensity of high temperature (52 and 44, respectively), and the cumulative high-temperature climate index during the growth period (165.5 and 110.7, respectively).
The year 2014 ranked third historically in terms of high-temperature days (23 days), the duration of high-temperature processes (20 days), the comprehensive intensity of high temperature (29), and the cumulative high-temperature climate index during the growth period (65), while the years 2005, 2015, and 2016 also had relatively severe high-temperature characteristic indices.

3.1.2. Spatial–Temporal Variations in Characteristics of Drought Processes

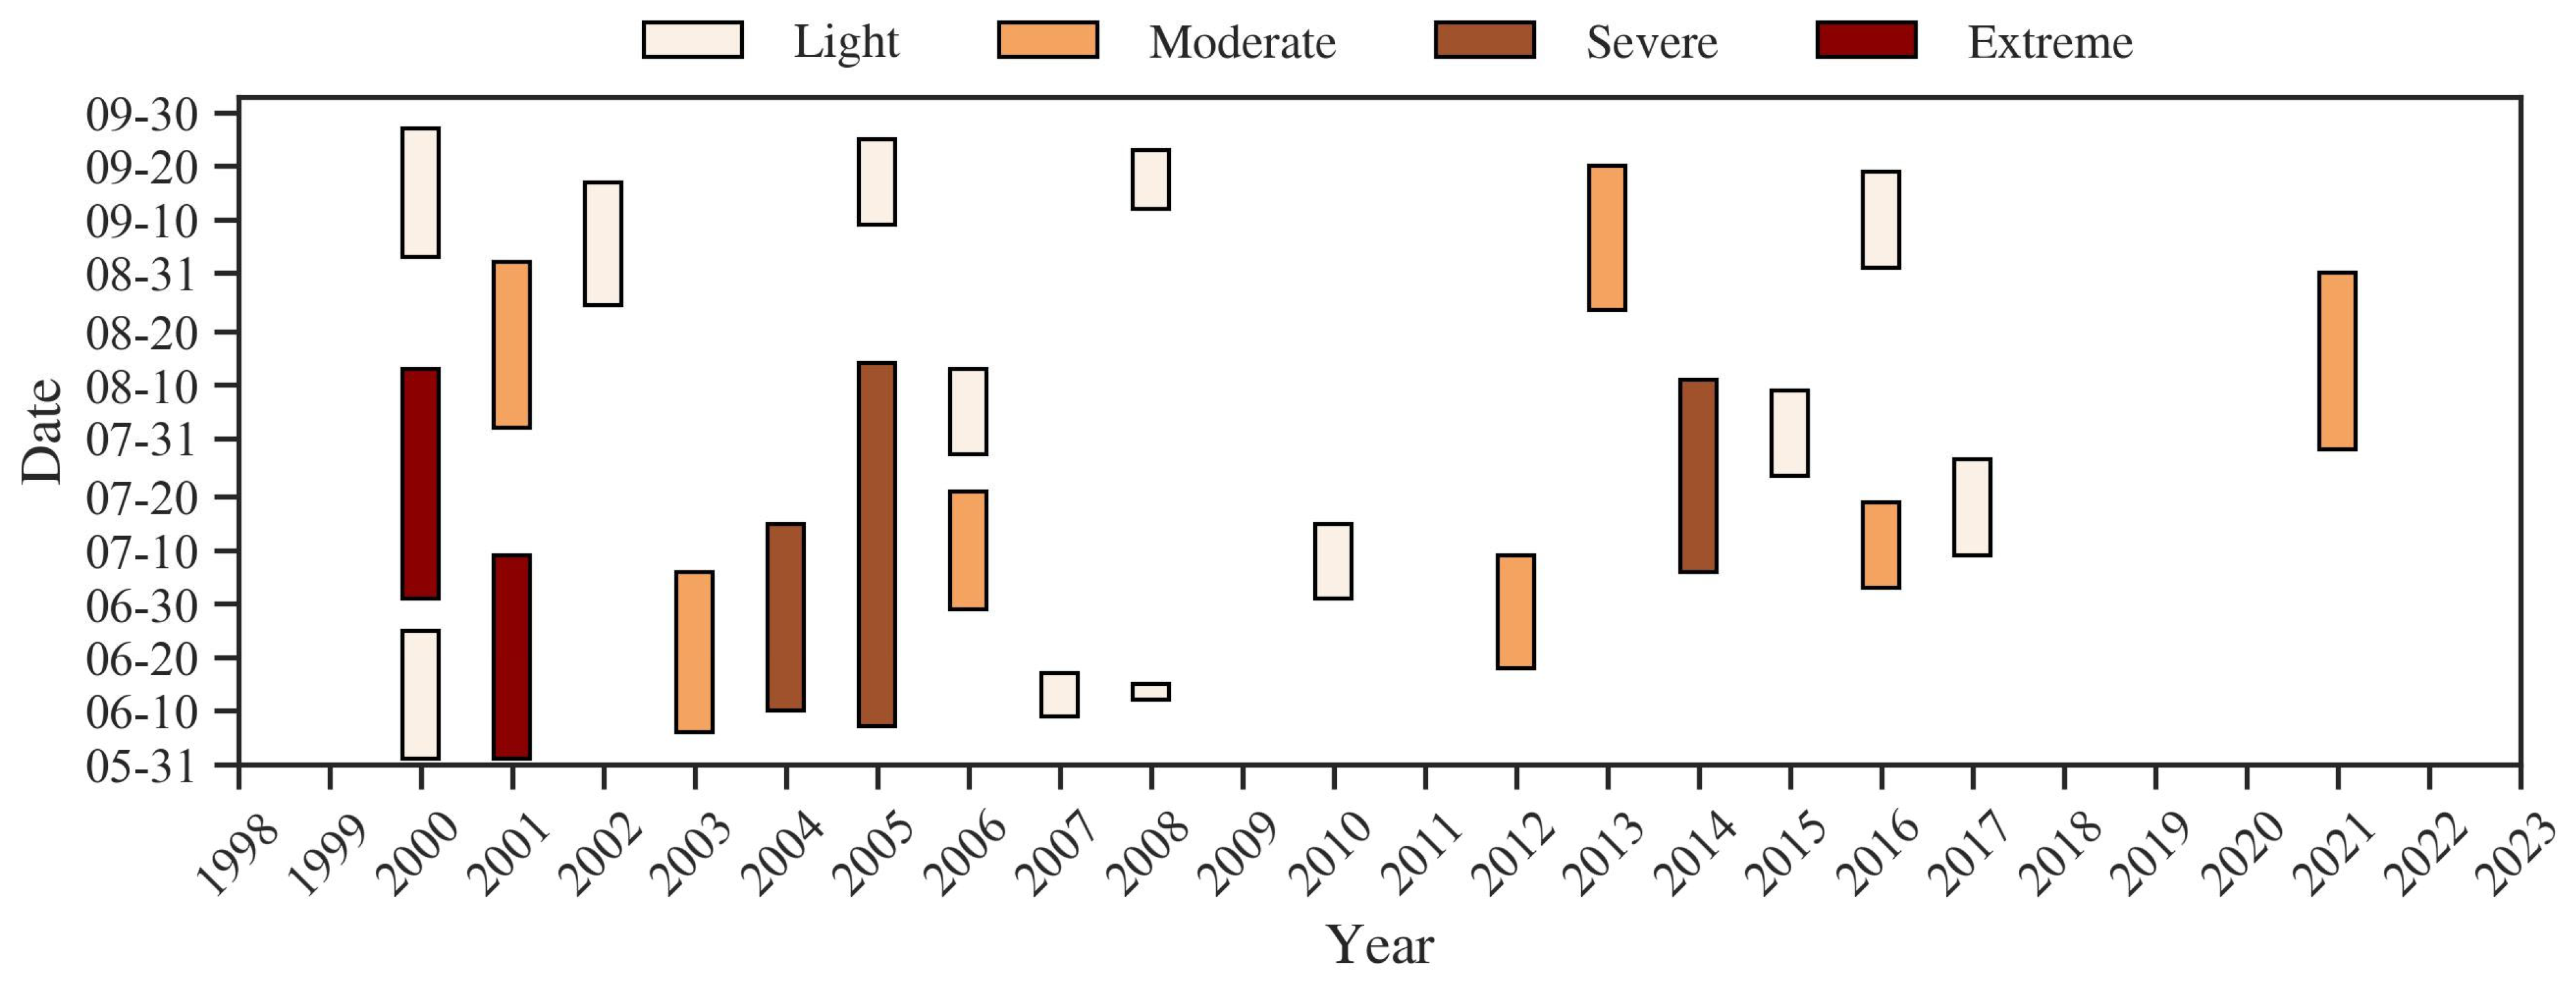
A correlation analysis was conducted to evaluate the impact of the cumulative drought index on soybean agronomic traits. The results revealed significant negative correlations between the cumulative drought index and various agronomic traits, including plant height (r = −0.56), the main stem node number (r = −0.37), the branch number (r = −0.27), pods per plant (r = −0.44), grains per pod (r = −0.40), grains per plant (r = −0.44), 100-grain weight (r = −0.30), and yield per unit (r = −0.40). These findings indicated that drought stress during the growing season significantly and detrimentally affected the agronomic traits of soybeans. The statistical significance of these correlations was confirmed at α levels of 0.25, 0.1, 0.05, and 0.002 with the same sample size of N = 26. The analysis of the drought process during the soybean growth period in each year showed that 17 years (65%) experienced 24 drought processes, with significant differences in drought and its impacts between years. There were no drought processes during the soybean growth period in nine years: 1998, 1999, 2009, 2011, 2018, 2019, 2020, 2022, and 2023. However, the years 2000, 2001, 2005, and 2014 experienced longer durations of drought processes and greater cumulative intensity of drought, severely affecting the agronomic traits and yield of soybean. Annual time series analysis indicated that the process, duration, and cumulative intensity of drought processes during the soybean growth period generally showed a decreasing trend (Figure 6), suggesting a weakening trend in drought intensity.
In terms of the growth and development stages, during the 26-year period, there were eight instances of drought from sowing to seedling emergence, with seven of those years (2000, 2001, 2003, 2004, 2005, 2007, 2012) experiencing drought throughout the entire sowing to seedling emergence stage. During the seedling emergence to flowering stage, there were 13 instances of drought across 12 years. Notably, in 2000, during the 37 days of the seedling emergence to flowering stage, two separate droughts occurred, lasting 18 and 14 days, respectively. In total, during the 26-year period, there were 15 instances of drought during the flowering to ripening stage across 12 years.

3.1.3. Spatial–Temporal Variations in Characteristics of High Temperature Combined with Drought Processes

There were 18 compound disasters of high temperature and drought across 14 years (53.4%). High temperature and drought overlapped three times during the sowing to seedling emergence stage, with the overlapping high-temperature days being 2 days in 2003, 3 days in 2005, and 3 days in 2012. During the seedling emergence to flowering stage, there were nine occurrences, with overlapping high-temperature days as follows: 9 days in 2001, 14 days in 2004, 11 days in 2005, 7 days in 2006, 2 days in 2010, 14 days in 2014, 4 days in 2015, 3 days in 2016, and 12 days in 2017. In the flowering to ripening stage, there were six occurrences, with overlapping high-temperature days as follows: 6 days in 2000 (flowering–podding stage), 4 days in 2002 (2 days in the podding stage and 2 days in the grain-filling stage), 8 days in 2014 (flowering–podding stage), 7 days in 2015 (flowering–podding stage), 5 days in 2017 (flowering–podding stage), and 4 days in 2021 (flowering–podding stage).
It is evident that in the study area, the occurrence of high temperatures combined with drought was significantly more frequent and lasted longer during the seedling emergence to flowering stage compared to the flowering to ripening and sowing to seedling emergence stages. During the flowering to ripening stage of soybean, high temperatures combined with drought were significantly more common during the flowering–podding stage compared to the podding and grain-filling stages.

3.2. Impact Analysis

3.2.1. Impact Analysis of High Temperature

In years with extremely high temperatures, the soybean plant height was reduced by 6.1 to 15 cm, the main stem node number decreased by 0.1 to 2.9, the branch number decreased by 0.2 to 0.6, the number of pods per plant decreased by 4.8 to 13.7, the number of grains per pod decreased by 0.1 to 0.3, the number of grains per plant decreased by 13.5 to 32.6, the grain weight per plant decreased by 3.8 to 6.9 g, and the 100-grain weight decreased by 0.1 to 4.5 g. The main trends observed in extremely high-temperature years were a decrease in pod-setting height, an extension in the number of days from flowering to ripening, and a decrease in yield per unit. In years with severe high temperature, the main trends were a decrease in pod-setting height, an increase in the 100-grain weight, and an increase in yield per unit. In years with moderate high temperature, the trends were a decrease in plant height, pod-setting height, pods per plant, grains per plant, grain weight per plant, and yield per unit.
The impact of high temperature on soybean yield was more closely related to the timing of high temperatures during the phenological stages of soybean. High temperatures occurring during the flowering–podding stage affected yield by reducing the grains per plant and, subsequently, the grain weight per plant. If high temperatures were concentrated before the flowering stage and the high-temperature characteristic index during the flowering to ripening stage was low, the impact on soybean yield for that year would be minimal.
For example, both 2017 and 2022 were years of extremely high temperature. In 2017, soybean flowering occurred on 23 July, and a high-temperature process of over 37 °C lasting 10 days occurred before and after flowering, resulting in two high-temperature processes during the flowering, pollination, and pod-setting stages, reducing the grains per plant by 19.1, the grain weight per plant by 3.9 g, and yield per unit by 315 kg/ha. In contrast, in 2022, soybean flowering occurred on 19 July, and high-temperature processes mainly occurred during the seedling emergence stage, and due to the absence of drought that year, the pod-setting height decreased by 4.5 cm, but the plant height, main stem node number, pods per plant, grains per pod, grains per plant, grain weight per plant, and yield per unit all significantly increased.
The daily high-temperature climate index not only considers the impact of the highest daytime temperature but also accounts for the effects of high nighttime temperature on the respiration and assimilation processes of crops. In the western Guanzhong Plain, periods with daily minimum temperatures exceeding 26 °C occurred in July, coinciding with the soybean flowering stage. Thus, considering the cumulative effect of high temperatures during both day and night more accurately reflects the meteorological disaster characteristics for soybean.
For instance, from 21 July to 26 in 2000, Qishan County experienced a 6-day high-temperature process, with the daily maximum temperature reaching 35.4 to 38.6 °C. During the nights of the 25th and 26th, the daily minimum temperature reached 26.3 to 26.9 °C. In 2022, four high-temperature processes occurred on 23–25 June, 27 June–1 July, 3–4 July, and 6–10 July, with the highest temperature from 6 July to 10 ranging from 37 to 39.8 °C. On 10 July, the minimum temperature reached 26.4 °C, causing slow growth and stunting in soybean during the seedling emergence stage.
An extreme event of continuous high night temperature occurred from 18 July to 27 in 2017 in Qishan County, with a 10-day high-temperature process. The high-temperature intensity was severe, with the daily maximum temperature reaching 37.4 to 40.4 °C. During this period, from 21 July to 24, the minimum night temperature (night temperature) continuously reached 26.7 to 29 °C. The high temperature in the day not only affected the flowering of soybean, but that at night also impacted the normal growth of soybean in the seedling emergence stage, causing serious effects on soybean production during and around the flowering stage.

3.2.2. Impact Analysis of Drought

In 2000, there was one drought process each during the soybean sowing stage, seedling emergence–flowering stage, and flowering–ripening stage, far exceeding other years. The number of drought days during the growth period reached 93 days, with the cumulative drought intensity of the three drought processes reaching 18.67, the highest annual cumulative drought intensity during the soybean growth period recorded. Among these, the number of drought days around the flowering stage reached 44 days, with a cumulative drought intensity of 9.97, the second highest recorded in the region with soybean cultivation observations. That year, the soybean growth period was extended by 10 days, with the sowing to flowering stage extended by 4 days and the flowering to ripening stage extended by 6 days. The plant height decreased by 12.4 cm, the pod-setting height decreased by 1.25 cm, the main stem node number decreased by 1.83, the pods per plant decreased by 11.35, the grains per plant decreased by 25.51, the grain weight per plant decreased by 6.25 g, the 100-grain weight decreased by 2 g, and the yield per unit decreased by 670.7 kg/ha.
In 2001, there was one drought process each during the soybean sowing–seedling emergence stage and podding stage, with the number of drought days reaching 71 days. The cumulative drought intensity of the two processes reached 15.28, making it the year with the second highest cumulative drought intensity during the soybean growth period. Among these, the drought process during the sowing–seedling emergence stage lasted 39 days, with a cumulative intensity of 10.4, the most severe single drought process recorded in the region. A 32-day drought process occurred during the podding stage. The impacts of these two drought processes led to a 3-day extension of the soybean growth period, a 4-day extension of the sowing to flowering stage, a decrease in plant height by 29.9 cm, a decrease in pod-setting height by 3.05 cm, a decrease in the main stem node number by 1.93, a decrease in the branch number by 1.28, a decrease in the number of pods per plant by 4.15, and a reduction in yield per unit by 165.2 kg/ha.
In 2005, there was one drought process each during the soybean sowing to podding stage and the grain-filling to ripening stage. The drought during the sowing to podding stage lasted 68 days, the longest duration of any drought process recorded over the years, but its cumulative intensity was the third highest. The drought process during the grain-filling to ripening stage was significantly weaker than the first one. Under the influence of these two drought processes, the flowering to ripening stage and the overall growth period of soybean that year were extended by 3 days. The plant height decreased by 6.1 cm, the pod-setting height decreased by 2.15 cm, the main stem node number decreased by 0.53, the branch number decreased by 0.48, the number of pods per plant decreased by 13.65, the number of grains per pod decreased by 0.12, the number of grains per plant decreased by 32.61, the grain weight per plant decreased by 6.85 g, and the 100-grain weight decreased by 0.1 g.
In 2014, there was a drought process during the soybean seedling to flowering–podding stage that lasted 37 days. As a result, the flowering to ripening stage was extended by 5 days, the plant height decreased by 15 cm, the pod-setting height decreased by 2.55 cm, the main stem node number decreased by 0.03, the branch number decreased by 0.18, the number of pods per plant decreased by 4.75, the number of grains per pod decreased by 0.12, the number of grains per plant decreased by 13.51, the grain weight per plant decreased by 3.75 g, the 100-grain weight decreased by 1.39 g, and the yield per unit decreased by 285.2 kg/ha.
Droughts during the sowing to seedling emergence stage typically extended the flowering stage by 1 to 7 days, with general trends of decreased plant height, pod-setting height, main stem node number, branch number, pods per plant, grains per pod, grains per plant, grain weight per plant, and 100-grain weight. Droughts during the seedling emergence to flowering stage also led to a general trend of decreased plant height, pod-setting height, main stem node number, branch number, pods per plant, grains per plant, grain weight per plant, and yield per unit, with no significant change in grains per pod and 100-grain weight. Droughts during the flowering to ripening stage resulted in a decrease in plant height by 6.1 to 12.4 cm, a reduction in the main stem node number by 0.5 to 2.9, a decrease in pods per plant by 6 to 13.7, a decrease in grains per plant by 16 to 32.6, a decrease in grain weight per plant by 6 to 6.9 g, and a reduction in 100-grain weight by 0.1 to 4.5 g. This stage was mainly characterized by reduced plant height, pod-setting height, main stem node number, branch number, pods per plant, grains per pod, grains per plant, grain weight per plant, 100-grain weight, and yield per unit.
Overall, the impacts of drought included an extension of the growth period by 3 to 10 days, a decrease in plant height by 6.1 to 29.9 cm, a decrease in pod-setting height by 1.25 to 3.05 cm, a reduction in main stem node number by 0.03 to 1.93, and a decrease in pods per plant by 4.15 to 13.65. However, the grain weight per plant, 100-grain weight, and yield per unit did not necessarily decrease concurrently.

3.2.3. Impact Analysis of High Temperature Combined with Drought

From sowing to seedling emergence, the combined impact of high temperature and drought delayed the seedling emergence by 1 to 5 days, thereby delaying the flowering by 1 to 4 days. The plant height was reduced by 4.5 to 6.1 cm, the branch number decreased by 0.1 to 0.5, and grains per pod decreased by 0.02 to 0.1.
From seedling emergence to flowering, the combined impact of high temperature and drought generally reduced the plant height by 6 to 30 cm, reduced the main stem node number by 0.5 to 4, reduced the branch number by 0.2 to 1.3, reduced pods per plant by 1.4 to 13.7, reduced the grain weight per plant by 0.3 to 6.9 g, reduced the 100-grain weight by 0.1 to 4.5 g, and generally reduced the yield per unit by 165 to 1493 kg/ha.
From flowering to ripening, the combined impact of high temperature and drought generally decreased the main stem node number by 0.1 to 1.8, decreased the branch number by 0.2 to 1.4, decreased the pods per plant by 4.1 to 11.4, decreased the grains per pod by 0.1 to 1.3, decreased the grains per plant by 13.5 to 25.5, decreased the grain weight per plant by 3.8 to 6.3 g, and generally decreased the yield per unit by 88.5 to 670.5 kg/ha.
The common impact of high temperature combined with drought processes in different growth stages was reflected in the reduction in branches by 0.1 to 1.4 and the reduction in grains per pod by 0.02 to 13.7.

4. Discussion

The growth period of soybean is mainly concentrated in summer. In terms of research on the impact of the El Niño Southern Oscillation (ENSO) index and atmospheric circulation factors affecting temperature and precipitation in Shaanxi, previous studies have made corresponding analyses from June to August in Shaanxi. When the ENSO index is high, Shaanxi Province often experiences high-temperature and drought events with less precipitation in summer. Circulation indices affecting the summer temperature include the Western Pacific Subtropical High ridge line, the 850 hPa East Pacific trade wind index, the Niño 4 region sea surface temperature anomaly index, and the 200 hPa zonal wind index over the equatorial central eastern Pacific. Circulation indices affecting the summer precipitation include the 850 hPa Western Pacific trade wind index, the Southern Oscillation Index, the Niño 3.4 region sea surface temperature anomaly index, and the multivariate ENSO index [31].
Other researchers have also conducted extensive research. Shen et al. [32] believe that the key oceanic area affecting precipitation changes in Shaanxi Province is the equatorial Pacific. When the central equatorial Pacific sea temperature anomaly is high, precipitation in Guanzhong and southern Shaanxi decreases, and when the eastern equatorial Pacific sea temperature anomaly is high, the decrease in precipitation in northern Shaanxi is more pronounced. Liu [33] maintains that El Niño events generally result in less precipitation in Shaanxi during summer and autumn. This is consistent with the mechanism and conclusions of drought characteristics studied in this paper. However, the causes of drought during the soybean growth period are complex and not solely affected by El Niño events and atmospheric circulation factors, but also by local terrain, evapotranspiration, and irrigation conditions, so the analysis of drought characteristics may be influenced by uncertainties from other factors.
Temperature and precipitation are the main meteorological factors for estimating soybean yield per unit, but there is currently a lack of quantitative understanding of the impact of high-temperature and drought processes on soybean traits and yield. This paper analyzed the impact range of different grades of high temperature and drought on soybean agronomic traits and yield. This provides foundational research data for constructing numerical or statistical models based on historical meteorological and soybean yield data, simulating the impact of high-temperature and drought events on soybean yield. Research on the impact of different types of high-temperature years and drought processes on soybean also lays the groundwork for establishing threshold models for the impact of high temperature and drought on yield, helping to improve soybean yield prediction models based on meteorological indicators.
This study incorporated relevant content into the Section 4: quantitatively analyzing the effects of temperature and precipitation on crop yield is particularly crucial for using meteorological factors in crop yield monitoring, early warning, and field management [34,35,36,37,38,39]. This study provides scientific support for quantitative assessments of the effects of high-temperature and drought disasters on soybean production, aiming to supplement and improve the mechanisms of the yield prediction model based on temperature, precipitation, and sunshine duration during the soybean growth period [40]. Given the meteorological challenges posed by extreme temperature and water scarcity, identifying effective agricultural management strategies becomes paramount. These strategies may include optimizing irrigation practices, implementing shading techniques, and selecting soybean varieties that are more resilient to adverse weather conditions. Such measures are essential for enhancing the adaptability and sustainability of soybean cultivation in the face of climate variability [41].

5. Conclusions

The following conclusions were obtained:
High temperatures occurred every year during the soybean growth period. The duration of high-temperature days, the comprehensive intensity of high temperature, and the cumulative high-temperature climatic index were generally on the rise, with the high-temperature characteristic index far exceeding the drought index. High temperatures significantly impacted soybean yield, most notably during the flowering–podding stage, where high temperatures reduced the grains per plant, thereby affecting the grain weight per plant and, consequently, the yield.
There was a considerable variation in the impact of drought across different years. During the soybean growth period, the process, duration, and cumulative intensity of droughts generally decreased. Compared to the impact of high temperature, the consistent effect of drought was manifested in extending the soybean growth period, reducing the plant height, and decreasing the pod-setting height.
About half of the years experienced compound disasters of high temperature and drought, occurring more frequently and for more extended periods from seedling emergence to flowering than from flowering to ripening or from sowing to seedling emergence. The occurrences of high temperature combined with drought during the flowering–podding stage were significantly more than during the podding stage and grain-filling stage. The common impact of high temperature combined with drought processes in different growth stages was reflected in the reduction in branches and grains per pod.
In conclusion, the detrimental effects of high temperature and drought on soybean production are significant and cannot be ignored. However, implementing suitable management strategies and cultivating varieties that are heat-tolerant and drought-resistant can effectively mitigate these risks, thereby improving both soybean yield and quality. Nevertheless, this study is limited by its focus on the yield data of a single soybean variety within the research area, lacking a comparative analysis for the impact of soybean yield across multiple varieties under the specific local meteorological conditions. Additionally, the uncertainty of future climate change may present conditions that exceed current characteristics. Future research should focus on the advancement of real-time monitoring for crop growth and development traits, the early warning and assessment of extreme weather events, the breeding of more resilient varieties, the optimization of irrigation systems, and the improvement of soybean production to better adapt to climate change.

Author Contributions

Conceptualization, M.L. and Y.L.; methodology, M.L. and Y.P.; visualization, X.Z.; formal analysis, K.X.; data curation, Y.Q.; writing—original draft preparation, M.L.; supervision, H.L. All authors have read and agreed to the published version of the manuscript.

Funding

This research were funded by the “Key Research and Development Program of Shaanxi province in China, grant number 2023-ZDLNY-10”and Natural Science Basic Research Program of Shaanxi, grant number 2024JC-YBMS-238).

Institutional Review Board Statement

Not applicable.

Informed Consent Statement

Not applicable.

Data Availability Statement

The data presented in this study are available on request from the corresponding author. The data are not publicly available due to internal policy of Baoji institute of agricultural science institution.

Conflicts of Interest

The authors declare no conflicts of interest.

References

  1. Jägermeyr, J.; Müller, C.; Ruane, A.C.; Elliott, J.; Balkovic, J.; Castillo, O.; Faye, B.; Foster, I.; Folberth, C.; Franke, J.A.; et al. Climate impacts on global agriculture emerge earlier in new generation of climate and crop models. Nat. Food 2021, 2, 873–885. [Google Scholar] [CrossRef]
  2. Kern, A.; Barcza, Z.; Marjanović, H.; Árendás, T.; Fodor, N.; Bónis, P.; Bognár, P.; Lichtenberger, J. Statistical modelling of crop yield in Central Europe using climate data and remote sensing vegetation indices. Agric. For. Meteorol. 2018, 260, 300–320. [Google Scholar] [CrossRef]
  3. Cai, Y.; Guan, K.; Lobell, D.; Potgieter, A.B.; Wang, S.; Peng, J.; Xu, T.; Asseng, S.; Zhang, A.; You, L.; et al. Integrating satellite and climate data to predict wheat yield in Australia using machine learning approaches. Agric. For. Meteorol. 2019, 274, 144–159. [Google Scholar] [CrossRef]
  4. dos Santos, C.A.C.; Neale, C.M.U.; Mekonnen, M.M.; Gonalves, I.Z.; de Oliveira, G.; Ruiz-Alvarez, O.; Safa, B.; Rowe, C.M. Trends of extreme air temperature and precipitation and their impact on corn and soybean yields in Nebraska, USA. Theor. Appl. Climatol. 2022, 147, 1379–1399. [Google Scholar] [CrossRef]
  5. Xu, C.; Xia, C.; Xia, Z.; Zhou, X.; Huang, J.; Huang, Z.; Liu, Y.; Jiang, Y.; Casteel, S.; Zhang, C. Physiological and transcriptomic responses of reproductive stage soybean to drought stress. Plant Cell Rep. 2018, 37, 1611–1624. [Google Scholar] [CrossRef] [PubMed]
  6. Sun, X.; Liu, M.J.; Yang, M.Y.; Lu, J.; Du, J.B.; Shu, K.; Wang, X.C.; Yang, W.Y. Implications of terminal oxidases in the regulation of soybean photosynthetic performance under different lightintensities. Acta Physiol. Plant. 2017, 39, 266. [Google Scholar] [CrossRef]
  7. Tian, Z.H.; Chen, X.Z.; Xie, H.; Qing, Q. The initial study of the relationship between meteorological factors and agronomic characters of soybean in Beijing area. Chin. J. Eco-Agric. 2003, 11, 15–17. [Google Scholar]
  8. Ding, Z.L. Effects of climate factors on qualilty of soybean. Acta Agron. Sin. 1965, 4, 313–320. [Google Scholar]
  9. Quansah, J.E.; Welikhe, P.; El Afandi, G.; Fall, S.; Mortley, D.; Ankumah, R. CROPGRO-Soybean Model Calibration and Assessment of Soybean Yield Responses to Climate Change. Am. J. Clim. Chang. 2020, 9, 297–316. [Google Scholar] [CrossRef]
  10. Mo, K.C.; Lettenmaier, D.P. Heat wave flash droughts in decline. Geophys. Res. Lett. 2015, 42, 2823–2829. [Google Scholar] [CrossRef]
  11. Otkin, J.A.; Svoboda, M.; Hunt, E.D.; Ford, T.W.; Anderson, M.C.; Hain, C.; Basara, J.B. Flash droughts: A review and assessment of the challenges imposed by rapid-onset droughts in the United States. Bull. Am. Meteorol. Soc. 2018, 99, 911–919. [Google Scholar] [CrossRef]
  12. Wang, J.X.; Yang, M.X.; Deng, D.S. The cause of soybean over-green growth and useless pods and the way of prevention. J. Henan Agric. Sci. 1982, 9, 20. [Google Scholar]
  13. Zhang, S.J.; Hou, L.X. Study on the cause mechanism for pods without peas in soybean under drought stress. Acta Agric. Boreali-Sin. 2005, 20, 61–63. [Google Scholar]
  14. Xiao, J.H.; Wei, L.; Liu, B.; Duan, X.Y.; Yang, H.F. Analysis on the cause of greenness symptoms phenomenon of summer soybean in Southern Shanxi. J. Shanxi Agric. Sci. 2020, 48, 1305–1308, 1312. [Google Scholar]
  15. Li, Y.Q.; Wang, Y.X. Causes and countermeasures for reluctant ripen and few pods of soybean in Wuyang County in 2010. Mod. Agric. Sci. Technol. 2012, 1, 117–118. [Google Scholar]
  16. Lei, Q.K.; Guo, J.Q.; Yang, X.L.; Ma, W. The causes and precautions of summer soybean pods without peas in western Henan. Shaanxi J. Agric. Sci. 2010, 2, 103–116. [Google Scholar]
  17. Li, W.; Gao, Y.; Hu, Y.; Chen, J.; Zhang, J.; Shi, S. Field Cage Assessment of Feeding Damage by Riptortus pedestris on Soybeans in China. Insects 2021, 12, 255. [Google Scholar] [CrossRef]
  18. Li, Y.P.; Gu, S. Causes and countermeasures of pod and no seed in soybean. Prim. Agric. Technol. Ext. 2015, 11, 80–81. [Google Scholar]
  19. Yin, S.P.; Zhu, H.X.; Zhao, H.Y.; Sun, A.H.; Gong, L.J.; Li, B.C.; Li, X.F.; Jiang, L.X. Breeding traits and yield factors of soybean:Response to soil with different drought grades. Chin. Agric. Sci. Bull. 2020, 36, 111–117. [Google Scholar]
  20. Zhang, H.M.; Liu, J.P.; Lu, X.P.; Zhang, X.J. Incidence and preventive measures of summer soybean staygreen syndrome in Luoyang, Henan in 2018. China Plant Prot. 2019, 39, 57–59. [Google Scholar]
  21. Mo, X.S.; Liang, J.M.; Li, D.X.; Liang, F.X.; Zhang, M.J.; Liu, M.J.; Xiao, J.P.; Zhang, P. Exploring the Causes and Precautions of Soybean Staygreen Syndrome in Huang-Huai-Hai Regions. Soybean Sci. 2019, 38, 770–778. [Google Scholar]
  22. Wang, D.G.; Yu, G.Y.; Chen, S.N.; Li, J.K.; Wu, Q.; Hu, G.Y.; Huang, Z.P. Research Progress on Comprehensive Hazard Factors of Soybean Staygreen Syndrome. Soybean Sci. 2021, 40, 708–714. [Google Scholar]
  23. Liu, L.J.; Lin, H.; Tang, X.F.; Pu, G.F. Drought Stress Influence Soybean Yield Morphogenesis in Different Growth Stages. Soybean Sci. 2011, 30, 405–412. [Google Scholar]
  24. Guo, S.J.; Yang, K.M.; Huo, J.; Zhou, Y.H.; Wang, G.P.; Li, G.Q. Influence of drought on leaf photosynthetic capacity and root growth of soybeans at grain filling stage. Chin. J. Appl. Ecol. 2015, 26, 1419–1425. [Google Scholar]
  25. Wang, B.Q.; Zhang, L.F.; Ci, D.W.; Li, W.; Xu, R. Multiple Regresion and Path Analysis between Agronomic Traits and Yield of Summer Sowing Soybean (Glycine max L. Merr.) in Huanghuai River Region. Soybean Sci. 2010, 29, 255–259. [Google Scholar]
  26. Qu, Y.; Wang, K.Z.; Liu, Y.; Kang, J.K.; Liu, Y.B.; Liang, F.Q. Soybean Yield in the Western Guan-Zhong Areas: The Response to Climatic Ecological Condition. J. Agric. 2020, 10, 71–76. [Google Scholar]
  27. Qu, Y.; Ma, W.; Wang, K.Z.; Zhu, F.; Zhang, H.F.; Yang, H.; Liang, F.Q. Effects of Sowing Date on Agronomic Traits, Yield, and Quality of Soybean in the Western Area of Guanzhong. Soybean Sci. 2022, 41, 696–702. [Google Scholar]
  28. QX/T 228-2014; Classification of Regional High Temperature Weather Process. 1st ed. China Meteorological Press: Beijing, China, 2015.
  29. QX/T 597-2021; Monitoring and Evaluation Methods for Regional Drought Processes. 1st ed. China Meteorological Press: Beijing, China, 2021.
  30. Liao, Y.M.; Zhang, C.J. Spatio-Temporal Distribution Characteristics and Disaster Change of Drought in China Based on Meteorological Drought Composite Index. Meteorol. Mon. 2017, 43, 1402–1409. [Google Scholar]
  31. Li, M.; Guo, J.; He, J.; Xu, C.; Li, J.; Mi, C.; Tao, S. Possible impact of climate change on apple yield in Northwest China. Theor. Appl. Climatol. 2020, 139, 191–203. [Google Scholar] [CrossRef]
  32. Shen, Y.C.; Li, S.S.; Yan, J.P.; Wu, Y.Q.; Wang, C.B. Spatiotemporal climate variation and its influencing factors in Shaanxi Province based on extreme-point symmetric mode decomposition. Arid Land Geogr. 2021, 44, 36–46. [Google Scholar]
  33. Liu, J.J. Analysis of spatiotemporal characteristics of precipitation in the summer and autumn seasons of Shaanxi during the El Ni ñ o year. Agric. Mach. Agron. 2021, 1, 82–84. [Google Scholar]
  34. Eulenstein, F.; Lana, M.; Schlindwein, S.; Sheudzhen, A.; Tauschke, M.; Behrend, A.; Guevara, E.; Meira, S. Trends of soybean yields under climate change scenarios. Horticulturae 2016, 3, 10. [Google Scholar] [CrossRef]
  35. Guo, S.; Guo, E.; Zhang, Z.; Dong, M.; Wang, X.; Fu, Z.; Guan, K.; Zhang, W.; Zhang, W.; Zhao, J.; et al. Impacts of mean climate and extreme climate indices on soybean yield and yield components in Northeast China. Sci. Total Environ. 2022, 838, 156284. [Google Scholar] [CrossRef]
  36. Guo, S.; Yang, X.; Zhang, Z.; Zhang, F.; Liu, T. Spatial distribution and temporal trend characteristics of agroclimatic resources and extreme climate events during the soybean growing season in Northeast China from 1981 to 2017. J. Meteorol. Res. 2021, 34, 1309–1323. [Google Scholar] [CrossRef]
  37. Li, S.; You, S.; Song, Z.; Zhang, L. Impacts of climate and environmental change on bean cultivation in China. Atmosphere 2021, 12, 1591. [Google Scholar] [CrossRef]
  38. Wang, C.; Linderholm, H.W.; Song, Y.; Wang, F.; Liu, Y.; Tian, J.; Xu, J.; Song, Y.; Ren, G. Impacts of drought on maize and soybean production in Northeast China during the past five decades. Int. J. Environ. Res. Public Health 2020, 17, 2459. [Google Scholar] [CrossRef]
  39. Xu, Y.; Chou, J.; Yang, F.; Sun, M.; Zhao, W.; Li, J. Assessing the sensitivity of main crop yields to climate change impacts in China. Atmosphere 2021, 12, 172. [Google Scholar] [CrossRef]
  40. Li, Q.C.; Xu, S.W.; Zhuang, J.Y.; Liu, J.J.; Zhou, Y.; Zhang, Z.X. Ensemble learning prediction of soybean yields in China based on meteorological data. J. Integr. Agric. 2023, 22, 1909–1927. [Google Scholar] [CrossRef]
  41. Wang, H.Z.; Tang, H.Y.; Niu, D.; Lv, M. Study on Meteorological Forecasting Method of Key Quality Components in Soybean. Soybean Sci. 2021, 40, 112–121. [Google Scholar]
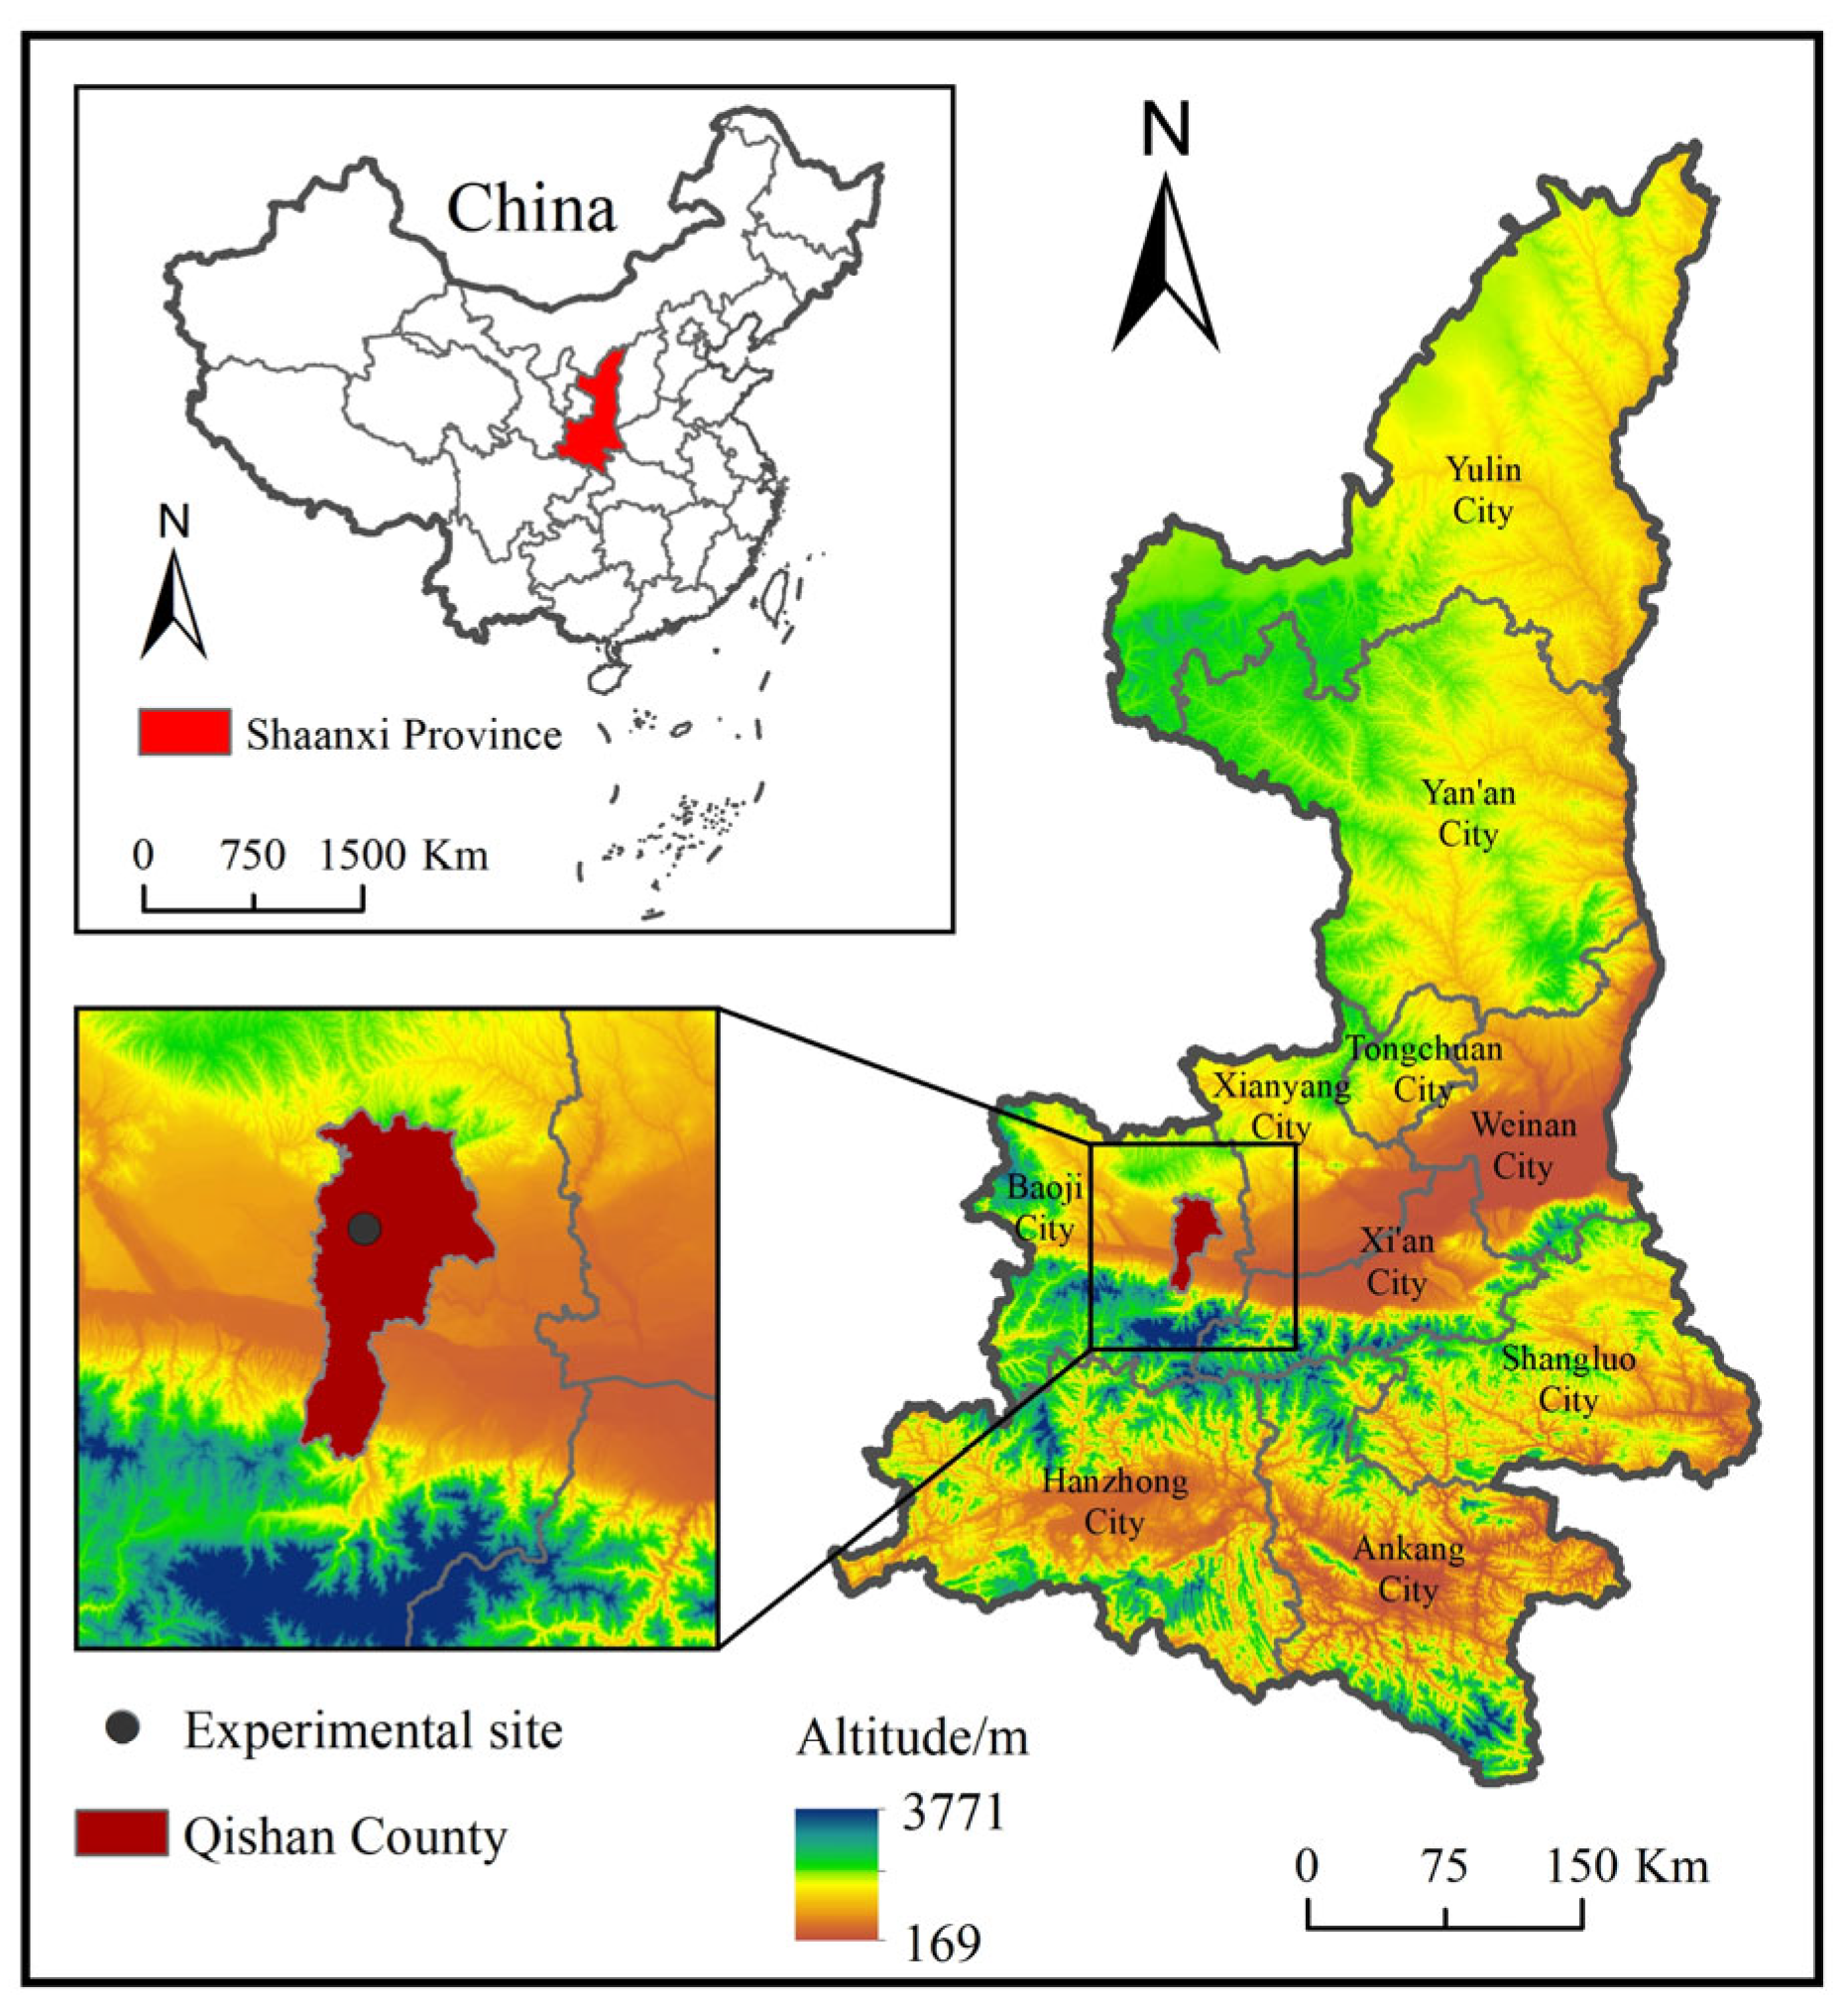
Figure 1. Overview of the study area.
Atmosphere 15 00392 g001
Figure 2. Inter-annual variation in different high-temperature days from 1998 to 2023.
Atmosphere 15 00392 g002
Figure 3. Inter-annual variation in SI values and cumulative high-temperature climate indices from 1998 to 2023.
Atmosphere 15 00392 g003
Figure 4. Inter-annual variation in different high-temperature days during the soybean growth and development stages from 1998 to 2023.
Atmosphere 15 00392 g004
Figure 5. Inter-annual variation in SI values and cumulative high-temperature climate indices during the soybean growth and development stages from 1998 to 2023.
Atmosphere 15 00392 g005
Figure 6. Start and end dates of annual drought processes and cumulative drought intensities from 1998 to 2023.
Atmosphere 15 00392 g006
Table 1. Methods for determining the comprehensive intensity grades for high temperatures.
GkValue Conditions
Gk = 1More than 95% percentiles
Gk = 2[85%, 95%)
Gk = 3[60%, 85%)
Gk = 4Below 60%
Gk = 5Without high temperature
Disclaimer/Publisher’s Note: The statements, opinions and data contained in all publications are solely those of the individual author(s) and contributor(s) and not of MDPI and/or the editor(s). MDPI and/or the editor(s) disclaim responsibility for any injury to people or property resulting from any ideas, methods, instructions or products referred to in the content.